
Abstract
Background and Aims:
Individual responses to lifestyle factors, including physical activity, carbohydrate intake, and sleep, significantly affect 2 h glucose levels in people with type 2 diabetes (T2D). The substantial variation between individuals highlights the need for personal predictive tools. This study aimed to develop a mathematical model that quantifies the relationship between these key lifestyle factors and glucose levels and to evaluate the performance of different statistical modeling methodologies to achieve accurate, personal prediction.
Methods:
Data encompassing lifestyle factors and continuous glucose monitoring from 38 T2D participants were used. We initially employed a frequentist multilevel regression model to derive population estimates and individual random effects. These results were subsequently used to establish informed priors for a personal Bayesian model. Model performance, measured by the root mean squared error (RMSE) and mean difference, was compared against the population frequentist model and a personal Bayesian model initialized with weakly informative priors.
Results:
The personal Bayesian model utilizing informed priors exhibited better predictive accuracy. Specifically, the RMSE was significantly improved when compared against both the initial frequentist model and the personal model using weakly informative priors. Furthermore, substantial RMSE improvements were observed in several individuals, validating the efficacy of integrating population-level data to personalize subsequent modeling efforts.
Conclusions:
The use of multilevel regression estimates to inform personal Bayesian models enhances predictive performance for 2-h glucose levels. This methodological approach provides a robust framework to generate individual models, potentially enabling more targeted clinical management of T2D in the future.
Introduction
In recent years, personalized medicine has gained increased attention as a promising approach to improve the effectiveness of medical treatments by tailoring interventions to individual patient characteristics.1,2 In clinical trials, the average effect of a treatment is often used as a measure of its overall efficacy. However, the average effect of a treatment does not capture its (potential) heterogeneity across individuals, which can be substantial—for example, in the case of gender-specific drug effects. 3 Also, other personal characteristics, such as body mass index (BMI), can modify treatment effects in people with type 2 diabetes.4,5 Besides treatment with medication, lifestyle treatment can aid individuals with multiple chronic diseases. However, the same applies here; there is a large variation in how lifestyle factors, such as physical activity and dietary intake, affect the individual. 6 Thus, personalized treatment effects may be more informative for clinical decision-making than population averages.
There are substantial interindividual differences in the pathophysiology of people with type 2 diabetes. Combined with the growing availability of digital biomarkers—such as data from activity trackers and GPS—this provides new opportunities for more personalized lifestyle treatment. 7 The first line of treatment for people with newly diagnosed type 2 diabetes typically includes metformin and/or lifestyle modification. With the use of digital tools like activity trackers, dietary intake applications, and continuous glucose monitors (CGMs), important outcomes and influencing factors can be monitored and used to study individual responses to lifestyle and serve as a basis for personalized lifestyle treatment. 7 However, estimating treatment effects for each new patient may not always be feasible. Collecting extensive personal data can be both expensive and burdensome. To address this, one strategy is to avoid starting from scratch for every patient by leveraging data from published trials. Bayesian methods offer a solution here. These models can estimate individual-level treatment effects by incorporating prior knowledge and accounting for uncertainty about treatment effects. This approach can help reduce bias and improve precision. Furthermore, Bayesian models can provide insights into the underlying mechanisms of treatment effects and help identify subgroups of patients who may benefit most from a specific treatment.
In this paper, we aim to create a mathematical model of an individual with diabetes where we model the relationship between lifestyle factors and glucose level 2 h ahead. Specifically, we will compare three approaches: (1) a frequentist multilevel model where the individual is set as the level, trained on a group of people with type 2 diabetes, (2) Bayesian models trained on individual persons with weakly informative priors, and (3) Bayesian models with informed priors from the frequentist multilevel model. We will demonstrate the application of the Bayesian models using real-world data from a clinical trial and show how the models perform by looking at the mean difference and root mean squared error (RMSE) between predicted and actual glucose values. Secondly, we aim to study the amount of data required for practical implementation purposes by using 2, 7, and 14 days of available data in the modeling.
Methods
Study design and population
Data from the GlucoInsight study were used for retrospective analysis. 6 In short, 41 people with type 2 diabetes using lifestyle and/or metformin for diabetes management were included. Eligibility criteria included a BMI below 40 kg/m2 and no previous insulin treatment. The study consisted of 11 4-day self-monitoring periods, which included 3 control periods and 8 lifestyle intervention periods. The control periods consisted of self-monitoring during habitual daily life. During each self-monitoring period, participants used a CGM system (Dexcom G6, Dexcom Inc, San Diego, USA), a Fitbit Charge 3 (Fitbit LLC, San Francisco, USA), and a smartphone application called the HowAmI app, developed by the Netherlands Organisation for Applied Scientific research (Leiden, The Netherlands), to log their dietary intake. Participants applied the CGM sensor 1 day before the start of each monitoring period. The study protocol was approved by the Medical Ethics Committee Brabant (NL70771.028.19), performed in accordance with the Declaration of Helsinki and good clinical practice, and registered at The Netherlands Trial Register: NL7848. All participants provided written informed consent.
Measures
The dependent variable in this study was the glucose level. This was measured interstitially every 5 min using the Dexcom G6 CGM system and reported in mmol/L. The independent variables included glucose, physical activity, sleep duration, and carbohydrate intake. Physical activity was quantified using “metabolic equivalent of tasks” (MET), and sleep duration was quantified in hours. Both were measured and calculated through the Fitbit Charge 3. Macronutrient intake data, specifically carbohydrate intake, were collected using the food diary module in the HowAmI app. The app utilized the FatSecret database (Secret Industries Pty Ltd., Victoria, Australia). In the app, participants could search for and record their dietary consumption during the monitoring periods. All food and drink products were saved in the database, including their macronutrient composition(g).
Model
A baseline frequentist multilevel regression model was trained on data of N-1 participants with the following parameters: current glucose, hours of sleep in the previous night, MET in the last 12 h, carbohydrate intake in the last 5 min, carbohydrate intake in the last 30 min, MET in the last 30 min, and MET in the 30 min after the current moment. The analysis is retrospective, the inclusion of future activity terms is intended for parameter estimation and conditional scenario planning, not for real-time prediction where future activity is unknown. The frequentist multilevel regression model was created using lme4 (version 1.1–29) in R (R package version 4.3.3.) using restricted maximum likelihood. Further details on the model and how it was created can be found elsewhere. 6 The amount of data used in the models varied between 2, 7, and 14 days, except for the baseline frequentist model, which used all data except the data from the individual. This included data from the control periods reflecting habitual daily living as well as intervention periods where lifestyle changes were made (low-carbohydrate intake, Mediterranean diet, post-meal walks, and increased activity during the day). 8
For the individual that was left out of the frequentist multilevel model, three different models were made to predict the glucose 2 h later. First, the frequentist multilevel model was used as a predictive model without any changes. Second, a Bayesian modeling approach was taken, setting a prior using the coefficients and random effect from the frequentist multilevel model (Fig. 1).
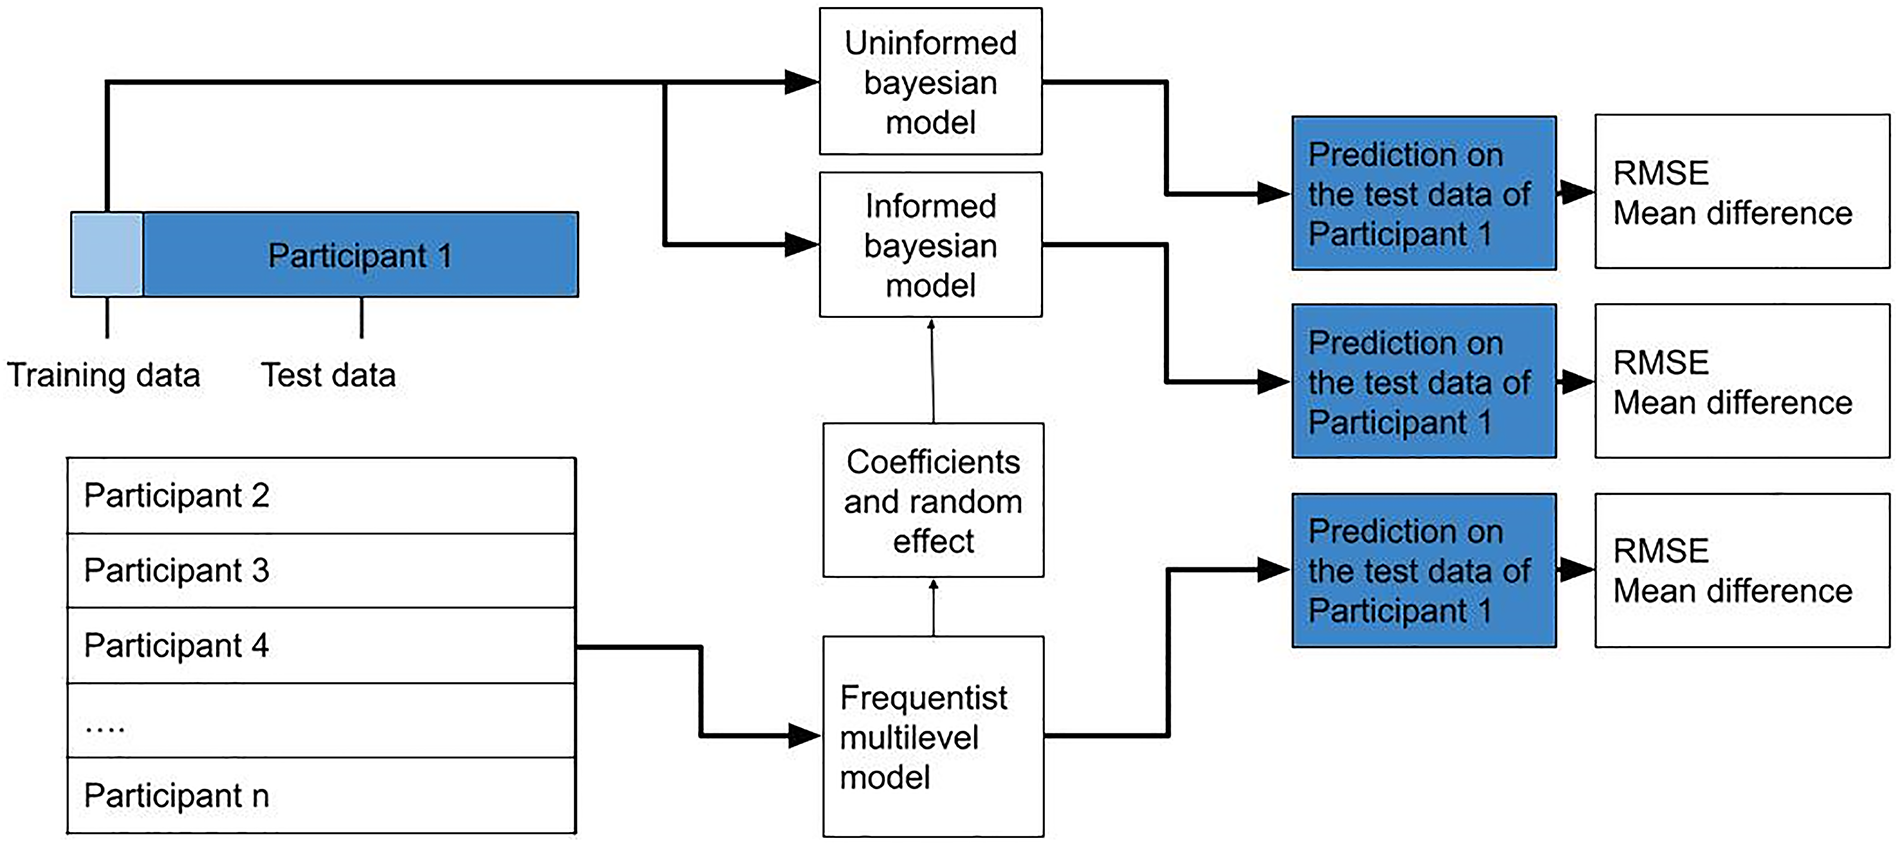
Model design, example for participant 1: A frequentist multilevel model is trained on all but one participant (participant 1 in the figure). The model predicts the glucose value for participant 1 (dark blue), and the root mean squared error (RMSE) and mean difference between the predicted and actual glucose value (from the test data) are calculated. A personal model was then created using Bayesian modeling using the training data from participant 1 (light blue), consisting of the data from one control period. Two Bayesian models were created: one with weakly informative priors and one with informed priors—using the coefficients and random effects from the frequentist model. In the figure, the steps involved are shown for participant 1. This process was repeated for every participant as well as varying lengths of training data (2, 7, and 14 days). RMSE, root mean squared error.
For these priors we used a normal distribution with the mean estimated coefficient as the mean, half of the mean as the standard deviation for the priors of the fixed effects, and the standard deviation of the random effects as the standard deviation for the prior of the variables that were included as random effects in the population model. The Bayesian model was created using Bayesian Regression Models using Stan (BRMS) package( (version 2.21.0) in R (R package version 4.3.3) and trained on the data (2, 7, or 14 days) from a single individual.9,10 The coefficients for fixed effect and random effects from the frequentist multilevel model—trained on all participants except the one individual—were used as informed priors for a Bayesian regression model. This was repeated for every individual in the study.
The personal Bayesian models used a No U-Turn sampling scheme to estimate the posterior probability of the model using 5000 iterations, 2500 warm-up iterations, and a potential scale reduction factor (Rhat) and the effective sample size (ESS) as a convergence criterion. Posterior distributions were obtained from the Hamiltonian Monte Carlo Method samples. To evaluate how well the models fit the data for the individual, a posterior predictive check was performed using the RMSE and mean difference between the predicted and actual glucose for each individual participant 11 In addition, training data length was varied between 2, 7, and 14 days, if data were available.
As a comparative analysis, the personal Bayesian models were also run with a weakly informative prior. The weakly informative priors were set to have a normally distributed intercept with a mean of 5 and a standard deviation of 10, with a normally distributed coefficient with a mean of 0 and a standard deviation of 1. This model was compared against the performance of the model with informed priors obtained from the multilevel model and the predictions using the frequentist population model. Lastly, the amount of data available for the different models was varied, and performance was assessed with the Root Mean Squared Error (RMSE) and Mean Absolute Error (MAE).
Results
On average, participants were male (55%), had a BMI of 28.3 kg/m2, were 62 years old, did not use metformin (61%), and had an education at a higher vocational level or higher (63%). Participants had an average HbA1c of 55 mmol/mol, a fasting glucose of 7.76 mmol/L, and a fasting insulin of 12 U/L. Participants logged at least 80% of their required calories based on their basal metabolic rate on 1312 out of 1821 days (72%). The data selected consisted of complete measurements between 06:00 and 23:00 every day. For the 2, 7, and 14 days of training we took, respectively, the first 432, 1512, and 3024 datapoints measured every 5 min. The participants had between 4395 and 21,957 measurement points. Three out of the 41 participants were left out of the analysis. Two participants withdrew during the study: one due to recurrent technical malfunctions with the CGM and the second due to a change in prescribed medication. In addition, data from a third participant were excluded from the final analysis due to their regular engagement in night shift work.
Both Bayesian models converged correctly for all individuals, with Rhat below 1.01 and both bulk and tail ESS above 6000 for all parameters. 12 Figure 2 illustrates the calibration performance across the varying training window sizes.

Calibration Performance: Distribution of Prediction Interval Coverage. This boxplot displays the percentage of prediction falling outside the 95% Credible Interval (CrI) for each model and for each participant (n = 38). The y-axis denotes the fraction of estimates outside the 95% credibility interval. The central bold line indicates a median noncoverage rate. For all models of 2-week training data, the median noncoverage is 0.04 (4%), demonstrating that the model accurately quantified uncertainty for the typical participant. The whiskers and outliers extend considerably in the 2 days training. Less so in more training data, but still up to 0.24, illustrating some heterogeneity in calibration.
With 2 weeks of training data, the different models achieved a median noncoverage rate of 0.04 (4%). However, the quantity of training data influenced consistency; while models trained on only 2 days of data exhibited considerable spread in coverage accuracy, increasing the training duration reduced this variance. Despite this improvement, heterogeneity persisted: even with extended training, noncoverage rates reached as high as 0.24 (24%) for specific individuals, highlighting a subgroup with distinct, unmodeled glycemic variability.
The informed personal Bayesian models performed better than the weakly informative personal Bayesian models and the population frequentist multilevel models, as indicated by a lower RMSE and standard deviation (Table 1). This holds for all lengths of training data (2, 7, and 14 days). The personal Bayesian model also showed a lower mean glucose difference as compared with the population frequentist model. The accuracy of especially the personal models improved with the availability of more data, mainly between 2 and 7 days of data, as shown by the large similarity in RMSE and mean difference when comparing results from 7 and 14 days.
Average Root Mean Squared Error (RMSE) and Mean Difference (with Standard Deviation) for All Models, Number of Participants with Sufficient Data (N), % of Participants for Which the Informed Model Performed Better than the Weakly Informative Model Given a Certain Amount of Data and the Respective Metric (RMSE or Mean Difference)

RMSE, root mean squared error.
The individual coefficients derived from various models are presented in Supplementary Figures S1 and Figure S2. Inspection of the population frequentist multilevel model revealed variability in coefficient estimates when trained with only 2 days of data, a variability that was reduced as the training dataset increased to 7 and 14 days. In contrast, the informed personal Bayesian model demonstrated consistent coefficient estimates across all training durations (2, 7, and 14 days), suggesting robustness to limited training data. Furthermore, differences in coefficient estimates were observed between the two modeling approaches. Notably, the informed personal Bayesian model noted a much smaller range of the effect of exercise in the past 12 h.
To ensure the models accurately reflect individual relationships between lifestyle factors and glucose levels, we evaluated the distribution of fit indices—specifically RMSE and mean difference—across individuals. High RMSE values or mean differences substantially deviating from zero suggest poor model fit, potentially leading to misleading lifestyle recommendations. Table 2 presents the minimum and maximum values for these indices. Across all examples, the personal Bayesian models consistently showed the smallest range in RMSE and mean difference, with values closest to zero.
The Extremes of All Scores (Minimum and Maximum) for the Mean Difference and RMSE of the Models per Individual, Showing the Best and Worst Models per Technique Used

Green marks the smallest difference between the minimum and maximum values for that metric and amount of data. Red is the biggest difference. The Bayesian model with informed priors shows the least extreme values for the RMSE and mean difference. Minimum and maximum values for RMSE and mean difference across the individualized models, illustrating the best and worst model performance per technique. Green highlights indicate the smallest range between minimum and maximum values for each metric and data quantity, while red highlights indicate the largest range. The Bayesian model with informed priors consistently shows the smallest ranges, suggesting greater stability and better individual-level fit.
RMSE, root mean squared error.
Two participants stand out when comparing the performance of the different models based on a visual inspection. For participants A and B, the RMSE and mean difference for all models were higher than all the other participants. Where the RMSE was the lowest in the informed personal Bayesian model, the mean difference in glucose was the worst. For both participants, the HbA1c was >80 mmol/mol, while the average HbA1c of the rest of the participants, excluding these two participants, was 52 mmol/mol (Fig. 3).

Distribution of HbA1c values in mmol/mol showing the occurrence of HbA1c values among the included participants, where 3 participants are outside the normal distribution on the far right.
Conclusion/Discussion
This study aimed to model the glycemic response to lifestyle in individuals with type 2 diabetes, combining group-level information on the relationship between glucose and lifestyle with data on the individual using a Bayesian modeling approach, and compare this with a group-level model and a weakly informative personal model. Overall, the informed personal Bayesian model showed the best results. It demonstrated a better and more consistent RMSE (error) and a better and more consistent mean difference, leading to more reliable conclusions about an individual compared with the population frequentist multilevel model. Even though a frequentist population model is created to obtain the mean over all individuals, allowing a strong overestimation for some and an underestimation for others, it still performed worse in the mean difference on the individual. In conclusion, the personal Bayesian models are better suited to capture individual variability, particularly for those whose data diverge significantly from the population-level model.
Other approaches have been taken to create personal glucose prediction models. Li and Fernano (2016) 13 preinformed a time series model based on clusters of similar individuals to obtain more accurate predictions. This approach also showed improved prediction performance compared with a personal prediction model, lowering the RMSE from 39.44 mg/dL to 27.45 mg/dL, or 2.19 mmol/L to 1.53 mmol/L. Mohebbi et al. (2020) compared a population approach versus a personalized one using a somewhat different framework than presented in this paper. 14 Their approach centered on a time series prediction using a recurrent neural network using 14 days of CGM values and no other variables. They found no improved prediction accuracy when using a population-based model and fine-tuning on the individual patient, with an RMSE of 2.67 mmol/L for the prediction of glucose 90 min later, when compared with a population-based model only. While difficult to compare due to differences in study designs, the RMSEs of the presented prediction models (between 1.7 and 2.5 mmol/L) are in line with published literature.
The difference in prediction accuracy between the population frequentist multilevel model and Bayesian models is small when comparing the RMSE and mean difference. The mean deviation of the informed personal Bayesian model compared with the population frequentist multilevel model is at best 0.23 mmol/L and at worst 0.35 mmol/L. Nonetheless, the clinical difference can be profound. While the prediction might differ marginally, the coefficients representing the relationship between the lifestyle variable and the glucose values in 2 h were different between the models. With an improvement in prediction accuracy, the relationship between the input variables and the 2-h glucose is more accurately represented, and therefore, a more personalized estimation of the impact of lifestyle factors. Potentially leading to a different advisable lifestyle modification to achieve a lower glucose level.
Our findings show that the duration of the training period (2, 7, or 14 days) was not a significant determinant of model performance beyond 7 days. This suggests that data quantity may be less critical than its quality and representativeness for creating personal models. The importance of representative data was emphasized by one observation: a possible consistent underperformance of models for individuals with high HbA1c levels.
This underperformance in specific subgroups highlights how crucial the training population’s characteristics are for developing both general and personal models. For individuals with elevated HbA1c, the weaker model performance might be attributed to a blunted relationship between lifestyle factors and glycemia due to constantly high blood glucose. 15 This, combined with small sample size and relative homogenious population included population, warrants restraint in generalization and direct clinical utility. Further research is warranted to confirm subgroup differences and refine modeling approaches accordingly. Rather, this study shows a proof-of-concept for the novel hybrid Bayesian/Frequentist approach for modeling lifestyle effects in T2D.
The models developed in this study allow for personal advice, as they are interpretable models, meaning that the effect of the features, such as the effect of carbohydrate intake on glucose level, can be quantified for the individual person. This allows individual advice on what lifestyle features are most impactful for the individual and an individualized estimation of what effect a certain change in lifestyle might yield in terms of improvement of blood glucose values. Whether providing this information also leads to a more effective lowering of glucose values for individuals with type 2 diabetes requires evaluation in a dedicated clinical trial. Literature on the effectiveness of personalized lifestyle interventions does show the benefit of personalization. In people with type 2 diabetes, a more personal approach based on subtyping led to a lower HbA1c, lower weight, and more cases of remission of diabetes (fasting glucose ≤6.9 mmol/L and HbA1c <6.5% [48 mmol/mol]). 16 In people who are overweight, improvement in fasting insulin, 2-h glucose/insulin, and insulin resistance can be seen from a more personal approach. 17
Overall, we argue that further personalizing the treatment effect of lifestyle with a personal Bayesian model is feasible and might provide a comprehensive understanding of the heterogeneity in lifestyle effects across individuals. This approach might potentially advance personalized lifestyle treatment in clinical practice in the future. By using an informed personal Bayesian model, existing data can be leveraged to improve a model’s performance with minimal data collection needed.
Authors’ Contributions
T.S., I.M.H., and R.J.M.K. conducted the clinical study. T.S. and T.K. researched data. T.K. created the statistical models. T.S. wrote the first draft of the article. R.J.M.K., I.M.H., A.A.G., T.K., H.M.E., and H.P. contributed to discussion, and reviewed and edited the article. All authors approved the final version of the article.
Footnotes
Acknowledgments
The authors of this study would like to thank the research participants for their hard work and dedication.
Author Disclosure Statement
T.S. has a paid position at Roche Diabetes Care Nederland B.V. that markets tools related to diabetes self-management. I.M.H., T.K., R.J.M.K., H.M.E., A.A.G., and H.P. declare no conflicts of interest exist.
Funding Information
This study was part of the Gluco-Insight project, which was co-funded by the PPP Allowance made available by Health∼Holland, Top Sector Life Sciences & Health, and funded by Roche Diabetes Care Nederland B.V. and in-kind contribution from Reinier Haga Medisch Diagnostisch Centrum, Leiden University Medical Center, and Ekomenu.
Supplemental Material
Abbreviations
References
Supplementary Material
Please find the following supplemental material available below.
For Open Access articles published under a Creative Commons License, all supplemental material carries the same license as the article it is associated with.
For non-Open Access articles published, all supplemental material carries a non-exclusive license, and permission requests for re-use of supplemental material or any part of supplemental material shall be sent directly to the copyright owner as specified in the copyright notice associated with the article.