
Abstract
Background:
The use of continuous glucose monitoring (CGM) in inpatient settings is highly attractive; it reduces the capillary glucose checks and enables remote monitoring. CGM systems have proven reliable in outpatient care; however, their reliability in hospitalized patients, particularly pregnant women, remains uncertain.
Aim:
To determine CGM accuracy and potential clinical risk of using CGM in pregnant women with type 1 diabetes mellitus (T1DM) or type-2 diabetes mellitus (T2DM) during acute hospitalization.
Method:
Prospective cohort study. CGM glucose was compared with paired capillary glucose readings as the reference. Concordance was assessed using mean absolute relative difference (MARD), the Food and Drug Administration standards for new integrated-CGM (iCGM) accuracy, and the diabetes technology society (DTS) error grid.
Results:
The dataset consisted of 1351 paired-readings from 26 women with T1DM and 11 women with T2DM. MARD was 12.9% overall, and 11.9% when the capillary glucose was 3.9–10.0 mmol/L. DTS error grid showed 81.6% of paired readings in zone A, 17.2% in zone B,1% in zone C and 0.1% in zone D. When capillary glucose was 3.9–10.0 mmol/L, 83.8% were in zone A, 15.5% in zone B, 0.6% in zone C, and 0.1% in zone D.
Conclusions:
These findings showed comparable accuracy in inpatient pregnant women to other inpatient groups in recent studies. CGM readings were highly correlated with the reference readings when capillary glucose was 3.9–10.0 mmol/L or when the CGM readings were 5.0–7.0 mmol/L. However, while CGM may guide inpatient antenatal diabetes care, critical management decisions (particularly around hypoglycemia) should be based on capillary glucose until greater concordance is established.
Introduction
Current guidelines from the National Institute for Health and Care Excellence 1 and the Australasian Diabetes in Pregnancy Society 2 recommend continuous glucose monitoring (CGM) for ambulatory pregnant women with type 1 diabetes (T1DM), and for those with type 2 diabetes (T2DM) on insulin therapy experiencing problematic hypoglycemia. These recommendations are largely based on the CONCEPTT trial, which demonstrated that CGM users have reduced glycemic variability (GV), increased time in range (TIR), and fewer complications. 3 CGM users are more likely to achieve target HbA1c levels at 34 weeks’ gestation, a parameter found to be independently linked with improved perinatal outcomes. 4 When subsidized, CGM incurs no significant additional cost compared with capillary glucose. 4 CGM also enhances quality of life by enabling real-time glucose tracking and alerts to prevent extreme glycemic events. 5 While earlier CGM systems were adjunctive to capillary glucose, current models are approved for nonadjunctive use, meaning they can substitute capillary glucose and be used to determine insulin doses.6–8
Several studies support CGM validity in the inpatient setting, 9 although others report discrepancies between CGM and reference values at lower glucose levels.10–12 While capillary glucose systems have strict accuracy standards, comparable regulatory requirements for CGM systems were only published by the U.S. Food and Drug Administration (FDA) in 2018. 6 Prior to these standards, CGM accuracy was primarily assessed using mean absolute relative difference (MARD)13,14; CGM systems designated for nonadjunctive usage frequently have an overall MARD range between 10.0% and 12.0%.6,15,16 Another commonly used method is error grid analysis, which unlike the numerical methods, evaluates the clinical risk associated with CGM use by categorizing paired data into risk zones. 17 It has been proposed that CGM systems may be permitted a slightly lower accuracy than capillary glucose systems, as the higher frequency of glucose readings combined with features such as trend arrows can guide effective glucose management. 18
A physiological time delay between the capillary and interstitial compartments is a crucial factor influencing CGM accuracy. Interstitial fluid glucose typically lags capillary glucose by approximately 10 min, 19 which may affect the CGM accuracy and reliability for glucose monitoring.20,21
Assessing accuracy in pregnancy is important, as physiological changes during pregnancy, including alterations in steroid hormones, cytokines, and protein hormones, can affect GV, and CGM accuracy. 22 Only a limited number of studies have evaluated the accuracy of CGM systems during pregnancy and were conducted in outpatient settings. One study assessed the Abbott-1 CGM in 74 pregnant women with T1DM, T2DM, or gestational diabetes, reporting 99.8% of paired CGM and reference values within zones A and B of the Consensus Error Grid and a MARD of 11.8%. 23 Another study evaluated the Guardian-3 (Medtronic) CGM in 15 pregnant women, with 93.8% of paired values within zones A and B of the Clarke Error Grid and a mean absolute difference of 0.73 mmol/L. 24 In a retrospective pilot study by our group involving nine hospitalized pregnant women with T1DM, overall, MARD was 11.4% and 10.0% when capillary glucose 3.8–10.0 mmol/L. However, accuracy declined at glucose extremes, with MARDs of 35.8% for values below 3.8 mmol/L and 23.7% for values above 10 mmol/L. 25 These findings suggest CGM may be feasible in hospitalized pregnant women, but concerns remain regarding accuracy at glucose extremes. Further studies are warranted to validate CGM accuracy and outline its clinical utility in hospitalized pregnant women with T1DM or T2DM.
Methods
Study design
This was a prospective, single-center study conducted at a tertiary endocrine and obstetric unit in New South Wales, Australia, from November 2021 to August 2023. The study protocol was approved by the Hunter Region Ethics Committee (Reference number: 2021/ETH01402). Inclusion criteria included pregnant women aged ≥18 years with T1DM or T2DM. Exclusion criteria included the inability to wear CGM due to allergy or skin disease, inability to provide informed consent, or regular paracetamol use due to reported interference with CGM accuracy. 26 Women were enrolled at antenatal outpatient visits between 16 and 32 weeks of gestation and provided written informed consent to participate. Women without their own CGMs were provided with the Abbott-2 (Libre-2 Freestyle) sensor from 34 weeks’ gestation until discharge postdelivery. T1DM participants accessed CGM through public subsidy and selected their preferred device (Dexcom-G6, Abbott-2, or Guardian-3). Participants and clinicians were able to view the CGM data, but clinical decisions in the inpatient setting were guided exclusively by capillary glucose levels measured using an Optium-Neo glucometer. Hypoglycemia was treated according to a standard guideline using 15 g of oral glucose gel.
Demographic data were collected using a standardized template. Capillary glucose readings were extracted from the electronic medical record and matched with corresponding CGM data using a standardized template. Each capillary glucose value was compared with the nearest CGM reading: for Dexcom and Guardian systems, which record glucose readings every 5-min, the nearest CGM reading is ≤2.5 min from the reference, but for Abbott system, which stores glucose readings every 15-min, the nearest CGM reading is ≤7.5 min from the reference.
Clinical settings were categorized into four main prespecified groups: antenatal, peripartum, postpartum, and caesarean section without labor. Three prespecified subgroups were also identified: antenatal unwell, post-betamethasone administration, and during pregnancy intravenous insulin infusion (P-IVI). For clinical setting definitions, see Supplementary Table S1.
Outcomes
Capillary glucose was defined as the reference. CGM accuracy was assessed using two primary outcomes:
Compliance with FDA integrated-CGM Accuracy Criteria,
6
which is:
Overall, >87% of CGM values within ±20% of the reference. When capillary glucose 3.9–10.0 mmol/L: >70% of CGM values within ±15%, and >99% within ±40% of reference. When capillary glucose <3.9 mmol/L: >85% of CGM values within ±0.83 mmol/L, and >98% within ±2.22 mmol/L, with no CGM values >10.0 mmol/L. When capillary glucose >10.0 mmol/L: >80% of CGM values within ±15%, and >99% within ±40%, with no CGM values <3.9 mmol/L. MARD: MARD ≤12.0% was considered consistent with the performance of nonadjunctive-use.6,15,16
To assess the time lag between capillary glucose and CGM readings during hypoglycemia (<3.5 mmol/L), MARD was calculated for CGM values at 0–5 min, >5–10 min, and >10–15 min following the corresponding capillary glucose.
Statistical methods
Ninety-five percent confidence intervals for the proportion of CGM measurements meeting the FDA standard were derived from the percentiles of 10,000 bootstrapped samples, resampled at the episode level. MARD was assessed by CGM timing relative to capillary readings. Analyses were stratified by diabetes type and sensor type. Adherence to FDA standards also was assessed across CGM measurement ranges. A logistic generalized linear mixed model identified factors associated with concordance, defined as CGM values within 20% of reference, or within 0.83 mmol/L when capillary glucose <3.9 mmol/L. Fixed effects included capillary glucose, sensor type, diabetes type, ethnicity, gestational age, relative change in reference glucose and use of intravenous insulin, steroids, or whether a participant was in labor. Relative change was only calculated where the previous measurement was within the same episode and within 4-h. A random intercept for episode accounted for within-episode correlation. As most patients only had single episode, this also captured between-patient variance. The impacts of clinical setting and GV were assessed using MARD and the proportion of CGM readings within 20% of reference. High GV was defined as within-episode coefficient of variation (%CV) ≥33%. Agreement between CGM and capillary glucose was further evaluated using the diabetes technology society (DTS) error grid analysis, Pearson correlation, and Bland–Altman plots.
Results
The study enrolled 50 pregnant women; 30 with T1DM and 20 with T2DM. Paired data were available for 26 women with T1DM (1111 data pairs) and 11 women with T2DM (240 data pairs) (Fig. 1), with paired data for 13 participants unavailable. There were 48 admission episodes, primarily due to caesarean section (n = 13), labor (n = 12), and uncontrolled DM or acute illness (n = 13). Participant characteristics (Table 1) showed median maternal age was 32 years (IQR 27–34), and median BMI was 29 kg/m2 (IQR 25–35). Capillary glucose levels during monitoring ranged from 1.9–19.3 mmol/L (median 5.8 mmol/L), while CGM readings ranged from 2.2–17.1 mmol/L (median 5.7 mmol/L). Data distribution by clinical setting, diabetes type, and sensor type is shown in Supplementary Table S2.

Enrolment flow chart.
Participant Characteristics
Participant characteristics are presented as medians and interquartile ranges (IQR) for continuous variables and frequency and percentages for categorical variables.
Compliance with FDA standards for integrated-CGM
Out of 1351 paired readings, 81.9% of CGM values were within 20% of the reference, falling short of the FDA threshold of >87% (Table 2). For capillary glucose 3.9–10.0 mmol/L, 73% of CGM readings were within 15% of the reference, meeting the first FDA criterion for this range. However, only 97.4% of readings fell within 40%, 1.7% below the FDA requirement of >99%. This study showed that neither women with T1DM nor T2DM met the overall FDA standards in this clinical setting. However, among women with T2DM, CGM readings for capillary glucose <3.9 mmol/L (n = 26) and >10.0 mmol/L (n = 5) did meet FDA criteria. None of the CGM systems demonstrated complete compliance with FDA accuracy requirements. CGM readings in this cohort failed to meet FDA accuracy standards but approached the recommended thresholds. Post-hoc analyses stratified by CGM glucose ranges revealed that when CGM values were between 5.0 and 7.0 mmol/L, 86.6% of readings were within 20% of the reference, just below the FDA threshold of >87% (Supplementary Table S3).
Number and Percentage of CGM Readings Meeting FDA Standards for Integrated-CGM
n1 total number of paired readings in that reference glucose range.
n2 number of CGM readings that fulfill the specific criterion in that reference glucose range.
% percentage of CGM readings that fulfill the specific criterion in that reference glucose range.
(95% CI) (95% confidence interval). MARD, mean absolute relative difference; CGM, continuous glucose monitoring; T1DM, type 1 diabetes mellitus; T2DM, type 2 diabetes mellitus.
MARD
The overall MARD was 12.9% (Table 3). When capillary glucose was 3.9–10.0 mmol/L, MARD was 11.9%. However, MARD increased markedly to 21.0% when capillary glucose <3.9 mmol/L. This pattern was consistent across diabetes types and CGM systems. However, when capillary glucose was <3.9 mmol/L, Guardian-3 had the highest MARD of 25.7%, while Dexcom-G6 had the lowest MARD of 17.9%.
Mean Absolute Relative Difference (%) Overall, by Diabetes Type and Sensor Type
Secondary outcomes
A total of 87 paired readings with capillary glucose <3.5 mmol/L were analyzed. MARD was 23.5% for CGM values taken within 0–5 min of the reference, 28.1% for CGM values within >5–10 min, and 26.8% for CGM values within >10–15 min. These results were consistent across diabetes types and CGM types (Table 4).
MARD For Paired Readings with Reference Capillary Glucose Readings <3.5 Mmol/L, and the CGM Values Collected at 0–5, >5–10, and >10–15 Minutes Post Reference Capillary Glucose Readings
N1number of paired readings.
Exploratory outcomes
A strong correlation was observed between CGM and capillary glucose readings, with a Pearson correlation of 0.86 (95% CI: 0.84–0.87, P < 0.001; Fig. 2). Bland–Altman analysis indicated a mean relative difference of 2.4%, suggesting CGM readings were on average 2.4% lower than capillary values, (95% CI: 14.9%–19.7%) (Fig. 3). DTS error grid showed that 81.6% of paired readings fell within zone A, 17.2% in zone B, 1% in zone C, and 0.1% in zone D (Fig. 4). When capillary glucose levels were 3.9–10.0 mmol/L, 83.8% of paired readings were in zone A, 15.5% in zone B, 0.6% in zone C, and 0.1% in zone D.
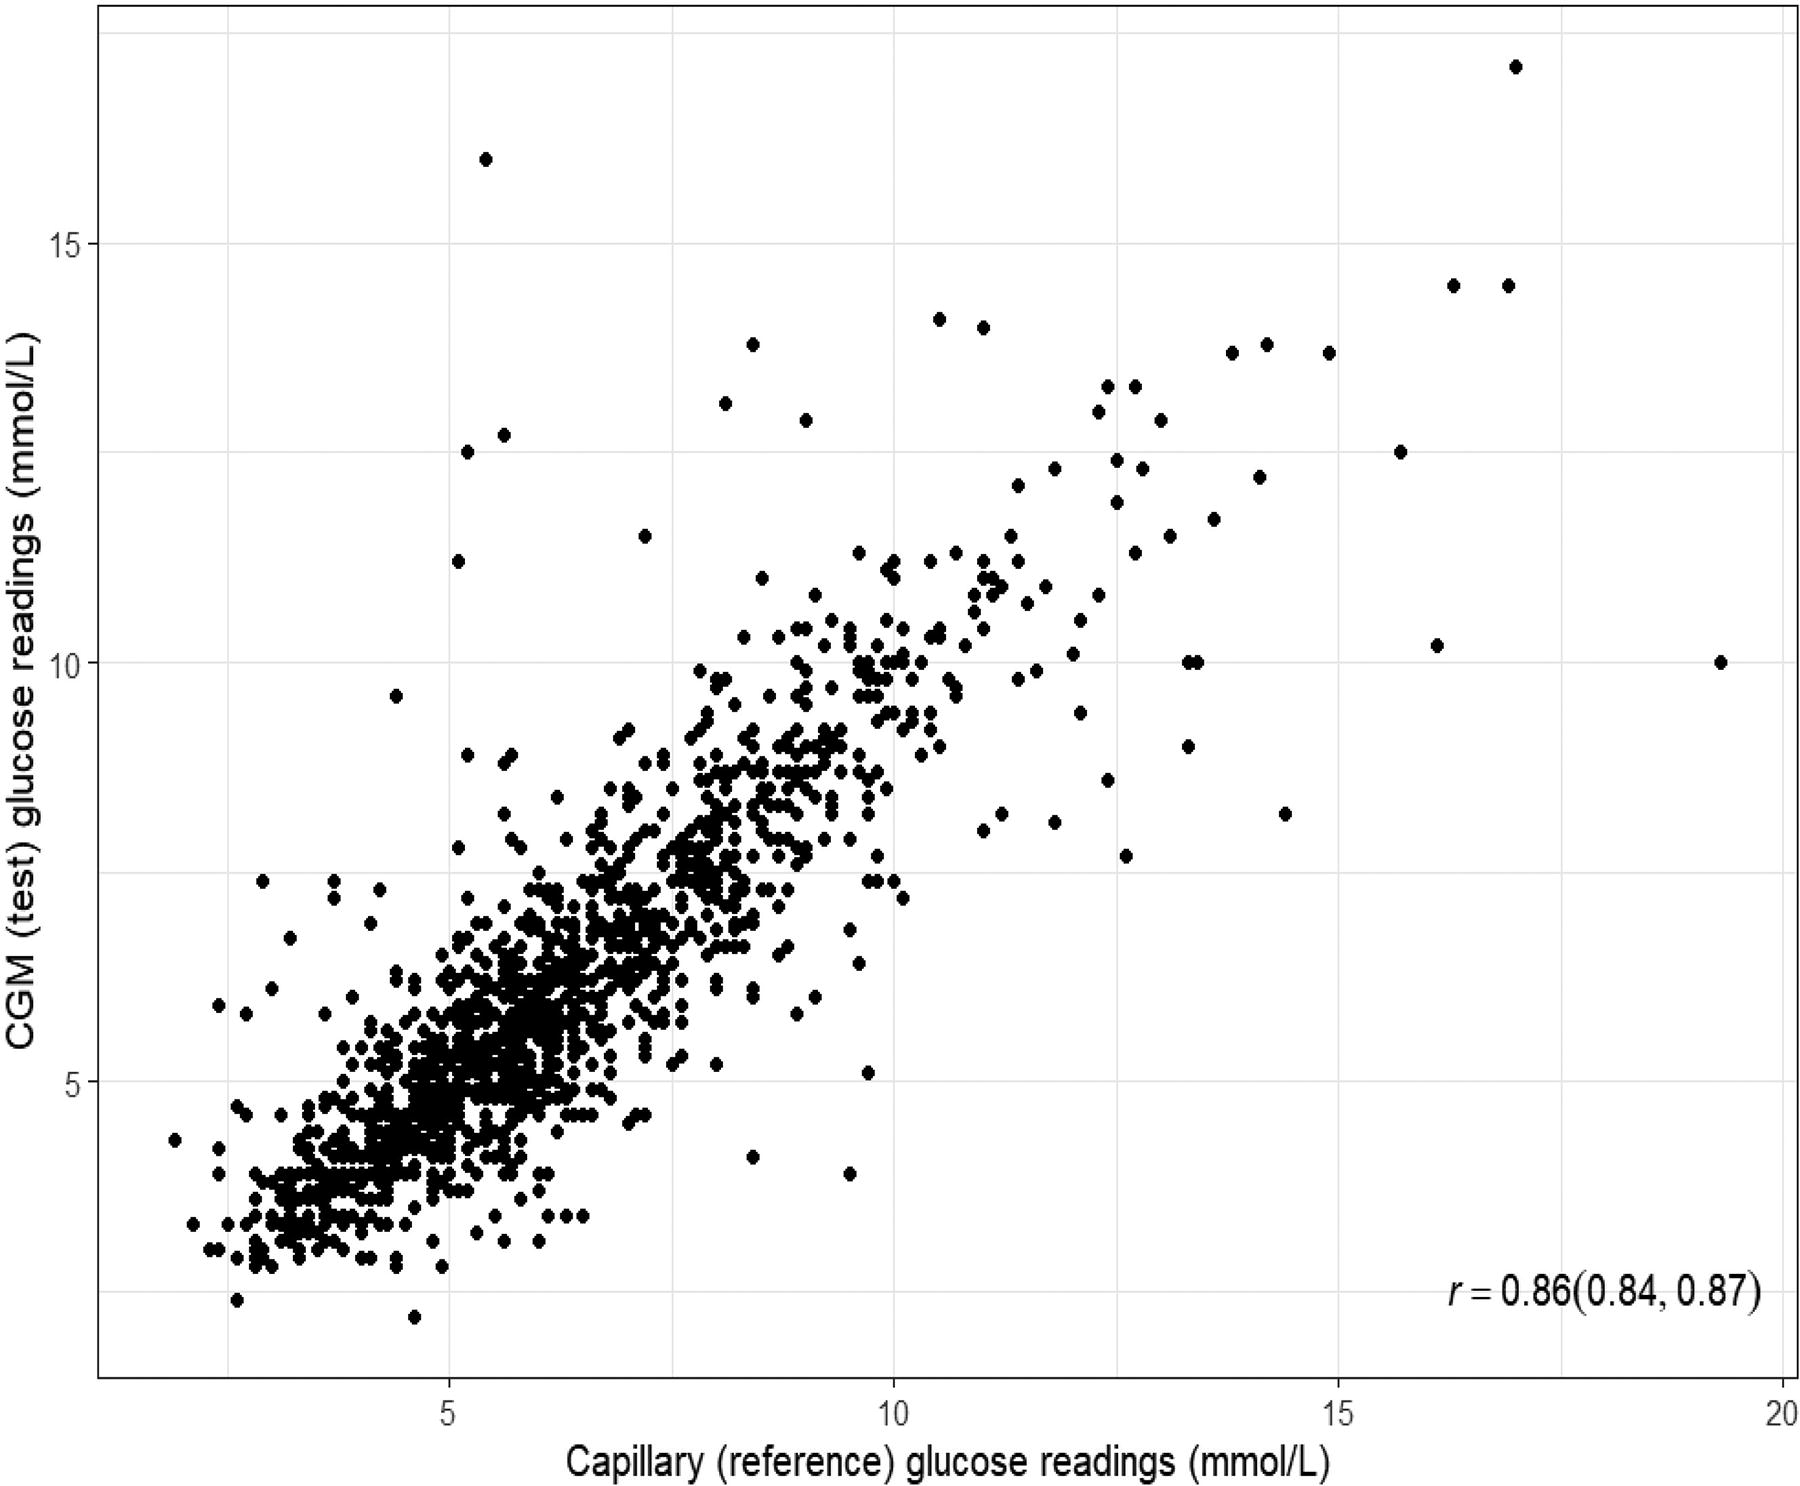
Scatterplot of CGM readings versus capillary BG readings. CGM, continuous glucose monitoring; BG, blood glucose.

Bland–Altman scatterplot for relative difference versus the average of capillary BG measurements and CGM measurements. Mean bias is shown using a solid line and the dashed lines represent the 95% limits of agreement.

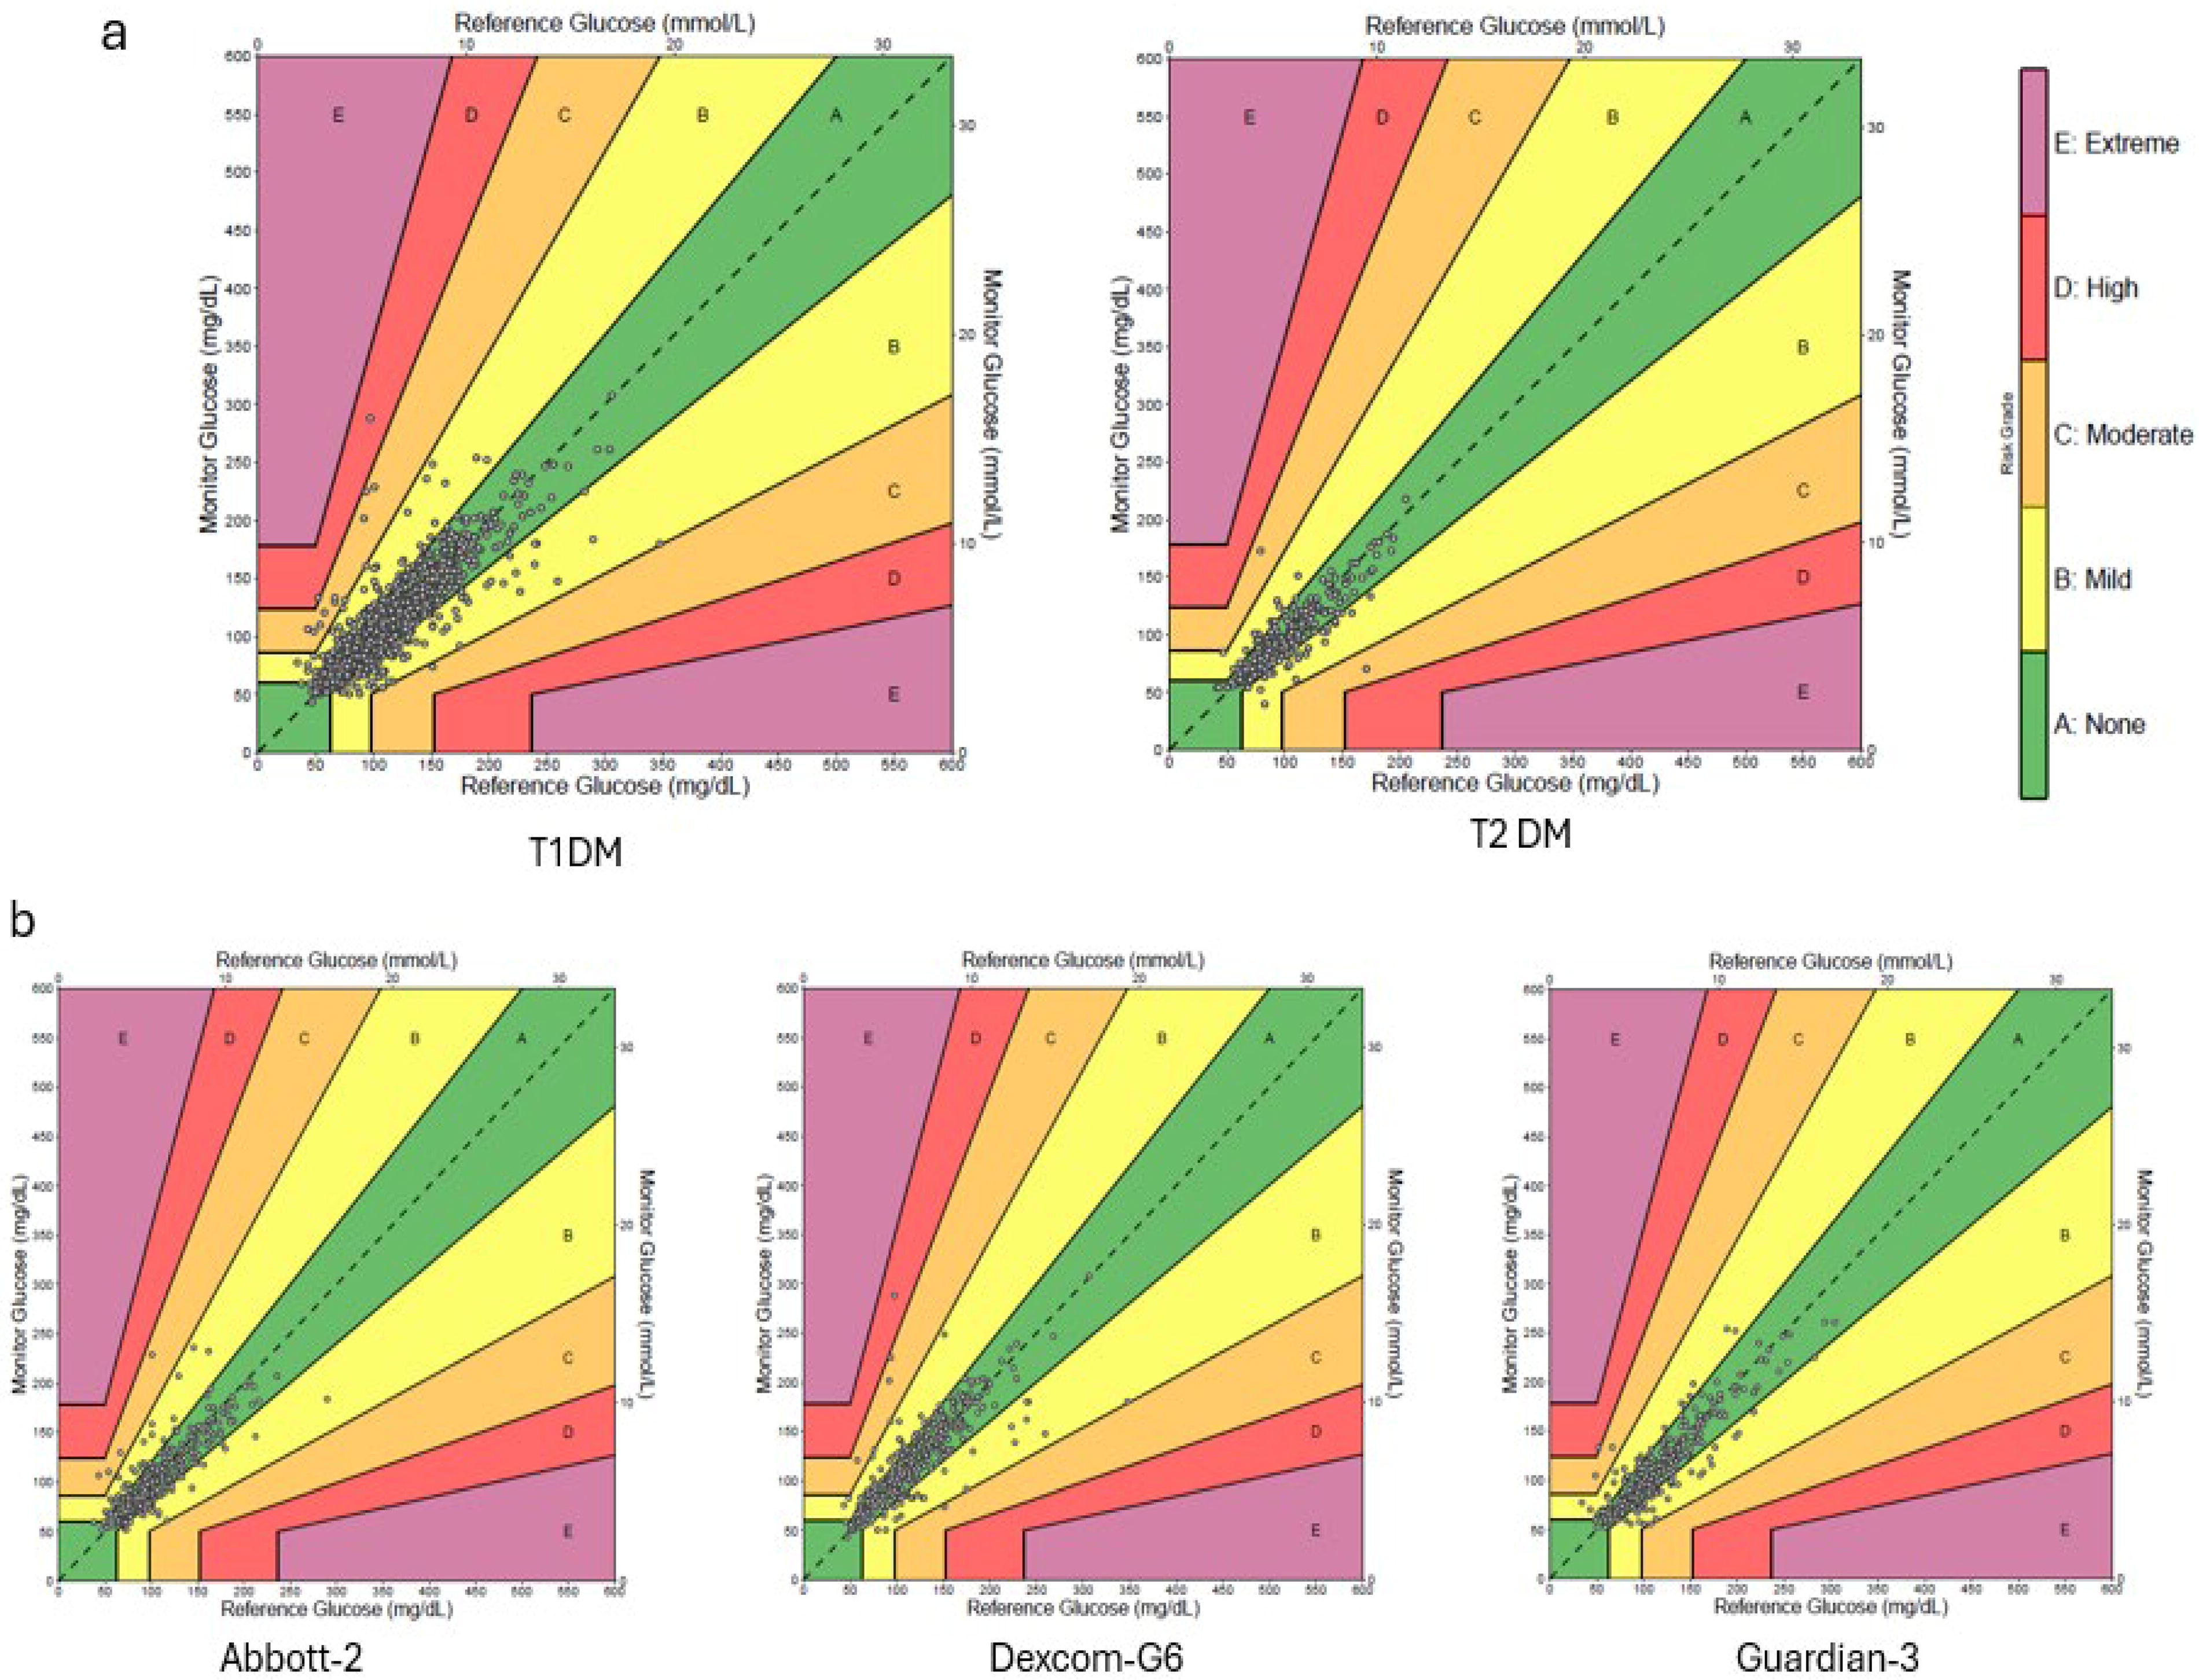
The diabetes technology society (DTS) error grid analysis for all paired readings from the study population. Zone A, no risk, no effect on clinical action. Zone B, mild risk, slightly altered clinical action, or no effect. Zone C, moderate risk, altered clinical action likely to affect care. Zone D, high risk, altered clinical action with potential to cause harm. Zone E, extreme risk, dangerous failure to detect or treat.
DTS error grid by diabetes and sensor type
Among women with T1DM and T2DM, 98.8% and 99.2% of paired readings, respectively, fell within low-risk zones A and B (Fig. 5a). Women with T2DM used only Abbott-2 CGM, while those with T1DM used Abbott-2, Dexcom-G6, or Guardian-3 sensors. In T1DM participants, DTS error grid showed that 99.0%, 98.5%, and 99.1% of paired readings from Abbott-2, Dexcom-G6, and Guardian-3 systems, respectively, fell within Zones A and B (Fig. 5b).
Impact of clinical setting on CGM accuracy
The study had 134 paired readings from four women received betamethasone, in this context the CGM accuracy met FDA standards, with 92% of values within 20% of reference and MARD was 10.0%. Indeed, MARD was similar after each dose: 10.1% in the first 24 h and 10.8% in the 24 h following the second dose. Among women who received the P-IVI for any indication (e.g., infection, uncontrolled diabetes, or postbetamethasone administration), 84% of CGM values were within 20% of the reference and MARD was 12.0% (Supplementary Table S4). In the P-IVI subgroup, post-hoc analyses were conducted after excluding readings that appeared across multiple groups. In women who received P-IVI solely for caesarean section without labor, 96 paired readings showed a MARD of 8.8%; for acute illness, 116 paired readings showed a MARD of 13.7%; and during the peripartum period, 66 paired readings showed a MARD of 14.2%. The caesarean section without labor group demonstrated greater CGM accuracy than the peripartum group, with 86% of CGM readings within 20% of the reference and MARD 10.0%, versus 79% and MARD 13.0%, respectively (Supplementary Table S4). Women with low GV had greater CGM accuracy than women with high GV, with 84% of CGM readings within 20% of reference and MARD 12.0%, versus 80%, and MARD 14.0%, respectively.
Multivariable regression model
Multivariable modeling indicated that steroid use and stability of capillary glucose were associated with CGM concordance (Table 5). Women who received antenatal corticosteroids had 3.26 times higher odds of concordance compared with those who did not (95% CI: 1.44–7.39; P = 0.005). Additionally, each 1% increase in capillary glucose compared with the previous reading was associated with a 1% decrease in the odds of concordance (OR: 0.99; 95% CI: 0.99–1.00; P = 0.012). No significant associations were found for other variables, including sensor type or diabetes type.
Multivariable Regression Examining the Factors Associated with Concordance Between Capillary Glucose and CGM Readings
OR, odds ratio; CI, confidence interval.
Discussion
Recent studies have shown that CGM systems have become increasingly integrated into the standard care in hospitalized patients. 27 However, currently, there is no benchmarking of standards for CGM accuracy in the inpatient setting. 28 In this study, 81.9% of CGM readings were within 20% of the reference, indicating comparable or improved accuracy relative to previous studies in nonpregnant hospitalized patients. Davis et al. and Galindo et al. reported 81.7% and 76% within 20%, respectively.28,29
In this study, the overall MARD was 12.9%, consistent with previous data. MARD was 11.9% when capillary glucose 3.9–10.0 mmol/L, meeting the ≤12.0% threshold for nonadjunctive CGM use. Davis et al. reported a MARD of 12.8% in 218 hospitalized patients using Dexcom-G6, and Perez-Guzman et al. reported a MARD of 12.9% in coronary artery bypass graft patients receiving intravenous insulin.29–31 Other non-ICU studies reported MARDs of 14.8% and 15.6%.28,32 Herzig et al. found greater variability during cardiac surgery, with intraoperative MARDs of 23.8%, rising to 29.1% during hypothermia and decreasing postoperatively to 15.0%. By contrast, Tripyla et al. reported a lower MARD of 12.7% during abdominal surgery. 33 In this cohort, accuracy remained acceptable during corticosteroid use and during admission for caesarean section (MARD 10.0%). Low GV was associated with improved accuracy, consistent with prior findings.30,33 MARDs for T1DM and T2DM were 13.0% and 12.2% respectively; this similarity aligns with findings from Wright et al., who found no significant differences in accuracy between diabetes types. 27
This study’s results were encouraging regarding the accuracy of CGM considering the profound physiological changes of pregnancy. However, CGM accuracy declined during episodes of hypoglycemia, consistent with earlier studies. 30 Notably, when capillary glucose <3.9 mmol/L, over 5% of CGM readings deviated by >2.2 mmol/L from reference, potentially leading to mismanagement and compromising maternofetal wellbeing. MARD increased to 20.9% when capillary glucose <3.9 mmol/L, indicating greater discordance between interstitial and capillary glucose during hypoglycemia. Recent inpatient studies have reported a wide MARD range (6.6%–30.5%), with reduced accuracy during hypoglycemia. 33 When capillary glucose was <3.9 mmol/L, the Dexcom-G6 demonstrated a MARD of 17.9%, compared with 23.9% for Abbott-2 and 25.7% for Guardian-3. These results suggest that the Dexcom-G6 could be more accurate than the Guardian-G3 or Abbott-2 in detecting hypoglycemia. However, the significance of this difference is limited by the small number of hypoglycemic readings and further comparison with a larger dataset would be required to determine if there is a difference in accuracy between sensor types. DTS error grid showed 1.1% of readings in zones C and D, indicating a risk of inappropriate clinical decisions, a real concern in pregnancy. These findings align with previous studies,32,34,35 and in such cases, sole reliance on CGM is inadequate. However, when capillary glucose was 3.9–10.0 mmol/L, 99.3% of readings fell within zones A and B, supporting CGM’s clinical reliability in this range. Nonetheless, CGM technology continues to improve; Wright et al. reported a significant accuracy enhancement from Abbott-1 to Abbott-2, consistent across the glycemic range in hospitalized adults, 27 providing the potential for accuracy in the hypoglycemic range to be better identified in future.
Although interstitial glucose generally reflects plasma glucose, a physiological lag of approximately 10 min may occur during rapid glycemic fluctuations. 30 In this study, calculating MARD with delays of >5–10 or >10–15 min did not improve CGM accuracy. This may be explained by rapid correction of hypoglycemic events in hospitalized pregnant women, leading to abrupt plasma and interstitial glucose changes and elevated postevent MARD values.
Multivariable analysis showed that CGM accuracy was unaffected by gestational age, diabetes type, or sensor type. Accuracy improved in women who received corticosteroids; this may be due to the predominance of P-IVI use in this cohort (130 of 134 paired readings), which has been shown to reduce GV. 36
A hybrid protocol, combining CGM with capillary glucose in response to alerts or clinical indications, is an increasingly adopted inpatient strategy, initially described by Faulds et al. 37 While this approach reduces the need for fixed-interval capillary checks, it does not address CGM’s reduced accuracy during hypoglycemia. Missed hypoglycemia remains a concern, particularly for women with hypoglycemia unawareness who may rely solely on CGM alerts. Nonetheless, the hybrid protocol may be suitable for individuals with preserved hypoglycemia awareness, especially as this study showed strong CGM accuracy when capillary glucose is 3.9–10.0 mmol/L or CGM values are 5.0–7.0 mmol/L. A modified hybrid protocol with scheduled less frequent capillary glucose readings or with fluctuations in the sensor readings may be explored for women with hypoglycemic unawareness.
The strengths of this study include its prospective design, the sample size of 37 pregnant women with T1DM or T2DM, yielding >1300 inpatient data points, and the inclusion of a range of indications for pregnancy-related hospitalization. To our knowledge, this is the first study of its kind in this context. Multiple methodologies were applied to assess CGM accuracy, including FDA standards and DTS error grid analysis. Limitations of the study included the lower number of data points from women with T2DM and overlapping subgroups such as those receiving P-IVI and corticosteroids may have introduced confounding effects. Furthermore, hypoglycemia treatments were not recorded; future studies should include the timing of hypoglycemia treatments to enable assessment of CGM accuracy before and after treatment.
Further research with larger cohorts is warranted. As CGM devices continue to improve, their use in pregnant women in hospital may achieve accuracy criteria. Advancements in CGM technology may also enable features such as rapid glucose fluctuation alerts, which could help mitigate any reduced accuracy at extreme glucose levels. Qualitative research is suggested to explore women’s experiences with inpatient CGM in pregnancy, including impacts on anxiety, their perceived control over glucose management, and maternal sleep quality, by utilizing validated tools.
In conclusion, CGM systems show promise in guiding inpatient antenatal diabetes management and reducing the frequency of capillary glucose testing. Currently, critical management decisions, especially in detection of hypoglycemia, should be based on capillary glucose levels until CGM technology advances.
Footnotes
Acknowledgments
Alison Gebuehr, diabetic educator, Department of Diabetes and Endocrinology, John Hunter Hospital, for her assistance with participant recruitment and follow-ups. Christopher Oldmeadow, Associate Director Data Sciences, Hunter Medical Research Institute.
DTS error grid analysis was conducted using the Diabetes Technology Society software, available at ![]() .
.
The study protocol was approved by the Hunter New England Research Ethics Committee on August 18, 2021 (2021/ETH01402).
This study was registered with the Australian New Zealand Clinical Trials Registry (ACTRN12625000508471).
Authors’ Contributions
Study design and research protocol formulation: N.M., C.R., and K.W. Data curation: N.M. Methodology: All authors. Formal analysis: N.M. and A.S. Supervision: C.R. and K.W. Writing—original draft: N.M. Writing—review and editing: All authors. All authors have reviewed and approved the final version of the article.
Author Disclosure Statement
No competing financial interests exist.
Funding Information
The John Hunter Hospital Charitable Trust Grant (JHH Charitable Trust 2021) provided funding for this study, covering consumables and statistical support.
Abbreviations Used
References
Supplementary Material
Please find the following supplemental material available below.
For Open Access articles published under a Creative Commons License, all supplemental material carries the same license as the article it is associated with.
For non-Open Access articles published, all supplemental material carries a non-exclusive license, and permission requests for re-use of supplemental material or any part of supplemental material shall be sent directly to the copyright owner as specified in the copyright notice associated with the article.