
Abstract
The Venous Excess Ultrasound Score (VExUS) has produced great interest in venous Doppler ultrasound as a noninvasive means to evaluate right heart hemodynamics. While this score includes Doppler morphologies from sub-diaphragmatic veins, the physiology of transcutaneous venous Doppler velocimetry and its change with cardiac pathology was first studied and described in the internal jugular vein (IJV). Over 50 years ago, the systolic and diastolic velocity waves of the IJV were found to describe the x′- and y-descents of the jugular venous pulse (JVP) in sickness and in health. Therefore, it is established that abnormalities in right heart filling and function are reflected in the jugular venous flow velocity (JVFV) profile. In this narrative review, we highlight the physiology of the JVP, its relationship to right heart performance, and, accordingly, its connection with JVFV. Grounded upon decades-old, pioneering investigations, we briefly highlight JVFV in patients with post-cardiopulmonary bypass physiology, atrial fibrillation, pericardial tamponade, and pulmonary hypertension. We then describe a novel, wireless, and wearable Doppler ultrasound that continuously displays JVFV and consider how this device informs diagnosis and therapy of acute circulatory dysfunction. We touch on gaps in knowledge and suggest future avenues of inquiry with special attention paid to synchronous acquisition and interpretation of venous and arterial Doppler measures. We emphasize the clinical relevance of this technology and physiological framework, including acute, inpatient shock resuscitation, volume removal (eg, “de-resuscitation”), and the possibility for chronic, outpatient monitoring.
Plain Language Summary Title
Plain Language Summary
Venous Doppler ultrasound is increasingly used to infer right heart hemodynamics. While the venous excess ultrasound (VExUS) score combines venous Doppler from multiple abdominal veins, historically, the internal jugular vein initiated our understanding of right heart function assessed via Doppler ultrasound of a peripheral vein. We review the basics of the venerable jugular venous pulse examination and how this relates to the central venous pressure and jugular venous Doppler. Finally, we describe a new technology that facilitates internal jugular vein Doppler measurements.
Introduction
Venous Doppler ultrasound is experiencing a renaissance in critical care medicine, largely in response to the recently developed Venous Excess Ultrasound Score (VExUS), first described by our group. 1 The VExUS score quantifies “venous congestion” and comprises 4 veins: (1) the inferior vena cava, as well as (2) the portal, (3) hepatic, and (4) intra-renal veins. These veins were chosen based upon clinical experience in cardiac anesthesiology 2 and data from the congestive heart failure population elaborating the pathophysiology of cardiorenal syndrome.3–5 More specifically, the hemodynamic measure most associated with worsening renal function is elevated central venous pressure (CVP, ie, pressure in the great veins adjacent to the right atrium), not cardiac output or mean arterial pressure.3,6 Therefore, venous Doppler abnormalities transmitted down into the abdominal compartment were the focus of VExUS, and increasing VExUS score associates with kidney dysfunction in multiple populations.7–10 However, VExUS can be time-consuming, requires advanced bedside ultrasound training, and obtaining adequate abdominal windows can be challenging. Furthermore, the visceral focus of VExUS overlooks the clinical history of venous Doppler ultrasound. 11 The earliest applications of venous Doppler were not directed at the abdominal organs, but rather focused on the great veins above the right atrium, ie, the superior vena cava (SVC) and internal jugular vein (IJV).11–13 These great veins were originally of interest because of the venerable jugular venous pulse (JVP) examination and its known abnormalities in cardiac disease.12,13 The JVP is a window to the right heart, which normally keeps venous pressure near zero millimeters of mercury (mm Hg); abnormalities in peripheral venous blood volume and distribution, as well as biventricular load and function, are expressed by changes in the height and contour of the JVP.13,14
In this narrative review, we will describe the relationship between the JVP and right atrial pressure trace and present a brief history of how the IJV was the original transcutaneous target of venous Doppler ultrasound rather than the abdominal veins. We will touch upon pioneering research over the last 60 years, elaborating the relationship between perturbed right heart function and the jugular venous flow velocity (JVFV) measured non-invasively by jugular venous Doppler ultrasound. Finally, we highlight new wearable, ultrasound technology that continuously displays JVFV to nurses and physicians and describe how, with this new tool, clinicians may guide resuscitation and de-resuscitation in a manner that is grounded on individualized hemodynamic phenotypes.
The JVP and Flow Velocity
JVP
The origin of the JVP is the PRA waveform (Figure 1), which is the same as the central venous pressure (CVP) trace. Understanding how PRA changes across the cardiac cycle in health explains the normal and—when there is pathological right heart hemodynamics—abnormal JVFV.12,13
As diastole progresses, PRA gradually rises until atrial contraction, which generates the a-wave. On clinical examination, this is generally difficult to see in the healthy patient, but can become prominent with early RV diastolic dysfunction (ie, stiffening of the RV) causing a clinically significant increase in PRA during atrial contraction.14,21 Atrial relaxation then transiently diminishes the PRA, causing the clinically imperceptible x-descent. 13 With the onset of mechanical systole, the tricuspid valve (TV) closes—observed as the isovolumic contraction (IC) notch in the PRA trace. 15 Immediately following the IC is the c-wave, which, in the JVP, is caused by either carotid pulsation (as described by Mackenzie, see Figure 1B) and/or a transient PRA elevation from the TV bulging into the right atrium. 22 After the c-wave is the x′ (ie, x-prime) descent, which is normally the greatest fall in PRA during the cardiac cycle, due to increased right atrial capacitance when a competent TV is pulled down towards the apex of the RV by normal systolic function.15,23–25 This piston-like “suction” effect was first hypothesized by Aristotle 26 and later by Purkinje in the mid-19th century 15 ; it is a clinical transduction of the TAPSE, or tricuspid annular plane systolic excursion. 13 Another complementary mechanism causing PRA to fall during systole (ie, the x′-descent) is something analogous to the Monro-Kellie hypothesis of the cranial vault, but instead applied to the rigid pericardium. During systole, cardiac volume shrinks more than pericardial volume when blood is ejected into the pulmonary artery and aortic arch. This effectively creates a vacuum within the pericardial sac that is transmitted to the right atrium. 27 The x′-descent may be observed in healthy patients on examination and is best seen between the 2 heads of the sternocleidomastoid muscle with tangential light; it is perceived as a very rapid loss of shadow timed with the radial pulse (ie, during mechanical systole), falling into the second heart sound (S2)—the end of mechanical systole.12,13 PRA rises again as the TV returns upwards towards the cardiac base with ongoing venous return; this pressure increase is the v-wave and is not seen in healthy subjects, but can be with disease, as described above (Figure 1B). 17 When the TV opens, mechanical diastole begins and PRA falls as venous blood deposits into the RV; this is the y-descent. 28 The y-descent, therefore, occurs after the S2 as the radial pulse recoils. It is not usually seen in healthy subjects but may be in hyperdynamic states; thus, a “double descent” seen as 2 rapid shadow disappearances on clinical examination should prompt further evaluation, such as Doppler ultrasound, described below.12,13 PRA then rises again through diastole as the RA is charged with venous blood until the subsequent atrial contraction, or a-wave.
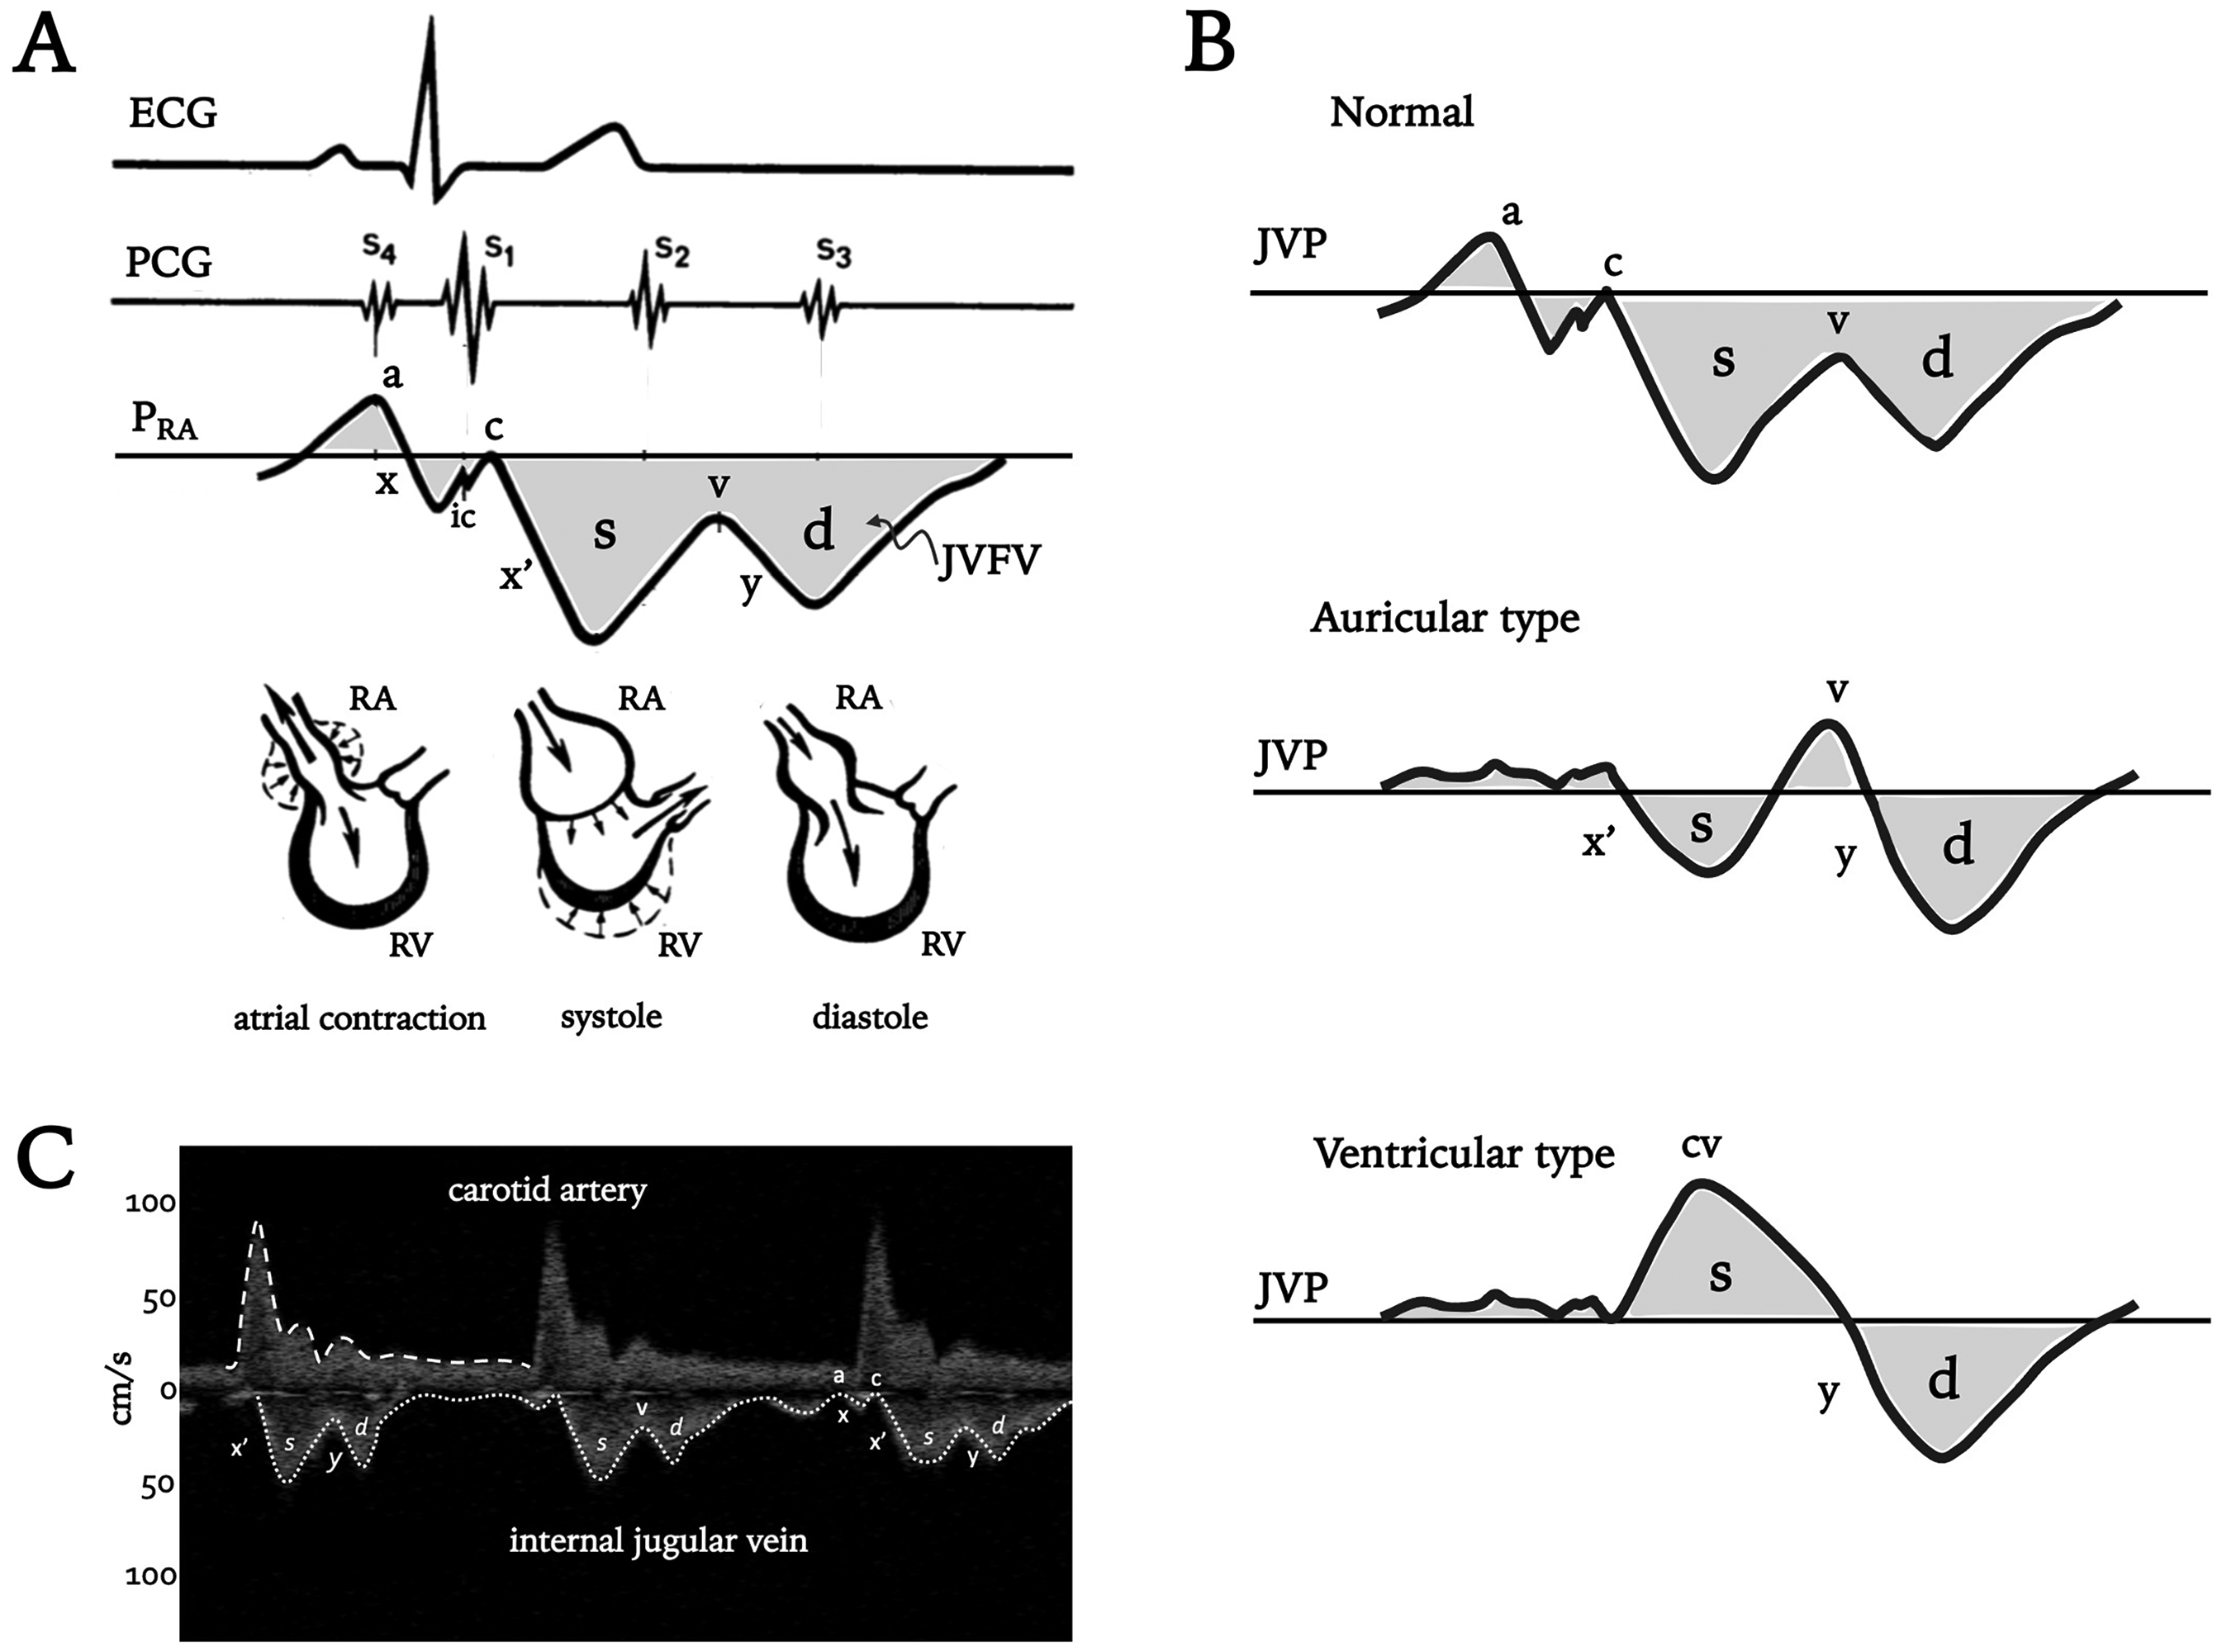
The physiology of the jugular venous pulse (JVP) and jugular venous flow velocity (JVFV).
JVFV
Understanding the JVP is the foundation for interpreting the JVFV. Essentially, flow velocity in a great vein like the IJV is the “negative” of the JVP. More concretely, when PRA rises (eg, a, c, and v-waves), JVFV slows and is directed away from the right atrium (ie, towards the head), and when PRA falls (eg, x, x′, and y-descents), JVFV accelerates, towards the right atrium. Though there is nuance to the physiology of the JVFV considered below, in a healthy subject lying supine, it is normal to see a JVFV minimum near end-diastole (ie, corresponding to the a-wave), followed by a large increase in velocity during systole (ie, the s-wave). The s-wave is caused by both the x-descent (ie, atrial relaxation), but mostly the x′-descent (ie, the TAPSE) as the TV pulls the right atrium open like a piston. Another velocity minimum occurs with the v-wave as systole ends. Subsequently, the TV opens and the y-descent in pressure generates another velocity wave, the diastolic or d-wave. In this way, the JVFV is a Doppler ultrasound transduction of the PRA trace (Figure 1C and Table 1).
Summary of central venous pressure, jugular venous pulse, jugular venous flow velocity, and the venous excess ultrasound scoring system.

Brief History of Venous Doppler Ultrasound
Clinical Doppler ultrasound was first used in the 1950s, 29 though its application to peripheral blood flow analysis did not take shape for another decade with improved gain and filtering 11 ; the earliest peripheral vessels interrogated were the carotid arteries. 11 Then, with the development of bidirectional Doppler in the early 1960s, Kalmanson et al 30 first described venous Doppler in the IJV and related it to the PRA and JVP. It is from their initial report on the jugular vein that all transcutaneous venous Doppler velocimetry is grounded. In addition to delineating the physiology of the JVP examination, the IJV was the target vessel of interest because of its relative ease-of-access; furthermore, pulsed-wave (PW) Doppler for directing ultrasound at deeper, internal vessels was not widely available. 29 In the ensuing years the group of Kalmanson and others elaborated upon the systolic and diastolic velocity waves (ie, “s” and “d” waves) seen in the IJV with various pathologies such as arrythmia, 23 atrial and ventricular septal defects24,25 and they also described the contributions of the x and x′-descent to the venous Doppler s-wave. 15 Following the initial descriptions of JVFV in the early 1970s,15,23–25,30–32 Sivaciyan and Ranganathan 33 offered the first classification system for normal and abnormal venous Doppler morphologies based on the relative magnitude of the systolic and diastolic velocity waves. Their findings form the framework for normal and abnormal venous Doppler patterns in later studied veins (eg, hepatic,34,35 renal, 4 common iliac, 36 and femoral37,38).
Clinical Correlates
In 1978, Sivaciyan and Ranganathan 33 measured transcutaneous IJV Doppler in 174 cardiac patients (mostly ischemic and valvular disease). The JVFV was compared to invasively obtained right heart pressure in 82 patients. Additionally, the JVFV was related to the JVP and, in a subset, invasive SVC Doppler morphologies acquired from the tip of a catheter introduced via the antecubital vein.
In the supine position, an s-wave greater than d-wave (s > d) was normal JVFV, with normal right heart measures and an x′-descent > y-descent JVP (Figure 2). Invasive Doppler from the SVC showed the same pattern with only a slight transmission delay to the IJV. By contrast, s = d, s < d, and monophasic-d JVFV morphologies were all abnormal and corresponded to x′ = y, x′ < y, and solitary y-descent, respectively, in the JVP. All patients with these JVFV patterns had either elevated right heart pressures or were post-cardiac surgery patients. Of note, all patients with monophasic-d had elevated right heart pressures. The authors also considered the presence of retrograde systolic JVFV to be abnormal, and these patients were found to have either A-V dissociation with cannon a-waves or, more likely, significant tricuspid regurgitation (TR). Lastly, end-diastolic retrograde flow in the JVFV (ie, from atrial contraction) was also an abnormal finding and corresponded to high a-wave pressure on right heart catheterization but the great majority also had s > d JVFV suggesting that solitary, persistent end-diastolic retrograde flow could be an early sign of decreased RV compliance but with preserved RV function (ie, normal x′ > y).

Diagram of jugular venous flow velocity (JVFV) classification system proposed by Sivaciyan and Ranganathan. See text for details. Here and in Figure 1, JVFV directed towards the right atrium is downwards on the y-axis, while velocity directed towards the head is upwards on the y-axis. In the supine position, the top pattern (s > d) is normal without persistent retrograde a-waves. Large retrograde a- and v-waves may be seen with the monophasic-diastolic pattern (not displayed here). Retrograde systolic velocity (bottom pattern) typically represents clinically significant tricuspid regurgitation (TR) but can occur in AV dissociation with atrial contraction against a closed tricuspid valve; in the latter, the retrograde systolic velocity is irregular. RA is right atrium; RV is right ventricle; TAPSE is tricuspid annular plane systolic excursion.
Brief elaboration of the JVFV in the following patient populations—post-cardiopulmonary bypass state, atrial fibrillation, cardiac tamponade, and pulmonary hypertension—is warranted, given additional research by Sivaciyan and Ranganathan, and others over the ensuing years.
Post-Cardiopulmonary Bypass
An explication of JVFV in post-cardiac surgery patients was carried out to determine why it was virtually universal for patients to transition from normal (s > d) to abnormal (ie, s = d or s < d) following cardiopulmonary bypass despite ∼40% having normal right heart pressure measured by catheterization.12,13,33,39 The authors concluded that decreased right atrial capacitance, perhaps from right atrial edema, scarring, or changes in pericardial constraint, decreased the x′-descent, increased the y-descent, or both. Of all variables studied, the only significantly different measure between patients with s = d and s < d morphologies following bypass was that the former had higher RV ejection fraction than the latter. 39 This follows the anticipated physiology given that s < d signifies reduced RV function (eg, reduced TAPSE). 13 Another possibility is altered properties of the pericardium following cardiac surgery. Part of the x′-descent is the fall in systolic pericardial pressure as the volume of the heart shrinks more than the pericardium when blood is ejected into the aortic arch. 27
Atrial Fibrillation
In patients with atrial fibrillation, the most common JVFV patterns were retrograde systolic flow (ie, due to TR), monophasic d-wave morphology, and s < d.18,33,39 The latter pattern illustrates that the loss of atrial kick does not completely abolish the RV Starling mechanism as some patients still had a perceptible x′-descent (ie, s-wave). Without coordinated atrial contraction, the right atrium remains full at the expense of the RV. Consequently, with decreased RV preload, systolic TV excursion is diminished and s < d is observed. These results were echoed in a follow-up study focused only on patients with pulmonary hypertension, where patients with atrial fibrillation displayed only s < d or monophasic-d JVFV. 18
Pericardial Tamponade
Pericardial tamponade characteristically displays very low jugular venous velocity that is confined to systole (ie, s-wave only) and during inspiration. 33 When there is tamponade physiology, the RV is restricted throughout diastole such that the y-descent is abolished. In general, it is very hard to measure JVFV during pericardial tamponade, though Sivaciyan and Ranganathan captured this data in 3 such patients. In accord with these observations, we have previously reported on JVFV during pericardial tamponade using a wearable Doppler device described below. 40
Pulmonary Hypertension
Finally, in pulmonary hypertension, ∼90% of patients had some JVFV abnormality, including persistent, reverse end-diastolic flow (ie, retrograde a-wave), s = d, s < d, and monophasic-d. 33 The latter 2 abnormalities were observed in ∼50% of the patients. A subsequent, observational study revealed similar JVFV abnormalities with clinical congestive heart failure only seen in patients with abnormal JVFV (especially s < d or monophasic-d patterns). 18 Progression of abnormal JVFV was also described in a patient over the course of a few years. Initially, there was s > d with persistent retrograde a-waves, indicating decreasing right atrial and ventricular compliance (ie, early RV diastolic dysfunction) but with preserved RV systolic function (ie, normal x′-descent or s-wave). Over time, the y-descent increased and x′-descent decreased, leading to s = d with worsening RV diastolic and systolic function. Finally, with RV dilation and TR, retrograde systolic flow with monophasic-d waves was seen.18,32 These observations are quite similar to the progression described by Mackenzie in 1907, but by using only the JVP (Figure 1B). In 2001, Matsuyama et al 41 expanded upon the aforementioned by recording JVFV in 64 patients with chronic obstructive pulmonary disease being worked up for pulmonary hypertension. 42 The authors were especially interested in jugular venous Doppler because non-invasive echocardiographic methods to estimate pulmonary pressure can be limited by chest hyperinflation. They found that falling s-wave relative to d-wave (ie, x′-descent relative to y-descent) was directly proportional to mean pulmonary artery pressure (MPAP) measured by right heart catheterization in a strong, linear manner. Using s < d as a cut-off (ie, a d-wave to s-wave ratio of at least 1.0), they found a 71% sensitivity and 95% specificity for diagnosing pulmonary hypertension (ie, MPAP of at least 25 mm Hg on catheterization). This ratio was more specific than echocardiography using TR jet to estimate pulmonary artery systolic pressure; furthermore, 88% of patients had an adequate echocardiography window, while all patients had an adequate jugular venous Doppler window.
New Technology and Future Investigation
A wireless, wearable, continuous wave Doppler ultrasound that insonates both the common carotid artery and IJV has recently been developed for resuscitation (Figure 3).19,20,43,44 One unique aspect of this device is that it continuously displays the JVFV as a surrogate for right heart hemodynamics in addition to carotid artery measures to infer left heart function. 45 We were the first to describe the synchronous assessment of venous and arterial Doppler measures as the “Doppler Starling curve,” which is especially useful when performing a preload challenge such as a rapid fluid infusion, Trendelenburg maneuver, or passive leg raise (PLR). 46 For instance, we described a patient in whom serial fluid boluses improved forward arterial flow (as observed in the common carotid artery) but caused the JVFV to progress from s > d to s < d, indicating early RV dysfunction with preload. 47 Conversely, we also showed that patients with normal baseline right heart hemodynamics per JVFV can rapidly develop venous hypertension with additional preload,47,48 a state termed “dynamic fluid intolerance,”49–52 given that physiological harm by preload is only evidenced by a dynamic maneuver like the PLR. As an expansion of the Doppler Starling curve framework, we have described Doppler ‘quadrants’ to phenotype hypo-perfused patients 48 with venous-arterial Doppler-enhanced resuscitation (VADER 53 ) to direct therapy. Recently, a team of highly trained nurses proficient in point-of-care ultrasound have integrated the wearable Doppler into their workflow for early sepsis care. 54 Nevertheless, the wearable Doppler ultrasound does require training as users learn how to obtain a good Doppler window for both the common carotid artery and internal jugular vein, ensuring adequate flow velocity spectrograms for both vessels. As well, the device, like any ultrasound system, is susceptible to patient motion and artifact (eg, vocalization).

The wireless, wearable Doppler ultrasound:

The Importance of Gravitational Position and Starling Resistors
One important finding from the wearable Doppler is the presence of “continuous” and “pulsatile-fused” JVFV morphologies, 55 which were not described by Sivaciyan and Ranganathan in their original classification scheme, though these morphologies are observed in other veins such as the intra-renal vein. 5 In healthy volunteers, we found the s > d morphology to be normal, but only in the supine position. When healthy volunteers are upright or in semi-Fowler, a “continuous” or “pulsatile-fused” morphology is ubiquitously seen. 55 In one subject, we showed that the transition from “continuous” in the upright position to s > d in the supine position occurred because of changes in the position of the jugular vein collapse point, which is a Starling resistor, or when an elastic tube varies its cross-sectional area as a function of its internal pressure relative to external pressure (ie, the transmural, or “across the wall,” pressure). When there is a jugular venous Starling resistor (ie, the point at which atmospheric pressure around the neck supersedes the jugular pressure), the jugular vein collapses, which is sometimes termed the jugular “meniscus” on b-mode imaging.56,57 This anatomy and physiology are commonly taught to appear like a “wine bottle” in the jugular vein; above the collapse point is the “neck,” while below the collapse point is the “body” of the wine bottle. When the wearable Doppler ultrasound insonates above the collapse point (ie, the bottleneck), a “continuous” or “pulsatile fused” JVFV is observed, whereas if insonation is below the collapse point (ie, the body), then one sees the morphologies described by Sivaciyan and Ranganathan. In this manner, when a continuous morphology is present, the CVP can be assumed to be less than the height of the wearable Doppler above the right atrium. Conversely, if a pulsatile morphology is observed (eg, s > d, s = d, s < d, or monophasic-d), then the CVP can be assumed to be greater than the height the wearable Doppler is above the right atrium (Figure 4). Given this, when we dichotomized preload based upon JVFV into “low” versus “high,” we placed s > d into the “high” category but only when the reading is made with a patient semi-recumbent or upright position.47,48 When supine, s > d is normal. Furthermore, only the IJV reliably discerned high from low preload (based upon gravitational position) as compared to the hepatic, portal, and intra-renal vein morphologies in healthy volunteers. 55 Concordant with this finding, in a small case series of patients with left ventricular assist device (LVAD) who had IJV Doppler measured by the wearable ultrasound, 58 the one patient with a pulsatile IJV pattern required up-titration of diuretics within 6 weeks of assessment, while those with continuous morphology did not.

Illustration of the internal jugular vein in the longitudinal view. The internal jugular vein is outlined in red, and the direction of venous return from the head to the right heart is shown by the light blue arrow. Three different Doppler ultrasound beam levels describe the relationship to jugular venous flow velocity.
Future Directions
In terms of future research, the JVFV pattern lacks patient outcome data as VExUS does (eg, acute kidney injury risk, ICU length of stay, etc). Accordingly, we wonder if the JVFV pattern can predict organ dysfunction (eg, acute kidney injury, delirium, etc) better than the central venous pressure in post-cardiac surgery or septic patients? Might this apply to outpatients with disorders of blood volume (eg, chronic kidney disease, pulmonary hypertension, congestive heart failure, cirrhosis, etc)? It may be tempting to relate IJV morphology to PRA as a research project. 8 On face value, this may seem appropriate; however, caveats should be considered. For instance, changes in pericardial or right atrial capacitance (as occur in the post-cardiopulmonary bypass state) mean that an abnormal JVFV morphology can occur with normal right heart filling pressure, especially if there is reduced RV function, as Sivaciyan and Ranganathan have already established.12,13,33,39 This simply emphasizes the point that PRA occurs at the crossroads of cardiac function and venous return.59,60 A euvolemic or hypovolemic patient with abnormal RV function could have a normal PRA but an abnormal JVFV pattern. A better comparison with PRA would be to establish the height above the right atrium at which a continuous JVFV transitions into discernible s- and d- waves. Another caveat, and in a similar vein, would be comparing JVFV to PRA in the setting of high pericardial pressure that occurs when there is tamponade or high levels of positive end-expiratory pressure (PEEP). In this situation, there could be a very high PRA relative to atmospheric pressure (to which transducers are leveled) but diminished right atrial transmural pressure, which is the PRA relative to the pericardial pressure. 59 When the right atrium is restricted from without, the y-descent is abolished. In this regard, a high PRA will not be seen in association with a rising d-wave relative to s-wave. Jugular venous velocities will be reduced because of jugular vein distension and only systolic velocities are present, generally when intrathoracic pressure falls (eg, during spontaneous inspiration).12,13,33 Finally, we propose that venous Doppler ultrasound to assess hemodynamics should always occur in the context of concurrently measured arterial Doppler ultrasound so as to integrate “congestion” and “perfusion” metrics simultaneously.43,44,46,48,51,53 In this regard, future study of Doppler phenotypes akin to the original Diamond-Forrester framework 51 will better direct diagnosis and therapy of acute and chronic circulatory failure (Figure 5). Multi-center, prospective studies relating Doppler phenotypes (ie, “quadrants”) to patient outcome are needed, and retrospective machine learning driven algorithm development to predict outcome from changes in the venous-arterial Doppler signals during sepsis resuscitation is underway.

Illustration of venous-arterial enhanced Doppler resuscitation (VADER) and the Doppler Starling curve. In the baseline, semi-recumbent position, 2 patients can begin with a similar hemodynamic profile, indicating low/normal right heart filling assessed by jugular venous flow velocity (x-axis) and stroke volume (SV, y-axis); this is the yellow point in quadrant 3. The provision of intravenous fluids to these 2 patients leads to very different hemodynamic responses. Patient A has the desired response moving upwards to quadrant 1; that is, there is little change in right heart filling but a large increase in SV (green dot). By contrast, patient B has an undesirable response revealing abnormal right heart filling with little increase in SV, moving out to quadrant 4 (red dot). Patient B illustrates “dynamic fluid intolerance.”
Conclusion
Venous Doppler ultrasound is an exciting and emerging measure in acutely ill patients to assess right heart hemodynamics. While veins below the right atrium have been of interest because of the VExUS score, the vein in which venous Doppler morphology was first studied and understood was the internal jugular vein; this is because of historical clinical interest in the jugular venous pulse. The systolic and diastolic velocity waves seen in the IJV follow the x′- and y-descents of the JVP (ie, the right atrial pressure waveform). Because it is established that JVFV mirrors right heart hemodynamics from pioneering investigations conducted over 40 years ago, JVFV can presently be integrated into clinical decision-making with simple, continuous wave Doppler ultrasound. New wearable technologies make JVFV more accessible to physicians and nurses who can incorporate this data into both the resuscitation and de-resuscitation of acutely and chronically ill patients. Physiological frameworks such as the Doppler Starling curve and VADER should be used to direct future investigation of JVFV patterns on patient outcome and inform interventional studies.
Footnotes
List of Abbreviations
Acknowledgments
Not applicable.
Author contribution(s)
Availability of data and materials
Not applicable.
Consent to participate
Not applicable.
Consent for publication
Not applicable.
Declaration of conflicting interests
The author(s) declared the following potential conflicts of interest with respect to the research, authorship, and/or publication of this article: JESK is the co-founder and chief medical officer of Flosonics Medical; no other interests are declared.
Ethics approval
Not applicable.
Funding
The author(s) received no financial support for the research, authorship, and/or publication of this article.