
Abstract
The potential for nonlinear ‘surprises’ in the climate system has been recognised since the 1960s. One such nonlinearity is a tipping point: when change in a system becomes self-sustaining once forced passed a threshold, triggering a state shift that is often abrupt and irreversible. Research on climate tipping points has flourished since 2005, recently culminating in the release of the Global Tipping Points Report at COP28 and calls for targeted assessment by the Intergovernmental Panel on Climate Change. Here I summarise progress in our growing understanding of climate tipping points and reflect on their implications for climate action and the outlook for future research.
Main
One of climate science's clearest findings is the near-linear relationship between carbon dioxide emissions and global warming (IPCC, 2021), allowing remaining carbon budgets for temperature targets to be calculated (Lamboll et al., 2023). However, while robust, this linear picture at the global, nearer-term scale masks the possibility of nonlinear climate change at sub-global or longer-term scales.
Concern about nonlinear ‘surprises’ in the climate system emerged in the 1960s, spurred by the discovery of abrupt shifts during past glacial episodes in ice and sediment cores (Broecker, 1987; Dansgaard et al., 1969, 1993; Oeschger et al., 1984; Stocker et al., 2024). This was reflected by simple climate models, which provided a mechanism for growing (but not unequivocal) palaeoclimate evidence that the Atlantic Meridional Overturning Circulation (AMOC) has switched between strong and weak modes (Stocker and Wright, 1991; Stommel, 1961). Asymmetrically abrupt Pleistocene glacial/interglacial cycling in these records, along with the substantial climate response to weak orbital forcing, also indicated nonlinearity, with dynamical systems theory suggesting these result from one or more climate system equilibria allowing either free oscillations or bifurcations between alternative stable states (Benzi et al., 1982; Crucifix, 2012; Ghil and Le Treut, 1981: 81; Paillard, 1998; Saltzman and Verbitsky, 1993).
The publication of ‘The Tipping Point’ (Gladwell, 2000) popularised a new metaphor for nonlinearity, which by 2005 was increasingly adopted by climate scientists (Russill, 2008, 2015). While initially borrowed as an analogy to highlight the underappreciated possibility of climate nonlinearity, the term was formalised within natural sciences as a useful model for particular phenomena, acting as a ‘generative metaphor’ (Russill and Nyssa, 2009). Pivotal to this was a 2005 workshop at the British Embassy in Berlin, leading to the seminal first assessment of climate tipping points (Kriegler et al., 2009; Lenton et al., 2008). Lenton et al. (2008) defined tipping points as ‘a critical threshold at which a tiny perturbation can qualitatively alter the state or development of a system’ and identified nine parts of the climate system (termed ‘tipping elements’) hypothesised to feature tipping points triggerable by human activities this century and playing out within 1000 years. In this definition, adapted and adopted by several assessments (Armstrong McKay et al., 2022; Lenton et al., 2023), the core characteristic of tipping is a self-sustaining state shift with change beyond the threshold independent of the initial driver (Figure 1) (van Nes et al., 2016). Not all definitions follow this though, with others focusing specifically on catastrophic bifurcations (Scheffer et al., 2009) or maintaining a ‘Gladwellian’ definition centring abruptness (Kopp et al., 2016; Wang et al., 2023).
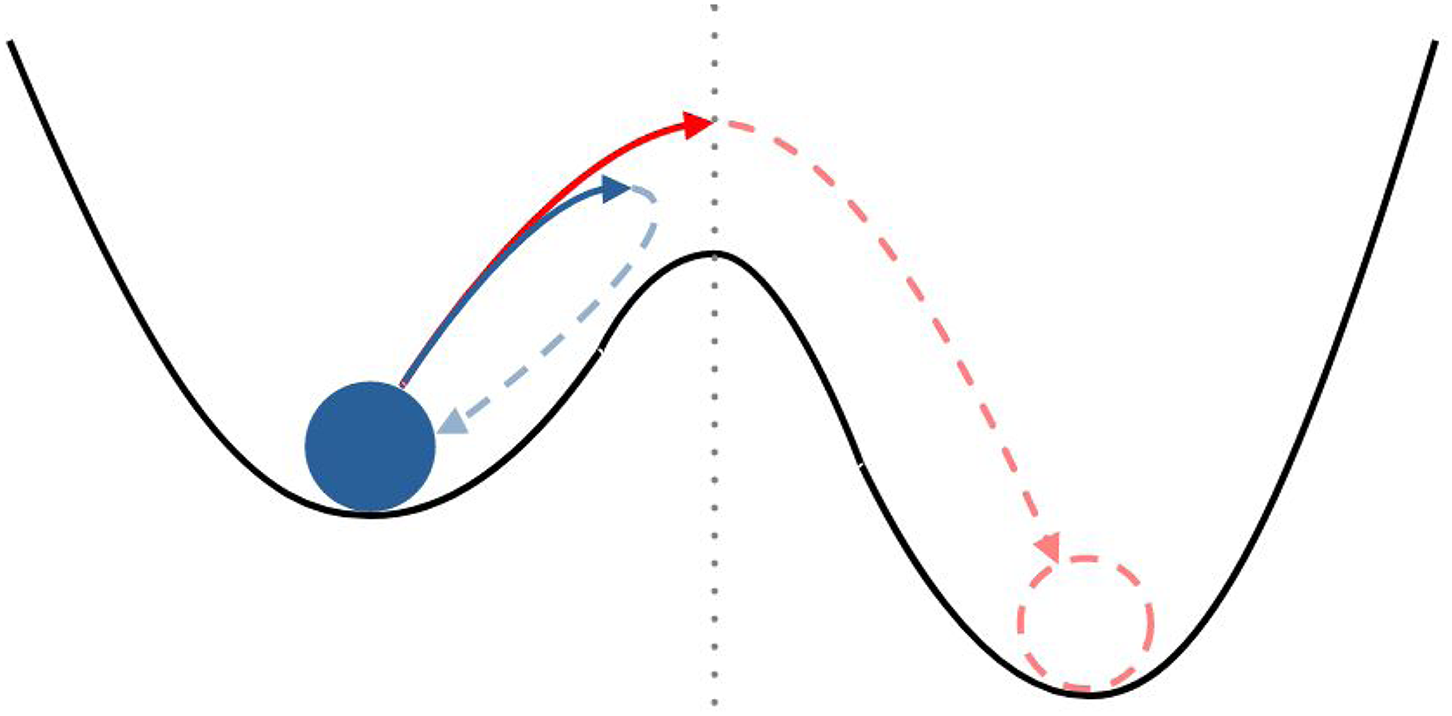
Schematic illustrating an analogy for a tipping point in a bistable system, following the definition of Lenton et al. (2008) and many (but not all) subsequent assessments (Armstrong McKay et al., 2022; Lenton et al., 2023; van Nes et al., 2016). Each valley represents a potential stable state for the system, with the system currently in the left-hand state (represented by the filled ball). The system's current state is then perturbed by a force pushing to the right: if the force is insufficient (solid shorter arrow) for the ball to reach the threshold between the valleys (vertical dotted line) the ball will return to its initial state (dashed shorter arrow), but if the ball reaches the threshold (longer solid arrow) the ball will carry on rolling in to the next valley (dashed longer arrow and ball) even if the original force were removed. The shallower left-hand valley represents this state being less resilient than the right-hand state, as it takes less force to escape from - as a state loses resilience or the system is forced closer to a threshold, it is expected that the system will exhibit ‘critical slowing down’ detectable in its noise, suggesting that tipping may be imminent (Dakos et al., 2024; Scheffer et al., 2009).
Nonlinear phenomena like abrupt climate change, multiple equilibria, and climate ‘surprises’ made their way into the first Intergovernmental Panel on Climate Change (IPCC) reports in the 1990s, receiving explicit attention in 2007's AR4 (Stocker et al., 2024). IPCC AR6 focused in more detail on tipping points, defining them as ‘a critical threshold beyond which a system reorganizes, often abruptly and/or irreversibly’ (Chen et al., 2021), and sometimes also as a class of abrupt change where ‘the subsequent rate of change is independent of the forcing’ (Lee et al., 2021). In practice, AR6 used abruptness and irreversibility as proxies for tipping dynamics, identifying several candidate tipping points, but did not differentiate them from threshold-free irreversible processes or reversible abrupt changes, and did not systematically explore potential tipping thresholds, timescales, and impacts (Chen et al., 2021; Ranasinghe et al., 2021).
A more systematic assessment was undertaken by Armstrong McKay et al. (2022), who synthesised evidence of potential tipping dynamics from models, observations, palaeorecords, and theory from over 200 studies published since Lenton et al. (2008). They identified 16 tipping elements, defined as featuring self-sustaining state shifts beyond a global warming threshold with substantial human or Earth system impacts (Figure 2). Synthesis estimates for these thresholds indicated that five elements were already above their minimum estimate (making tipping ‘possible’) with current global warming of ∼1.2°C, and four elements would reach their central estimates (becoming ‘likely’) beyond 1.5°C: the Greenland and West Antarctic ice sheets, widespread localised abrupt permafrost thaw, and warm-water coral reef die-off. This reflects a fall in many elements’ threshold estimates since Lenton et al. (2008) when most were estimated around 3°C to 5°C above 1980 to 1990 warming. The element categorisations were largely echoed by Wang et al. (2023), who also used a simple model to project tipping points causing marginal additional warming by 2100, potentially contrary to their proposed role in a ‘Hothouse Earth’ trajectory (Steffen et al., 2018). Armstrong McKay et al. (2022) did not include the effects of interactions between tipping points though, which could affect warming thresholds and potentially allow tipping to ‘cascade’ from one element to another (Klose et al., 2021; Wunderling et al., 2021).
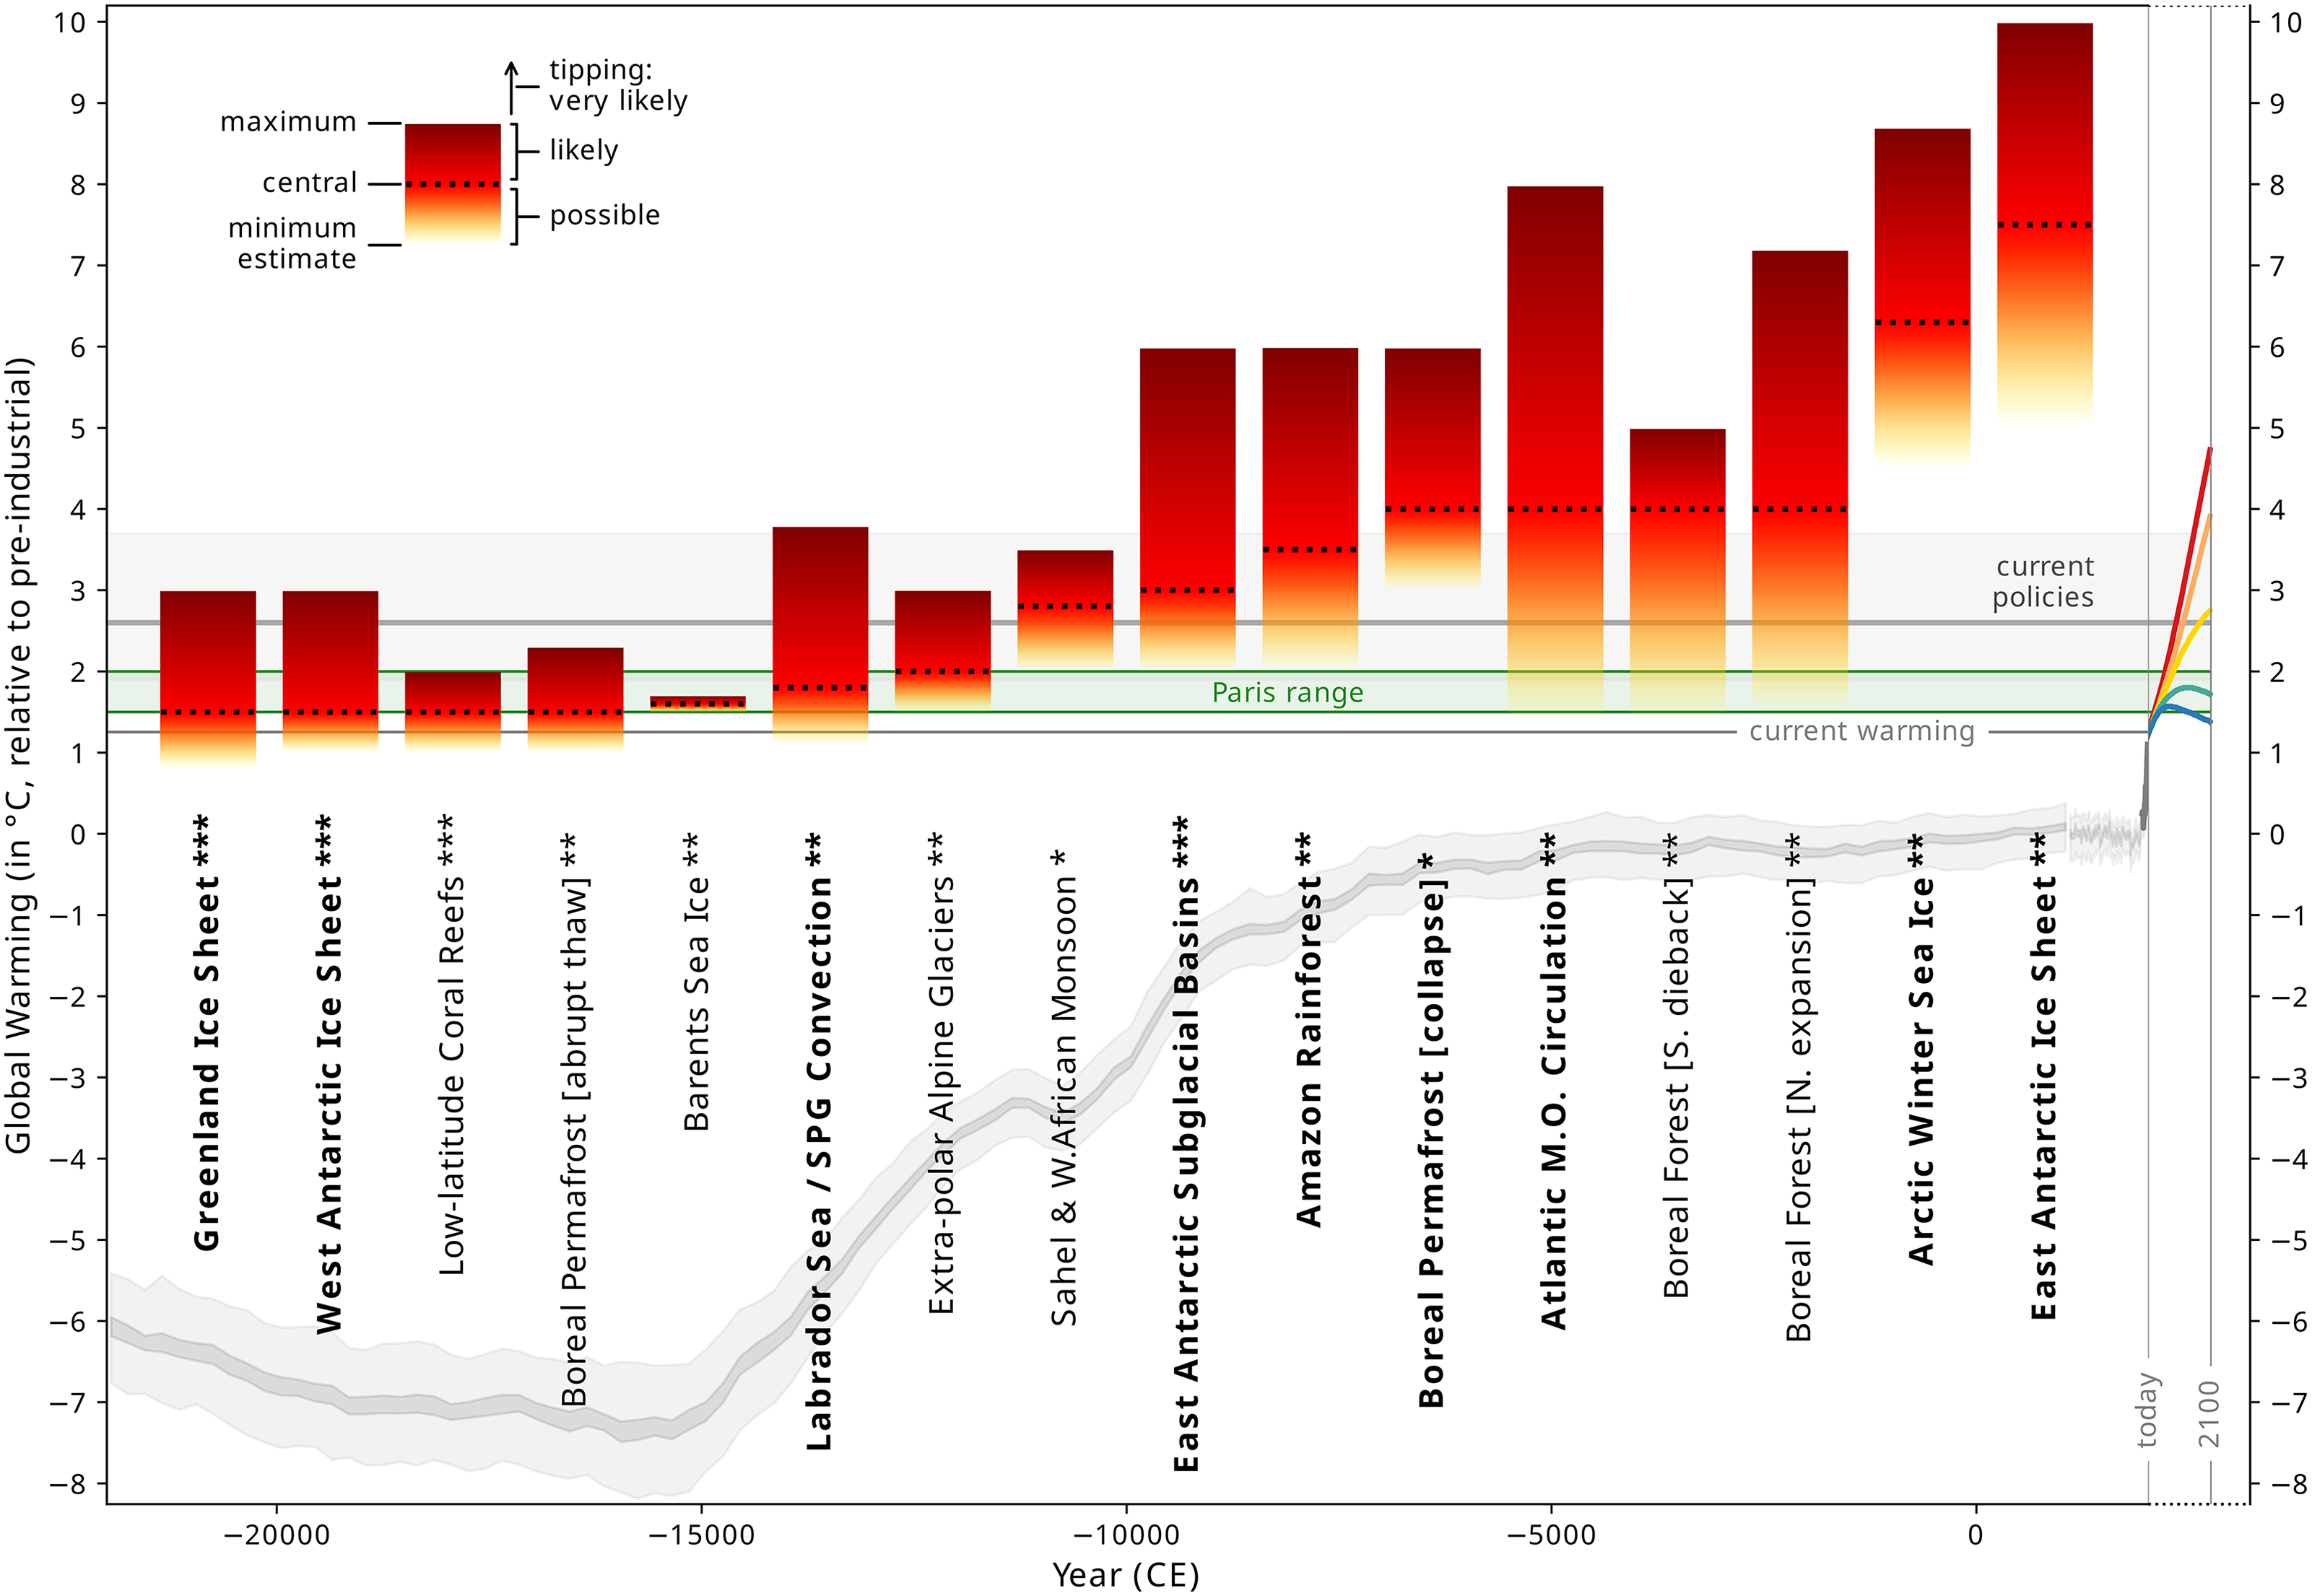
Graph illustrating synthesis global warming threshold estimates for the 16 climate tipping elements defined by Armstrong McKay et al. (2022). The “burning ember” for each element runs from the minimum warming threshold estimate identified from the literature (lighter), through the central estimate (dotted black line) up to the maximum estimate (darker). Note that tipping is not projected to occur precisely at the central estimate: tipping of each element becomes more likely with each fraction of warming up each ember, with tipping deemed to be “possible” beyond the minimum estimate and “likely” beyond the central estimate in Armstrong McKay et al. (2022), but may happen at any level. On the right, future warming scenarios by 2100 from IPCC AR6's Shared Socioeconomic Pathways are shown for context (lowest, SSP1-1.9; low, SSP1-2.6; middle, SSP2-4.5; high, SSP3-7.0; highest, SSP5-8.5) (Lee et al., 2021), along with horizontal lines showing the Paris Agreement range (1.5-<2°C), and as of 2022 the current warming (∼1.25°C) (Betts et al., 2023) and projected warming by 2100 with current policies (central estimate ∼2.7°C, shaded uncertainty range) (Meinshausen et al., 2022). Also shown for context is a reconstruction of global temperatures since the Last Glacial Maximum (bottom curve with shaded uncertainty) (Osman et al., 2021). Bolded tipping element names indicate those designated as “global core” elements by Armstrong McKay et al. (2022), the tipping of which would affect the overall qualitative state of the Earth system, and unbolded names as “regional impact” elements, which if tipped would not affect the whole Earth system but would still have substantial impacts. Asterisks by each name indicate the confidence level in that system featuring tipping dynamics from Armstrong McKay et al. (2022), with *** indicating high confidence, ** medium confidence, and * low confidence. Image adapted from Armstrong McKay et al. (2022). Reprinted with permission from AAAS.
The latest assessment came with the Global Tipping Points Report published at COP28 (Lenton et al., 2023). With an expanded remit including anthropogenic drivers beyond climate change, evidence for tipping dynamics was found for 26 parts of the Earth system (Armstrong McKay and Loriani, 2023). While drylands, savannahs, and mangroves were added as potential tipping systems, others by Armstrong McKay et al. (2022) were judged to be less plausible, including Arctic sea ice and wider-scale permafrost collapse (the latter echoed by Nitzbon et al. (2024)). A review of tipping point interactions concluded that most are destabilising in nature (Wunderling et al., 2023a, 2024). The prospects for ‘early warning signals’ were also examined (Boulton et al., 2023), finding several systems including the AMOC, Amazon rainforest, and Greenland Ice Sheet with evidence of ‘critical slowing down’ (Boers, 2021; Boers and Rypdal, 2021; Boulton et al., 2022) consistent with (but not conclusively demonstrating) a tipping point approaching (Dakos et al., 2024; Scheffer et al., 2009).
Passing tipping points would have substantial impacts, with under-explored societal implications (Betts et al., 2023b). While slow on human timescales, ice sheet collapse would lock in up to 12 metres of sea level rise from Greenland and West Antarctica over the coming millennia (Winkelmann et al., 2023). This would accelerate sea level rise this century, with Antarctic instability under RCP4.5 estimated to expose 120 million more people to annual floods by 2100 (Kulp and Strauss, 2019). Abrupt thaw could double permafrost's contribution to warming (Turetsky et al., 2020; Winkelmann et al., 2023), while 70% of permafrost region infrastructure lies in areas with high thaw potential by 2050 (Hjort et al., 2022). Amazon dieback would lead to additional regional warming and drying in South America (Armstrong McKay et al., 2023; Hirota et al., 2021), exposing more than 6 million people to extreme heat stress under RCP4.5 (de Oliveira et al., 2021). AMOC and to a lesser degree subpolar gyre (SPG) collapse would trigger substantial regional cooling and drying and disrupt tropical monsoons (Loriani et al., 2023a), substantially reducing many region's crop yields (OECD, 2022). In Britain, for example, AMOC collapse-induced cooling and drying could make arable agriculture impossible without prohibitively expensive irrigation (Ritchie et al., 2020).
Tipping points therefore have major implications for climate mitigation, adaptation, and governance. The increasing likelihood of tipping with global warming, in particular beyond 1.5°C, underlines the importance of the Paris Agreement targets of limiting warming to 1.5°C or well below 2°C (Milkoreit et al., 2023a, 2024), which would also reduce harm from many other climate impacts (IPCC, 2018) and facilitate adaptation (IPCC, 2022). There are calls for tipping points to explicitly feature in the United Nations Framework Convention on Climate Change process (Milkoreit et al., 2023a), along with systematic assessment within the next IPCC cycle (despite the decision against a specific Special Report) (Stocker et al., 2024; Wood et al., 2023). Many tipping points – particularly in the biosphere – also have important co-drivers, for example, deforestation and degradation in the Amazon, or pollution in coral reefs. Reducing these non-climate drivers and supporting sustainable and inclusive land practices could help improve the resilience of these systems and reduce the likelihood of climate-induced tipping (Milkoreit et al., 2023a).
Given some climate tipping points may be passed at or below 1.5°C though, tipping cannot be ruled out even if the Paris Agreement is met. Climate adaptation plans therefore need to consider plausible high-impact events like tipping points, even if their likelihood is deemed low (Wood et al., 2023). In many regions, this raises the prospect of planning for divergent climate futures. In Britain for example, while standard climate projections are for a warmer future with similar but more seasonal rainfall, AMOC (and likely SPG) collapse means a colder and much drier future is also plausible (Ritchie et al., 2020). This contrast highlights the importance of resilience-building efforts in climate adaptation that prepare for multiple outcomes (Constantino et al., 2023).
Many open research issues remain on climate tipping points. The synthesis threshold estimates in Armstrong McKay et al. (2022) remain in most cases highly uncertain, with low confidence in several (Figure 2). Further model development to include the finer-scale processes often critical for resolving tipping dynamics, such as small-scale ocean mixing, extreme event effects on vegetation, or Antarctic–Southern Ocean interactions, would help reduce this uncertainty (Armstrong McKay and Loriani, 2023), but due to the nature of complex systems, some uncertainty will remain irreducible. Tipping point impacts remain a considerable knowledge gap, with the regional scale information most relevant to policymakers particularly lacking (Milkoreit et al., 2023b). While model development, application, and inter-comparison (Loriani et al., 2023b) as well as new observations and palaeorecords can help, this could take many critical years. A storylines approach – in which physically consistent scenarios are used to explore all plausible outcomes rather than just the most likely (Shepherd, 2019; Wood et al., 2023) – is a promising alternative for generating actionable knowledge on tipping points despite model limitations and deep uncertainty.
The effect of interactions and overshooting 1.5°C on tipping points are also emerging topics, with a stylised network model indicating that both the degree and length of overshoot increase the risk of tipping and cascades (Möller et al., 2024; Wunderling et al., 2023b), but analysis using more complex models is lacking. Early warning signals could be more robust through the appropriate use of the growing volume of remote sensing data, identifying the best places and variables to monitor using models and leveraging machine learning (Boulton et al., 2023; Dakos et al., 2024). Recent attempts to use such signals to project when the AMOC may tip (Ditlevsen and Ditlevsen, 2023; Smolders et al., 2024) have been critiqued though as being too uncertain to usefully extrapolate (Ben-Yami et al., 2024; van Westen et al., 2024). Early warnings may also be seen to motivate targeted geoengineering to prevent tipping, but while models suggest that ‘Solar Radiation Management’ could hypothetically prevent warming threshold exceedance, substantial uncertainties remain (Futerman et al., 2023; Milkoreit et al., 2023a).
While tipping points research progresses, the concept is not without debate. One recent critique (Kopp et al., 2024) posits that tipping points are not consistently defined, particularly across disciplines, oversimplify uncertain and complex systems, and are not useful for motivating climate action or policy, instead encouraging fatalism (Bellamy and Hulme, 2011) or risky interventions (Kornbech et al., 2024). Tipping definitions vary widely (Armstrong McKay et al., 2022) and are often misapplied, but this does not in and of itself invalidate their usage as a useful scientific construct when applied and communicated clearly. Despite fatalism being a risk (although surveys show mixed effects; Bellamy, 2023; Formanski et al., 2022; Nadeau et al., 2024), an accurate portrayal of what we do and do not know about tipping points can help underline the importance of the Paris Agreement targets. Discussion should foreground tipping's complex dynamics and often considerable uncertainty, while emphasising that every fraction of warming avoided reduces the likelihood of tipping points even if some are reached (Armstrong McKay, 2022), which highlights the value of precaution in the face of deep uncertainty. Overall, while inevitably limited as simplified models of highly complex reality, tipping points have shown their utility as a concept in focusing attention on and generating new understanding of the phenomenon of self-sustaining changes in the climate system, and used with sufficient care can continue to motivate both research and action.
Footnotes
Acknowledgements
I would like to thank Rob Bellamy for the invitation to write this article for the inaugural issue of Dialogues on Climate Change, and to all my colleagues in the Global Tipping Points Report, Earth Commission, Earth Resilience in the Anthropocene project, LOOPS workshops, and beyond for productive collaborations and discussions on tipping points.
Author contributions
All aspects of this manuscript were undertaken by DIAM.
Data availability
No new data was generated or used for this manuscript.
Declaration of conflicting interests
The author declared no potential conflicts of interest with respect to the research, authorship, and/or publication of this article.
Funding
The author received no financial support for the research, authorship, and/or publication of this article.