
Abstract
We present an initial investigation into the performance of a multicollector inductively coupled plasmamass spectrometer equipped with a pre-mass filter (Neoma MC-ICP-MS/MS) for making plutonium (Pu) isotope ratio measurements on solutions containing low level (i.e., pg mL–1) Pu concentrations. This assessment was achieved by comparison of the 240Pu/239Pu, 241Pu/239Pu, and 242Pu/239Pu ratios attained over a one month period on the MC-ICP-MS/MS with the long-term (∼1 year) performance observed on the predecessor MC-ICP-MS (Neptune Plus) instrument each equipped with an equipped with an APEXΩ desolvating nebulizer for repeated measurements of certified reference materials from New Brunswick Program Office (NBL PO) CRM 136a and CRM 137. The MC-ICP-MS/MS performance of repeated measurement of CRM 136a (n = 20) resulted in mean values of 240Pu/239Pu = 0.1448 ± 0.0006, 241Pu/239Pu = 0.00371 ± 0.00006, and 242Pu/239Pu = 0.00682 ± 0.00006 (k = 2). The CRM 137 (n = 20), analyzed during the same analytical sessions, produced mean values for 240Pu/239Pu = 0.2414 ± 0.0006, 241Pu/239Pu = 0.00464 ± 0.00007, and 242Pu/239Pu = 0.0157 ± 0.0001 (k = 2). These results closely align with the certificate values for CRM 136a and CRM 137 and are within the k = 2 envelopes defined by the long-term performance of the traditional MC-ICP-MS approach (Neptune Plus). Examination of the performance of the various Pu isotope ratios as a function of total Pu content revealed accurate results (<3% relative difference, or RD) above ∼50 fg total Pu. The results presented here demonstrate the capability of the MC-ICP-MS/MS making accurate and precise low level Pu isotopic measurements. While the intent of this work was not to investigate the functionality of the collision cell, the pre-mass filter was employed. Future studies are warranted to investigate the entire capability of the MC-ICP-MS/MS collision cell and pre-cell mass filter optimization for performing low level Pu isotope measurements, even in mixed matrix samples.
This is a visual representation of the abstract.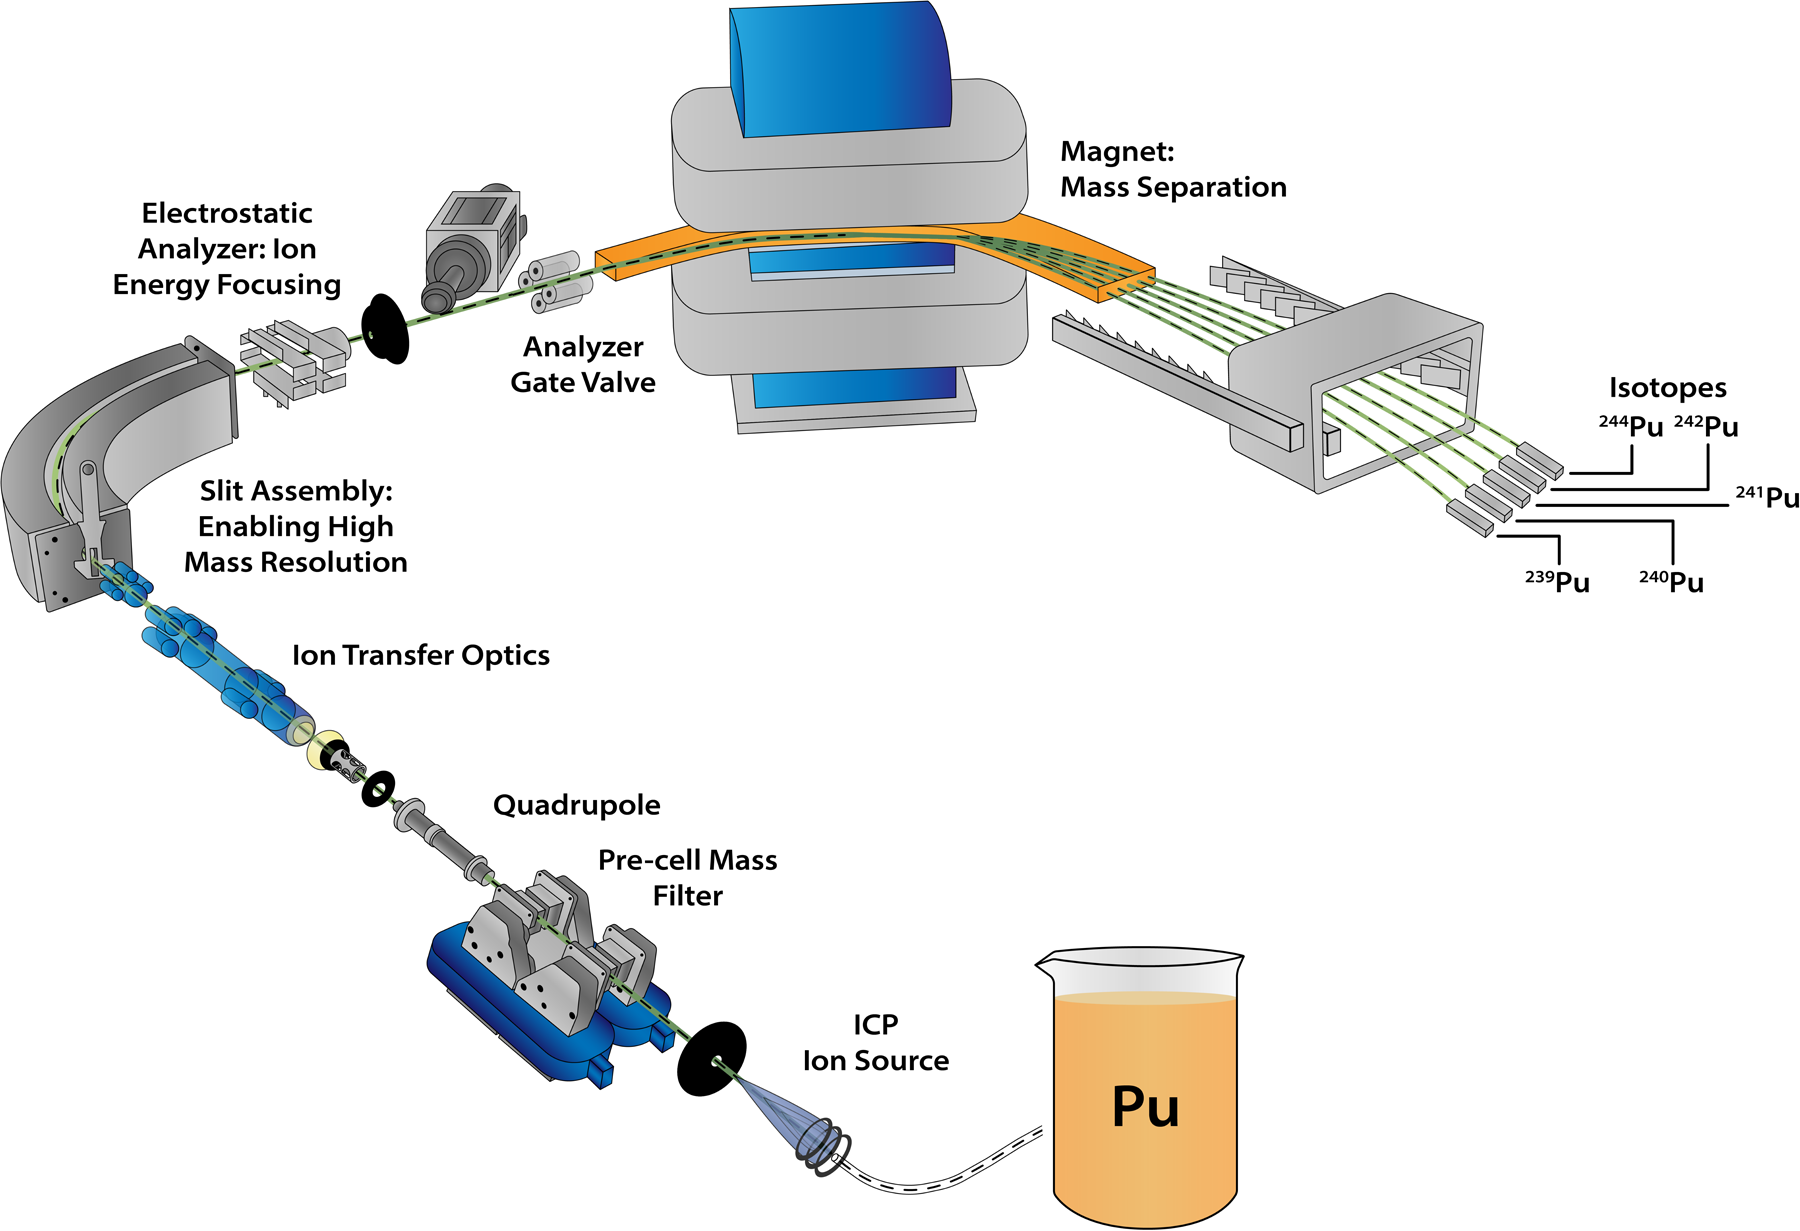
Keywords
Introduction
Knowledge of the isotopic composition and total quantity of plutonium (Pu) within a sample has applicability in a variety of fields including nuclear safeguards,1,2 environmental contaminant source attribution,3–6 fission reactor studies,7,8 and biological uptake studies,9,10 as well as applications that cross disciplinary boundaries.11,12 While each of these applications has its own set of considerations with regards to the requisite level of precision and accuracy needed to meaningfully interpret the Pu data, there has been a steady progression13–17 across laboratories making Pu measurements towards the development of methods capable of obtaining the highest fidelity Pu isotopic and assay data on the smallest quantity of material possible. For example, the recent development of a high purity 244Pu spike 2 has enabled some laboratories to make accurate Pu isotope ratio measurements using multicollector inductively coupled plasma mass spectrometry (MC-ICP-MS) on Pu amounts down to 20 femtograms (fg) while also pushing the Pu detection limit below the 1 fg level. While this represents the state of the art, there are numerous laboratories capable of producing Pu isotopic ratios with uncertainties on the order of a few percentages for total Pu quantities in the single picogram range. 18 While being able to produce accurate and precise Pu isotope and concentration data is important in all end-use cases, one particular application is the International Atomic Energy Agency's (IAEA) environmental sampling (ES) program because the data generated by members of the Network of Analytical Laboratories (NWAL) can have actionable consequences with wide-reaching implications. 19
While Pu isotopic composition and total quantity can be determined via alpha spectrometry, long count times (weeks) would be necessary to produce reliable analytical results for the fg-level quantities of Pu that are typically found on the cotton swipes collected as part of IAEA's ES programs. Standard alpha spectrometry methods are also not able to differentiate between 239Pu and 240Pu. 20 In contrast, MS based approaches have the ability to observe the signal of each isotope while also having extremely high sensitivity (down to attogram levels depending on the instrument and matrix). Thermal ionization mass spectrometry (TIMS) was once considered the benchmark MS technique for Pu isotope ratio measurement and when performed in concert with isotope dilution (IDMS) produces highly accurate and precision results. 21 Single detector ICP-MS has also shown promise for Pu isotope ratio measurements 22 and continues to have important use-cases, 23 but the application of MC-ICP-MS to Pu measurements has allowed plasma-based MS techniques to achieve levels of precision and accuracy that are comparable to TIMS. Since the first MC-ICP-MS Pu isotopic results were reported in the literature,15,24 there have been steady improvements in MC-ICP-MS detector design, chemical purification schemes, isotope dilution protocols, data processing techniques, and sampling regimens that, in some cases, have outpaced the development of Pu reference materials. 25 These improvements have also occurred in parallel with the arrival of entirely new MC-ICP-MS platforms on the market.
A common MC-ICP-MS platform utilized by laboratories performing Pu isotopic measurements from environmental samples is the ThermoFisher Scientific Neptune series of instruments. A variety of detector packages and introduction systems are available for the Neptune. Most Pu isotope ratio measurements for ES are conducted using multiple ion counter type detectors (as opposed to Faraday cups), due to the low quantities of Pu typically encountered, while also making use of a desolvating nebulizer system to enhance the overall sensitivity of the measurement. 26 While the Neptune MC-ICP-MS is routinely employed within the isotope measurement community, ThermoFisher Scientific has recently introduced its successor, the Neoma MC-ICP-MS. 27 The basic operating principles behind the Neptune and Neoma are similar, but the instruments are very different from one another in terms of their hardware, electronics, and instrument control software. Additionally, the “MS/MS” option outfitted on the Neoma MC-ICP-MS contains a collision cell that allows for the introduction of collision/reaction gases for the purpose of separating various elements from one another as well as a pre-cell mass filter. 28 The pre-cell mass contains a double Wien filter, which uses opposing electric and magnetic fields to spread the ions towards an adjustable slit and then to refocus the ions back to the axial trajectory. While this capability may eventually preclude the need for lengthy chemical purification steps that are applied to ES samples before MC-ICP-MS measurement, this has yet to be tested.
In this study we compare the precision and accuracy achievable on a conventional MC-ICP-MS and a newer platform utilizing a pre-mass filter MC-ICP-MS/MS for two certified reference materials (CRM) from New Brunswick Laboratory Program Office (NBL PO), CRM 136a and CRM 137. This will serve to benchmark the comparative difference between two MC-ICP-MS platforms, which in turn will allow for an evaluation of the performance of the MC-ICP-MS/MS with regards to Pu isotope ratio measurement in future studies. Our results indicate that the two MC-ICP-MS platforms perform similarly to one another. This study will also help inform the progression towards spatially resolved Pu isotopic analysis20,29–32 by MC-ICP-MS, Pu age dating, 33 and analytical workflows incorporating online and/or automated separation schemes.34–36
Experimental
Materials and Methods
The work presented here was carried out in the Ultra-Trace Forensic Science Center (UFSC) at Oak Ridge Nnational Laboratory (ORNL). All acids, lab wear and standards were prepared in clean space ranging from International Organziation for Standardization (ISO) class 5 to ISO 7. All acids prepared use Optima grade acids purchased from Fisher Scientific and are prepared in cleanrooms certified ranging from ISO 5 to ISO 7. Our leach vats we use to clean labware/supplies use ACS grade acid also purchased from Fisher Scientific. Labware is rinsed with ASTM type I (≥18.2 MΩ·cm) water. The water used in the labs goes through our Thermo Scientific Barnstead Nanopure Ultrapure Water Systems, which then creates the American Society for Testing and Materials (ASTM) type I (≥ 18.2 MΩ·cm) water. For this work, three isotopic standards were used from the New Brunswick Laboratory Program Office (NBL PO) CRM 136a, CRM137, and an in-house working reference material (WRM)-003, which is a mixture of CRM 137 and NBL PO CRM144. These standards are diluted in 2% nitric acid (HNO3) and were all run at concentrations of ∼1.5 pg mL–1. At this dilution, the major isotope 239Pu was measured at ∼300 000 counts second–1 (cps) . The Pu standards used in this study were prepared following Zarga et al. 33
MC-ICP-MS Instruments and Measurement Configurations
For comparator MC-ICP-MS measurements a Thermo Scientific (Germany) Neptune Plus was employed. This instrument is equipped with the nuclear package including three secondary electron multipliers (SEM) and two compact discrete dynode (CDD) detectors as well as eleven Faraday cup detectors outfitted with one 1010Ω, five 1011Ω and three 1013 Ω resistance amplifiers. The MC-ICP-MS/MS (Neoma, Thermo Scientific) is equipped with a similar detector package with three SEM and two CDD detectors as well as eleven Faraday cup detectors outfitted with eleven 1011Ω and five 1013Ω resistance amplifiers. The specific configuration used for Pu isotope ratio measurements on both the MC-ICP-MS and the MC-ICP-MS/MS are shown in Table I. To enhance measurement sensitivity, a desolvating nebulizer (ApexΩ Elemental Scientific Inc., USA) was employed with the utilization of jet sample and X-skimmer cone configuration. This introduction approach was utilized on both MC-ICP-MS platforms.
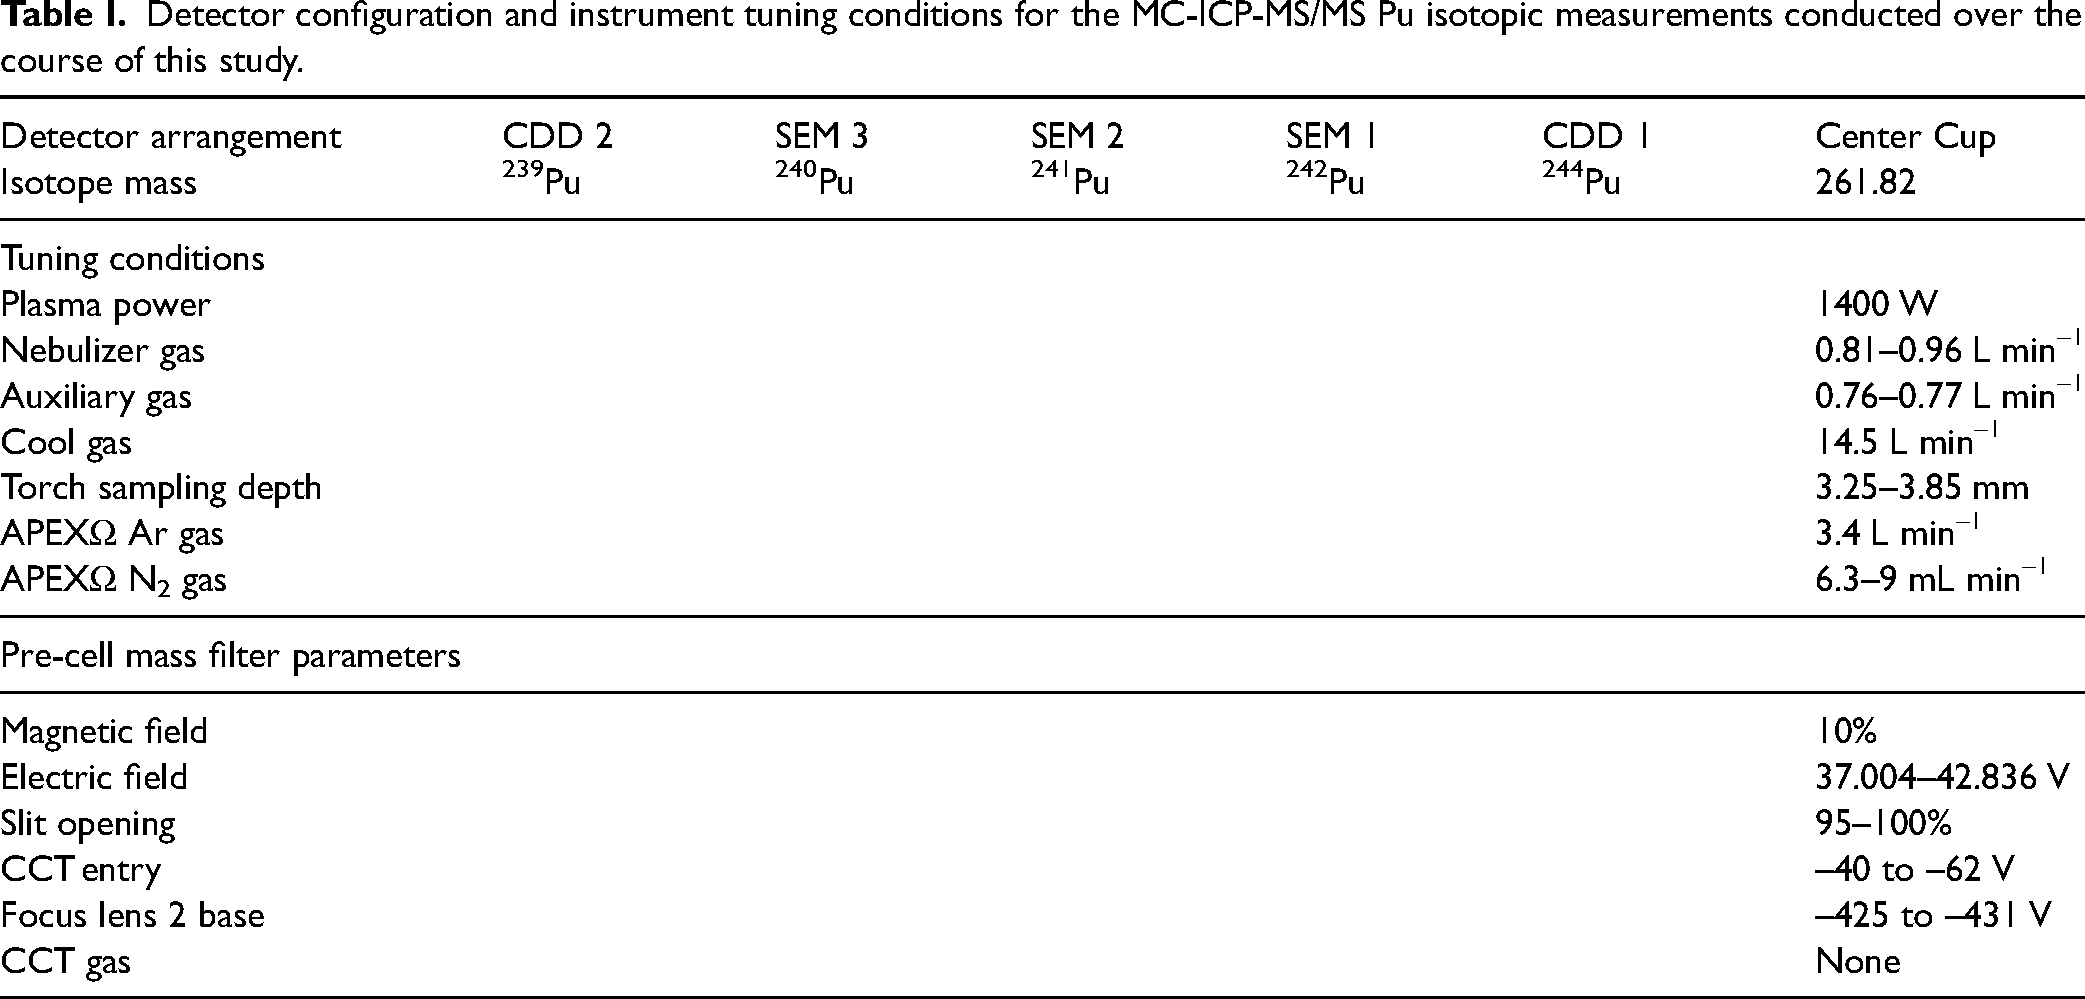
Detector configuration and instrument tuning conditions for the MC-ICP-MS/MS Pu isotopic measurements conducted over the course of this study.
MC-ICP-MS/MS Tuning and Set Up
Daily tuning was completed as follows. Initial plasma tuning was completed using a 1:100 dilution of ThermoFisher Scientific Neoma tune solution with 238U on the center cup. Initial plasma gases, torch x,y,z, and sensitivity lenses and a focus lens were tuned for optimal performance. The ApexΩ Ar and N2 gases were tuned for stability and sensitivity. After initial tuning was completed a solution of Pu was aspirated and the manufacturer suggested MS prefilter tuning workflow was applied. This workflow included closing the entrance slit to 20% width, adjusting the E-Field, tuning the prefilter symmetry/collision cell technology (CCT) lenses for max sensitivity, and adjusting Focus L2 base lens for maximum stability using the automated “detune” button. Previous studies have indicated that special care must be considered while tuning the lenses to prevent inducing inaccurate ratios.37,38
After prefilter tuning was complete, the slit was reopened to allow maximum sensitivity, in this analysis 95–100% opening was chosen. A signal stability of 0.4–0.6% relative standard deviation (RSD) was targeted using the Qtegra (Thermo Scientific) tune book chart recorder. Key tune parameters varied during these analytical sessions and are shown in Table I. Ion counter operational voltages were set using the Qtegra calibration function while ion counter yields were set by moving the 235U beam into each of the ion counters and comparing to a faraday cup voltage. After operational voltages and yields were determined, a dark noise determination was performed on each detector for a total of 6 m.
The MC-ICP-MS/MS measurements were run as 4 s integrations with 16 repeats in a single cycle. Peak centers were performed on each bracketing standard. The sequence of analyses was set up such that each standard was immediately preceded by an acid matrix matched instrument blank of 2% HNO3. After each standard and before the instrument blank, a washing step using 5% HNO3 + 0.01 M hydrofluoric acid (HF) was employed to clean the introduction system. The WRM-003 standard was used to correct for instrumental mass fractionation and was run bracketing every two CRM 136a and CRM 137 standards. The same sequence was utilized on the MC-ICP-MS. This method is designed to maximize measurement efficiency for small amounts of Pu.
Data Processing Approach
The data generated during this study were evaluated using a combination of instrument software (Qtegra) and a laboratory information management system (LIMS) system, OakLimbs developed by ORNL. The instrument software was responsible for incorporating the detector dark noise and detector yield corrections. The OakLimbs software handled the blank, hydride, and instrumental fractionation corrections. The individual analyses were exported using the query > export function in Qtegra. Blank and instrumental fractionation corrections were performed on a line-by-line basis. Since WRM-003 has known 240Pu/239Pu, 241Pu/239Pu, 242Pu/239Pu, and 244Pu/239Pu ratios this allows instrumental mass fractionation to be corrected by direct comparison, where isotopes are corrected using the same detectors for the bracketing standard and the sample measurement. The values in Table II have been corrected for instrumental fractionation using the WRM-003 standard.
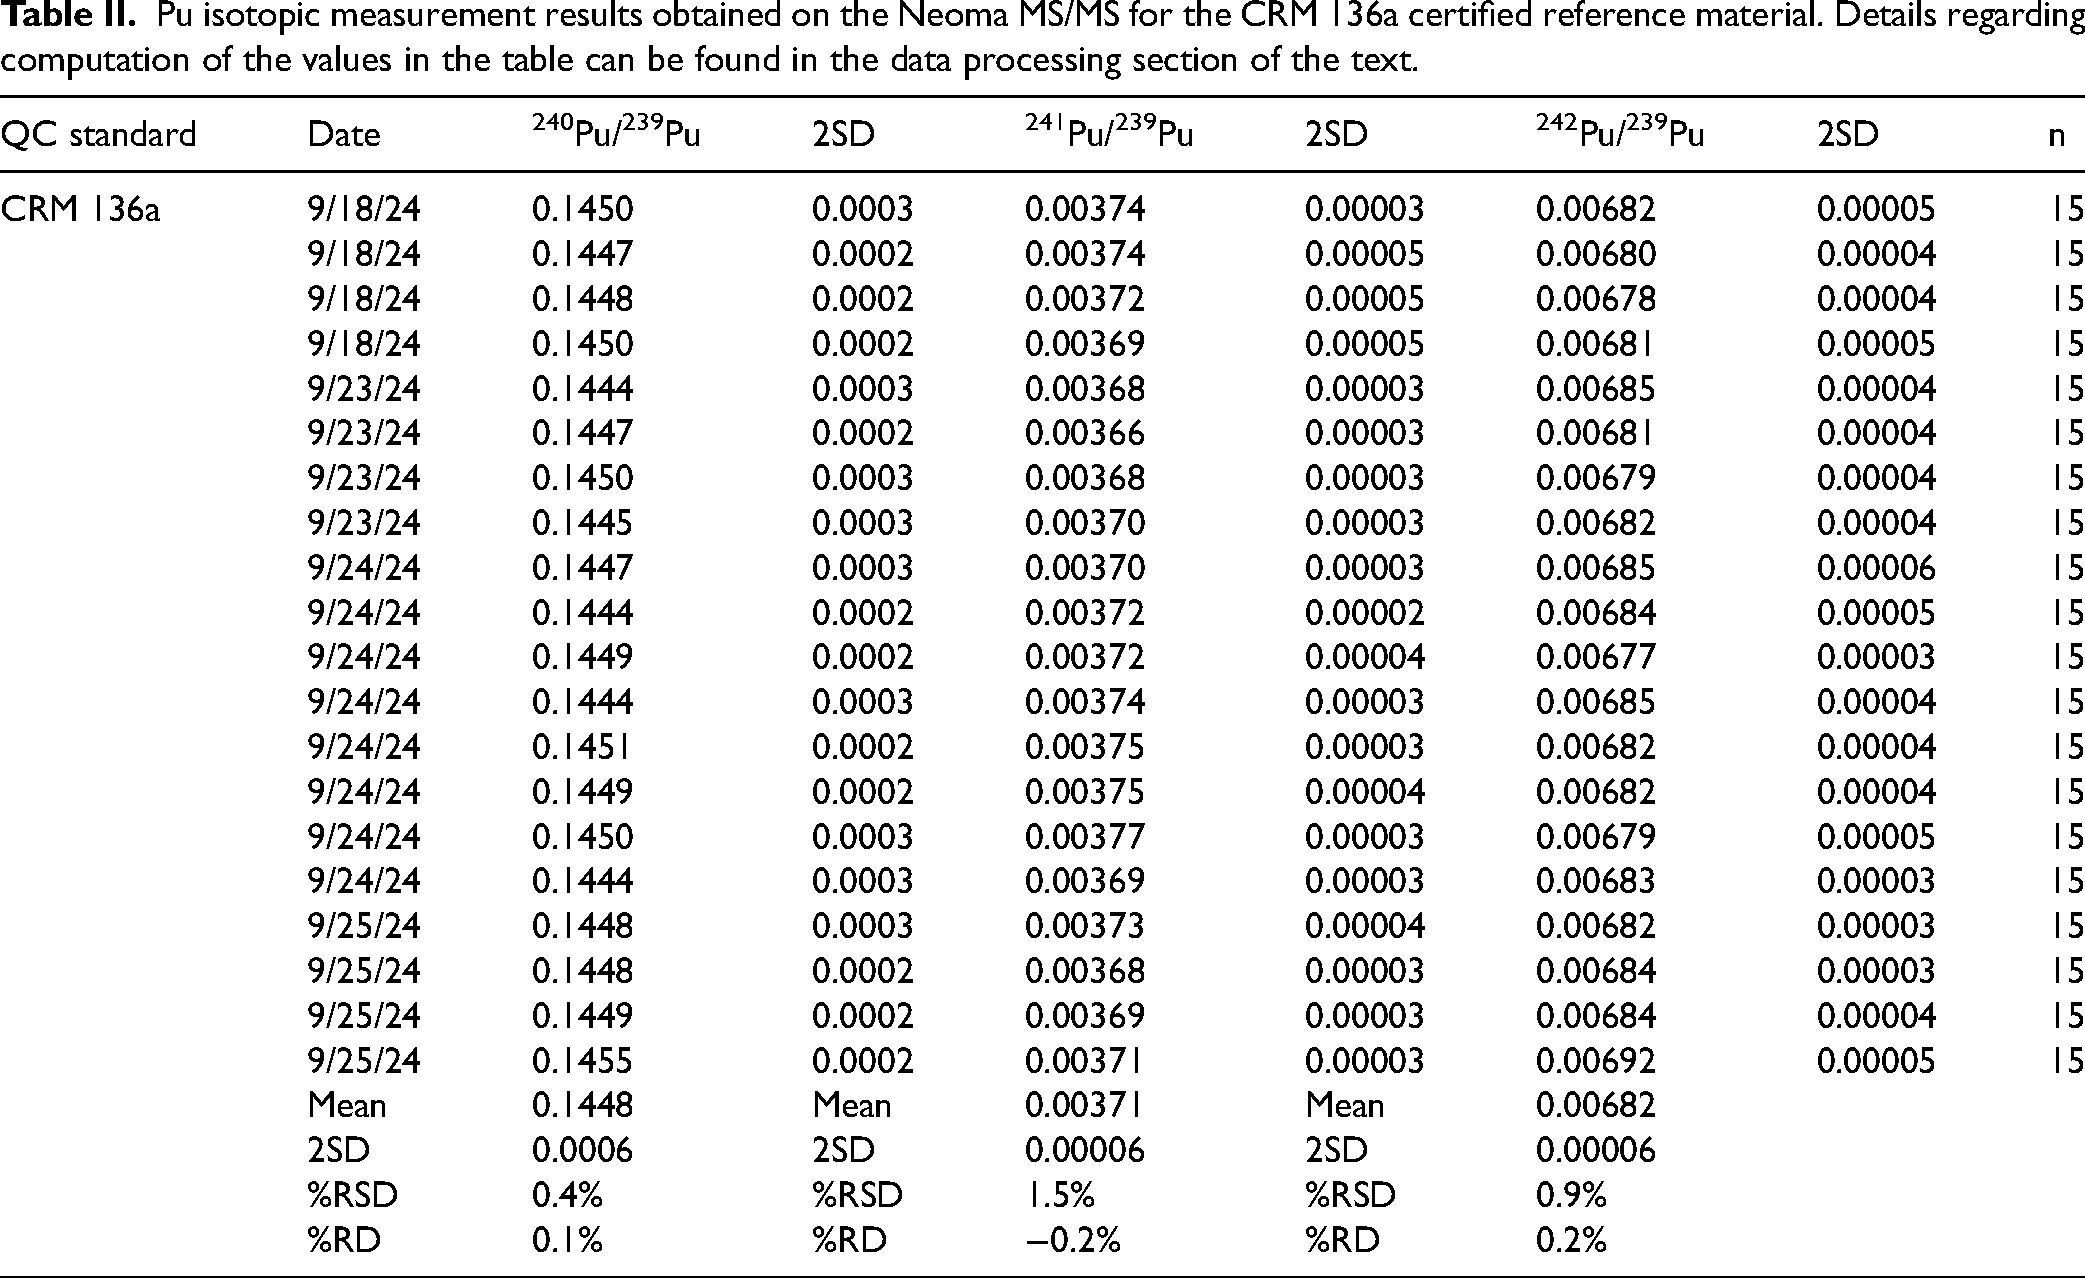
Pu isotopic measurement results obtained on the Neoma MS/MS for the CRM 136a certified reference material. Details regarding computation of the values in the table can be found in the data processing section of the text.
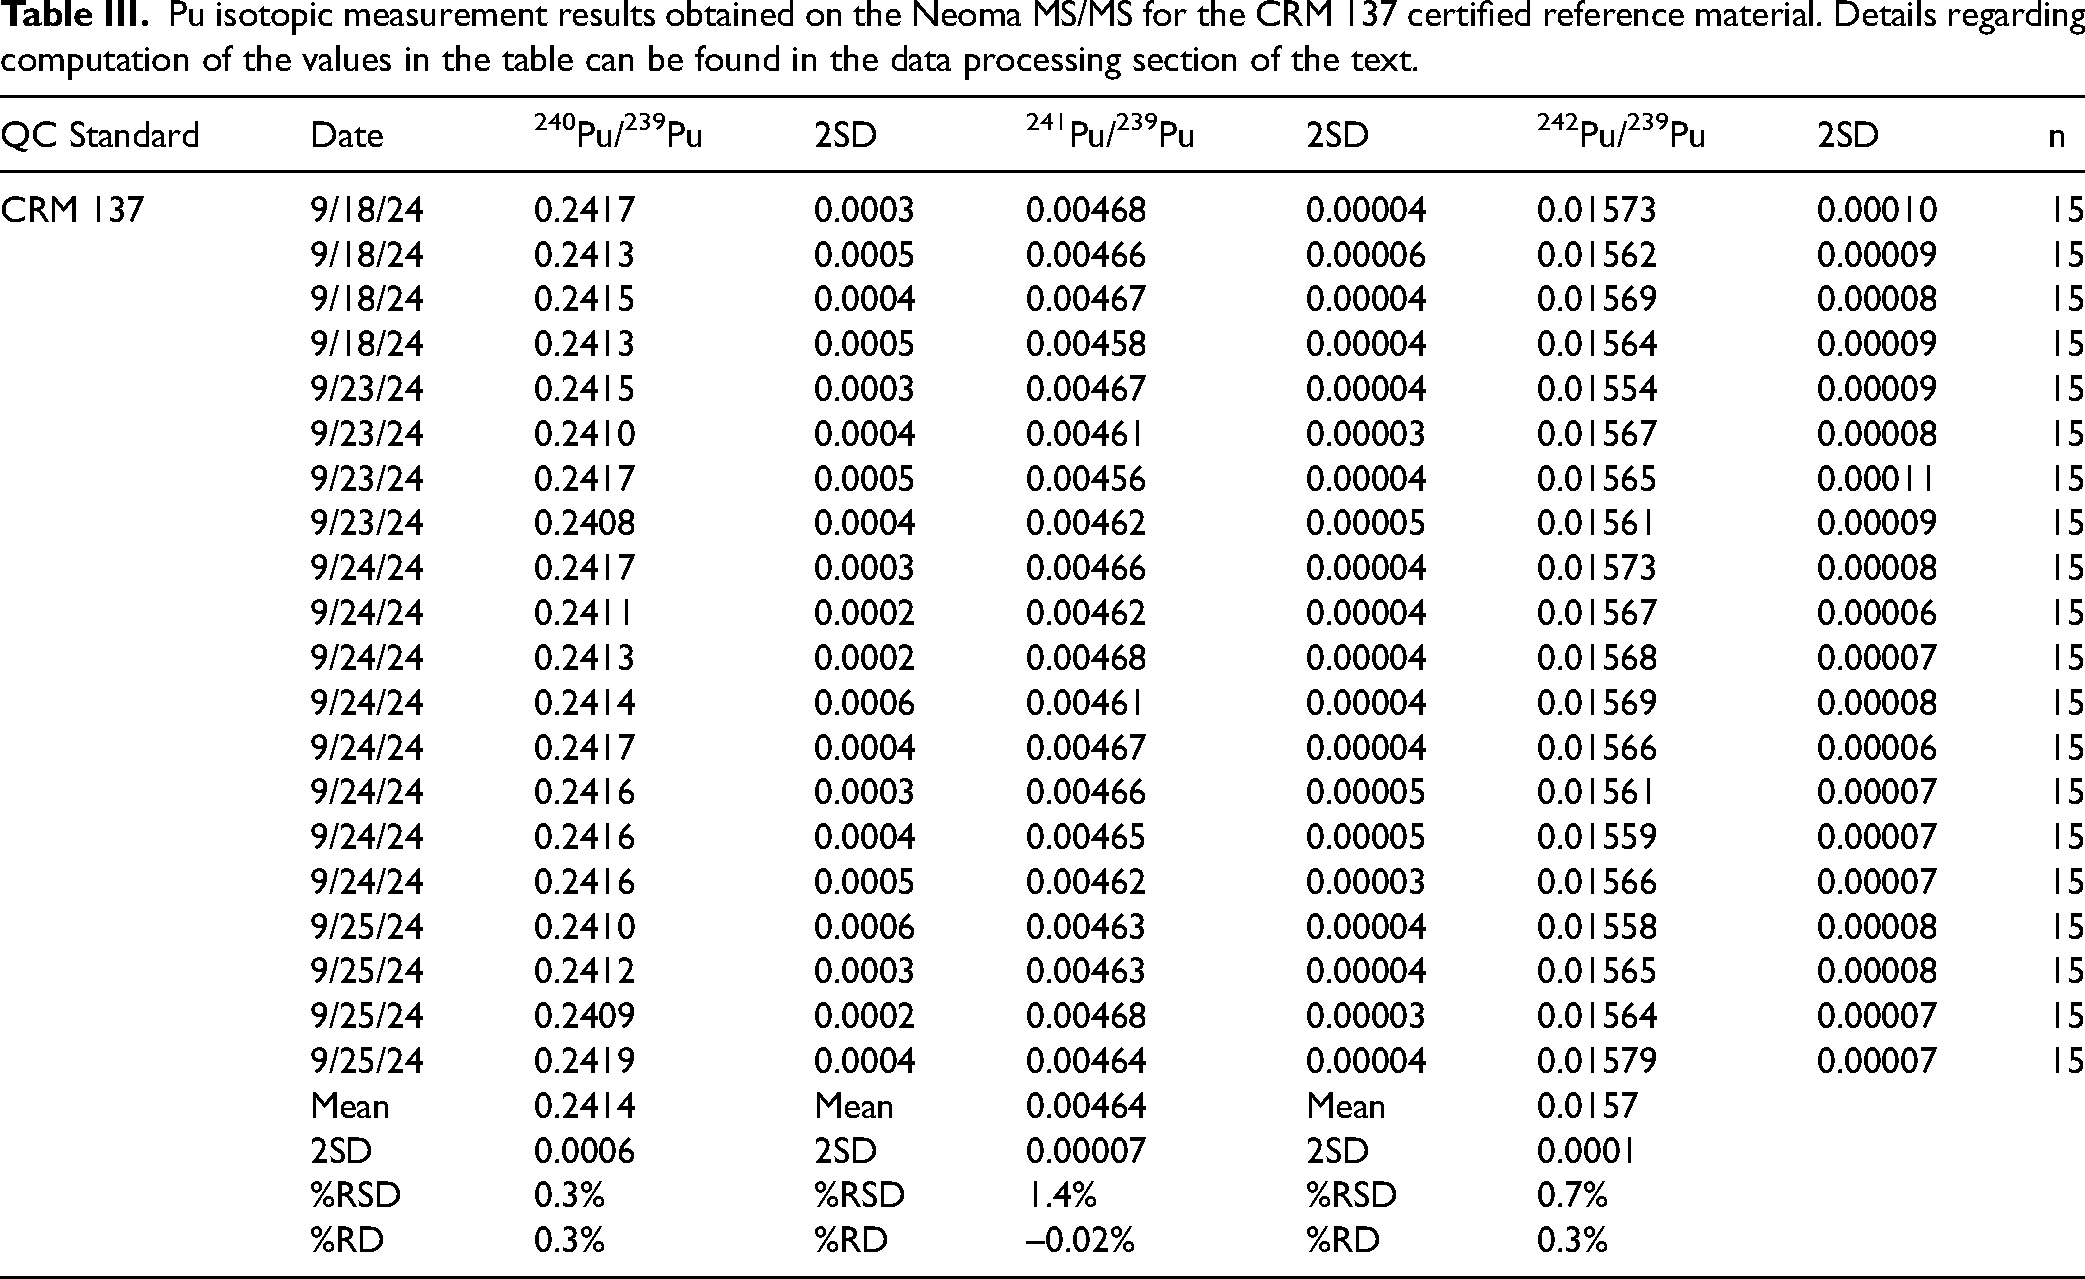
Pu isotopic measurement results obtained on the Neoma MS/MS for the CRM 137 certified reference material. Details regarding computation of the values in the table can be found in the data processing section of the text.
The Pu isotope uncertainty budgets were calculated using the Guide to the Expression of Uncertainty in Measurements compliant GUM Workbench v. 2.3 software (Metrodata GmbH) embedded in the OakLimbs system. An example uncertainty budget can be found in the Supplemental Material. In brief, the ratio uncertainty incorporates the product of the certificate uncertainty for the bracketing standard used and the relative standard error of the nearest bracketing standard measurements. Added to that are the uncertainties from the preceding blank and the day-to-day variability of each standard over the last six months.
Results and Discussion
Summary of Results from MC-ICP-MS/MS
As described above, the individual isotope ratios from repeated measurements of the certified reference material (CRM) 136a and CRM 137a standard reference materials observed on the MC-ICP-MS/MS are found in Table II. The certificate values for CRM 136a are 238Pu/239Pu = 0.002624, 240Pu/239Pu = 0.144997, 241Pu/239Pu = 0.022215, and 242Pu/239Pu = 0.006801, while CRM 137 values are 238Pu/239Pu =0.003452, 240Pu/239Pu =0.241309, 241Pu/239Pu = 0.027719, and 242Pu/239Pu = 0.015599 (New Brunswick Laboratory, DOE; The 241Pu/239Pu represents the certification date 1 October 1987). We also utilize an in-house Pu working reference material (ORNL WRM-003 having 238Pu/239Pu = 0.00351, 240Pu/239Pu = 0.33038, 241Pu/239Pu = 0.007255, 242Pu/239Pu = 0.1421, and 244Pu/239Pu = 0.04833). The individual Neoma MS/MS analytical sessions with repeat analyses of CRM 136a and CRM 137 can be found in Figures 1–3. The results obtained on the MC-ICP-MS/MS are compared with historical results obtained on the MC-ICP-MS in Figures 4–6. These results also agree well with Pu isotopic measurements for the similar standards run by TIMS.39,40 For twenty measurements of CRM 136a run on the Neoma MS/MS over four separate analytical sessions, the mean values and their associated uncertainties (k = 2) are 240Pu/239Pu = 0.1448 ± 0.0006, 241Pu/239Pu = 0.00371 ± 0.00006, and 242Pu/239Pu = 0.00682 ± 0.00006. For the twenty measurements of CRM 137 run on the Neoma MS/MS during the same analytical session as the CRM 136a, the mean values and their associated uncertainties (k = 2) are 240Pu/239Pu = 0.2414 ± 0.0006, 241Pu/239Pu = 0.00464 ± 0.00007, and 242Pu/239Pu = 0.0157 ± 0.0001. For seventy measurements of CRM 136a run on the Neptune Plus during 21 analytical sessions during 2024, the mean values and their associated uncertainties (k = 2) are 240Pu/239Pu = 0.1448 ± 0.0003, 241Pu/239Pu = 0.00371 ± 0.00003, and 242Pu/239Pu = 0.00683 ± 0.00003. For 66 measurements of CRM 137 run on the MC-ICP-MS during 21 analytical sessions during 2024, the mean values and their associated uncertainties (k = 2) are 240Pu/239Pu = 0.2412 ± 0.0004, 241Pu/239Pu = 0.00463 ± 0.00004, and 242Pu/239Pu = 0.0157 ± 0.0001. The 241Pu/239Pu ratios from the MC-ICP-MS were decay normalized to 09/17/2024 (the measurement dates on the Neoma) for consistency.
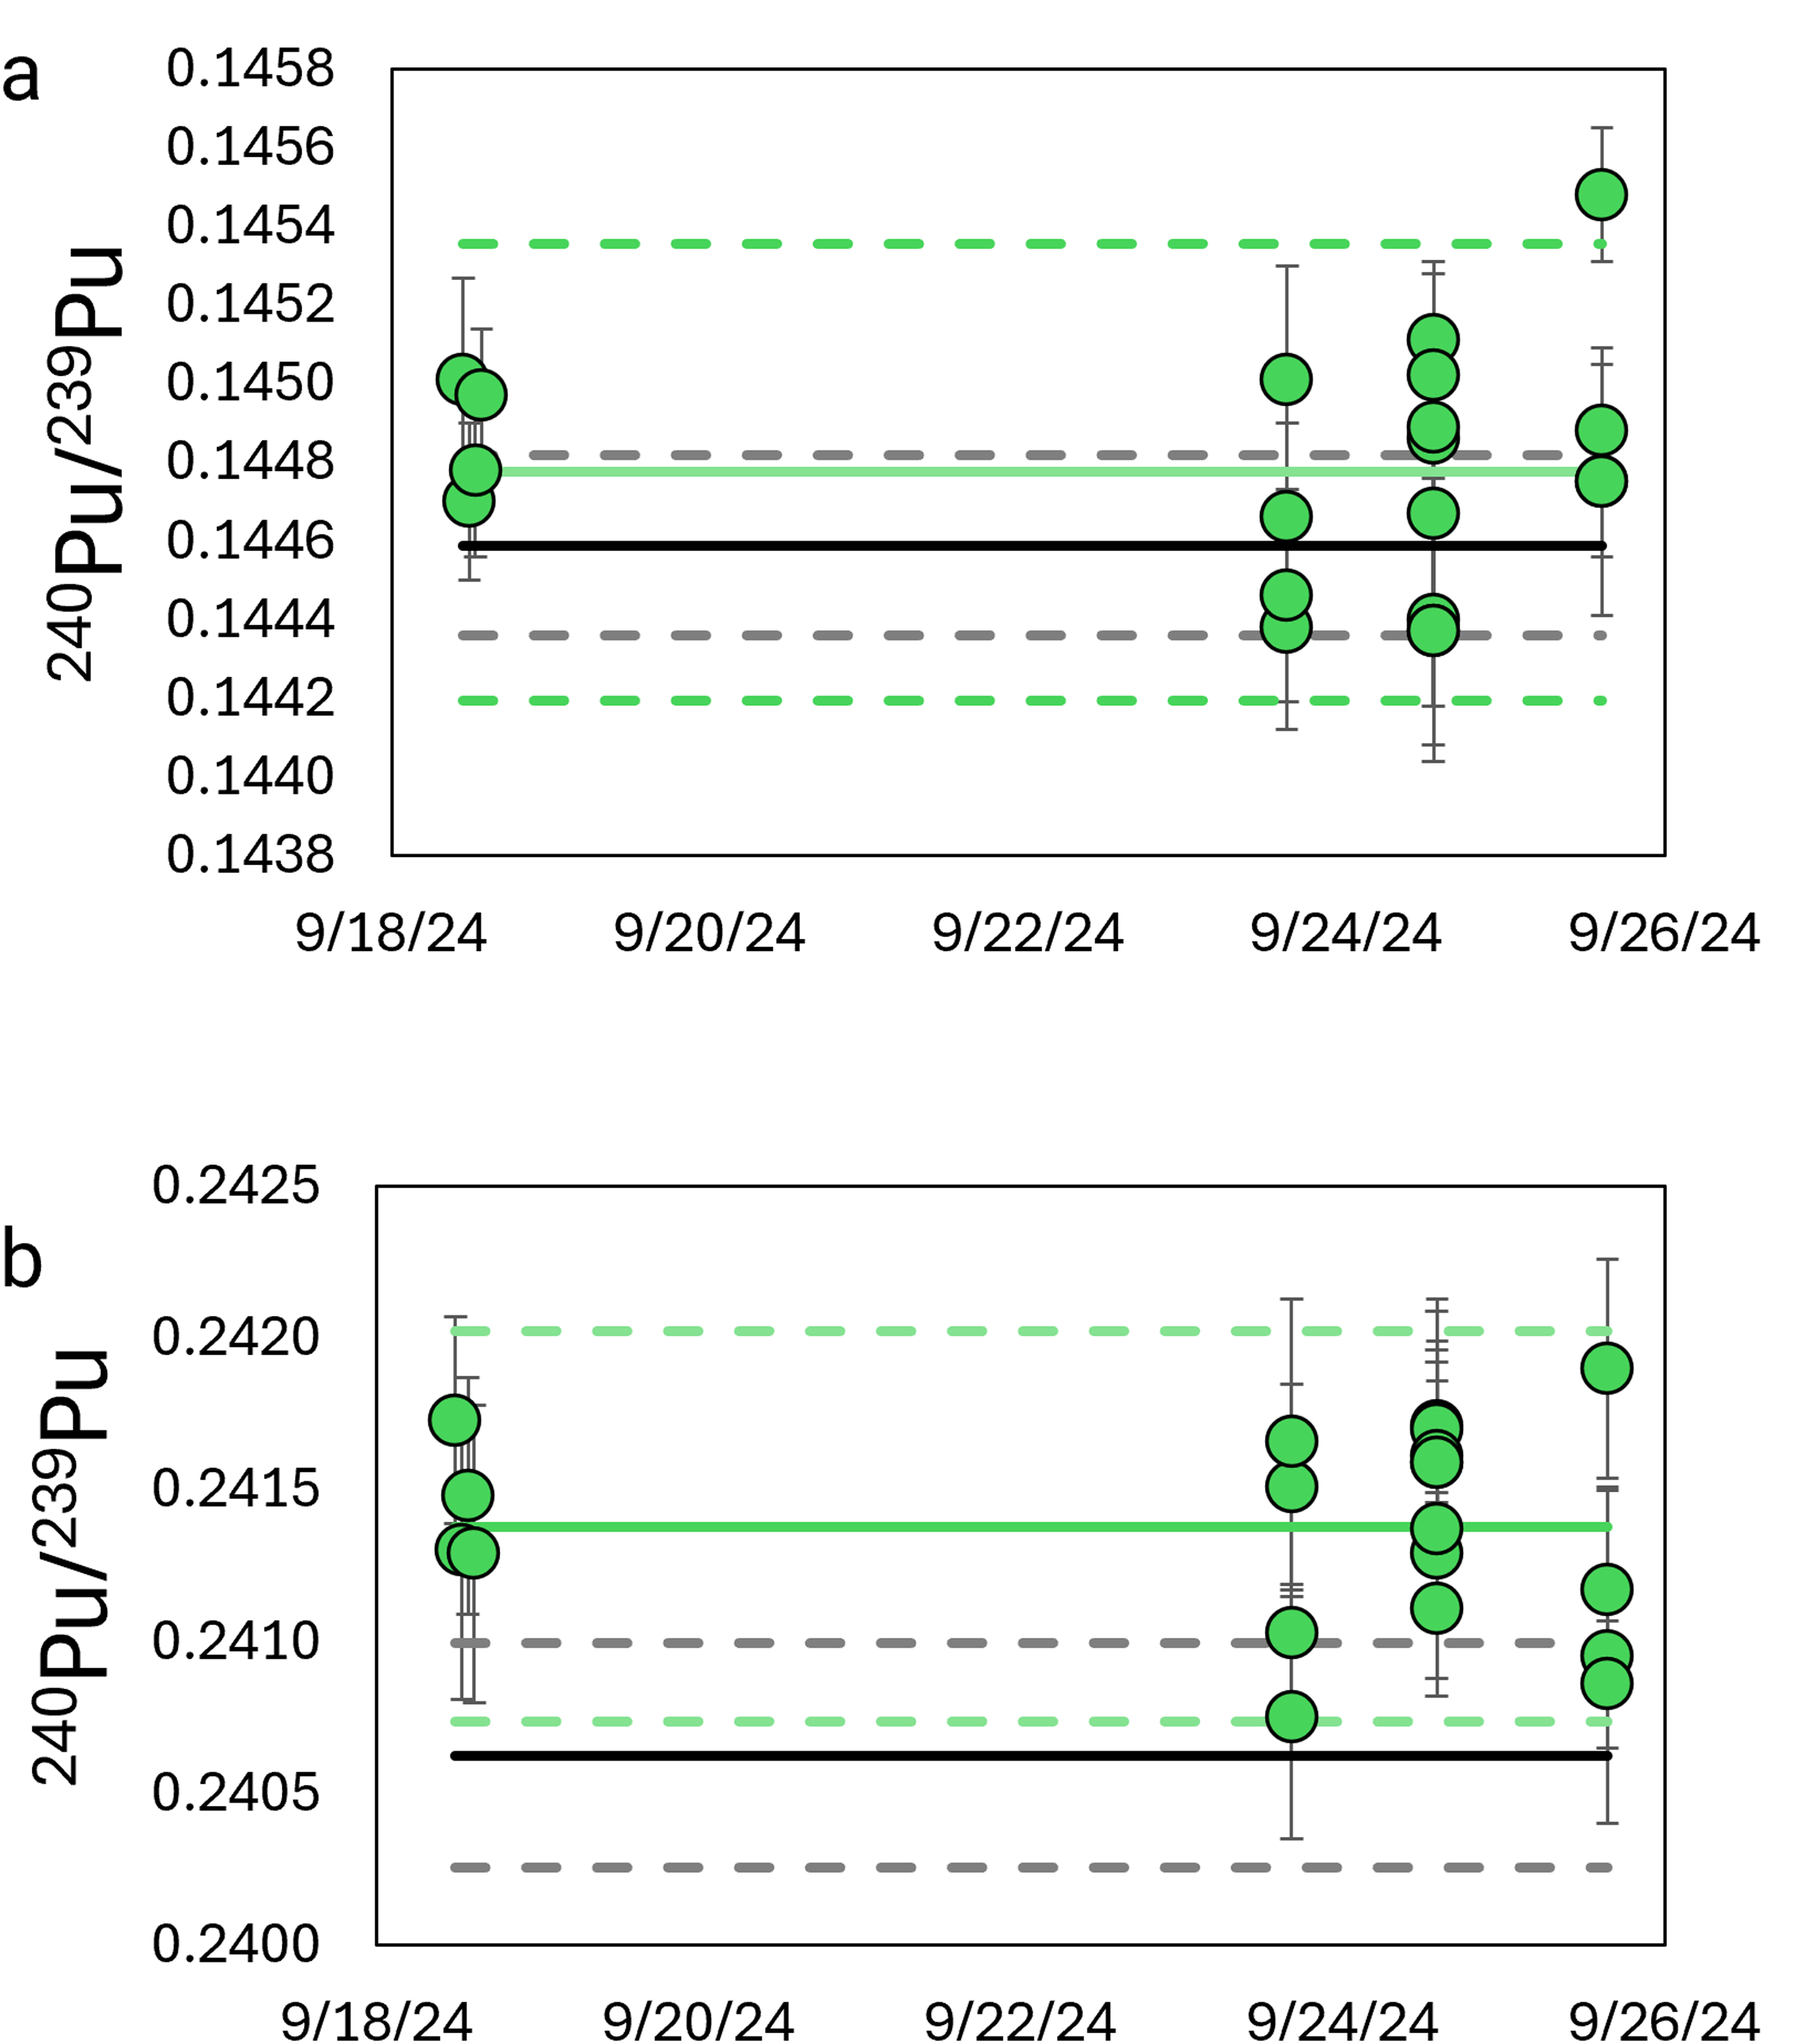
(a–b) Plot of the 240Pu/239Pu ratio obtained on the Neoma MS/MS Pu over the study interval for the CRM 136a (Figure 1a) and CRM 137 (Figure 1b) certified reference materials. Isotopic results from the Neoma are plotted with the measured mean value (solid green line) and uncertainties, k = 2 (dashed green lines) along with the certificate values (black lines) and uncertainties, k = 2 (gray dashed).
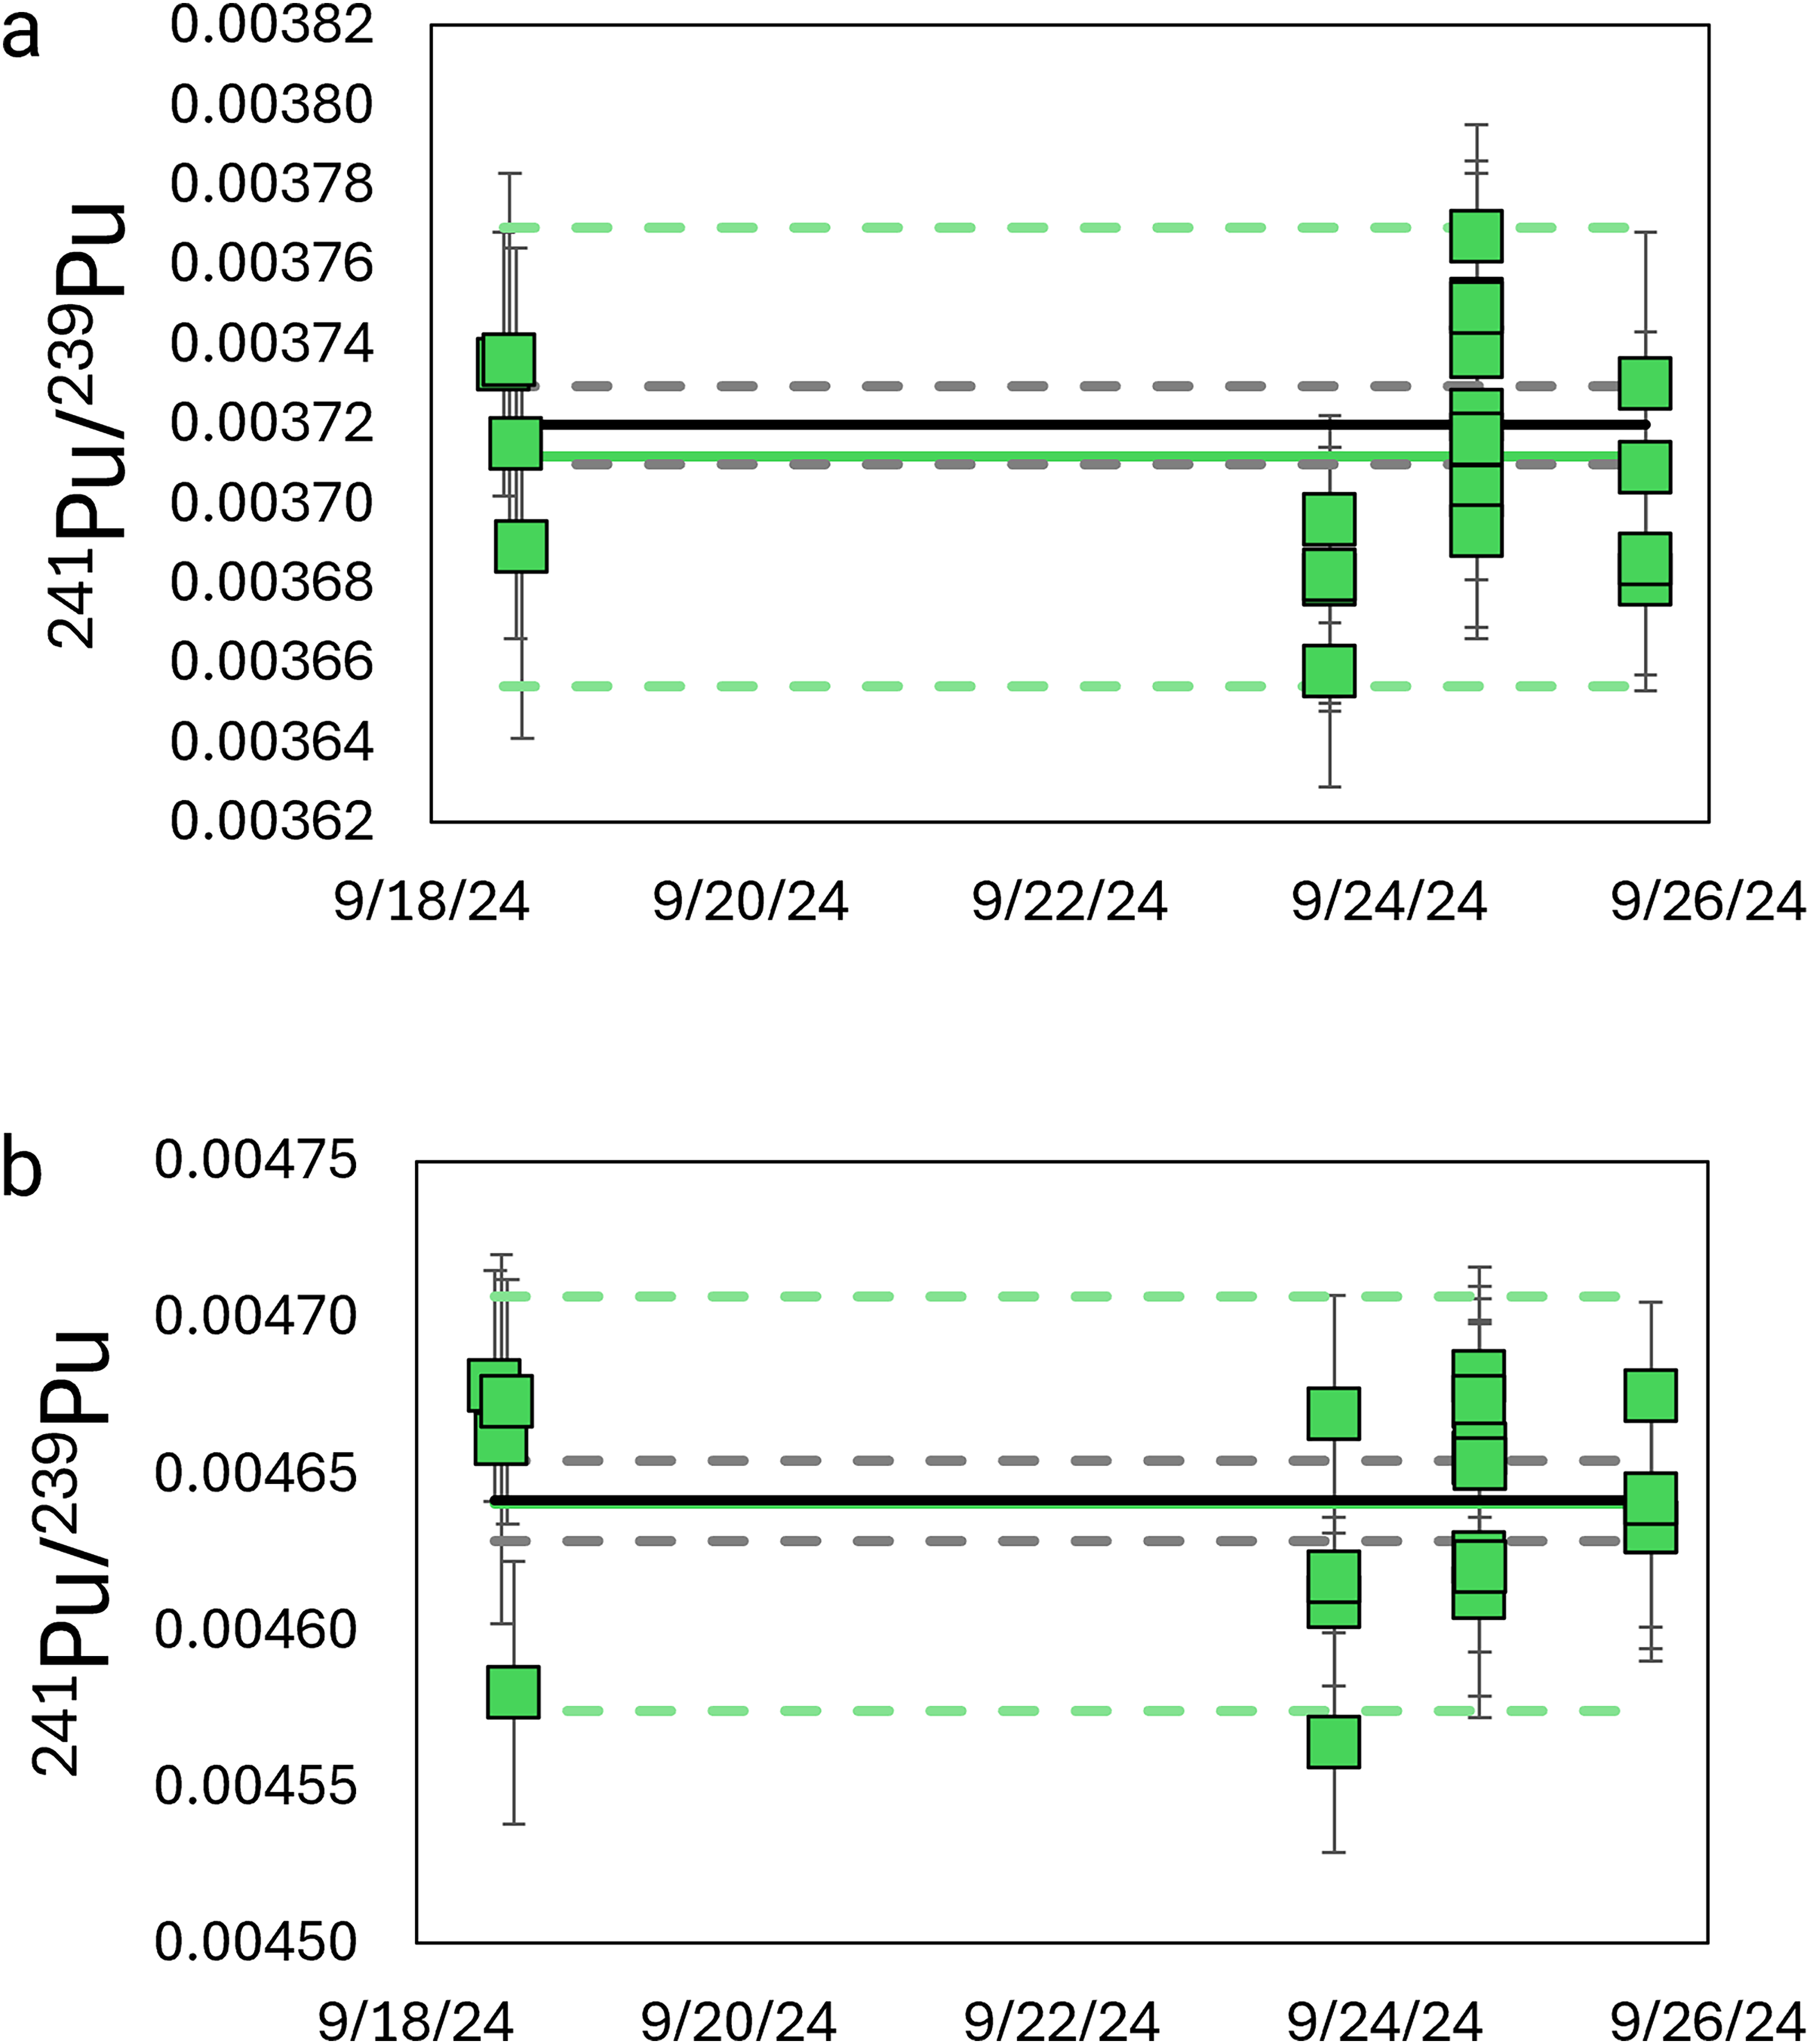
(a–b) Plot of the 241Pu/239Pu ratio obtained on the Neoma MS/MS Pu over the study interval for the CRM 136a (Figure 2a) and CRM 137 certified reference materials. Isotopic results from the Neoma are plotted with the measured mean value (solid green line) and uncertainties, k = 2 (dashed green lines) along with the certificate values (black lines) and uncertainties, k = 2 (gray dashed).
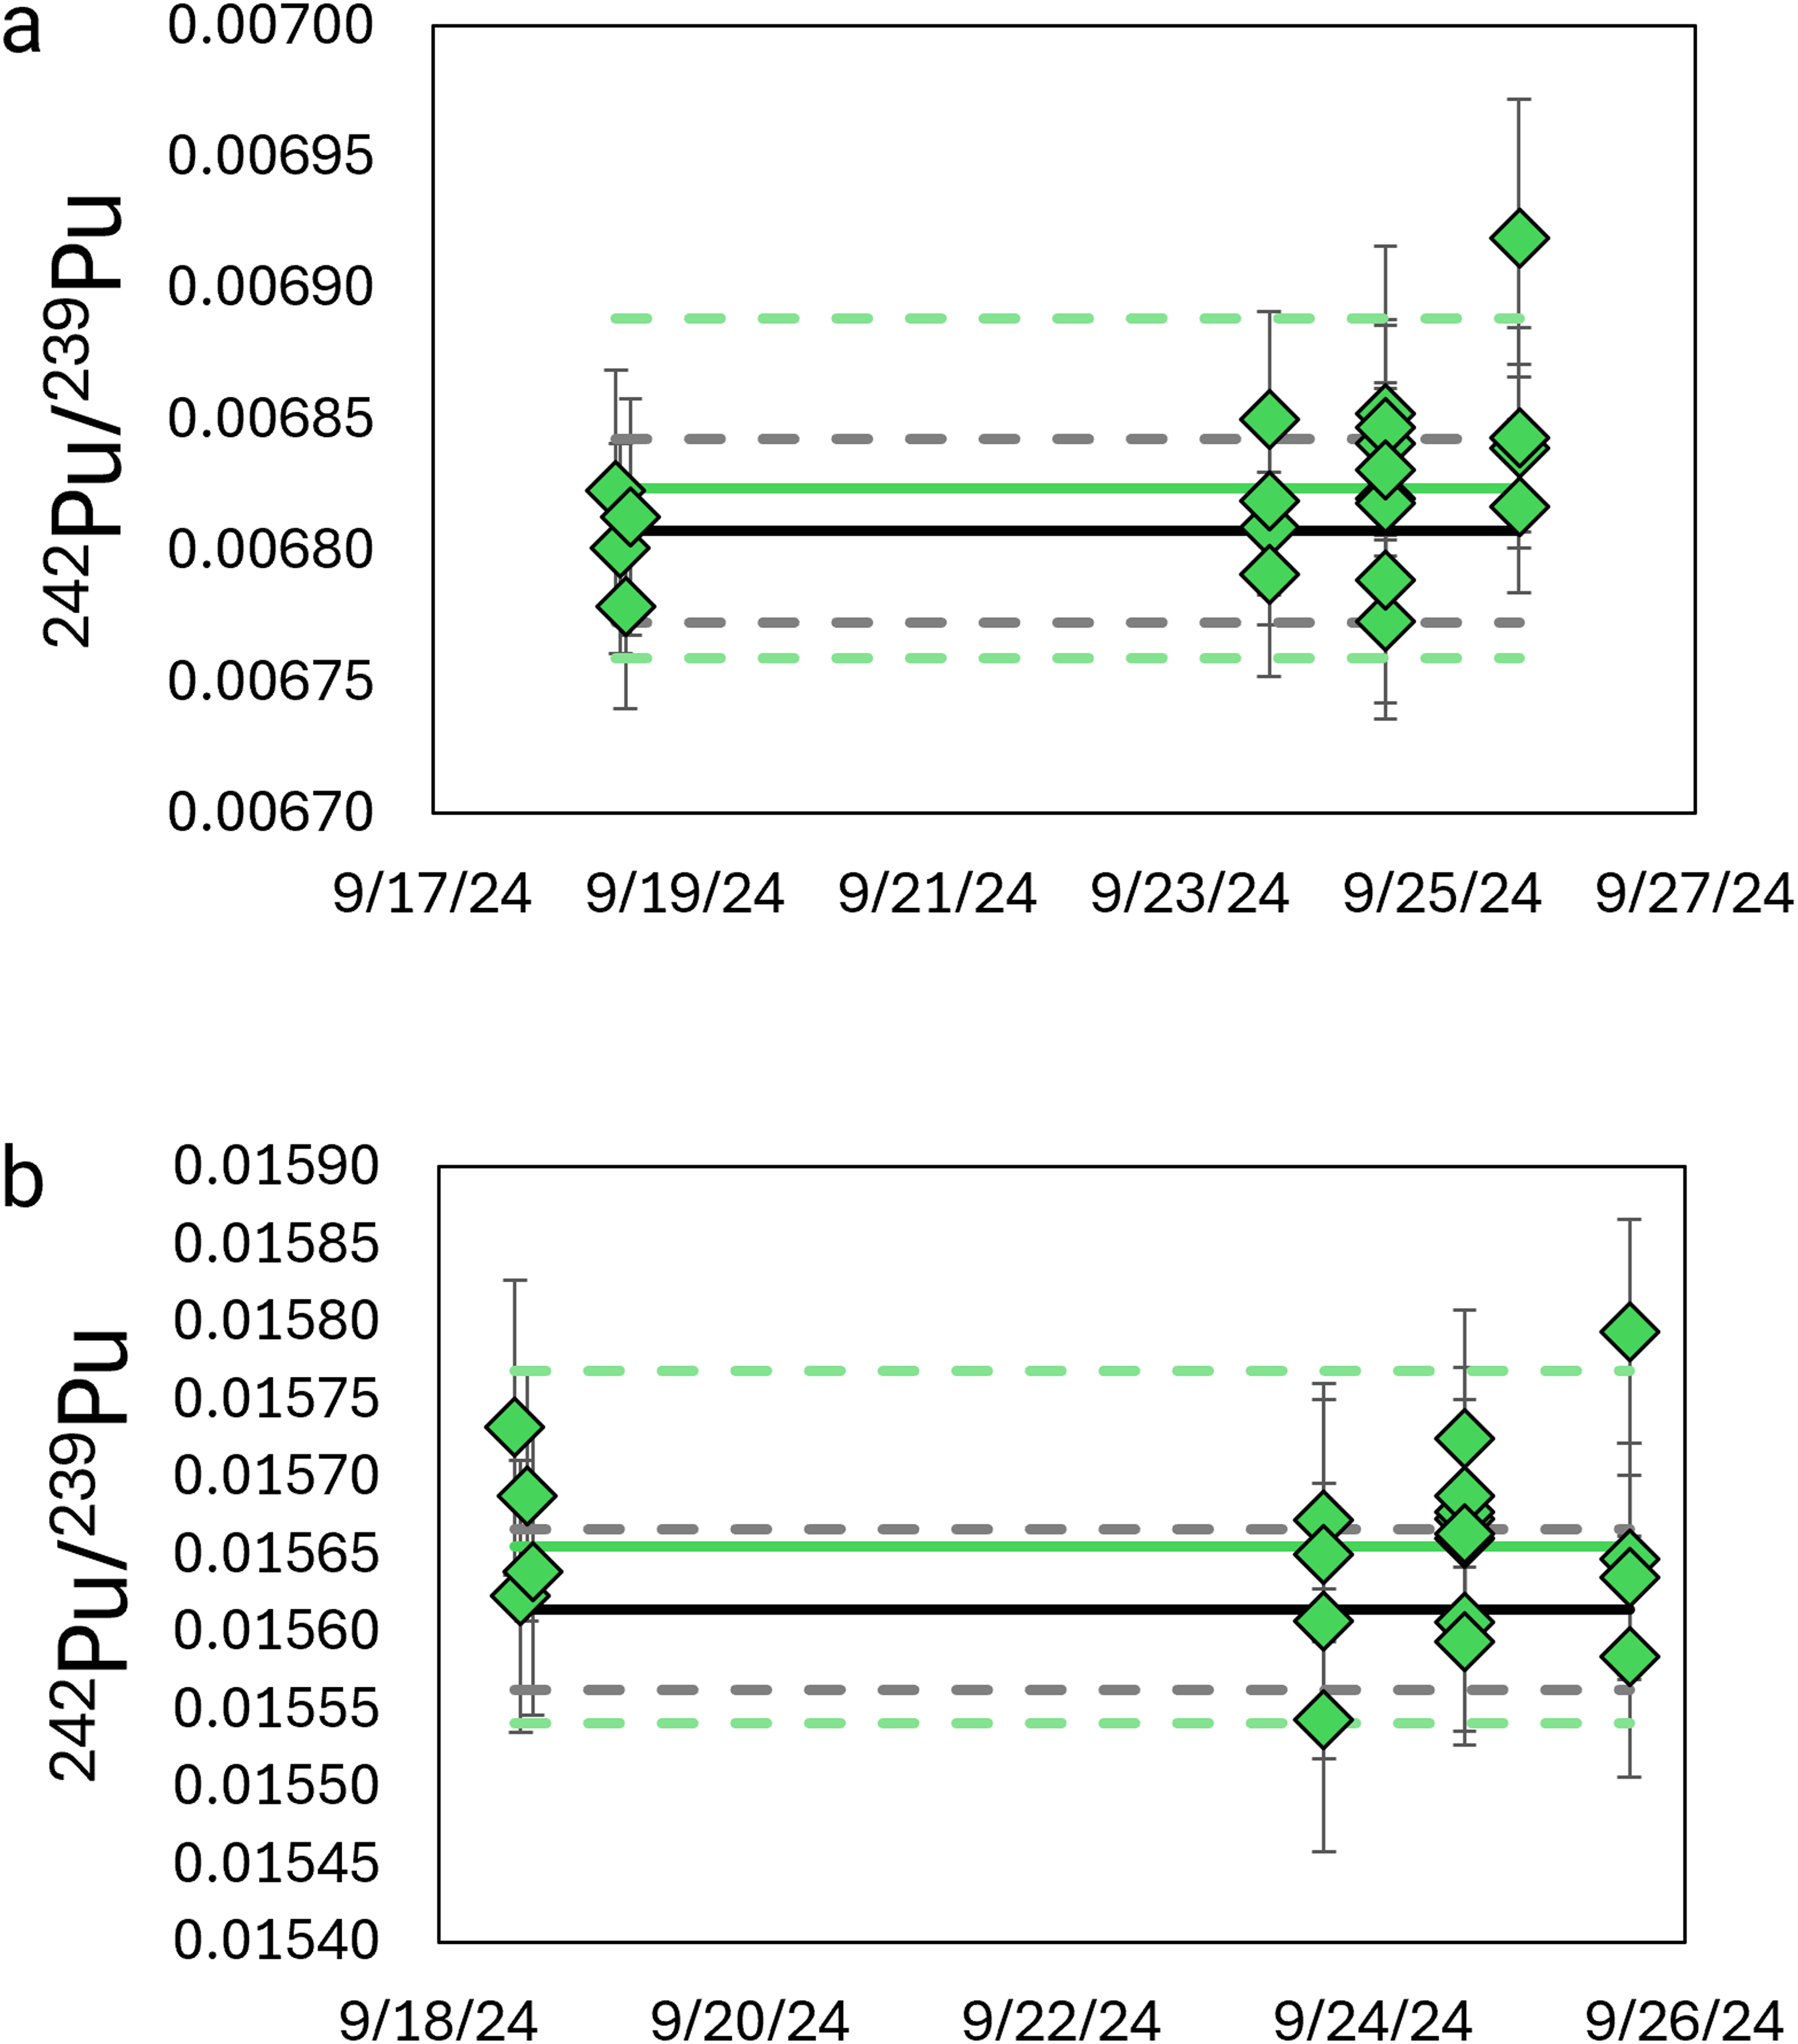
(a–b) Plot of the 242Pu/239Pu ratio obtained on the Neoma MS/MS Pu over the study interval for the CRM 136a (Figure 3a) and CRM 137 (Figure 3b) certified reference materials. Isotopic results from the Neoma are plotted with the measured mean value (solid green line) and uncertainties, k = 2 (dashed green lines) along with the certificate values (black lines) and uncertainties, k = 2 (gray dashed).
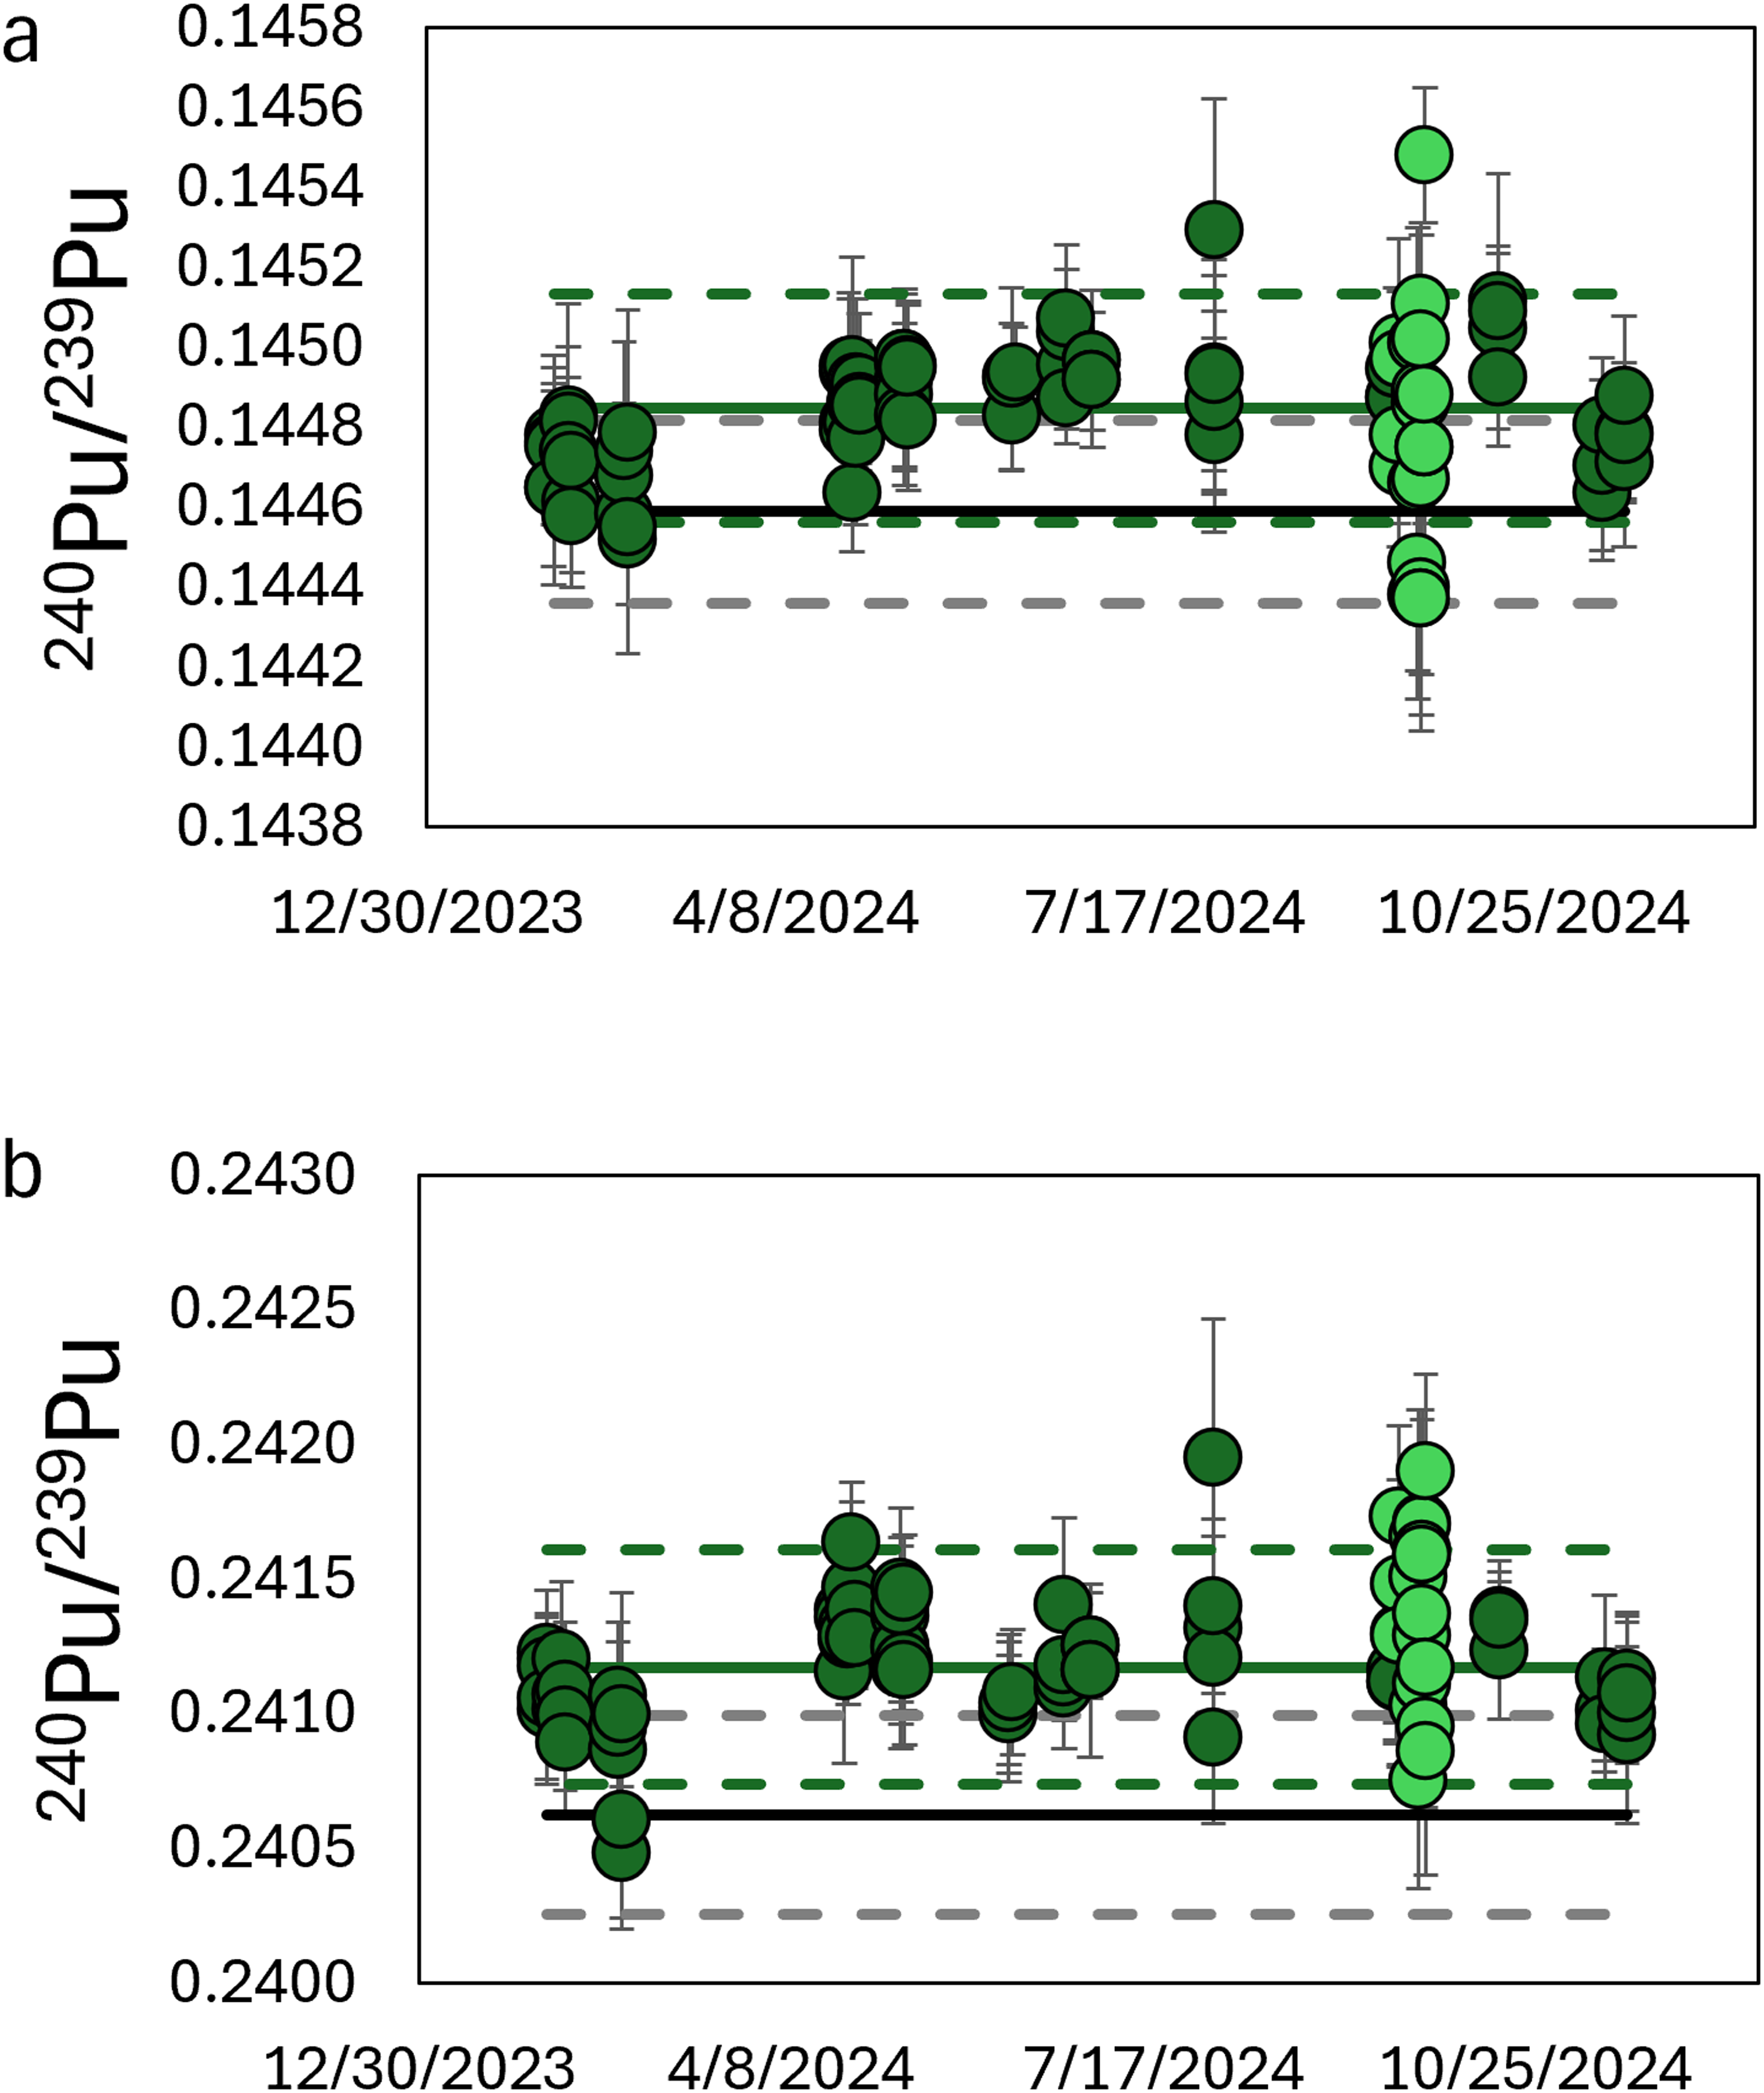
(a–b) Performance of the 240Pu/239Pu ratio for the Neoma (light green circles) and Neptune Plus (dark green circles) MC-ICP-MS for the CRM 136a (Figure 4a) and CRM 137 (Figure 4b) certified reference materials. The 2024 Neptune Plus mean values (green solid lines) and uncertainties, k = 2 (green dashed lines) values are plotted as are the certificate values for all CRMs with their mean values (solid black lines) and their uncertainties, k = 2 (gray dashed lines). All 241Pu/239Pu ratios (certificate and all measured Neptune Plus values) have been decay corrected to the approximate measurement date of the Neoma MS/MS data (09/17/2024).
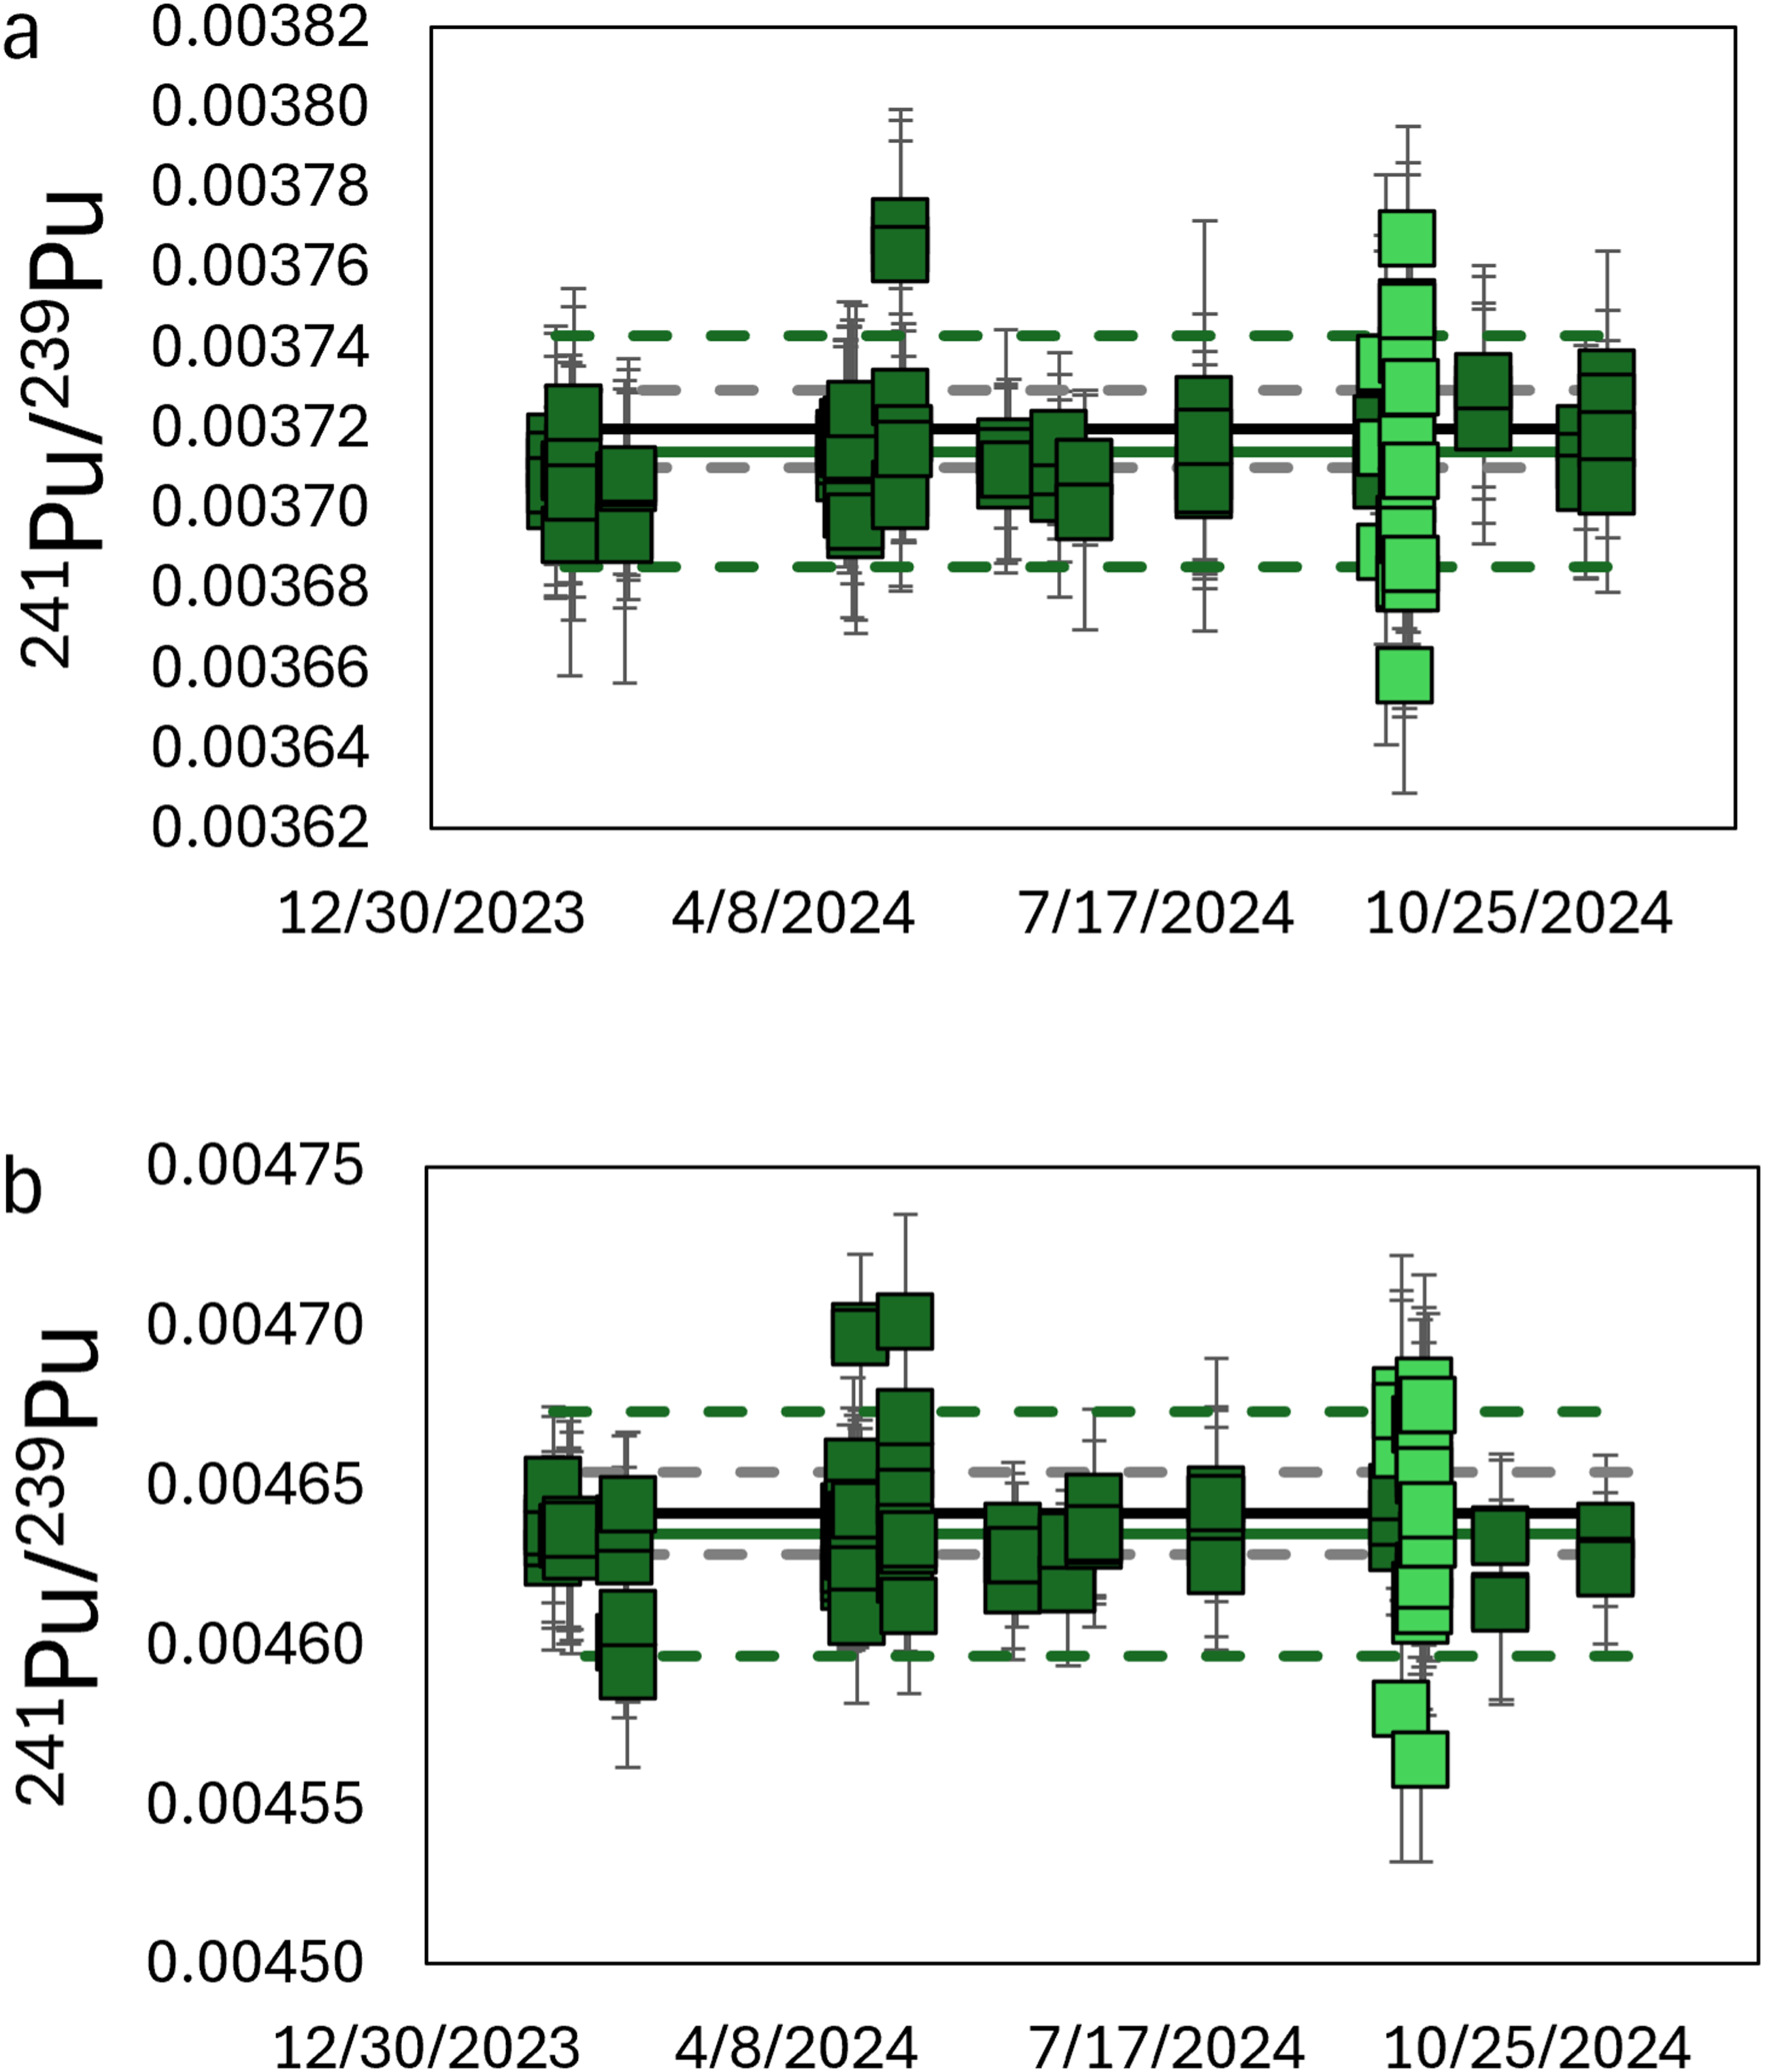
(a–b) Performance of the 241Pu/239Pu ratio for the Neoma (light green squares) and Neptune Plus (dark green squares) MC-ICP-MS for the CRM 136a (Figure 5a) and CRM 137 (Figure 5b) certified reference materials. The 2024 Neptune Plus mean values (green solid lines) and uncertainties, k = 2 (green dashed lines) values are plotted as are the certificate values for all CRMs with their mean values (solid black lines) and their uncertainties, k = 2 (gray dashed lines). All 241Pu/239Pu ratios (certificate and all measured Neptune Plus values) have been decay corrected to the approximate measurement date of the Neoma MS/MS data (09/17/2024).
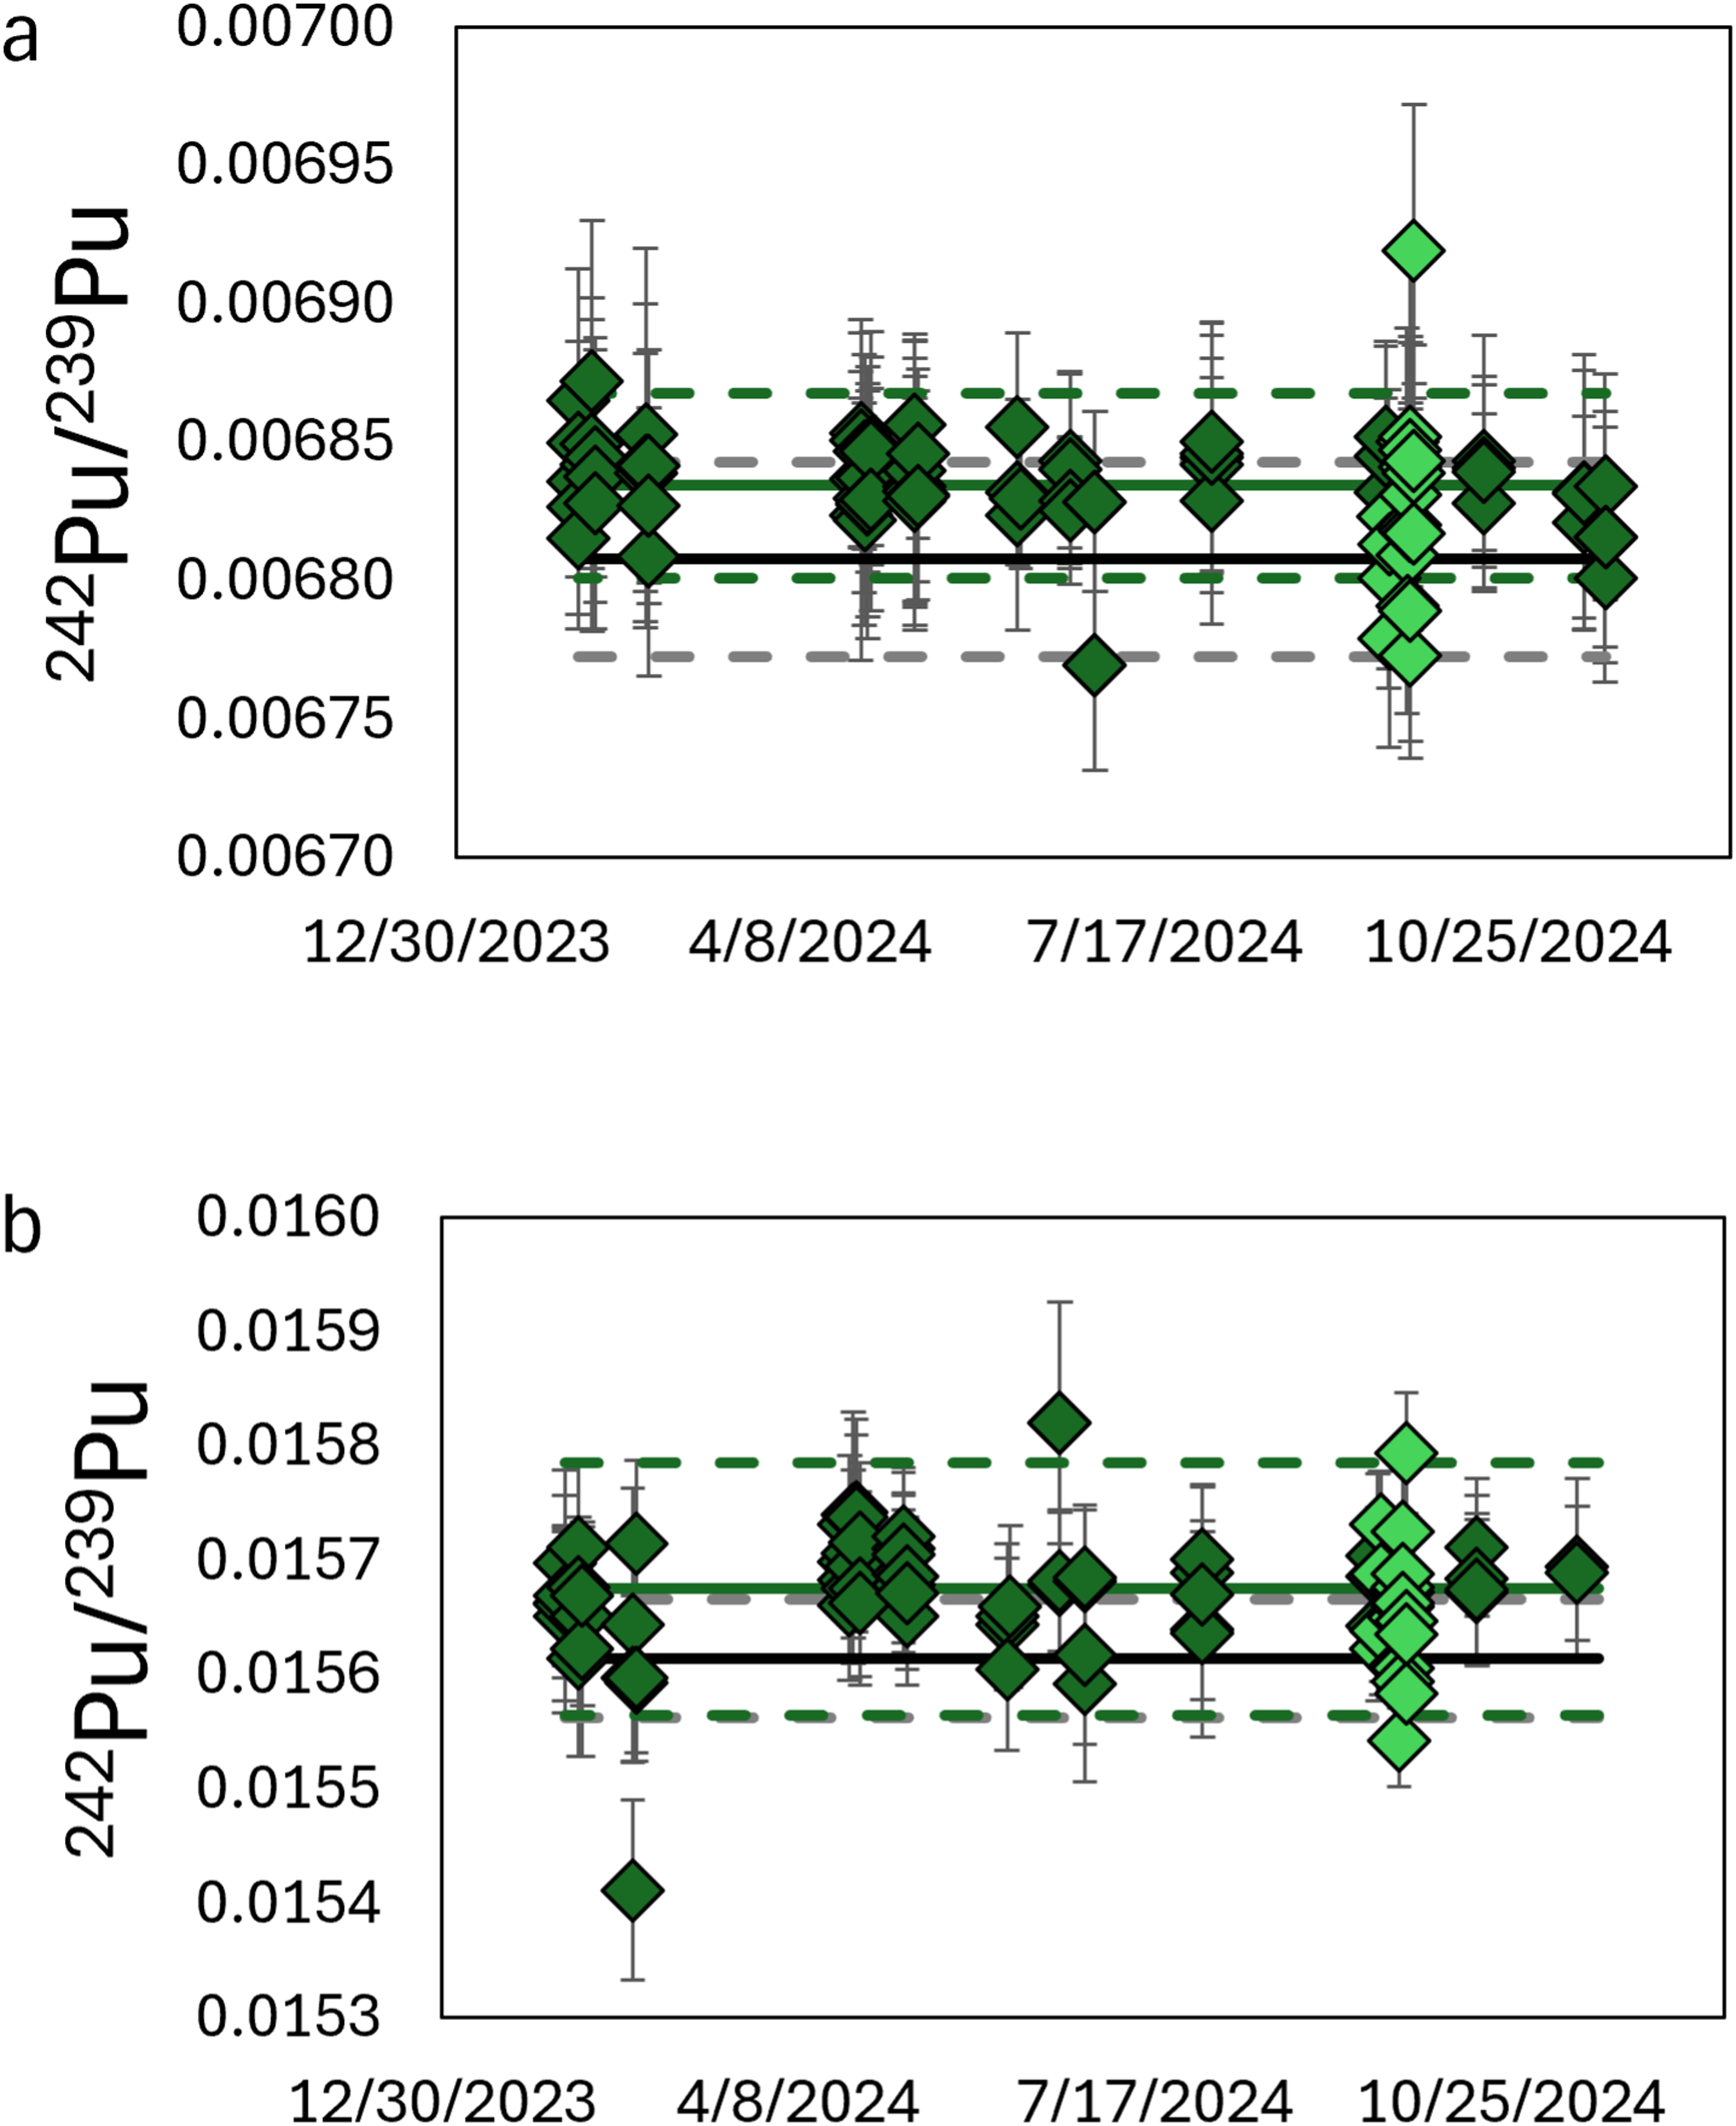
(a–b) Performance of the 242Pu/239Pu ratio for the Neoma (light green diamonds) and Neptune Plus (dark green diamonds) MC-ICP-MS for the CRM 136a (Figure 6a) and CRM 137 (Figure 6b) certified reference materials. The 2024 Neptune Plus mean values (green solid lines) and uncertainties, k = 2 (green dashed lines) values are plotted as are the certificate values for all CRMs with their mean values (solid black lines) and their uncertainties, k = 2 (gray dashed lines). All 241Pu/239Pu ratios (certificate and all measured Neptune Plus values) have been decay corrected to the approximate measurement date of the Neoma MS/MS data (09/17/2024).
Comparison of Results Between MC-ICP-MS/MS and MC-ICP-MS
Comparison of the MC-ICP-MS/MS Pu isotopic measurements obtained over the < 1-month-long duration of this study with the long-term performance of the MC-ICP-MS (Figures 1–3) reveals that both instruments produce data of similar precision and accuracy. This is evidenced by the observation that the MC-ICP-MS/MS data mostly plots within the k = 2 envelope defined by the long-term performance of the MC-ICP-MS for the 240Pu/239Pu (Figure 4), 241Pu/239Pu (Figure 5), and 242Pu/239Pu (Figure 6) for the CRM 136a and CRM 137 standard reference materials.
For the CRM 136a standard, the MC-ICP-MS/MS produced an average 240Pu/239Pu = 0.1448 ± 0.0006, a 241Pu/239Pu = 0.00371 ± 0.00006, and a 242Pu/239Pu = 0.00682 ± 0.00006, which compares well with the previous year averages on the MC-ICP-MS of 240Pu/239Pu = 0.1448 ± 0.0003, 241Pu/239Pu = 0.00371 ± 0.00003, and 242Pu/239Pu = 0.00683 ± 0.00003. For the CRM 137 standard, the MC-ICP-MS/MS produced an average 240Pu/239Pu = 0.2414 ± 0.0006, a 241Pu/239Pu = 0.00464 ± 0.00007, and a 242Pu/239Pu = 0.0157 ± 0.0001, which compares well with the previous year averages on the MC-ICP-MS of 240Pu/239Pu = 0.2412 ± 0.0004, 241Pu/239Pu = 0.00463 ± 0.00004, and 242Pu/239Pu = 0.0157 ± 0.0001.
Despite this good agreement, comparison of the MC-ICP-MS/MS Pu isotope ratios with Neptune Plus data on Figures 4–6, some of the MC-ICP-MS/MS data points appear to extend outside of k = 2 envelope defined by the MC-ICP-MS long-term average. However, removal of the long-term MC-ICP-MS data to allow better visualization of the individual MC-ICP-MS/MS data points (Figures 4–6) for both CRM 136a and CRM 137a indicates that this excursion is defined by only a few of the n = 20 repeat measurements. While the causes of these excursions need to be more fully examined, the basic observation that the MC-ICP-MS/MS and MC-ICP-MS perform in comparative fashion in unchanged. It should also be noted that there is inter-session variability in both the accuracy and precision of all the isotope ratios for both CRM observable in the long-term MC-ICP-MS data plotted on Figures 1–3. Examination of the variability of the individual MC-ICP-MS/MS measurements on Figures 4–6 suggests that the degree of variability in the MC-ICP-MS/MS measurements made over the relatively short duration of this study are comparable to the scatter seen in the MC-ICP-MS measurements.
Effect of Total Pu Concentration on Accuracy and Precision
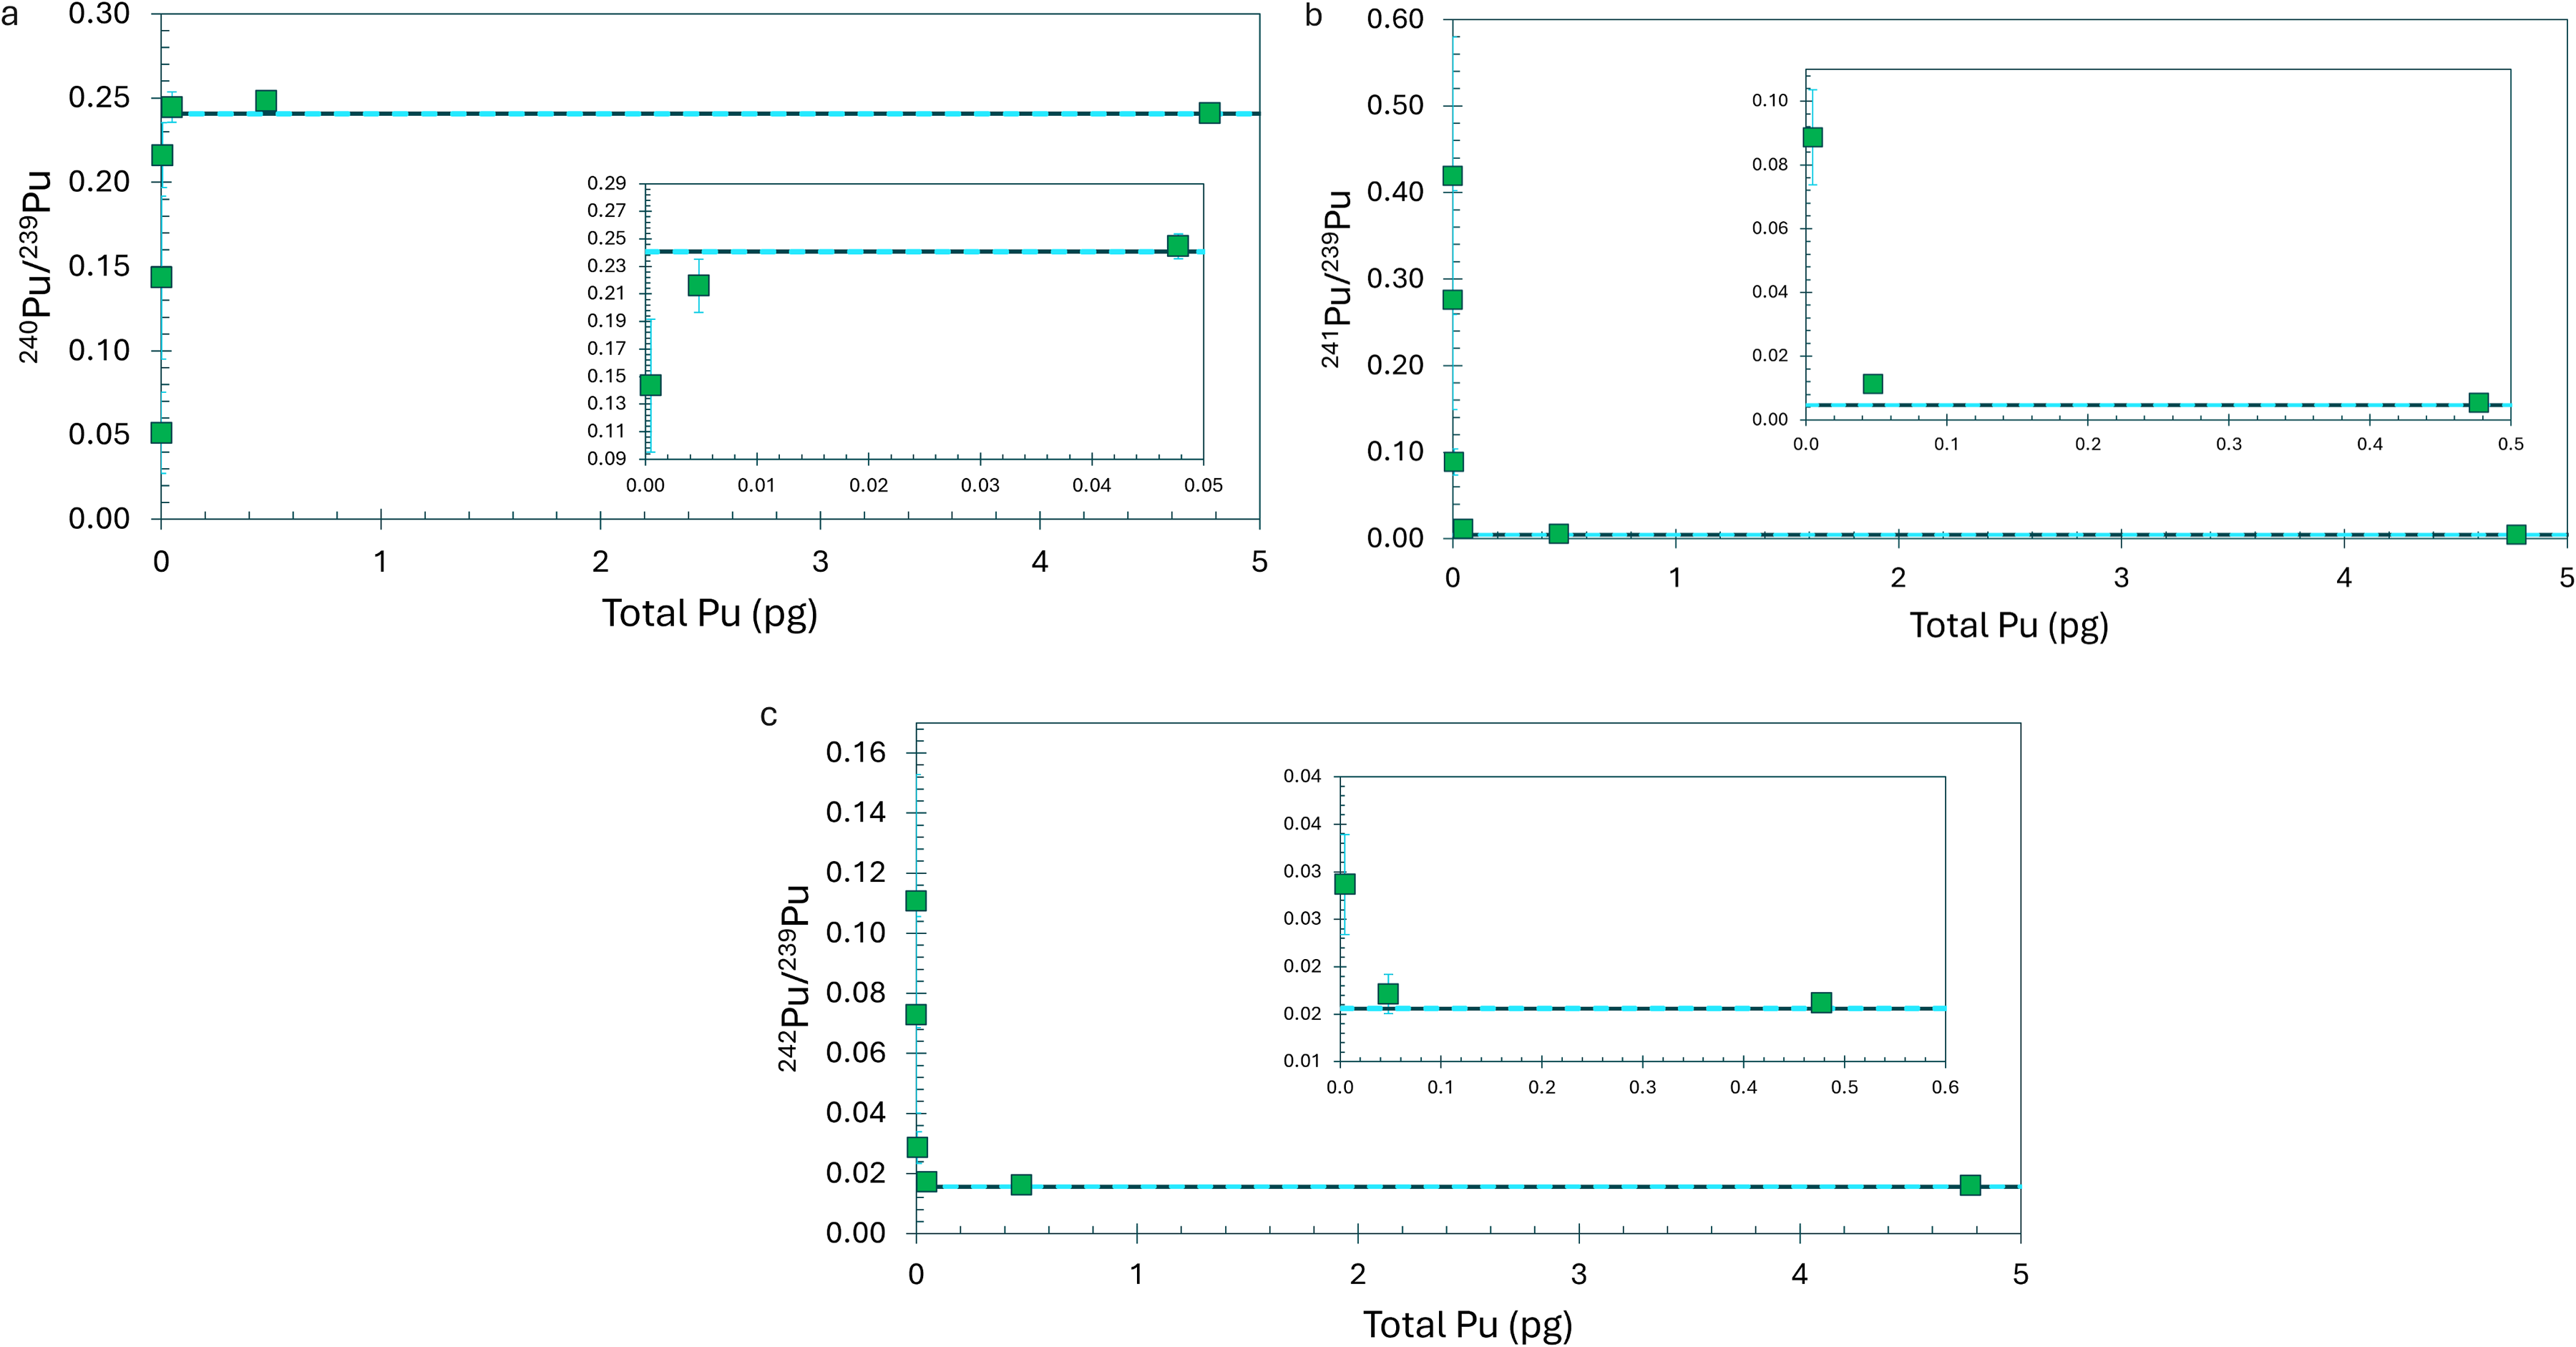
All of the repeat measurements of the CRM 136a and NBL137 materials discussed in the preceding results summary were conducted on aliquots containing 1.5 pg mL–1 of total Pu. At this concentration level, the results from the MC-ICP-MS/MS closely align with the long-term reproducibility exhibited by the MC-ICP-MS instrument for the same standards at the same concentration. To characterize the behavior of the MC-ICP-MS/MS results over a range of concentrations, a series of Pu isotope ratio measurements were made on six aliquots of the CRM 137 certified reference material. The resultant 240Pu/239Pu, 241Pu/239Pu, and 242Pu/239Pu ratios are shown in Figures 7a–c along with the certificate value and uncertainty of the CRM 137. The various Pu ratios appear to remain accurate well below the 1.5 pg mL–1 total Pu concentration but do eventually exhibit statistically significant deviations below 0.05 pg total Pu for the 241Pu/239Pu and 242Pu/239Pu ratios and below 0.005 pg total Pu for the 240Pu/239Pu ratios. The various Pu ratios are accurate above those amounts of total Pu.
Avenues for Future Study
To fully realize the potential of the MC-ICP-MS/MS, demonstration of the pre-cell mass filter's ability to remove elements that might pose isobaric interferences on the Pu isotopes of interest in a mixed matrix is needed. Specific to the field of nuclear safeguards, environmental swipes can contain non-actinide organic and inorganic materials that could easily result in the formation of polyatomic interferences during ionization in the plasma. This phenomenon has been extensively discussed, and the currently accepted best practices involve chemical purification via column chemistry prior to MC-ICP-MS analyses. This is because, during ashing and digestion, the entire swipe and its contents are mixed and thus require chemical separation to accurately measure the isotopes of Pu. The collision cell and pre-cell mass filter combination on the MC-ICP-MS/MS would allow potential interferences on Pu masses to be removed. However, this has not yet been demonstrated on the MC-ICP-MS/MS.
Perhaps equally important is the need to test the pre-cell mass filter's ability to separate U and Pu from one another under “real-world” conditions. This is because 238U can form the 238U1H hydride species, which has the potential to significantly impact the inferred 239Pu count rate. This is especially true for situations where the solution contains significantly more U than Pu. Lastly, it is important to note that all of the measurements conducted in this study were made using only CDD and SEM detectors. This is appropriate for the low pg mL–1 total Pu concentration levels examined in this study, but it will also be important to study the instrument's performance when higher concentrations are measured that require use of a mixed Faraday–SEM–CDD array. While the expectation is that detector cross calibration will behave similarly to the MC-ICP-MS, this will need to be confirmed under real world conditions.
Conclusion
In this comparison of the 240Pu/239Pu, 241Pu/239Pu, and 242Pu/239Pu ratios obtained for the CRM 136a and CRM 137 CRM over a ∼1-month interval on the MC-ICP-MS/MS against the long-term (∼1 year) average observed on the MC-ICP-MS the following conclusions are drawn. For solutions containing 1.5 pg mL–1 total Pu, the MC-ICP-MS/MS and Neptune perform comparably. The results from the MC-ICP-MS/MS measurements are within the k = 2 envelope defined by the long-term MC-ICP-MS measurements. The MC-ICP-MS/MS appears capable of producing accurate and precise Pu isotopic ratios for solutions containing < 1.5 pg mL–1 total Pu, but results become highly scattered at total Pu levels below 0.05 pg. Studies on the performance of the pre-cell mass filter's effectiveness is separating non target analytes potentially resulting in polyatomic isobaric interferences on the Pu isotope ratio measurement, as well in separating U and Pu from one another, are necessary.
Supplemental Material
sj-docx-1-app-10.1177_27551857251376027 - Supplemental material for Assessment of Low-Level Pu Isotope Ratio Measurements Using Multicollector Inductively Coupled Plasma Mass Spectrometry (MC-ICP-MS/MS) Equipped with a Pre-Mass Filter
Supplemental material, sj-docx-1-app-10.1177_27551857251376027 for Assessment of Low-Level Pu Isotope Ratio Measurements Using Multicollector Inductively Coupled Plasma Mass Spectrometry (MC-ICP-MS/MS) Equipped with a Pre-Mass Filter by N. Alex Zirakparvar, Benjamin T. Manard, Matthew D. Darnell, Melissa L. Adkisson, Shalina C. Metzger, Brian W. Ticknor, Cole R. Hexel and Daniel R. Dunlap in Applied Spectroscopy Practica
Footnotes
Acknowledgments
The authors want to thank the editorial handling of Dr. Mary Kate Donais and Dr. C. Derrick Quarles, and for two anonymous reviewers for providing comments that helped improve the paper.
Declaration of Conflicting Interests
The authors declared no potential conflicts of interest with respect to the research, authorship, and/or publication of this article.
Funding
The authors disclosed receipt of the following financial support for the research, authorship, and/or publication of this article: This manuscript has been authored by UT-Battelle, LLC, under contract DE-AC05-00OR22725 with the U.S. Department of Energy (DOE). The US government retains and the publisher, by accepting the article for publication, acknowledges that the US government retains a nonexclusive, paid-up, irrevocable, worldwide license to publish or reproduce the published form of this manuscript, or allow others to do so, for US government purposes. DOE will provide public access to these results of federally sponsored research in accordance with the DOE Public Access Plan (![]() ).
).
Supplemental Material
Supplemental material for this article is available online.
References
Supplementary Material
Please find the following supplemental material available below.
For Open Access articles published under a Creative Commons License, all supplemental material carries the same license as the article it is associated with.
For non-Open Access articles published, all supplemental material carries a non-exclusive license, and permission requests for re-use of supplemental material or any part of supplemental material shall be sent directly to the copyright owner as specified in the copyright notice associated with the article.