
Abstract
Fourier transform infrared spectroscopy (FT-IR) measurements using a diamond attenuated total reflection (ATR) accessory have become the primary sampling method for routine analyses. The accessibility and simplicity of the ATR sampling technique have made it available to a broad cross-section of casual users that are not aware of the spectral distortions that typically occur, particularly for strong absorption bands when compared to transmission experiments. This study discusses the basic principles of ATR measurements and presents simple criteria to measure good quality ATR FT-IR spectrum. The qualitative changes typical of good- and poor-quality ATR FT-IR spectra are presented so the analyst can easily identify photometrically accurate spectral data. These results highlight the significant spectral distortions that can occur for many materials when the analyst limits the sampling options to only a modern diamond ATR accessory. Because the difference in the refractive indices between the sample and ATR internal reflection element must be optimized, the user of a fixed incidence ATR accessory (typically 45°) should include both a diamond (and/or zinc selenide) as well as a germanium internal reflection element to ensure that high-quality ATR FT-IR spectra of a wide variety of samples can be measured.
This is a visual representation of the abstract.
Keywords
Introduction
Diamond attenuated total reflection (ATR) accessories are described as universal infrared (IR) sampling devices, and they work well in many situations. 1 The ATR technique is used routinely to measure the Fourier transform infrared spectroscopy (FT-IR) spectra of various condensed phase materials including solids, liquids, and thin films.2,3 This method is simple to perform, provides rapid and non-destructive measurements, and is typically the technique of choice today when an FT-IR spectral measurement is needed. As with any technique, however, there are problems and pitfalls that will result in erroneous or incomplete data. It is therefore important for the instrument operator to understand the fundamentals of the technique in order to generate the high-quality spectral data necessary to effectively use FT-IR.
A high-quality IR spectrum is essential to optimize the informational content and enable robust detailed, accurate qualitative and quantitative analyses.4,5 Spectral searching, quantitative analysis, and, most importantly, spectral interpretation all rely on access to high-quality data. The “gold standard” for a quality IR spectrum is a photometrically accurate transmission spectrum with little or no extraneous optical effects to distort and compromise the spectrum. This spectral quality is so important that a number of well-known IR spectroscopists devoted significant time and energy to define the parameters of a quality spectrum, describing it4,5 in both the literature and in reference works.
To accommodate the wide variety of condensed phase samples morphology and characteristics a wide variety of classical IR transmission sampling techniques exist.6,7 See the Supplemental Material for examples of transmission sampling techniques used for the compounds in this study including neat liquid films, solvent (chloroform) cast films, and Nujol (a mixture of liquid paraffins) mulls. In the simplest case, a transmission measurement of a thin uniform film (neat liquid or solid) involves transmission of IR light through the sample and measuring the IR spectrum from 4000 to 400 cm–1. Because of the intrinsic strong molar absorptivities in the IR region, a very thin film (<10 μm) is required to obtain suitable absorbances (below one absorbance unit) for a photometrically accurate IR spectrum. However, the material physical state, such as solubility, morphology, hardness, refractive index, reactivity, and thermal characteristics can all impact whether a sample of interest can be easily prepared for a classic transmission IR measurement. In the past, an experienced spectroscopist would evaluate the various sample technique options and select the optimal method for the particular sample and application. However, these traditional transmission sampling techniques require both skill and expertise from the analyst and may not be suitable for all samples. Alternative sampling methods have been developed to expand the scope of FT-IR applications, provide a simple, rapid sample methodology, and cope with the inevitable sampling issues, with ATR presently the most widely used. 8
The ATR measurement differs from the classic transmission measurement in a number of ways. ATR employs a material that is optically transparent to mid-IR light. The incident IR light reflects at the internal reflection element (IRE)/sampling interface, and that light is then measured providing the FT-IR response curve, which is ratioed against a clean background response curve to yield the absorbance spectrum of the sample. A successful ATR measurement requires that the refractive index of the IRE be significantly larger than that of the material of interest and that the angle of incidence must be greater than the critical angle (Snell's law2). Under these conditions, the IR beam will not exit at the reflection point of the IRE/sample interface. However, the incident light will propagate into the lower refractive index sample material for a short distance (within a few micrometers) with a well-defined path length. Here the IR beam penetrates the sample evanescently and interacts with the molecules, which results in sample absorption at selected frequencies providing the user with a characteristic IR spectrum. As a result of the two differing measurement principles for ATR and transmission, there will be differences between the optimally prepared transmission and the ATR FT-IR spectra. Furthermore, the measured ATR FT-IR spectra can be strongly affected and distorted (in band positions, band shape, and relative intensities) by the anomalous dispersion 9 of the refractive index within strongly absorbing bands. The spectral distortions resulting from these phenomena can be problematic for both qualitative and quantitative analyses.
Despite these phenomena, the advantages of using ATR sampling for FT-IR measurements have resulted in widespread adoption of this technique. The benefits of the ATR technique include little or no sample preparation, easy, fast, and simple-to-use sampling, and a short path length, which is beneficial with strongly absorbing samples typically encountered in the IR region. The disadvantages of the technique are that it is a surface technique therefore providing no information on the bulk or interior of the sample. Furthermore, in some applications, the short path length results in a loss of sensitivity to minor concentrated species. Finally, unless you understand the impact of the optical considerations, there may be significant distortions that occur in the spectrum and can impact both identification and quantitative analysis. A number of very good references exist2,3,8 that cover the situations described in this paper.
In this study, we characterize the performance characteristics of ATR measurements using a modern single bounce ATR accessory, with an incidence angle of 45°, using both diamond and germanium IREs without a polarizer. No software-based ATR corrections were made to the measured FT-IR spectra. We measure the FT-IR spectrum of various materials that vary in refractive indices from 1.36 to 2.03 using diamond and germanium IRE for the ATR measurements and also include classical transmission sample preparation methods (see Supplemental Material). These results highlight the significant spectral distortions that can occur for many materials when the analyst limits the sampling options to only a modern diamond ATR accessory. We demonstrate the importance of maximizing the difference between the sample material and the IRE refractive index (Δn > 1) to obtain a high-quality ATR FT-IR spectrum with minimal spectral distortions. More importantly, we provide a guide to the typical spectral distortions to look out for, which indicate a poor-quality ATR FT-IR spectrum, requiring the selection of germanium rather than a diamond or zinc selenide (ZnSe) IRE.
Experimental
Materials and Methods
Instrumental
Fourier transform infrared spectroscopy (FT-IR) measurements were made on an Agilent Technologies Cary 670 FT-IR spectrometer at 4 cm–1 resolution and 32 scans using ResolutionsPro FT-IR software (v.5.3.0, Agilent Technologies). The interferometer utilized an extended-range KBr beamsplitter and a cooled deuterated L-alanine doped tri-glycine sulfate detector. A Norton–Beer medium apodization with a zero-fill factor of 4 was employed. A Jacquinot stop of 1 cm was used for all FT-IR measurements.
Attenuated Total Reflection (ATR)
An in-compartment ATR accessory (GladiATR, Pike Technologies) was used for the FT-IR spectral measurements. It should be noted that the ATR accessory was firmly bolted into the sample compartment to ensure that the accessory did not shift when pressure was applied to the sample. The ATR FT-IR spectra were collected over the 4000–400 cm–1 spectral region with the diamond IRE and 4000–500 cm–1 spectral region for the germanium IRE. Both IREs from the vendor utilize an anti-reflective coating. Because of this, the IREs were stored in a nitrogen-purged desiccator when not in use. The FT-IR measurement procedure included the measurement of a single-beam background scan of the cleaned IRE, the transfer of the solid sample onto the IRE, and the measurement of the sample ATR FT-IR scan. The IRE was then cleaned using a Kimwipe tissue dampened with a 95% solution of isopropanol (IPA) and was confirmed to be free of chemical contamination by a simple ATR FT-IR absorbance scan relative to the single-beam background scan.
Attentuated Total Reflection (ATR) Spectral Correction
The ATR spectrum differs from a classic transmission spectrum because the light penetrates the sample at a depth proportional to the wavelength. Longer wavelength light (i.e., smaller wavenumbers) passes through more of the sample and therefore magnified absorbances occur at longer wavelengths. Thus, when compared to a classic transmission spectrum, the absorbances at lower frequencies are proportionally greater than at higher frequencies. The important parameters in the ATR depth of penetration include: the incident light wavelength, the angle of incidence to the IRE, the refractive index of the IRE, and the refractive index of the sample. Differences in peak frequencies and band shape are also expected in an ATR-measured IR spectrum compared to a standard transmission spectrum.
The ATR spectrum is corrected using the ATR Correct Algorithm 2 in the ResolutionsPro (v.5.3.0.1694) and Advanced ATR correction (advatrcor) in the Omnic 9 (v.9.13.1294) software. (See below for a description of these algorithms.) Common parameters selected in the software included a crystal angle of incidence of 45.00°, a crystal name of diamond with a corresponding refractive index of 2.4175, and the number of bounces equal to 1. The sample refractive index values used are summarized in Table II. The earlier ResolutionsPro ATR algorithm corrects only the wavenumber intensity dependence. The later more advanced Omnic 9 ATR algorithm corrects for both the wavenumber intensity dependence as well as peak shifts due to anomalous dispersion.
Transmission FT-IR Sample Preparations
Chloroform Cast Film on KBr Optical Plates
The transmission FT-IR spectra were collected over the 400–400 cm–1 using a cast film sample preparation. Approximately 50 mg of the analyte of interest, poly(methyl methacrylate) (PMMA) or dibenzoylmethane (DBM), was transferred to a 14.786 mL (4 dr) vial and 2 mL of chloroform was added. The sample was gently mixed with the chloroform until fully dissolved in the solvent. Using a glass Pasteur pipet, a drop of the chloroform solution with the analyte of interest was deposited onto a 25 mm × 4 mm KBr optical window and a film was drawn 6 to produce a uniform sample film. The cast film was then placed in the FT-IR spectrometer for the transmission measurement.
Neat Liquid Films
The transmission FT-IR spectra of the liquid samples (2-propanol and benzonitrile) were collected in the 4000–400 cm–1 spectral region using a capillary film sample preparation. A drop of the liquid sample was sandwiched between two 13 mm × 2 mm polished KBr optical discs and the sample was then placed in the FT-IR spectrometer for the transmission measurement. The FT-IR spectrum of 2-propanol was also measured using a fixed path length 10 μm sodium chloride (NaCl) sealed liquid cell.
Nujol Mull
The transmission FT-IR spectrum of phosphorus pentoxide was collected in the 4000–400 cm–1 spectral region using a Nujol mull sample preparation.6,7 Approximately 50 mg of the sample was ground in an agate mortar and pestle until it took on a smooth glossy appearance. Approximately two drops of spectroscopic grade Nujol oil (PerkinElmer, no. 186-2302) were added to the mortar and ground until a smooth creamy paste was obtained. A small amount of the mull was transferred to the center of a KBr optical disc (25 mm × 4 mm), sandwiched with a second identical disc, and pressed to a thin film. The mull was spread out into a thin translucent film, free of holes or voids, and placed in the FT-IR instrument for transmission measurement.
Materials
Poly(methyl methacrylate) (Sigma Aldrich, MKCV4446), 2-propanol, high-performance liquid chromatography grade (Fisher Scientific, 152863), DBM (Acros Organics, AO368539), phosphorus pentoxide (Sigma Aldrich), and benzonitrile (Sigma Aldrich, STBL0752) were used as supplied.
The NaCl and KBr optical discs (25 mm × 4 mm and 13 mm × 2 mm) from International Crystal Laboratories were used as supplied for capillary films and Nujol mull sample preparation. A 10 μm NaCl fixed path length cell (International Crystal) was also used for the 2-propanol transmission measurement.
Results and Discussion
Complex Refractive Index: Anomalous Dispersion
Attenuated total reflection (ATR) sampling is actually a multifaceted optical technique that involves a number of factors including the optical geometry of the system and the effect of the complex refractive index on the absorption of light.
The complex refractive index is a fundamental concept that describes how light propagates through a medium.
9
It is defined in Eq. 1 as:

Both of these quantities vary with wavelength. For k, the absorptivity coefficient, this variation with wavelength is the absorption spectrum over the wavelength region of interest. For n, the real portion of the refractive index exhibits a small systematic change in value as a function of wavelength. However, within the spectral region of an absorption band, a large bisignate change in the refractive index occurs, which is classified as anomalous dispersion.2,9 The behavior of these two quantities (absorption and refractive index) over the region where an absorption occurs is shown in Figure 1. This bisignate behavior of the refractive index within an absorption band is important since it can result in distorted (i.e., non-transmission-like) spectra in some reflectance-based measurements as well as in ATR experiments.

Schematic depicting a strongly absorbing IR band and the corresponding bisignate response of the refractive index (i.e., anomalous dispersion) within that absorbance band.
Transmission and External Reflection Based IR Measurements
The simplest analysis technique for any spectroscopic measurement is a transmission measurement.6,7 In this measurement, light passes from a medium of lower refractive index (air) to a medium of higher refractive index (the sample) and back again to the instrument detector. The light is refracted at the two interfaces, and when done correctly with a well-known path length, the resulting spectrum fully represents the sample with little or no artifacts. Figure 2 shows the transmission FT-IR spectrum of PMMA, which is a well-established commercially important material often used to demonstrate various IR sampling methodologies.10,11 The solvent-cast film of PMMA was clear and of uniform thickness with the FT-IR spectral data meeting all the requirements of a photometrically accurate (i.e., Class II5) spectrum. The Supplemental Material provides the transmission spectrum of PMMA along with the corresponding band assignments (Figure S1 and Table S1, Supplemental Material).

The FT-IR spectra of PMMA prepared as a chloroform cast film on a KBr optical plate. The FT-IR spectra of the PMMA film were measured in transmission (blue trace) and in specular reflectance (red trace).
In an external reflection measurement of a simple film such as PMMA, the resulting measured FT-IR spectrum is convoluted by the anomalous dispersion phenomena within the strong absorption bands (see PMMA FT-IR spectrum in Figure 2). Here in the simple external reflection experiment, the IR light is reflected from a surface and measured at the instrument detector. When the reflecting surface has a higher refractive index than the ambient air (launching medium) and no absorption occurs in the region of interest, total reflection occurs, where the angle of incidence and reflection are equal.
If the surface material itself has an IR absorption, the spectrum will include a combination of effects from both the real and imaginary components of the complex refractive index (Figure 1). The external reflection IR spectrum will exhibit significant distortions with bisignate spectral features within the strong absorption bands due to anomalous dispersion as shown in Figure 2b. Typically a Kramers–Kronig transformation is employed to deconvolute the measured reflectance FT-IR spectrum resulting in a more informative spectrum similar in features to the absorption spectrum. 12
Principles of ATR Measurements
The ATR sample measurement is another example of a reflection experiment. ATR is a simple contact sampling method that utilizes an IRE with a high refractive index and excellent IR transmitting properties. The sampling technique capitalizes on the spectral information that can be obtained from the reflection phenomena and is used to measure the IR spectra of the surface (1–10 μm) of materials that are too thick or strongly absorbing to be easily analyzed by more traditional transmission methods. For the ATR experiment to work, the angle of incidence must be greater than the critical angle so that total internal reflectance occurs (i.e., refraction of light does not occur/is imaginary, see below).2,3,9
An ATR experiment can be thought of as being between the two extremes of transmission and external reflection discussed above. In this experiment, the IR light travels from a medium with a high refractive index to a sample material with a lower refractive index. Typically, an IRE is employed using a few IR transmitting materials (Table I). In this case, the IR light is bent away from the normal as it crosses the interface and there will be some angle of incidence where the light will just travel parallel to the interface. This is the critical angle2,3,9 as defined below in Eq. 2.

Commonly used ATR* crystal materials and characteristics.
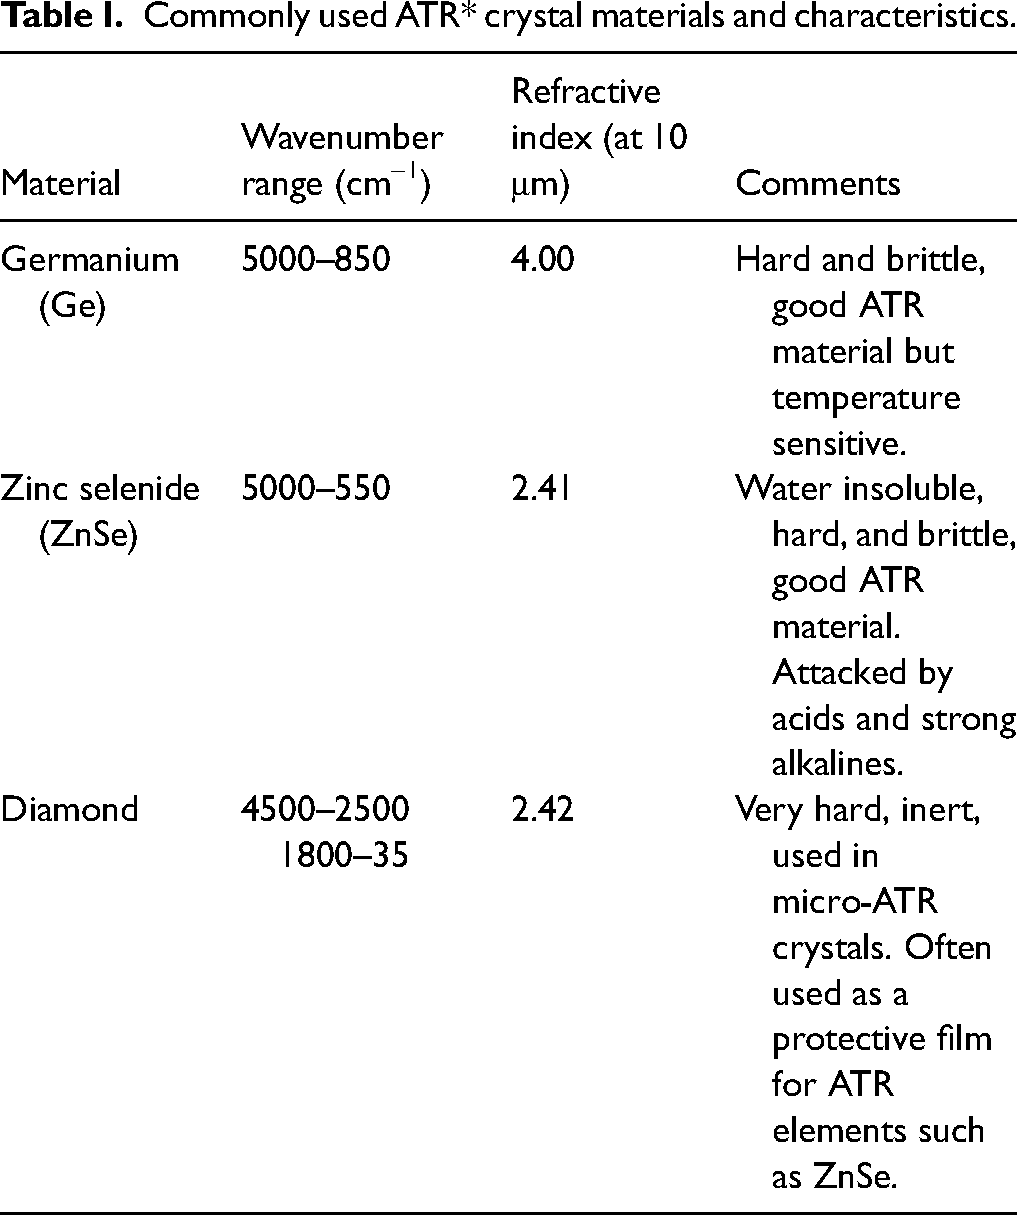
Figure 3 depicts the dependence of light transmission, refraction, and reflection upon both the material refractive indices and the angle of incidence. However, the fully reflected light does contain spectral information about the sample at the sample/crystal interface and the ATR technique capitalizes on this. An ATR accessory provides an IR spectrum of a sample because the radiation at the reflection point probes the sample with an “evanescent wave". At a frequency within an absorption band the reflection will be attenuated while at frequencies well away from an absorption band all light is reflected.
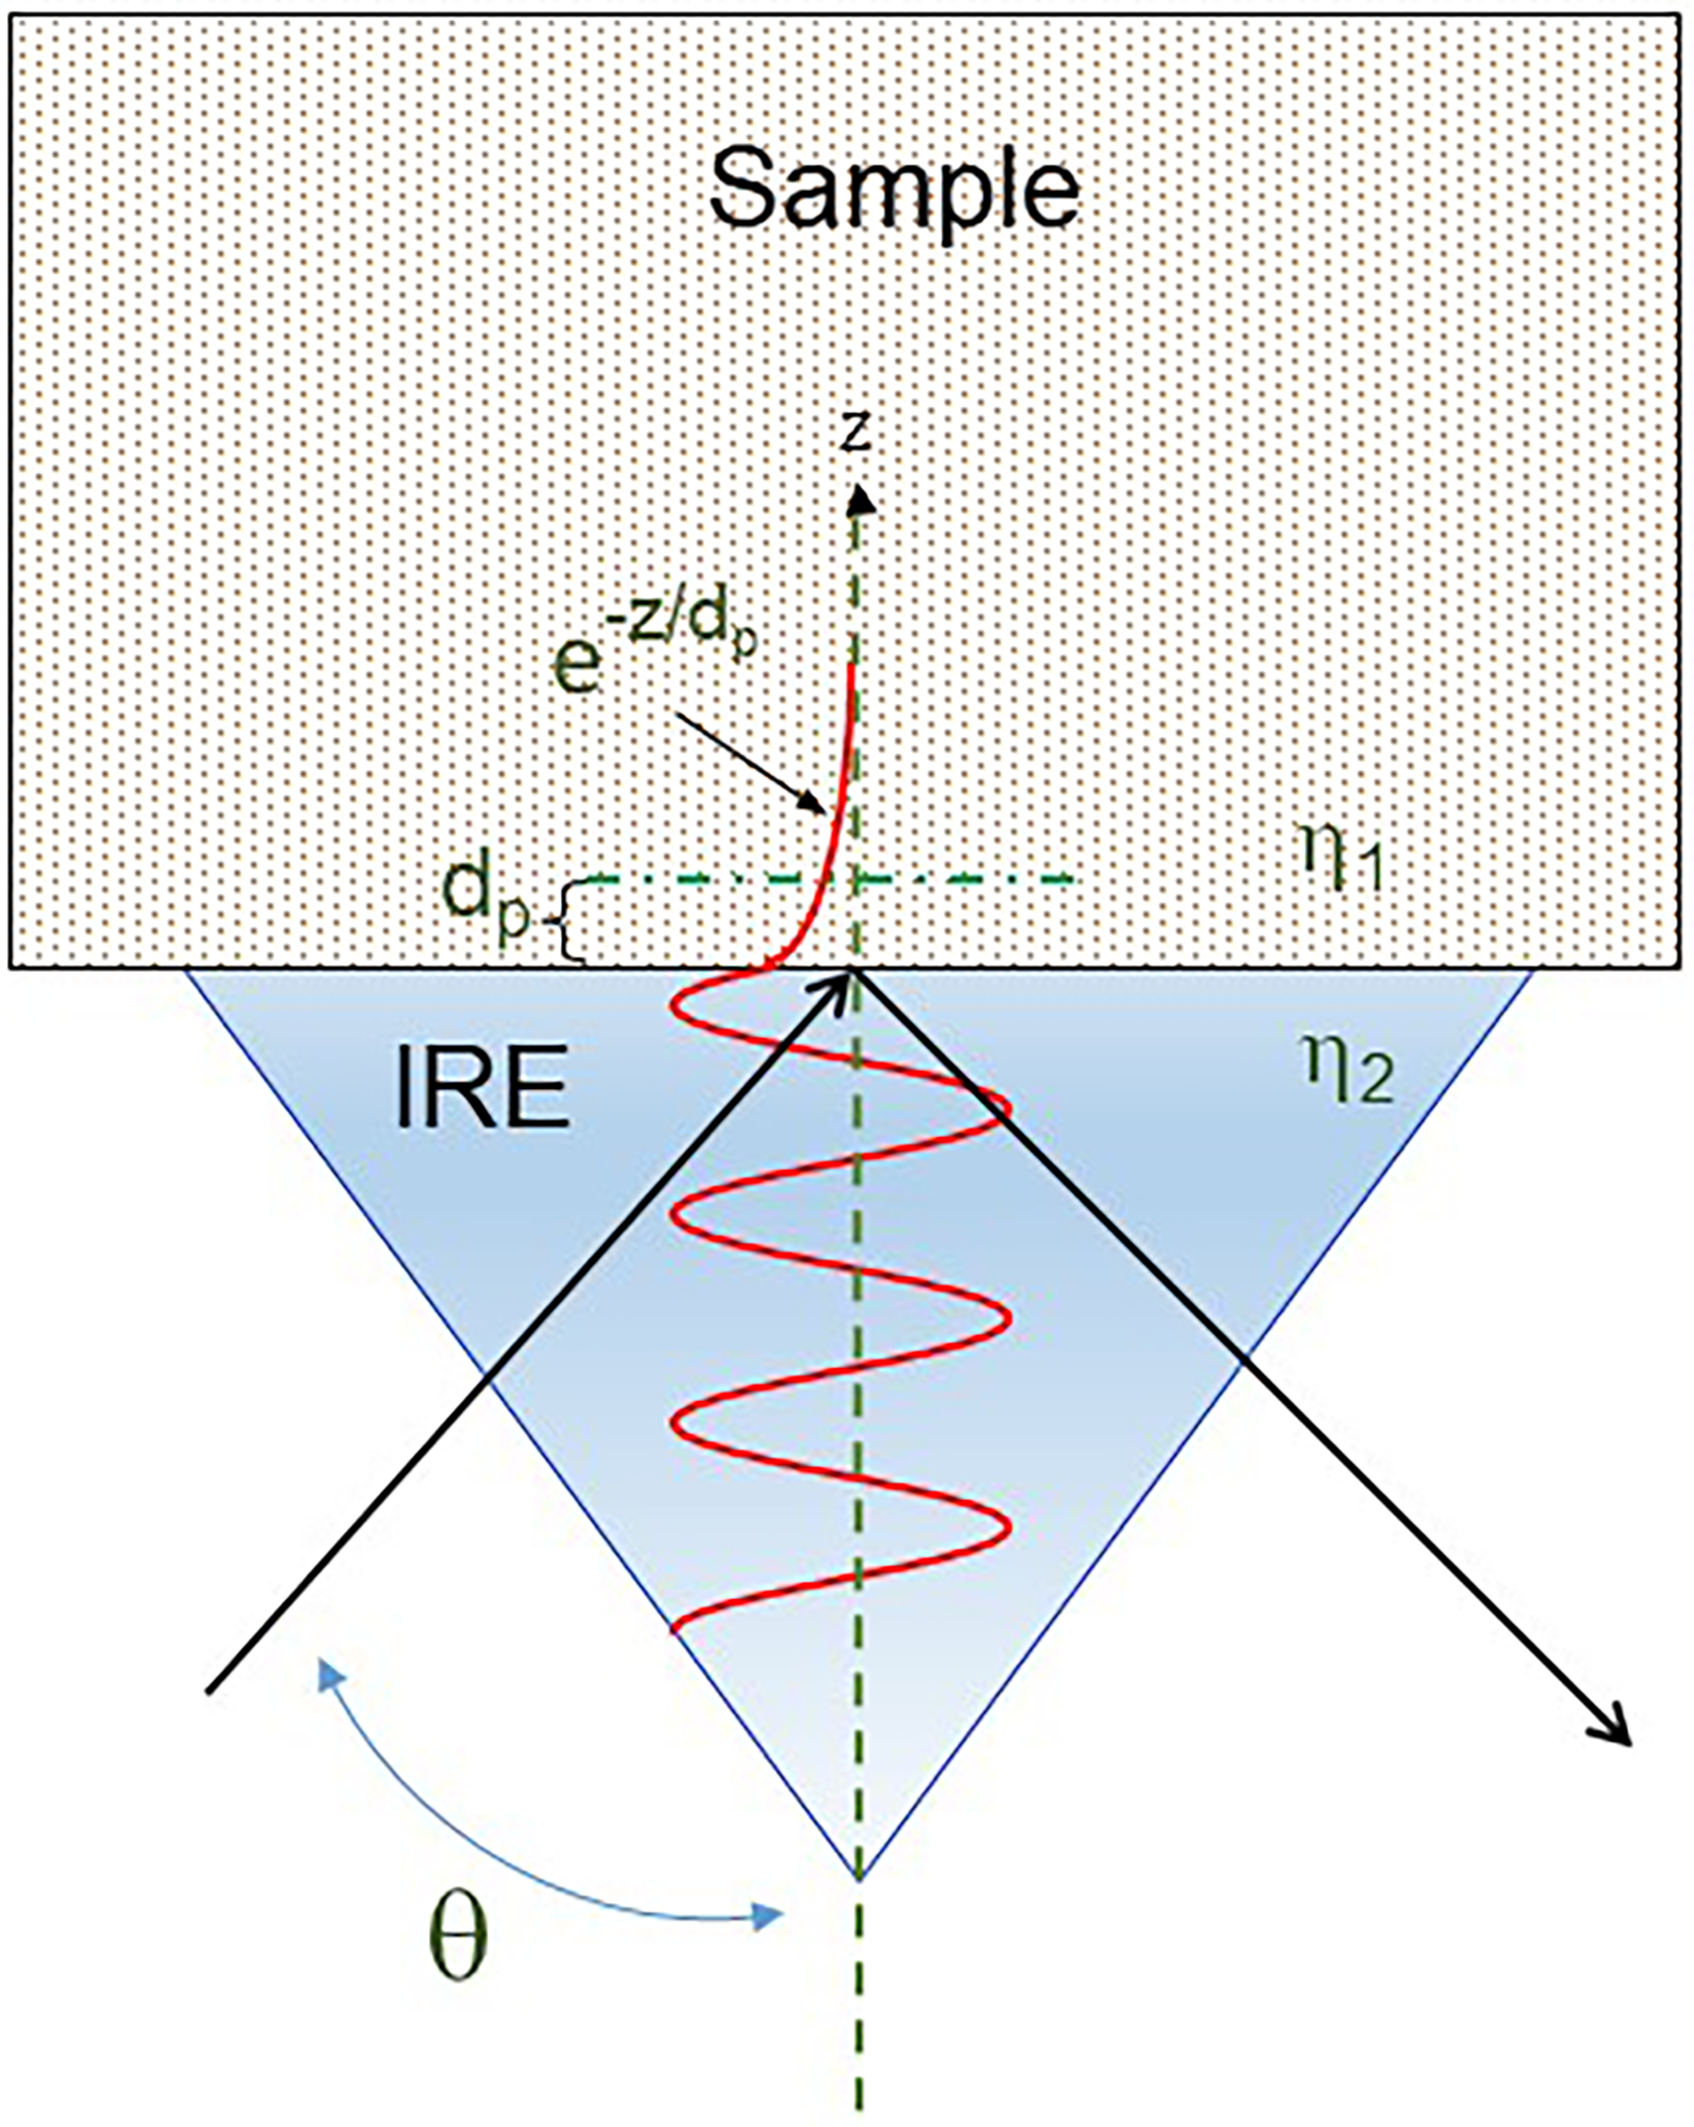
Diagram of a single reflection attenuated total reflectance at an IRE-sample interface depicting the basic principles of the technique.
As depicted in Figure 3, the reflected radiation penetrates the sample boundary as a so-called evanescent wave.2,3 The electric field amplitude of this evanescent wave exhibits an exponential dependence. The parameter, dp, the effective penetration depth is expressed as:
There are a number of important consequences resulting from the physics of the ATR measurement. The sampling depth of the ATR method is wavelength dependent and increases with increasing wavelength. Typically, in the mid-IR, the wavelength region is 2.5–25.0 μm (i.e., 4000–400 cm–1), experimentally varying the angle of incidence of the light and the refractive index of the crystal can be used to control the sampling depth. Increasing either the IRE refractive index or angle of incidence, results in a decreased sampling depth. A careful comparison with classic transmission spectra also indicates that ATR measurements result in small differences in peak frequencies and band shapes as a result of refractive index effects (see Figure 2). Exceeding the critical angle will result in data that shows the dramatic impact anomalous dispersion can have, which significantly distorts the spectrum.
Using Diamond as an IRE
Using diamond as the IRE is a standard approach in analytical IR spectroscopy. Because the material is inert, hard, and has a large spectral range, it is usually the material of choice. But there are a number of factors that must be understood to obtain useful data.
The first factor that must be understood is the presence of phonon bands (Figure 4). Phonon bands result from the vibrations of the normal modes in the diamond crystalline solid. Because the diamond phonon bands are in the 2500–1800 cm–1 region of the spectrum, well above the fingerprint region and below the C–H stretching region, they are typically considered to be unimportant in the analytical experiment. They will, however, potentially interfere with some cumulated double bonds and triple bond containing species. 7

The FT-IR spectrum of the Gladiator (PIKE) diamond ATR IRE. The background was measured using the specular reflectance accessory and a gold slide on the Gladiator accessory. The observed absorbance bands of the diamond ATR IRE include contributions from the diamond phonon bands and the IRE anti-reflective coating.
The second factor is the refractive index of the material. Diamond has a refractive index of 2.42, which is well above most common organic materials. The design of single-reflection diamond ATR accessories sets the angle of incidence at 45° so that the critical angle criterion is often met for organic materials. Table II shows some of the parameters of the samples discussed here.
Sample refractive indices compared to the ATR elements and the calculated critical angles.

Sample and IRE Refractive Index Values Determine Quality of the ATR FT-IR Spectrum
Good Quality ATR FT-IR Spectra: IPA
A neat liquid such as IPA, shown in Figure 5 provides a simple system for both ATR and transmission (capillary film) FT-IR measurements. The refractive index of IPA is 1.35 while that of diamond is considerably higher at 2.42. The transmission FT-IR spectrum of the IPA is of good quality and is photometrically accurate. The ATR FT-IR spectrum of IPA is measured using a diamond IRE and is of similarly high quality. The most obvious differences between the two FT-IR spectra of IPA are the wavelength dependence of the absorbances in the ATR spectra where the higher frequency bands such as the OH stretch are less intense and the lower frequency bands in the fingerprint region exhibit stronger absorption. This occurs since the depth of penetration in an ATR experiment is wavelength dependent (Eq. 3). As expected, some small frequency shifts of the IR bands are observed in the ATR measured spectra but no distortions due to anomalous dispersion occur. The transmission FT-IR spectrum (10 μm fixed path-length cell) and IR band assignments are presented in the Supplemental Material (Figure S2 and Table S2).

The FT-IR spectra of IPA measured using a diamond ATR accessory (red trace) and in transmission geometry as a capillary film (black trace). The FT-IR spectra have been intensity normalized to the methyl asymmetric deformation at 1467 cm–1. Little or no spectral distortion in the band shapes is observed when using the diamond IRE. However, the expected wavenumber (wavelength) intensity dependence is observed.
Dibenzoylmethane (DBM): Poor Quality ATR FT-IR Spectrum
When the refractive index of the sample begins to approach the refractive index of the IRE, we start to see the impact of anomalous dispersion on the ATR FT-IR spectrum. Figure 6 shows the spectrum of DBM measured using a diamond ATR at 45° (upper red trace) and using a germanium ATR element also at 45° (lower blue trace). As a reference comparison, the transmission FT-IR spectrum (chloroform cast film) and IR band assignments for DBM are presented in the Supplemental Material (Figure S3 and Table S3).

The ATR FT-IR spectra of DBM measured using a diamond (red trace) and germanium (blue trace) IRE. The measured DBM is in the enol form (II). Note the significant spectral distortion in both band shape and relative intensities observed when using the diamond IRE. The negative spectral features in the 2400–1900 cm–1 spectral region derive from the diamond phonon bands.
Using the diamond IRE, we see a number of distortions and artifacts in the ATR FT-IR spectrum of DBM related to approaching the critical angle, which are not observed when using the germanium IRE. The refractive index of DBM is 1.62 while that of diamond is considerably higher at 2.42 and germanium is even higher at 4.00. As summarized in Table II, the calculated critical angle for DBM with a diamond IRE is 42.54°, which is approaching the accessory θ incidence angle of 45°. The calculated critical angle for DBM with the germanium IRE is 23.89° well below the accessory incidence angle (θ).
A quick comparison of the DBM FT-IR spectra measured with germanium and diamond IRE illustrate the significance to the quality of the measured ATR FT-IR spectrum of the sample relative to the IRE refractive indices. The diamond ATR FT-IR spectrum of DBM exhibit the following spectral artifacts:
Negative diamond phonon bands (2400–1800 cm–1). Changes in relative band intensities (weak bands are more intense relative to stronger bands particularly in the fingerprint region). Substantial asymmetry in spectral band shapes particularly for more intense bands due to anomalous dispersion. See out-of-plane aromatic bands (800–500 cm–1). Frequency shifts of more intense bands due to anomalous dispersion. Distorted spectral baseline.
The ATR FT-IR spectrum of DBM acquired using the germanium IRE compares quite well with the reference transmission spectrum of the DBM solvent cast film (Figure S3, Supplemental Material). Only the expected wavelength-dependent absorbance intensities and minor peak shifts are observed. Thus, to measure a photometrically accurate ATR spectrum of an organic such as DBM with a refractive index of 1.62 requires use of a higher refractive index IRE such as germanium.
Phosphorus Pentasulfide (P4S10): Unusable ATR FT-IR Spectrum
When the refractive index of the sample approaches the refractive index of the IRE, we observe the catastrophic impact anomalous dispersion has on the measured ATR FT-IR spectrum. The ATR FT-IR spectra of P4S10 measured using a diamond IRE at 45°, (upper red trace) and using a germanium IRE (lower blue trace) are shown in Figure 7. As a reference comparison, the transmission FT-IR spectrum (Nujol mull) and IR band assignments for P4S10 are presented in the Supplemental Material (see Figure S4, with accompanying table of band assignments, Table S4, Supplemental Material).

The ATR FT-IR spectra of P4S10 measured using a diamond (red trace) and germanium (blue trace) IRE. The FT-IR spectrum measured using a diamond IRE exhibits profound spectral distortion of the IR bands involving the P=S and P–S–P stretches in the 700–400 cm–1 spectral region. The large negative spectral features in the 2400–1900 cm–1 spectral region derive from the diamond phonon bands.
Using the diamond IRE, we see profound spectral distortions and artifacts in the ATR FT-IR spectrum of P4S10 related to exceeding the critical angle, which are not observed when using the germanium IRE. The refractive index of the P4S10 sample is >2, as shown in Table II. As summarized in Table II, the calculated critical angle for P4S10 with a diamond IRE is 57.76°, which exceeds the accessory θ incidence angle of 45°. The calculated critical angle for P4S10 with the germanium IRE is 30.49°.
A quick comparison of the P4S10 FT-IR spectra measured with germanium and diamond IRE again illustrates the significance of the sample relative to the IRE refractive indices. The diamond ATR FT-IR spectrum of P4S10 exhibit the following spectral artifacts:
Prominent negative diamond phonon bands (2400–1800 cm–1). Profound distortion of spectral band shapes to a bisignate form due to anomalous dispersion. See the P=S and P–S–P stretching bands in the 700–400 cm–1 spectral region. Distorted spectral baseline.
Neither qualitative nor quantitative analyses are possible with the FT-IR diamond ATR spectrum of P4S10. However, the ATR FT-IR spectrum of P4S10 acquired using the germanium IRE compares quite well with the reference transmission spectrum of the Nujol mull prepared transmission FT-IR spectrum (Figure S4, Supplemental Material).
When the sample is run using a germanium ATR IRE (Figure 7), the information in Table II indicates that we will not violate the critical angle criteria, and the spectrum quality is acceptable. By looking at both spectra, however, we see that we may have lost information because the long wavelength cut-off using the germanium IRE is 550 cm–1, and the spectrum collected with the diamond (and in transmission using a Nujol mull preparation, Figure S4, Supplemental Material) indicates that there are significant characteristic absorption bands below 550 cm–1.
Rule of Thumb to Select Suitable IRE for Good Quality ATR FT-IR Spectrum
A simple rule of thumb that will help in determining if the spectrum will be good, bad, or unusable involves simply comparing the difference in the refractive index between the IRE and the sample (Δn). This approach assumes the angle of light incident on the IRE is fixed (in this case θ ≅45°). In the best-case scenario, there is a large difference between the sample and IRE refractive index where:
However, if the difference between the sample and IRE refractive indexes (Δn) decreases such that
Finally, in the case where the sample and IRE refractive indexes (Δn) are becoming similar:
Weakly Absorbing IR Bands in the Diamond IRE Phonon Spectral Region
Unfortunately, there is another effect that will manifest itself when using ATR, particularly with a diamond IRE, and that has to do with samples with characteristic weak bands in the 2400–1800 cm–1 region. This can include triple bond and cumulated double bond species as well as some overtone and combination bands (such as aryl summation bands). Since the diamond phonon bands are typically a strong absorber, this can limit the energy throughput of the instrument in this spectral region.
The problem is shown in Figure 8 (blue trace). A comparison of the capillary film spectrum of benzonitrile (see Supplemental Material for full interpretation and band assignments) compared to the benzonitrile collected using a diamond IRE (green) and overlaid with the diamond spectrum clearly shows the nitrile, which is a strong absorption and can be measured over the diamond signature. But in the insert, we see the characteristic aromatic ring summation bands. These summation bands are clearly observed in the transmission spectrum. However, these bands are only poorly defined in the diamond ATR based FT-IR spectrum due to the low intensity of the band and the small amount of light reaching the detector from the diamond IRE. This illustrates how by using a diamond IRE, key spectral information could be lost. A relevant commercial example of this could be acrylonitrile copolymers where the nitrile band is weak, but highly characteristic of the presence of acrylonitrile. Using a diamond ATR, the nitrile could be missed and the sample misidentified.

The FT-IR spectral overlay in the 2400–1800 cm–1 region of benzonitrile (PhCN, also known as BzCN) measured using a diamond ATR accessory and in transmission geometry as a capillary film. The FT-IR spectra have been intensity normalized to the nitrile C≡N stretch at 2229 cm–1. The FT-IR spectra include transmission measurement of PhCn capillary film (blue trace), diamond ATR of PhCn (green trace) and absorbance measurement of the diamond IRE (red dotted line).
Poly(methyl methacrylate) (PMMA): Band Shifts and ATR Corrections
The FT-IR spectra of PMMA illustrates the effects of using ATR on a strongly absorbing band. We have seen above how the ATR spectrum is a convolution of both the real and the imaginary portions of the complex refractive index, and in practice one component exhibits a positive band (the absorption coefficient or the imaginary component) while the other displays a derivative-like bisignate feature (the real refractive index). Convolution of those two components will result in a peak shift in the ATR FT-IR spectrum from the true position of the band absorption maximum.
Most sophisticated users of FT-IR realize that they must be careful when searching an ATR spectrum against a transmission library of data, and this has been pointed out in the literature.13,14 Even when the spectrum has been corrected for the wavelength dependence of penetration depth, as is typical for most correction algorithms, the peak shift remains.
But how big is this shift and how much will it matter? As a general observation, more strongly absorbing bands will result in a larger frequency shift. Furthermore, the size of the refractive index difference between the sample and the IRE (Δθ) will also define the magnitude of the frequency shift. In the upper panel of Figure 9, we show the extent of the shift for the case of a good quality ATR FT-IR spectrum (i.e., Δθ ≅ 1 for PMMA).

The FT-IR spectra of PMMA chloroform cast film on a KBR optical plate using transmission and ATR techniques. In the upper spectral overlay, the FT-IR spectra were measured in classic transmission (red trace) as well as with an ATR accessory using a germanium (green trace) and a diamond (blue trace) IRE. Note the significant shifts in the carbonyl peak from 1731 to 1724 cm–1 as a result of the anomalous dispersion of the refractive index in the ATR measurements. In the lower spectral overlay, the FT-IR spectra of the transmission (red trace) is compared to the ATR corrected spectra using ResolutionsPro (blue trace) and Omnic (black trace). Here, the FT-IR spectra have been intensity normalized to the carbonyl stretch at approximately 1730 cm–1.
For the strongly absorbing carbonyl band in PMMA, the peak shifts from 1731 cm–1 for the film transmission to 1724 cm–1 when using a diamond IRE. This 7 cm–1 shift is substantial, and unless the search results and interpretation analyses are performed in a critical manner, the sample can be misidentified. Interestingly, this peak shift is much less when using a higher refractive index germanium IRE at 1728 cm–1. Next let us examine the frequency shifts for the weaker absorbing 1149 and 752 cm–1 PMMA bands. For the 1149 cm–1 PMMA band the peak shifts 5 to 1144 cm–1 when using a diamond IRE. Finally, the weakly absorbing 752 cm–1 PMMA band exhibits only a 2 cm–1 shift to 750 cm–1 using a diamond IRE.
We noted previously that there are algorithms that can correct ATR spectra, so they appear more like transmission. In the lower panel of Figure 9, we compare two of these algorithms for the spectrum of PMMA. The blue trace is the result of an algorithm that only corrects for the depth of penetration. The 7 cm–1 shift in the carbonyl is still present although the ratio of the carbonyl (1731 cm–1) absorption to the carbon single-bonded to oxygen absorption (1149 cm–1) compares well to the transmission spectrum. A more advanced correction algorithm is available from one instrument vendor, 15 and after applying that correction to the same spectrum used above, the shift in the position of the carbonyl band is much smaller, 2 cm–1. Caution should be exercised since ATR correction only works well if the difference between the refractive index of the sample and the ATR element is ∼1 or greater. In other cases where the difference between the two refractive indices is <1, the correction does not work, and the spectrum becomes even more distorted if the correction algorithm runs at all. In two recent papers,11,16 the authors discuss the impact of polarization as well as the geometries of ATR accessories to account for the noted discrepancies.
Conclusion
Photometrically accurate FT-IR spectra are essential to optimize qualitative and quantitative analyses routinely employed by analysts. Although ATR is a simple and convenient sampling technique for FT-IR and a diamond or diamond-coated IRE provides a durable, robust interface to the sample, the analyst must understand the ATR experiment in order to obtain good quality spectral data. The critical parameters of the ATR measurement include the sample and IRE refractive indices, the corresponding critical angle and the incidence angle as defined by the ATR accessory design.
High-quality ATR FT-IR spectrum free of spectral distortions and artifacts when using a 45° single bounce ATR accessory requires a well-defined difference (Δη > 1) between the sample and IRE refractive indices. When using a diamond ATR (IRE η = 2.42) this requires a sample refractive index of 1.5 or less. Samples with refractive index >1.5 will exhibit spectral distortions of their strong absorption bands due to anomalous dispersion, changes in IR bands relative intensities and negative bands in the 2500–1800 cm–1 spectral region due to the diamond phonon bands. In these cases, substitution of a germanium IRE (η = 4.00) will eliminate many of the spectral distortions and result in a more photometrically accurate FT-IR spectrum.
A comparison of a transmission and good quality ATR spectrum highlights the unavoidable differences between the two sampling techniques on the FT-IR spectrum. Strongly absorbing IR bands can be significantly shifted to lower frequency when using ATR due to anomalous dispersion. The magnitude of this shift is again correlated with the magnitude of the difference between the sample and IRE refractive indices. Thus, a larger frequency shift is expected for a diamond versus a germanium IRE.
Finally, the strong absorbance of the diamond phonon bands in the 2500–1800 cm–1 spectral region can affect the instrument throughput and consequently the measured ATR FT-IR spectrum. Because of the high performance of modern FT-IR optical benches this is only an issue for weaker absorbers such as summation and overtone bands of organic species.
Supplemental Material
sj-docx-1-app-10.1177_27551857251336262 - Supplemental material for Fourier Transform Infrared Spectroscopy (FT-IR) Diamond Attenuated Total Reflection (ATR) Measurements: The Good, the Bad, and the (Really) Ugly
Supplemental material, sj-docx-1-app-10.1177_27551857251336262 for Fourier Transform Infrared Spectroscopy (FT-IR) Diamond Attenuated Total Reflection (ATR) Measurements: The Good, the Bad, and the (Really) Ugly by Ellen V Miseo and Peter J Larkin in Applied Spectroscopy Practica
Footnotes
Declaration of Conflicting Interests
The authors declared no potential conflicts of interest with respect to the research, authorship, and/or publication of this article.
Funding
The authors received no financial support for the research, authorship, and/or publication of this article.
Supplemental Material
All supplemental material mentioned in the text is available in the online version of the journal.
References
Supplementary Material
Please find the following supplemental material available below.
For Open Access articles published under a Creative Commons License, all supplemental material carries the same license as the article it is associated with.
For non-Open Access articles published, all supplemental material carries a non-exclusive license, and permission requests for re-use of supplemental material or any part of supplemental material shall be sent directly to the copyright owner as specified in the copyright notice associated with the article.