
Abstract
An inexpensive and simple three-dimensional (3D) printed spectrophotometer that interfaces with smartphone cameras for visualizing and measuring visible wavelength absorbance and analyte quantitation is reported. A conventional spectroscope inspired the spectrophotometer design to maximize visual engagement for educational purposes and functions as a single-beam visible spectrophotometer capable of precise calibration, standard curve generation, and quantitative analysis of real-life samples. Spectrophotometer calibration results using a four-point, red-green-blue coordinate-to-wavelength conversion demonstrate that the 3D-printed device exhibits a linear 5.0 nm/mm dispersion over the 400–700 nm range. Quantitative analysis validation using a smartphone camera and Open Source software (ImageJ) analysis for tartrazine determination demonstrate the molar absorptivity for the external standard tartrazine was significantly lower compared to the literature and commercial instrumentation (0.0062 μM–1 cm–1 versus 0.0216 μM–1 cm–1 for the commercial instrument). Still, the accuracy of the device was within the linear range is remarkable, as tartrazine determination in a real-life sample (Mello Yello soft drink) was found to be not statistically different compared to the result obtained on a commercial spectrophotometer (10.6 μM versus 10.5 μM, n = 5, p > 0.05). The device design and computer-aided drafting files are available publicly for Open Access replication and modification, with considerable promise for expanded capabilities and applications beyond visible spectroscopy and educational purposes.
This is a visual representation of the abstract.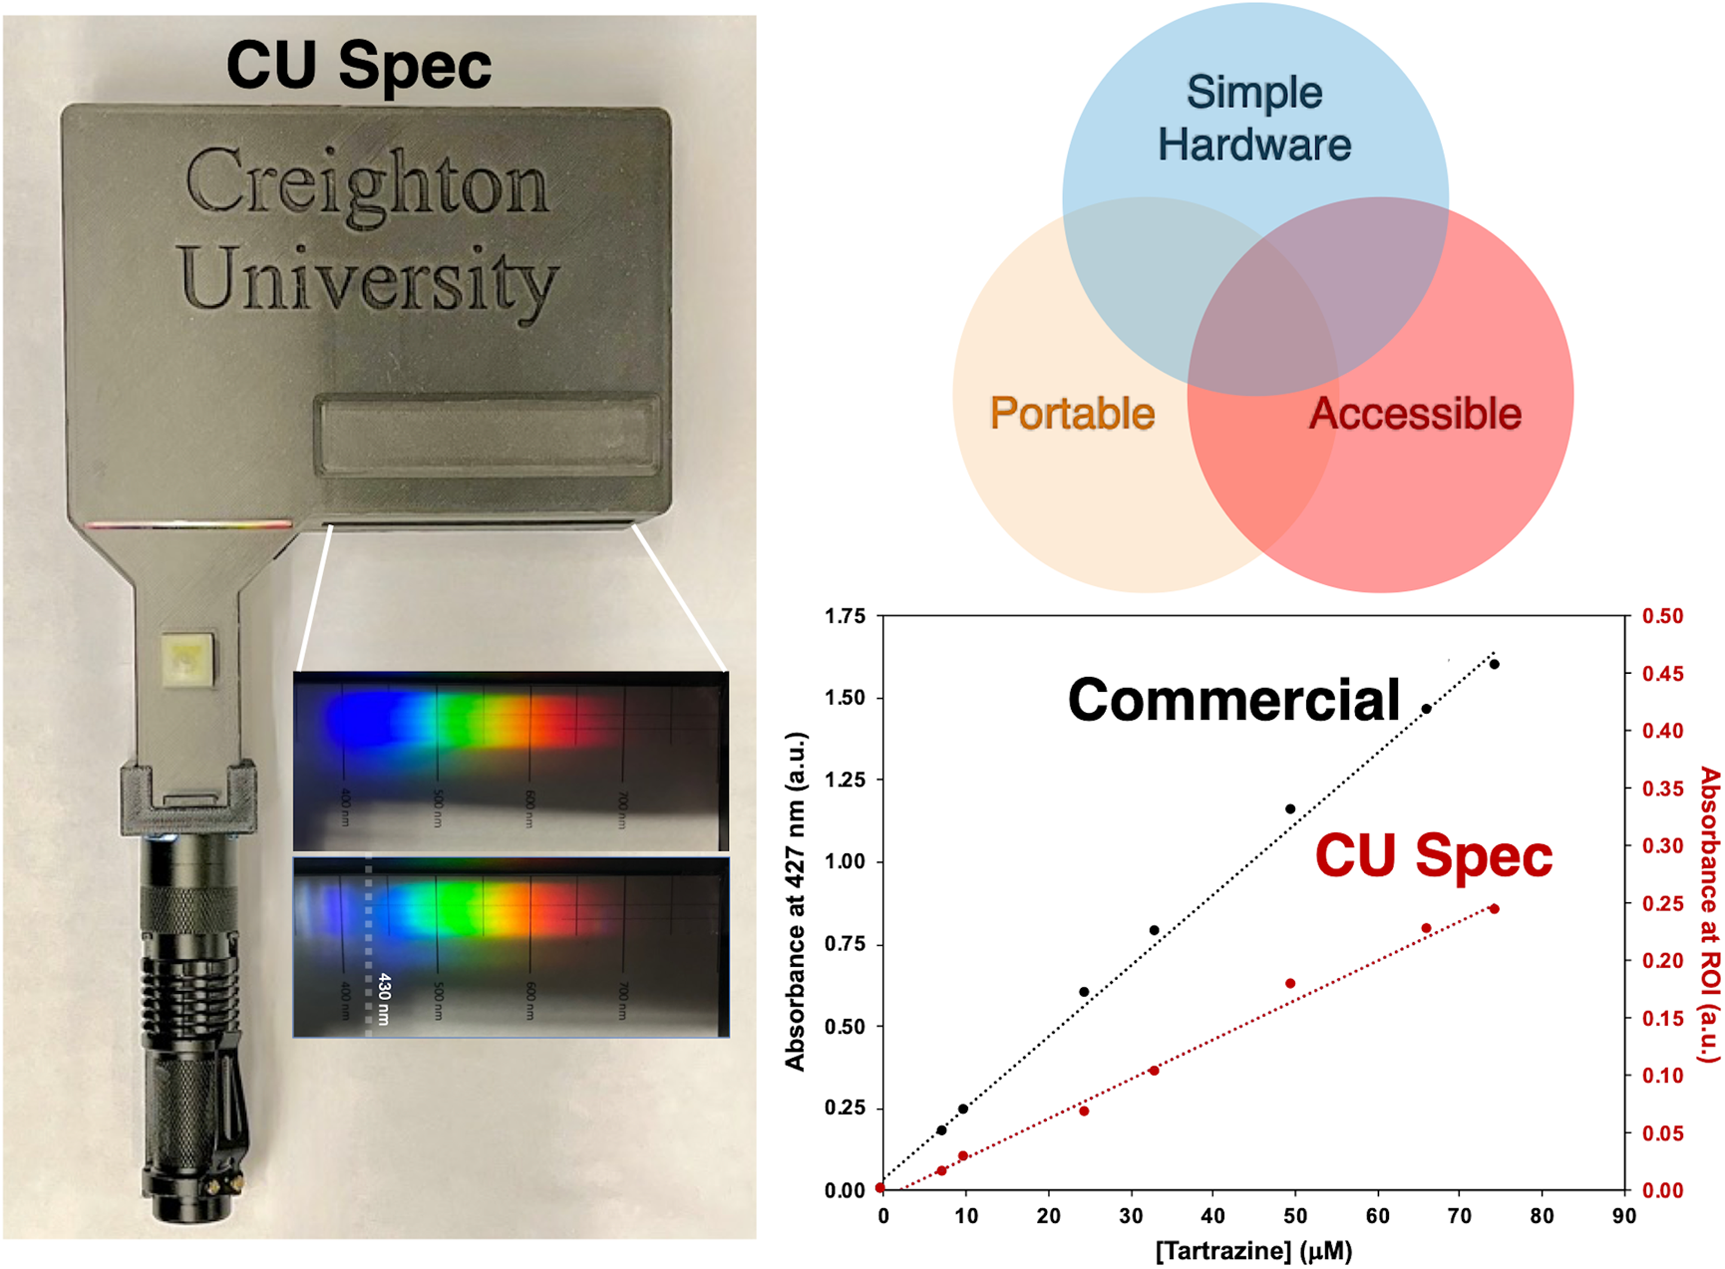
Keywords
Introduction
Spectroscopy is a common analytical chemistry technique in quality assurance and validation laboratories worldwide. Its popularity stems from its simplicity and robustness, allowing straightforward method development and convenient implementation. Because of their significance, spectroscopy, spectroscopic instrumentation, and method development are essential topics when training chemists and chemical analysts.1,2
Commercial spectroscopic equipment varies dramatically from simple visible photometric and colorimetric sensors and devices to high-accuracy precision instruments with broad spectral range, ultraviolet–visible–near-infrared (UV–Vis-NIR). 3 In recent decades, with the advancement of photodetectors, the ubiquity of cameras and sensors, and the increased software sophistication, the design of compact, portable, and inexpensive devices has been realized for routine, highly specific spectroscopic measurements; the humble pulse oximeter best exemplifies this point.4,5 Numerous approaches to fabricating low-cost, compact, and portable spectrophotometers have been reported,6–8 and the integration of additive manufacturing or three-dimensional (3D) printing for prototyping equipment on-demand and smartphone cameras as highly sensitive and capable photodetectors with rapidly expanding abilities is of particular interest.9–11 In educational literature, 3D-printed devices have been shown to yield robust, high-accuracy, and precise spectrophotometers.12–15 However, designs have recently trended toward black-box operation, including smartphone applications with spectral analysis, which is suitable for replacing more expensive commercial instrumentation but less beneficial for visual engagement and tactile learning and less open to design and component modification for the diverse needs of method development.
Here, we report a versatile 3D-printed spectrophotometer inspired by a simple spectroscope adapted to interface with a smartphone camera. The design integrates a dispersive element and enables the device to accomplish various analytical goals while encouraging an open-box view of instrumentation. This allows for a visually appealing user experience to enhance learning while maintaining the instrument's integrity, making it capable of more rigorous quantitative and qualitative analyses.
Materials and Methods
Design Motivation
The spectrophotometer, henceforth referred to as “CU Spec”, as the name was imprinted into the casing, was modeled after a simple spectroscope and designed to meet several critical criteria, as shown in Figure 1a. First, CU Specs should be affordable (<$10–20 per device) and accessible to users at various resource levels and in geographical regions where commercial instrumentation is prohibitively costly.16,17 Second, CU Specs should be simple and compact, easy to hold and manipulate, containing as few printed components as possible to reduce the need for multiple small, printed components or more challenging assembly. The device was also designed not to require an external power supply, relying on batteries to power the source and smartphone cameras. Third, CU Specs should allow direct spectral visualization through a side viewing port and be adapted to most smartphone cameras through a second top viewing port. To accommodate this desire to be both adapted to technology and directly viewed, a polychromatic spectrophotometer design was chosen, as shown in Figure 1b.

Three-dimensional (3D)-printed spectrometer design planning. (a) Governing design principles. (b) Schematic of the spectroscope-inspired, polychromatic spectrophotometer design. (c) A photograph of CU Spec used as a spectroscope with a smartphone (iPhone 13) installed for viewing.
Components and Assembly
A photograph of CU Spec assembled with a smartphone installed is shown in Figure 1c and a photograph of the device unassembled is shown in Figure 2a. The current costs of each component are listed in Table I. At the time of publication, two versions of CU Spec have been developed and are in use, one designed for standard smartphones (81 mm top-access opening) and another for wide smartphones (96 mm opening). Machine drawings, with accurate and complete dimensions for each device and peripheral components, are given in the Supplemental Material (Section 1, CU Spec Fabrication). CU Spec computer-aided drafting (CAD, stereolithography) files have also been made available publicly for reuse on GitHub and a personal website.18,19 CU Spec was designed so that the angle of incident light is 0°, showing zeroth-order diffraction on the back wall in line with the source and first-order diffraction on the back wall of the device with an angle of diffraction at 33.4° and an angular dispersion of approximately 0.069°/nm at 550 nm, the middle of the visible range. Much of the visible spectrum (400–700 nm) can be viewed over an area ∼6 cm in width along the back wall.
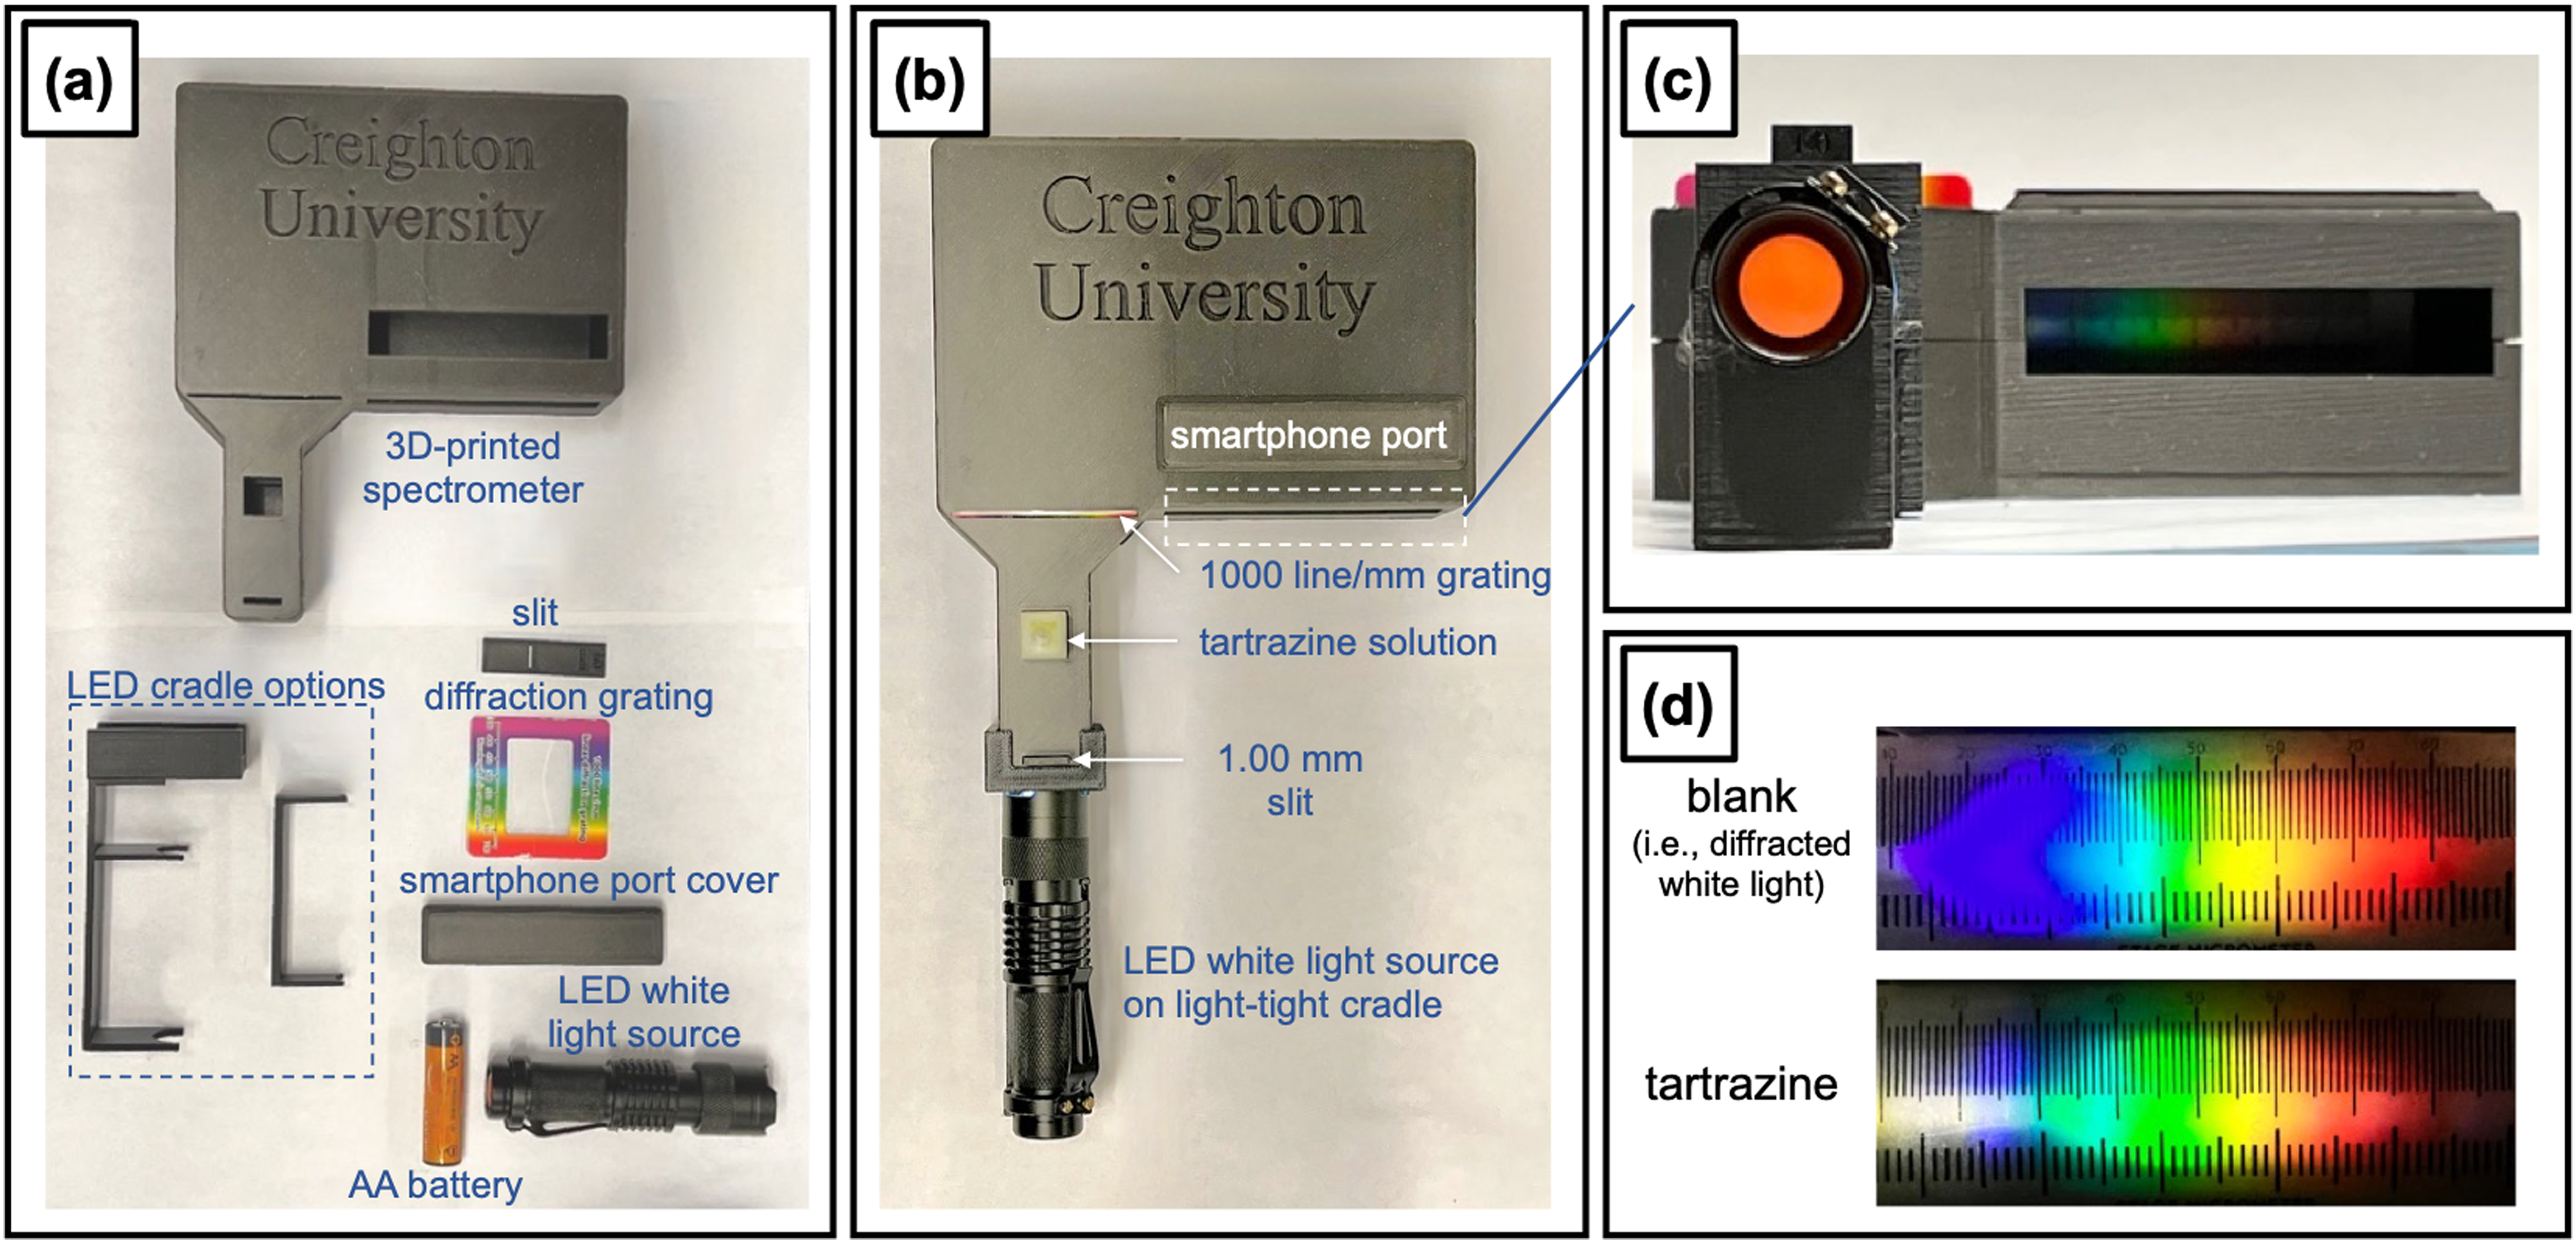
Three-dimensional (3D)-printed spectrophotometer photographs. (a) Device components unassembled and labeled. (b) Device assembled with components for analysis labeled. Simple and light-tight LED flashlight cradle options are shown. (c) A front view of the device when the LED light is on, dispersed through the diffraction grating, and projected onto the back wall of the device. (d) Spectra acquired with a smartphone of a blank (white light, water in cuvette), and a 100 μM tartrazine sample. The spectra shown were captured using the rear cameras on an iPhone 13 Pro.
CU Spec materials, external components, and current costs.

To be printed by a public library, for example, rates range from $0.05 to $0.10 per gram.
The CU Specs shown and used to collect the acquired data reported were printed using a Prusa i3 MK3S + 3D printer and polylactic acid (PLA) filament. In general, dark colors (e.g., Prusament PLA Jet Black, which has a gloss finish, and PLA Galaxy Black, which has a matte finish) have been used most to mitigate reflection of undesired stray light entering from the room. These devices do not need to be operated in a dark room setting, though further modification with black electrical tape may help reduce undesired stray lights; data for this and various other modifications are described in the Notes on CU Spec application for analytical quantitation section. CU Specs have been printed using various other filaments, i.e., co-polyesters, polyethylene terephthalate glycol, and other printers, e.g., an Ultimaker 2+; furthermore, over 50 users have demoed CU Specs with various smartphone cameras (iPhone, Android, Google, etc.), all without issue.
Materials for Validation Experiments
A standard food dye solution containing tartrazine (FD&C yellow no. 5, Fisher Scientific) was used for method validation. Solutions in the 0–100 μM range were prepared using nanopure water and volumetric glassware. A detailed preparation scheme for the tartrazine solutions is provided in the Supplemental Material (Section 2, Standard Solution Preparation).
Results and Discussion
The robust spectrophotometer design has been prototyped on various fused filament deposition-style 3D printers. Over three years, the device has been implemented in educational settings by multiple instructors in high school physical science, physics, and chemistry course activities and an upper-division undergraduate quantitative analysis course, demonstrating range and versatility. A manuscript describing those results is forthcoming; intermediate results can be found publicly on the author's website. 20 To demonstrate the spectrophotometer's capabilities, the results for the following three experiments are presented: (i) visualization directly by eye and by smartphone camera are presented, (ii) spectrophotometer calibration, and (iii) the quantitation of analyte in a real-life beverage sample.
Visualizing Absorption
The most basic function the CU Spec was designed for is as a simple spectroscope to visualize visible light absorption by chromophore-containing solutions. Standard spectroscopes, while inexpensive, typically as little as $10 currently, 21 are designed for physics or physical science courses and enable the visualization of white light diffraction onto a ruled surface. Borrowing from this design, CU Spec incorporates a 1000 line/mm grating to disperse the white light source from a light-emitting diode (LED) flashlight onto the back of the spectrometer, which can be viewed directly from the side port. A 1.00 mm slit is available to reduce stray radiation from the light source, and a sample chamber allows for the addition of chromophore-containing samples to visualize light absorption. A photograph of the system assembled is shown in Figure 1b. The device has two viewing ports and a cover to block light entering from the unused port. The top port allows smartphone camera access, while the side port allows direct visualization. A photograph capturing the view from the side port is shown in Figure 1c. with a white light source, 1.00 mm slit, and 100 μM tartrazine solution in the sample chamber. A generic stage micrometer is shown in the back for comparing spectra between a blank (water) spectrum and a tartrazine sample in Figure 1d, where blue light absorption is evident.
Since its introduction, this device has been used to visualize the absorption of a wide range of visibly colored chromophores. Concentrated samples (≥50 μM solutions, depending on molar absorptivity) provide the most compelling test solutions, and various dyed, transparent consumer samples, e.g., sports drinks and dissolved colored sweets, make excellent real-life examples.
Spectrophotometer Wavelength Calibration
CU Spec can be calibrated to provide accurate maximum absorbance wavelength determination. An example of how the spectrometer is calibrated is shown in Figure 3. A photograph of a stage micrometer was printed at 100% scale and adhered to the back of the inside of the CU Spec. Using ImageJ 22 and a publicly accessible hex decimal to wavelength conversion website 23 with a color picking application, e.g., ColorPicker, 24 Pixel Picker, 25 to identify four red-green-blue (RGB) coordinates to calibrate as a function of distance along a standard stage micrometer to determine the wavelength as a function of position. An example using four standard spectroscopic calibration wavelengths (405, 488, 589, and 633 nm) is shown in Figure 3a. From the calibration curve, the CU Spec is demonstrated to possess a 5 nm per mm calibration conversion, with the resulting graduated or ruled calibrated printout shown in Figure 3b, and is publicly available. 19 The interspectrometer stability of spectral positioning was measured across different CU Specs (n = 5) and the intraspectrometer stability was measured across runs (n = 5) and the difference was found to be not statistically different (p > 0.05), exhibiting a ±0.5 mm variation in position when using the light-tight LED holder. CU Spec 3D printing was found to be precise within tens of microns, and the largest contributors to variation are related to external components, such as the LED positioning (cradle choice and adaptation), LED focus, and type. Direct use of the calibration printout also requires careful manual cutting and installation, contributing an additional (±0.5 mm) variation. An example of maximum absorbance wavelength determination is shown with a narrow absorption band for tartrazine at ∼430 nm, which is shown, in good agreement with literature values. 26

CU Spec wavelength calibration. (a) Calibration using four hex decimal color scales related to wavelength via RGB conversion. (b) Photograph of a spectrum using calibrated paper with water (top) and 100 μM tartrazine (bottom). The spectra shown were captured using the rear cameras on an iPhone 13 Pro.
Analyte Quantitation
CU Spec can be used to obtain an external standard calibration curve and to determine the concentration of an analyte in an unknown. The step-by-step procedure is provided in the Supplemental Material (Section 3, External Calibration Curve Instructions). Here, a photo is collected for each external standard analyte solution, an example shown in Figure 4. At this stage, it is critical that the smartphone position and photograph settings remain constant. In the example shown, the calibration paper was removed to provide a dark background.

Photograph montage of spectra acquired with tartrazine external standards, 0.00 (water) through 75 μM, using CU Spec using the rear cameras on an iPhone 14 Pro Max without the calibration ruling. The selected area shown represents the region used for Beer's law analysis. Graphical results are depicted in Figure 5.
The data from the images is processed by making a stack so that the images are co-localized and select a region of interest to analyze the same wavelength of light absorbed at each concentration simultaneously. At this stage, the spatial dimensions of the region of interest are extremely important and will impact linearity across the concentration range; such experiments reinforce essential concepts about the importance of slit width and monochromaticity when applying Beer's law.
27
From this data, arithmetic is used to obtain an external calibration curve or Beer's law plot by calculating the “normalized absorbance” (described at length in the Supplemental Material, Section 3.3.5), to account for photo-to-photo variance
28
(referred to as, “normalized absorbance”) or by conventional absorbance (A) at some wavelength, calculated using Eq. 1: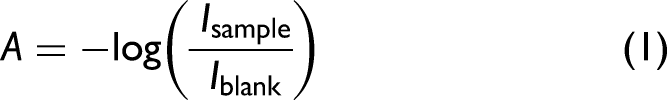

Spectroscopic and quantitative analysis of tartrazine external standard and a soft drink sample. (a) Visible spectra for an 8.9 μM tartrazine external standard solution in nanopure water and a commercial soft drink (as received). (b) External calibration curves for tartrazine using a commercial spectrophotometer (Vernier Go Direct SpectroVis Plus Spectrophotometer) and the CU Spec. (c) Normalized absorbance data with the white calibration paper background (BG), under standard conditions, and electrical tape sealed. (d) Absorbance at 430 nm for grayscale (black–white) image analysis and electrical tape sealing, with tape sealing, with a white calibration paper BG, and under standard conditions.
In comparison to the commercial spectrophotometer, the normalized absorbance CU Spec external calibration curve exhibits equally as strong linearity (R2 > 0.99) and near-0 intercepts. The linearity of CU Spec absorbance is slightly poorer (R2 = 0.98). CU Spec does exhibit a significantly reduced sensitivity (molar absorptivity being 0.0216 μM–1 cm–1 for the commercial instrument versus 0.0062 μM–1 cm–1 for CU Spec). This is partly the result of stray light, which, governed by Eq. 2, leads to negative deviations from Beer's law due to decreased absorbance at higher concentrations, limiting the linear range and reducing the device's sensitivity.
30
Further modifications can be made to CU Spec to improve quantitative application (described at length in the following section). Nevertheless, tartrazine quantitation of the soft drink was well within the range of linearity, and the CU Spec results obtained were not found to be statistically different between calibration methods, and in comparison to the commercial instrument (10.6 μM by absorbance and norm. absorbance versus 10.5 μM, p > 0.05, n = 5).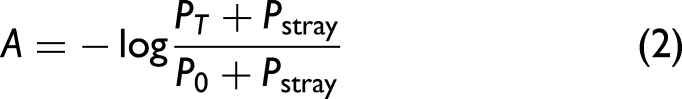
Notes on CU Spec Application for Analyte Quantitation
Being a modular device, CU Spec is capable of various modifications to alter optical and analytical capabilities. External calibration curve collection can be done under a variety of conditions, some examples include (i) using a white surface to reflect the spectrum back toward the camera, (ii) using black electrical tape to seal off openings, and (iii) using grayscale/black and white photo analysis to mitigate RGB bias in smartphone software.31,32 Examples of tartrazine external calibration curves under these three conditions are shown in Figure 5.
Results in Figure 5c show that for normalized absorbance external calibration curve generation, the white background results gave the greatest sensitivity (0.0058 μM–1 cm–1) but had the shortest linear range (0–50 μM): significant roll-off was observed at 75 μM. All three methods shown exhibited excellent linearity over the fitted ranges (R2 > 0.99). For the absorbance at 430 nm (given by Eq. 2), external calibration curve results (Figure 5d), the white background results again gave excellent linearity (R2 > 0.99) and, again, had the shortest linear range (0–50 μM). Data collected using electrical tape sealing gave the best sensitivity (0.0096 μM–1 cm–1 with a black background, and 0.0107 μM–1 cm–1 with a white paper background), but linearity was slightly poorer, suggesting increased variability (R2 = 0.96–0.97). Still, by reducing stray light from outside the spectrometer, significant gains were made.
Additional CU Spec design optimization, including implementing matte materials to reduce scattered light within the device and more secure external component adapters may further improve the analytical capabilities of the device. CU Spec's quantitative capabilities are inherently limited by relatively poor spectral resolution (∼10 nm for CU Spec versus ≤1 nm for most commercial instruments) and potentially worsened by spectral cross-contamination, which shows in the reduced sensitivities (i.e., molar absorptivities) reported. Thus, at present, CU Spec is not a suitable substitution for commercial-grade spectrophotometers; though, the analysis shown here demonstrates it is a robust and low-cost, low-resource tool for visualizing spectrophotometry concepts and conducting basic chemical analyses.
Conclusion
CU Spec is a versatile, 3D-printed polychromatic spectrophotometer designed to interface with a smartphone camera and enable direct spectral observation and recording. The device is publicly available and open access and has been implemented in educational settings. Results reported here demonstrate that CU Spec can be calibrated to improve the spectral analysis of visibly absorbing chromophores, and a calibration for the rigid-body design is also available publicly. Quantitative analysis was validated for the yellow food dye, tartrazine, and results show accurate and precise quantitation capabilities in the μM range; however, the sensitivity and linear range of CU Spec are not comparable to a commercial instrument, as expected. Given CU Spec's Open Access availability, further modifications to the design to improve technical performance for quantitation and application and expand spectroscopic analysis capabilities to other spectral regions make the device rife with opportunity.
Supplemental Material
sj-docx-1-app-10.1177_27551857251314525 - Supplemental material for A Portable, Spectroscope-Inspired Three-Dimensionally Printed Smartphone Spectrophotometer
Supplemental material, sj-docx-1-app-10.1177_27551857251314525 for A Portable, Spectroscope-Inspired Three-Dimensionally Printed Smartphone Spectrophotometer by Tim Nguyen, Nick Tobin, Henry Bournef, Erin M. Gross and Joel F. Destino in Applied Spectroscopy Practica
Footnotes
Declaration of Conflicting Interests
The authors declared no potential conflicts of interest with respect to the research, authorship, and/or publication of this article.
Funding
The authors disclosed receipt of the following financial support for the research, authorship, and/or publication of this article: CU Spec design and development for outreach purposes were supported by the National Science Foundation, National Science Foundation Award DMR-2144453, the Research Corporation for Science Advancement (RCSA) Cottrell Scholar Award, and the Creighton Chemistry Community Development Fund for covering costs associated with prototyping and distributing CU Specs.
Supplemental Material
All supplemental material mentioned in the text is available in the online version of the journal.
References
Supplementary Material
Please find the following supplemental material available below.
For Open Access articles published under a Creative Commons License, all supplemental material carries the same license as the article it is associated with.
For non-Open Access articles published, all supplemental material carries a non-exclusive license, and permission requests for re-use of supplemental material or any part of supplemental material shall be sent directly to the copyright owner as specified in the copyright notice associated with the article.