
Abstract
The cyclic siloxazane, i.e., 2,2,7,7-tetramethyl-1-oxa-3-aza-2,7-disilacycloheptane (
This is a visual representation of the abstract.
Introduction
Terminal aminosiloxanes (TAS) are useful polymers that find use in many applications including hair care,1,2 adhesives, 3 printed circuit boards, 4 and more. However, their synthesis is typically cumbersome. They are usually being produced through either an equilibration that requires a neutralization step followed by evaporation of residual octamethyltetrasiloxane (D4) and other smaller cyclic siloxanes, or a condensation process with an aminopropylsilane/siloxane that requires a catalyst. An alternative route involves the dimeric of 2,2-dimethyl-1-aza-2-silacyclopentane that will ring open to react with silanols. This route requires an ammonium chloride catalyst to effectively complete capping. Recently, it was shown that by adding a SiMe2–O– moiety within the ring structure a cyclic disiloxazane could efficiently cap silanol groups to give the desired TAS.5,6 Despite its utility, there were challenges in developing an industrially viable process due to the fact that not one, but two catalytic reactions were occurring at the platinum metal center and the triggers that accelerate or attenuate each were not clear.
Early attempts to develop 2,2,7,7-tetramethyl-1-oxa-3-aza-2,7-disilacycloheptane (

Schematic illustration of the reaction network and the two possible routes.
In situ reaction and process monitoring using optical spectroscopy techniques such as near-infrared (NIR),7–9 mid-infrared (mid-IR),10–12 and Raman spectroscopy8,10,13,14 are finding increasingly wider applications in both research and development labs, pilot plants, and full-scale manufacturing plants. In situ spectroscopy monitoring offers multiple advantages such as real-time result feedback, free of sample preparation, minimal perturbation to the process, and sensitivity to transient reaction intermediates.
There are many industrial processes whose operation involves many potential hazards. In this study, we provide an example of how in situ Raman spectroscopy is used to investigate an industrial process that uses a highly toxic reactant, AA, and its operation also involves significant reactive chemistry hazards such as the significant reaction exotherm as well as the release of hydrogen gas as shown in Figure 1.
Experimental
Materials and Methods
Results from two representative experiments EXP-1 and EXP-2, akin to what has been previously reported, 5 are presented here as examples. Both experiments were conducted in a fume hood, in a 1 L, four-neck flask with a magnetic stir bar, under an N2 blanket (Figure 2). M′M′ was fed to the flask using a Heidolph 5201 peristaltic pump to maintain a consistent feed rate when turned on. All chemicals used were of reagent-grade purity.

A picture of the reactor setup with the Raman probe inserted.
EXP-1: Using Xylenes as Solvent
The reactor was loaded with 175 g (3.07 moles) of AA, 10.1 g of a 0.25% Pt catalyst solution with (1,1-dimethyl-allyloxy)diphenylsilane M2APP hydrosilylation promoter (1 : 6 mole ratio, prepared the day prior) in xylenes, 33 g of fresh xylenes. The solution was heated to reflux (∼55 °C). Then, 331.4 g (2.47 moles) M′M′ was added over two days for ∼15 h with the temperature rising to ∼85 °C and then holding at ∼85 ± 5 °C. The solution was then heated to ∼122 °C and held over 3 h.
EXP-2: Using Toluene as Solvent
The reactor was loaded with 175 g (3.07 mole) of AA, 10.3 g of a 0.25% Pt catalyst solution with M2APP hydrosilylation promoter (1 : 6 mole ratio, prepared the day prior) in toluene, 48.6 g of fresh toluene. The solution was heated to reflux (∼57 °C). Then, 335 g (2.49 moles) M′M′ was added over 2 days for ∼15 h with the temperature rising to ∼85 °C and then holding at ∼85 ± 5 °C. The solution was then heated to ∼118 °C and held over 3 h.
Raman Spectroscopy
A B&W Tek i-Raman Prime system with 785 nm laser excitation was used. Spectra were collected in the backscattering geometry using a Marqmetrix ball probe. Full laser power which led to about 250 mW at the tip of the probe. Negligible heating is expected from such laser power because the reaction mixture was mostly colorless and therefore there was a minimal amount of laser light converted to heat. Typical spectral collection parameters were: 6 s exposure time, 10 scans averaged per spectrum, ∼6 cm–1 spectral resolution. Spectra were continuously collected at about 63 s intervals. Real-time data visualization was carried out using an in-house graphical user interface based on Matlab.
Results and Discussion
Spectral Assignments
Raman spectra from relevant reference materials are shown in Figure 3 in the fingerprint region.

Reference Raman spectra of relevant materials.
The two strongest Raman bands of AA can be found around 1290 and 1640 cm–1, and they are contributed by the CH=CH2 wagging mode and C=C stretching mode, respectively. Characteristic unsaturated CH stretching peaks can also be found around 3005 and 3080 cm–1 (not shown) but were not used due to their weaker intensity and severe interference from the aromatic solvents. A very weak shoulder peak around 1615 cm–1 can be found next to the strong C=C peak at 1640 cm–1, which is likely contributed by the NH2 group's bending mode. NH2 has a much stronger response in IR and indeed a strong and broad NH2 bending absorbance band can be found around 1600 cm–1 in its IR spectrum (not shown), its intensity comparable to the neighboring C=C stretching peak.
The M′M′ shows a strong SiH stretching peak at 2130 cm–1 free from spectral interference. For this study, it is assumed that Intermediate 1 and a 2 s Raman signal around 2130 cm–1 is half that of M′M′, as Intermediates 1 and 2 each have only one SiH group. Toluene or xylene were used as reaction solvents and could serve as effective internal standards as their amount would remain constant throughout a reaction. Note that the solvent concentration would decrease during the M′M′ feed. The normalized signal of any analyte is therefore expected to be proportional to its total amount, but not its concentration.
Reaction Spectra
Representative reaction spectra from a typical reaction (EXP-1) are shown in Figure 4. AA and xylene were first loaded into the reactor. The starting mixture spectrum is a linear combination of the two components’ spectra. All spectra in Figure 4 have been scaled so that they have roughly the same xylene 1000 cm–1 peak height. The starting mixture was heated from room temperature to its boiling point (∼52 °C). Only minimal spectral changes were observed during this period. A slight overall intensity drop was observed due to the density decrease, which could be readily accounted for by the normalization to solvent. Temperature is therefore expected to have minimal impact on the C=C quantitation.

Selected reaction spectra from EXP-1, after normalization to the xylene 1000 cm–1 peak.
The M′M′ was slowly fed into the reactor to start the reaction and the onset of SiH signal accumulation could be immediately observed. It would be ideal if we could distinguish between the SiH in M′M′ and that in Intermediate 1 or 2. This is challenging due to the spectral similarity between them. At this initial stage, little accumulation of M′M′ is expected and most of the SiH is expected to be in the form of Intermediate 1. The intensity of the SiH fluctuated throughout the experiment dependent on the net results of the addition and the consumption rate. This SiH peak holds the key to the safe operation of this reaction and excess accumulation of SiH may potentially lead to a runaway reaction.
Figure 5 shows the reaction progress of EXP-1. The top panel shows the temperature and M′M′ feed profiles. The M′M′ feed was paused and resumed multiple times to allow for the consumption of accumulating SiH groups and keep its concentration at a safe level. The vertical dashed lines denote the start and end of M′M′ feed. The break between lines k and l is due to the fact that this experiment was carried out on two consecutive days and a 1 h blank was inserted to represent this break. The middle panel shows the raw Raman peak area profiles. The siloxane peak area is not shown as it became much stronger than others toward the end of M′M′ feed and overwhelmed the signal from the other species. Raw Raman signals are of limited use for quantitative analysis but are still useful to examine. Time 0 for Figure 5 was set to the start of M′M′ feed. The xylene solvent signal underwent a rapid drop prior to time 0 during heating up due to its density drop. It then started to gradually decrease due to dilution caused by M′M′ addition. Whenever M′M′ feed was paused the xylene signal would remain mostly constant, indicating that the Raman signal was stable and well-behaved.

EXP-1 reaction profiles: top-temperature and feed profiles; middle-raw peak area profiles; bottom: peak area profiles after normalization.
Silicon hydride signal immediately started to increase when M′M′ additions started and its increase was linear relative to time. Since H2 off-gas was observed during M′M′ addition and would quickly stop upon pausing M′M′ feed, these observations indicate that the dehydrocoupling reaction to form Intermediate 1 was occurring rapidly and the newly formed Intermediate 1 was mostly accumulating instead of being converted into the cyclic siloxazane
The terminal C=C signal continues to drop throughout the entire reaction, partly due to the reaction and partly due to dilution. The dilution effect will be accounted for by solvent normalization. The internal C=C (a side-product formed by isomerization reaction 15 ) peak area also continues to grow but is hard to visualize due to its weak intensity. To help with visualization, the bottom panel of Figure 5 shows the normalized and then percent peak area profiles. Each peak area profile was normalized to that of xylene, and the resultant profile was then percentized so that its maximum and minimum spans between 100% and 0%. This allows the weak Raman features to be visualized as effectively as the stronger Raman features. Note such normalized and percentized results are still semi-quantitative and a calibration is needed to get fully quantitative results.
The bottom panel reveals further details not apparent in the raw signal profiles. For example, the SiH signal did not continue to accumulate linearly as a function of time during the M′M′ feed toward the end of the reaction (e.g., after vertical lines h and l). It is also interesting to note that the slope of SiH consumption following the pause of M′M′ appeared to become increasingly larger, indicating that the intramolecular hydrosilylation reaction to form Intermediate 1 was becoming faster as the reaction progressed, presumably because of the lower AA concentration which acted as an inhibitor for the hydrosilylation reaction; though, the rise in temperature likely contributed as well.
It is interesting to note that the internal C=C continued to grow throughout the reaction till vertical line m. Its growth rate appeared to be faster when the M′M′ feed was paused than during the M′M′ feed. This is consistent with the theory that the hydrosilylation reaction was slow while feeding M′M′ (hypothesized to be a result of H2 or M′M′ complexing the metal center of the Pt catalyst), as the isomerization should only occur during the hydrosilylation step, but not during the dehydrocoupling step. The internal C=C started to decrease after the completion of M′M′ feed.
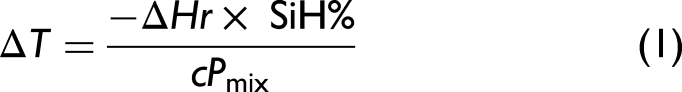
The reaction progress of EXP-2 is shown in Figure 6 in the same format as in Figure 5. Dramatically different behavior was observed, and a more detailed kinetics discussion will be captured in a subsequent paper. The comparison between Figures 5 and 6 provides an effective illustration of how in situ Raman data can provide useful reaction insights that are otherwise challenging to obtain. The SiH concentration is observed to increase in both EXP-1 and EXP-2 while feeding M′M′, and to decline only after the feed is paused. Since the dehydrogenative coupling reaction is observed to be near spontaneous, the residual SiH predominantly originates from Intermediate 1. When the feed is paused, the hydrosilylation reaction is able to accelerate and the SiH decreases in concentration. In the case of EXP-2, it is shown that with a shorter feed time, there is less build-up of SiH in the system. When normalized with the solvent, the system's total SiH concentration is possible to determine (Eq. 1), and from that, an approximate potential spontaneous exotherm can be calculated. Real-time calculation of Eq. 1, utilizing the SiH concentration measured by Raman, allows the experimenter to follow unreacted SiH immediately. The team can then stop and start the SiH feeds without the risk of an exothermic temperature rise that may result in a reactor overpressure or explosion. The team can now more rapidly optimize the process by identifying the feed amounts by which SiH can be added and times to pause between additions, so as to avoid the noted dangerous exotherm. The diabatic temperature rise from measured SiH concentration:

EXP-2 reaction profiles: top-temperature and feed profiles; middle-raw peak area profiles; bottom: peak area profiles after normalization.
The use of toluene or xylene solvent as an internal standard enables the rapid development of a semi-quantitative method. Since all of the solvent is present in the reactor initially at the start of a semi-batch reaction, its concentration would continue to decrease as more reactant is fed into the reactor, but the total amount of solvent remains constant for each experiment. The ratio of the Raman signal from a certain functional group relative to that of the solvent should therefore be linearly proportional to its amount instead of its concentration.
At the beginning of this project, we also carried out a method comparison among Raman, IR, and NIR spectroscopy, and a high-level summary of the pros and cons of these methods is summarized in Table I. They offered different sensitivity toward different functional groups. For R&D lab implementation, all three tools are expected to yield sufficient information for the reaction process optimization. For future implementation in a commercial plant, there are more factors that need to be taken into account such as hardware cost, maintenance cost, ease of operation, robustness, etc., which is outside the scope of this paper.
High-level comparison of the suitability of Raman, IR, and NIR for the monitoring of synthesis of
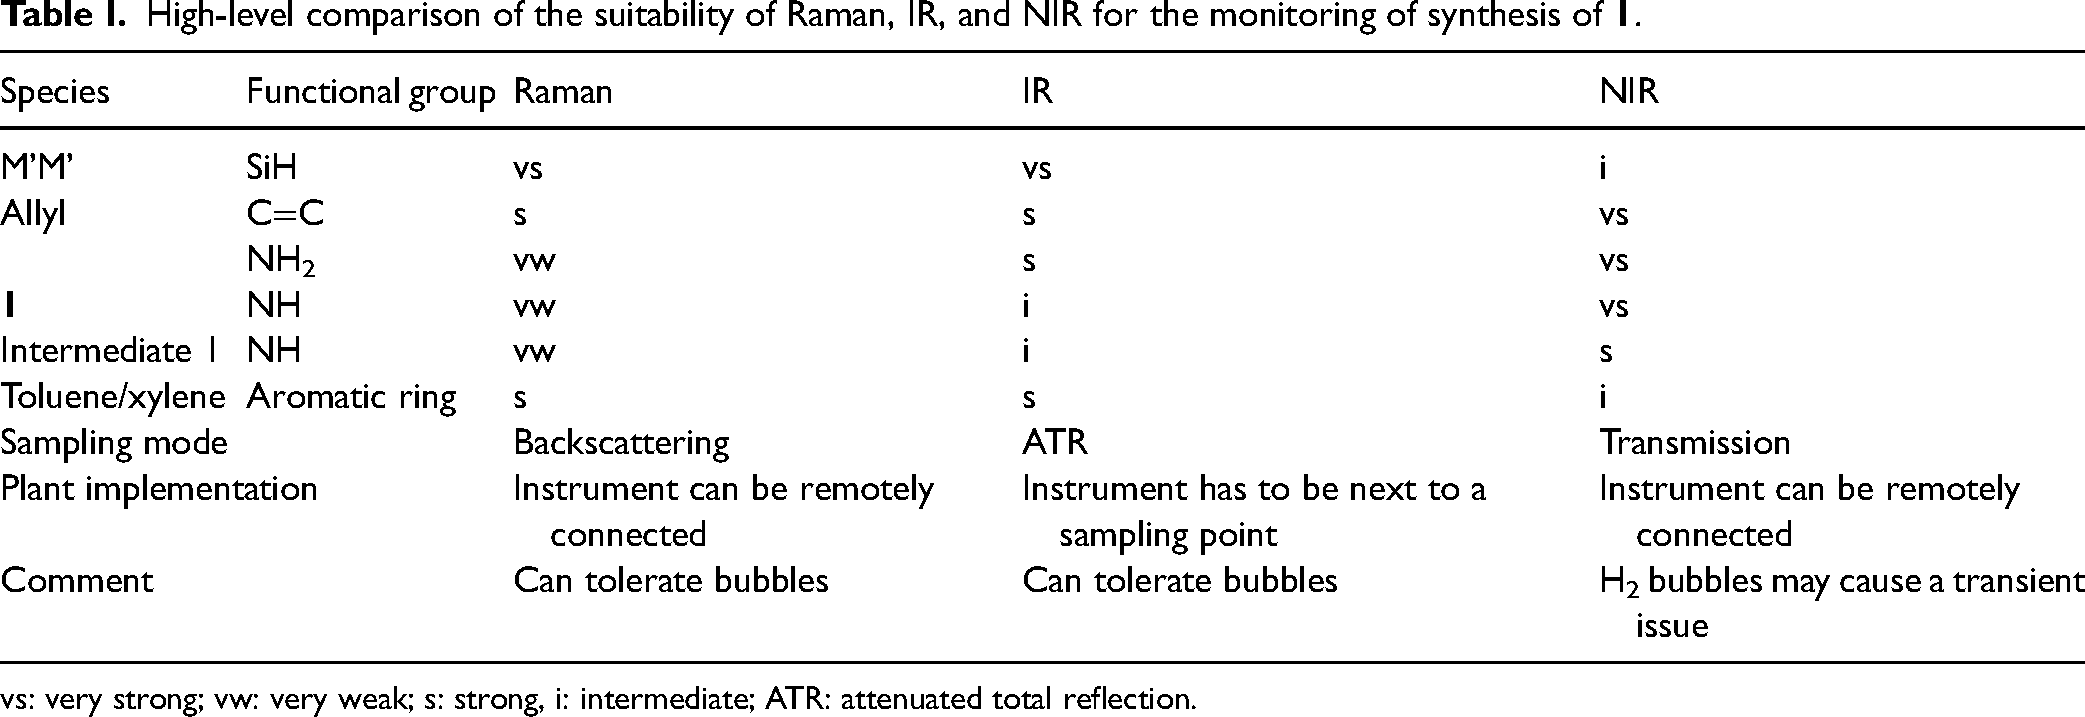
vs: very strong; vw: very weak; s: strong, i: intermediate; ATR: attenuated total reflection.
Conclusion
Real-time reaction information based on in situ spectroscopy is demonstrated to be highly useful for reaction monitoring and optimization as well as process control. A wealth of information can be extracted from Raman spectra to help the process chemist and engineer gain insights that are otherwise challenging to obtain. In this study, the accumulation of a transient intermediate species that would be challenging to quantify based on ex situ analysis can be readily monitored by in situ Raman spectroscopy. We obtained critical kinetics insights on how the two parallel reactions are catalyzed and learned that the catalyst cannot effectively catalyze the hydrosilylation reaction when it is catalyzing the dehydrocoupling reaction. Such insights are critical to the designing of a safe process and the real-time tracking of the reactive intermediate enables safe operation by ensuring the reactive intermediate concentration stays below a threshold value to avoid reaction run-away. In situ analysis also minimizes the need to sample from this hazardous reaction mixture that involves a highly toxic chemical and flammable hydrogen gas.
Footnotes
Declaration of Conflicting Interests
The authors declared no potential conflicts of interest with respect to the research, authorship, and/or publication of this article.
Funding
The authors received no financial support for the research, authorship, and/or publication of this article.