
Abstract
Depot-medroxyprogesterone acetate (DMPA) is an essential medication used as a form of family planning by millions around the world. Diffuse reflectance spectroscopy (DRS) has a long history as a quality assurance measure for raw ingredient verification in pharmaceutical manufacturing. There are a multitude of DMPA manufacturers in the global marketplace. Prudent supply chain management requires identification of potential suppliers that can be contacted if a current supplier is unavailable. Here, DRS data were collected with benchtop (350–2500 nm) and handheld (900–1700 nm) spectrometers for 16 brands of DMPA. Spectra from sample vials (N = 262) are compared through principal component analysis and Mahalanobis distances. The benchtop spectrometer proved to be an efficient gauge of the similarities and differences amongst DMPA brands, with subcontracted manufacturers resulting in very similar results to the primary manufacturers. The handheld spectrometer offers advantages in portability and cost and was shown to be an effective brand discrimination tool but was less reliable in the context of identifying potentially suitable supply chain substitution options of DMPA due to several key DMPA spectral features appearing just outside of the handheld spectrometer's range. Data collected from the benchtop spectrometer was used to identify several potential supply chain substitutions, dependent on various other subsequent due-diligence activities (i.e., product documentation reviews and manufacturing site audits). These potential substitutions can be shortlisted for further auditing review prior to being identified as a potential supply chain substitution.
This is a visual representation of the abstract.
Keywords
Introduction
Various groups provide public health assistance by supplying essential medicines to countries with limited resources, such as the United Nations Population Fund and the United States Agency for International Development.1,2 There are many potential manufacturing sources for products supplied through global initiatives. A prequalification program for potential suppliers is maintained by the World Health Organization (WHO), which can be used for sourcing potential products of reputable quality.3,4 Global supply chains often combine a complex set of variables including interactions with funding sources, manufacturing, imports, distribution, and various auxiliary services in sourcing products for a supply chain. 5
Comparing the similarities and dissimilarities in multiple brands of an essential medication can be advantageous in situations where an alternative manufacturer needs to be identified for an already established product in a global distribution chain. For example, if a product is being supplied by a single manufacturer to resource-limited areas and that product experiences manufacturing delays or ceases to be produced, then an alternative will need to be quickly identified to meet demands. Near-infrared (NIR) technologies, allowing diffuse reflectance spectroscopy (DRS) evaluations, have a well-established history of quality compliance screening in process analytical technologies applied to the pharmaceutical industry.6–8 This offers rapid and real-time analysis of various steps in the product manufacturing processes for verifying consistency through the establishment and validation of calibration models.
Reproductive health medications such as depot-medroxyprogesterone acetate (DMPA) are listed as an essential medication by the WHO. DMPA is a contraceptive with approximately three months of protection. 9 In 2020, the U.S. Agency for International Development delivered injectable contraceptives to 17 countries with a value of US$20 million, with 76% of those delivered to Africa, 17% to Asia, and 7% to Latin America and the Caribbean. 10 It is in the best interest of a public health supply chain to monitor the consistency of manufacturing and to have multiple supplier options available for a distributed product, however, the vetting process can be complicated. Most DRS applications in the pharmaceutical field have been focused on process and ingredient monitoring. 8 DRS can be used as a screening tool to monitor finished pharmaceuticals as a means of complementing existing chemical testing methods to ensure a safe and efficacious supply of medications to resource-limited areas. Previous work has explored the use of DRS (benchtop and handheld/portable) as a means of screening finished pharmaceutical products for counterfeit or falsified products), as well as showing that potential for qualitative and quantitative purposes.11–16 Our previous work showed that brands of DMPA can be differentiated by collecting scans of intact vials with diffuse reflectance technology. 17
Managing the availability of essential medicines such as DMPA from qualified suppliers in a global health supply chain can be difficult due to balancing a variety of issues such as availability, quality, regulatory, or production volume. Supply chain challenges can occur within a program if a supplier is suddenly unavailable (due to a variety of reasons). Replacing a supplier can be time-consuming and may involve issuing a new request for proposals, reviewing submissions, conducting product dossier reviews, and reviewing the regulatory status of the product, as well as potential audits of the facility. Quickly screening products would be advantageous in comparing similar products already in the program, in terms of both assessment of the application and a marketplace comparison that may include lesser-known products.
Here, the objective is to collect DRS data with benchtop and handheld spectrometers from 16 DMPA brands sourced from five countries to compare the visualization tools generated through principal component analysis (PCA) and combine with a multivariate distance metric to screen DMPA brands for similarities and differences, peer-ranking groups if similar products for potential future supply chain use. Applications of this analysis approach are discussed which may be helpful if utilized within public health programs, namely for monitoring of consistent use of approved manufacturing lines/subcontractors and screening for potential alternate manufacturing sources for various DMPA supply chains (that would require further review and auditing to confirm the source is appropriate for use in the program).
Materials and Methods
Samples
The medroxyprogesterone acetate (MPA) powdered reference standard (99.4% purity) was obtained (Sigma-Aldrich). DMPA samples from 16 brands and manufactured in five countries were obtained from a combined total of 41 lots across 262 vials (Table I). Although manufacturing sources and brand names are listed in Table I, all results will be blinded to product brand names and provided with product codes in order to protect manufacturer confidentiality. Supplemental information is provided in Table S1 (Supplemental Material) for the analysis conducted to verify MPA content. The exact excipients used by each manufacturer are considered proprietary. Commonly used excipients for DMPA may include parabens, polyethylene glycol 3350, polysorbate 80, sodium chloride, and sodium hydroxide. 18 For spectral analysis, vials were numbered during the scanning process so that vial traceability was possible for each brand. Numbers were marked on the top of each vial cap so as to not interfere with the optical signal from the spectrometers, which irradiates the sample from the bottom of the vials.
Sixteen injectable DMPA, with brand names blinded, for a total of 262 samples from 41 production lots.

Contains MPA + estradiol cypionate.
For each brand, a product-specific reference vial was created. This was done by taking a single vial, removing the cap, emptying, and rinsing the contents, cutting the top half of the vial off with a small rotary saw (Dremel 4000) right below the glass bevel, rinsing again with deionized water and allowing them to dry. After the reference vial was dry, a small piece of Teflon sheeting (1.6 mm thickness, McMaster-Carr) was cut to the inside diameter of the vial and carefully inserted into the bottom of the vial, taking care to remove any air bubbles that may be present and not score the material in any way. Next, Kimwipes were packed into the vial, and the top was wrapped in parafilm. Reference vials are shown in Figure 1 (left), along with an example sample vial shown in Figure 1 (center), and the sample vials containing the one subcutaneous (SC) solution in Figure 1 (right). Sample vials were left intact for scanning, with the exception being the one SC brand, which comes pre-packaged. For the SC sample, reconstituted contents were removed from the plastic dispenser and placed in 12 mm in diameter × 35 mm in height borosilicate glass vials (Fisher Scientific). A reference vial was made in the same fashion as above using the same 12 × 35 mm glass vials. MPA reference standard was also scanned in the 12 mm × 35 mm vials.

Example of one of the 16 brand-specific reference vials (left), an example of a corresponding DMPA sample vial (center), and an SC brand placed in sample vials (right).
Spectrometers and Data Collection
All DMPA samples were scanned using a benchtop DRS (Labspec 5000, MalvernPanalytical). Samples were vortexed for 5 s on the bottom and rotated and vortexed another 5 s on the top side. Samples were then placed on a Muglight sampling attachment with a sample tray adapter (Labspec 5000, Malvern Panalytical) fitted with a circular piece of Teflon sheeting where a center hole was cut off matching the vial diameter. After samples were positioned on the sample holder attachment, they were covered with a Delrin cap for data collection, as shown in Figures 2a and 2b. Samples were scanned three times, rotating ∼45° between scans. Each scan generated an average spectrum from 50 scans, therefore the final spectrum for a sample was an average of 150 scans. The individual product reference vials were used for collecting the background scan before each brand of product was scanned. The benchtop spectrometer collected data between 350 and 2500 nm with a 1 nm data point resolution, resulting in 2150 collected points per scan. Spectra were transformed to absorbance log (1/R) using the brand-specific background vial as a baseline. The absorbance spectra were exported as an ASCII file. The same vials were also scanned using a handheld spectrometer (900–1700 nm) (NIR-S-G1, Innospectra Corp., purchased through Tellspec, Inc.) with a variable 2–4 nm data point resolution resulting in 256 data points per scan. The handheld spectrometer connects with a mobile device paired through Bluetooth. The DC and M 2.0 software (Tellspec Inc.) was freely available at the time of download for the project to a mobile phone and used to operate the handheld spectrometer and manage data collection. The app has since been replaced by the manufacturer and is now called SpecData (Tellspec Inc.) and was downloaded from the Apple store. DMPA vials were vortexed in the same manner as mentioned for the benchtop spectrometer and placed directly on the scanning window for data collection as shown in Figure 2c, ensuring that the vial completely covers the scanning window slit. Triplicate scans of each vial were obtained, rotating vials ∼45° between scans. Triplicate scans of the reference vials were also collected as separate files. The scans were collected as soon as possible after vortexing to minimize the influence of opaque particulates settling on the bottom of the glass vials. The raw reflectance was exported to a user account associated email address as CSV files. Using the raw reflectance values obtained for both samples (I) and reference vials (Io), the absorbance log(1/R) spectrum was calculated as log(Io/I) for each vial's triplicate scan average spectrum.

Sample collection setup for benchtop spectrometer (a and b) using the Muglight attachment; along with sample collection using the handheld spectrometer (c).
Data Analysis
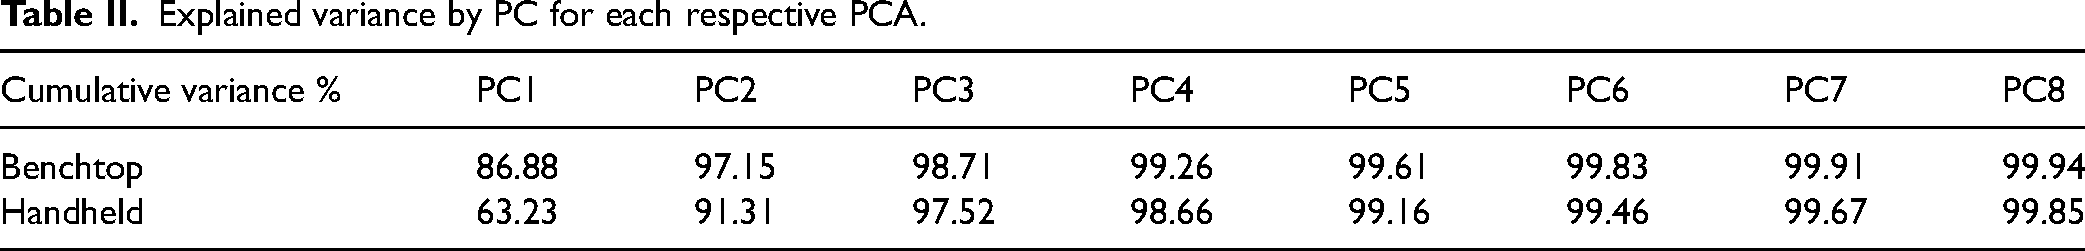
Absorbance log (1/R) spectra were combined into an MS Excel file and imported into the R-studio IDE for multivariate analysis. To adjust for baseline differences, the iterative restricted least squares (IRLS) baseline adjustment was applied in R-Studio's “baseline” package, where IRLS is the default baseline correction approach applying primary smoothing and repeated baseline suppressions and regressions with a second derivative constraint equaling three-points for the handheld and nine-points for the benchtop. A PCA was then applied to the data for each spectrometer's data set. The PCA was standard value decomposition-based scaled and mean-centered and included all the samples in the datasets with a leave-one-out cross-validation. 19 For each spectrometer, the optimal number of principal components (PCs) was determined by evaluating the model's cumulative and proportional explained variance. Both spectrometer's model variances for PC1–PC8 are shown in Table II. The optimal number of PCs selected for each M-distance model was determined to be the point where >99% of the cumulative variance was explained, four PCs for the benchtop and five PCs for the handheld spectrometer. The PCA scores were extracted for the optimal number of PCs. The Mahalanobis distance (M-dist) was used as a univariate measure of distance for comparing the 16 brands of DMPA. M-dist values were calculated from the PCA score values of the selected PCs (and the respective residual values) in an effort to alleviate the influence of collinearity on the data sets that can be present with spectral data. 20 M-dist values were calculated for each sample to the centroid of the entire PC space including samples from all 16 brands. After calculating the M-dist values, a one-way analysis of variance (ANOVA) was conducted with an α = 0.05. Following the ANOVA, a comparison of means was conducted using Tukey's student t-test, where the alpha was also set to 0.05, and the 16 manufacturer identifiers were used to sort the samples. The ANOVA and mean-comparison tests were performed for each instrument with the respective M-dist, PC1, and PC2 values.
Explained variance by PC for each respective PCA.
Results and Discussion
Principal Component Analysis (PCA)
Benchtop and handheld spectra of the MPA reference standard were collected and are shown in Figure 3. There were noticeable spectral peaks at 1195, 1394, 1720, 2154, and 2288 nm. Only the first two peaks were observed in the spectral range of the handheld spectrometer. The absorbance spectra with the benchtop spectrometer for the DMPA samples were used for further analysis (Figure 4). Vials of DMPA contain the active ingredients and excipients in a water-based suspension. The expected absorbance peaks found in water are noticed in the mean spectra at ∼960, 1200, 1450, and 1940 nm. 21 Mean absorbance spectra collected from the handheld spectrometer for the DMPA samples can be seen in Figure 5. There are fewer data points in the handheld spectra than in the benchtop, but spectral features can be seen, and the 1450 nm spectral peak is prominent in the figure.

Mean spectrum of an MPA reference standard collected from benchtop (handheld spectrum in insert figure).

Mean absorbance log (1/R) spectra of DMPA brands collected by the benchtop spectrometer (350–2500 nm).

Mean absorbance log (1/R) spectra of DMPA brands collected by the handheld spectrometer (900–1700 nm).
A PCA was conducted on each of the spectrometer's data sets. The resulting intra-cluster spread of samples appeared normally distributed for the benchtop spectrometer, however, the handheld spectrometer showed a scaler issue with the data, signified by uneven and elongated cluster spreads of the PCA score values. 20 Non-normally distributed data can be erroneously evaluated when it comes to M-dist values. 23 Thus, an IRLS baseline adjustment was applied to the handheld spectrometer's data set, correcting for the scaler issue, prior to conducting a PCA, along with selecting a scaler option in the PCA function in R-Studio during the PCA. The preprocessed handheld spectrometer's mean spectra by brand are shown in Figure 6. The peak positions do not differ, but the baseline has been adjusted. The mean spectra obtained from the 16 brands of DMPA appear fairly consistent across brands for both spectrometers, with water playing a primary factor in the analysis. Because the PCA loading vectors allow us to determine where certain spectral components are influencing which PC scores, we can see that water is primarily represented on PC1 with MPA and excipients on PC2–PC4. The observed benchtop spectrum of the MPA reference shows that there are key spectral features appearing between 1700 and 2500 nm, which correlates to prominent peaks in the loading vectors of the benchtop PCA. A scaler influence was noticed in the mean spectra of the handheld device that needed to be accounted for through a baseline correction.

Handheld spectrometer mean spectra after preprocessing with an IRLS baseline correction applied.
With the PCA outputs providing scores, loadings, and residuals, the scores matrix shows the relationship between samples, while the loadings describe the variable-to-variable relationships. A PCA scores plot is shown for the benchtop spectrometer in Figure 7. Here, the intra-class or brand mean PC1 and PC2 values are plotted at the center point of each cluster. The size of the cluster is related to the M-dist standard deviation to give a visual representation of the intra-class variance for each brand. The value represented in the text labels for each cluster is the mean M-dist value of that cluster to the global multivariate centroid of the data set. The figure shows that most of the 150 mg/mL products are clustered around the center of the plot, with the 3 mL vials and vial brands containing a second active ingredient (EC) are on the outer edges of the plot. The text label superscript refers to Tukey's mean-comparison test that was conducted, with superscripts of the same letter representing samples that are statistically similar at an α = 0.05. Superscripts of different letters are considered not to be statistically similar. Regarding the M-dist values, the mean comparisons give us a quantitative measure of the distance to the center point of the data set for each brand, while visually comparing the scores plot with the M-dist values further enhances the ability to compare similarities and dissimilarities across different brands because it combines distance and positioning. While the plot only shows us PC1 in relation to PC2, these are the most significant of the PCs, as they explain a combined 97% of the PCA model variance. Figure 8 plots PC1 versus PC2 score values for the handheld spectrometer. Here, the text labels are aligned in the same format as the previously shown benchtop spectrometer's score plot. There are a few small differences in how the samples are clustered together, but the same general trend is still present with most of the 150 mg/1 ml samples being clustered toward the center of the plot, and the 3 mL vials along with the two brands containing the extra EC active ingredient are on the outer edges, for the most part. The amount of cumulative explained variance from the first and second PCs is less than that of the benchtop with that total coming to ∼91% of the variance of the PCA model. The loading vectors explain the relationship between variables in the PCA model. 22 Here, Figures S1 (benchtop) and Figure S2 (handheld) in the Supplemental Material give us insight into which variables are influencing the model. Additionally, because these PCA models are derived from 16 brands of the same product type, the influential wavelengths from the loading vectors can be relatively correlated to components and approximate molecular vibrations that give us insight into which components are influencing the similarities and differences between brands the most.

Benchtop spectrometer score values plotted from the PCA with PC1 versus PC2.

Handheld spectrometer's score values plotted from the PCA with PC1 versus PC2.
The first four loading vectors of the benchtop PCA in Figure S1 (Supplemental Material) range from 350 to 2500 nm. Three prominent peaks are noticed at the absorbance bands for water at ∼960, 1200, 1450, and 1940 nm. These are all clearly visible on PC1, suggesting that water is primarily impacting the PC1 results. This is not surprising considering water is the primary ingredient in these vials. Peaks associated with the reference MPA are noticed in the loading vectors for PC2–PC4, with PC4 strongly resembling the spectral pattern between 2100 and 2500 nm of the MPA reference spectra (Figure 3). There is a peak at ∼1684 nm with PC2 and PC4 that is not found in the MPA reference spectra potentially representing aromatic rings.24–26 There is another loading peak present at 1170 nm on PC1, PC2, and PC4, which may be associated with second OT C–H asymmetrical stretching vibrations. 25 An MPA reference peak is found in loading vectors for PC2 and PC3 at ∼2272 nm, which may be associated with CH3 groups. 27 There does not appear to be much useful information in the loadings of the visible light range, prior to 900 nm. The linkages of the PCs to mainly water and MPA are further substantiated because samples with 50 mg/mL (150 mg/3 mL) and those with EC also in the formulation provided the largest differences out of all of the samples.
With the handheld covering only part of the range of the benchtop, the loading vectors of the PCA model look different, showing the varying influence of vectors between the two spectrometers relative to the group of 16 MPA brands. The water absorbance bands at ∼1200 nm are present in the loading vectors of Figure S2 (Supplemental Material), but the expected water absorbance bands around 1450 nm are missing in the loading vector, suggesting that the first region correlated to water in the samples is the heavier influence in the PC1, minimizing other spectral information found on PC1. Just prior to the water bands at 1200 nm, there are sharp loading vector peaks at all four PCs at 1143 nm, potentially representing CH3 groups and aromatic moieties, but are not found in the reference MPA spectrum.27–29 This could be related to possible excipients that are unknown to the authors, or a potential artifact of the spectrometers. There are two prominent spectral peaks in the MPA reference that exist within the handheld spectral range. The first peak at 1187 nm is likely being overshadowed by the broad water absorption bands at 1200 nm, but the second spectral peak appears in the loading vectors for PC2 at 1390 nm, representing isolated OH groups and C–H combinations.30,31 The handheld collection range stops just prior to the MPA peak that we would expect to see at 1712 nm, however, the increase at 1665 nm (PC2 and PC3) is likely the beginning of this peak.
There are several noticeable differences between the loading vectors of the two spectrometers, which is likely to explain slight variations in the associated PCA score plots and M-dist values. The second water absorption peak at 1450 nm is not present with the handheld, whereas it is one of the more prominent loading vector peaks for the benchtop. The handheld displays very sharp loading vector peaks across all four PCs at 1143 nm, whereas the benchtop does not. Also, the handheld collection range stops just short of several strong MPA peaks present in the reference spectra between 2100 and 2500 nm, which may be contributing to the tighter clustering of the handheld scores plot.
The ANOVA and mean rankings of the M-dist PC1, and PC2 from the benchtop and handheld data suggest several things. First, for both models, the ANOVA showed that the M-dist results for the 16 brands were both significantly different (p < 0.001) at an alpha = 0.05. The M-dist values in both Tables III (benchtop) and IV (handheld) relate the brand clustering for the data over several PCs, and not just PC1 and PC2 shown in the two-dimensional score plots. Typically, the 150 mg/1 mL samples are grouped with the smallest values, as they are closer to the center, while the 3 mL and extra EC active samples are further from the center. PC1 for both spectrometers shows a similar class grouping to the M-dist while water is most likely influencing these results and cluster patterns are possibly more in-line with 3 mL samples showing the greater difference. PC2 results are somewhat different from M-dist and PC1, which may be tied to the actual MPA active ingredient, as indicated by the loading vectors of PC2–PC4 aligning more with spectral peaks noted in the mean spectra of the secondary standard. The mean rankings of PC1 and PC2 can help to understand what we are visualizing in the respective score plots, the mean rankings of the M-dist values incorporate the optimal number of scores (based on explained variance) as well as residuals, therefore, are of primary consideration in grouping brands as potential supply chain substitutions.
Mean comparison results from 16 injectable contraceptives collected on the benchtop spectrometer for M-dist as well as PCA results for PC2 and PC2 using Tukey's honestly significant difference (HSD).
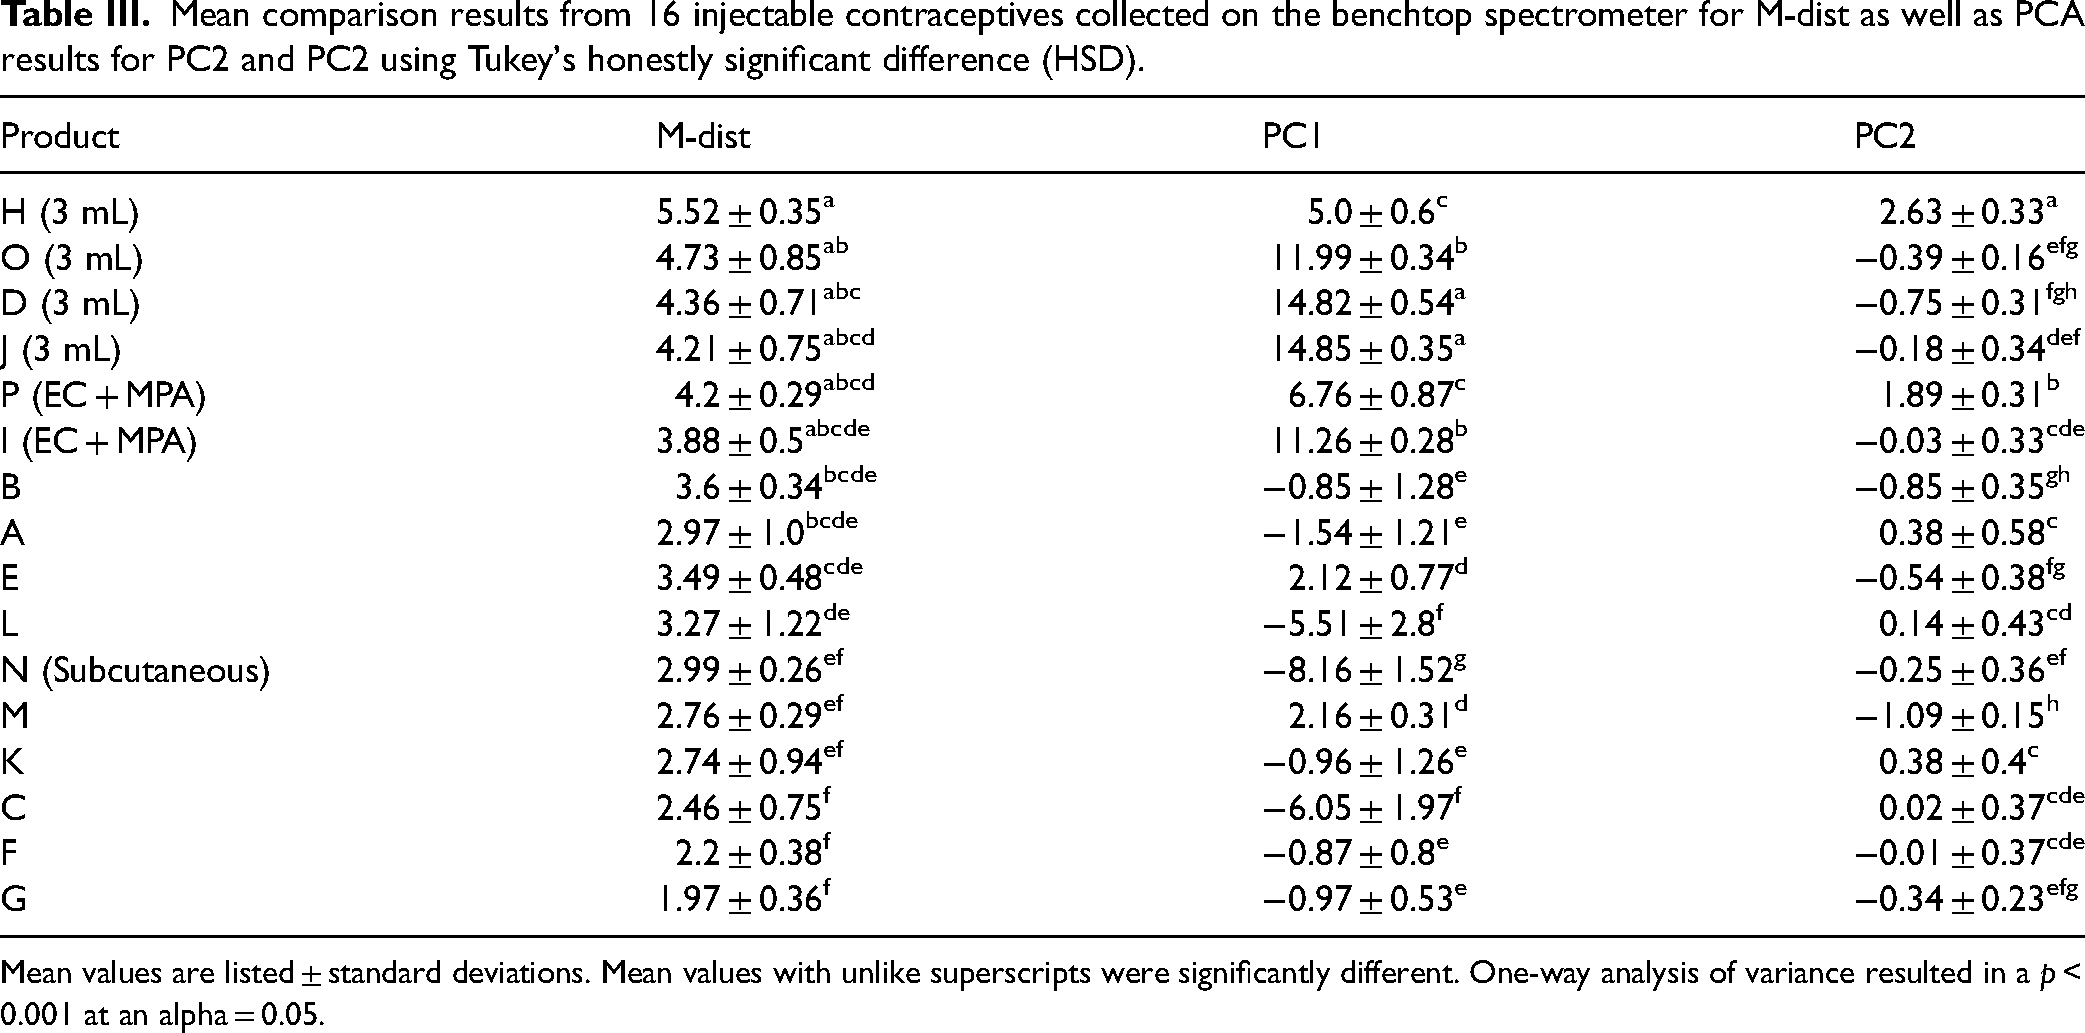
Mean values are listed ± standard deviations. Mean values with unlike superscripts were significantly different. One-way analysis of variance resulted in a p < 0.001 at an alpha = 0.05.
Mean comparison results from 16 injectable contraceptives collected with the handheld spectrometer for M-dist as well as PCA results for PC1 and PC2 using Tukey's HSD.

Mean values listed ± standard deviations. Mean values with unlike superscripts were significantly different. One-way analysis of variance resulted in a p < 0.001 at an alpha = 0.05.
Although the handheld is showing some ability to distinguish brands (having advantages with instrument cost and portability), the benchtop may be the more preferred option for final comparisons because of the wider spectral range, and 97+% of the spectral variance is captured in the first two PCs (vs. 91+% with the handheld). Previously, both instruments have shown viability for product discrimination; the benchtop is the more sensitive spectrometer, but the handheld is much more cost-effective and portable. 17 In situations where product monitoring is required, it is possible that as brand-specific classification models are developed, there is potential for false positives, which should be monitored during supervised calibration methods.
Here, the potential application of this approach is to screen for alternate candidate suppliers of a particular product. With focus on results summarized for the benchtop (with superscripts for Tukey's test with the M-dist results in Table III and the score plot in Figure 7), products A, E, F, K, and/or M could be potential candidates for consideration to include as alternate sources (with additional investigations to confirm appropriate manufacturing and regulatory standards) if a program currently provided products B, C, G, and/or L (for example). Furthermore, the PCA score plots offer a tool for comparing in a representative visual, especially when coupled with determining the M-dist. 32 For example, it is known to the authors that the manufacturer of product C has been a subcontracted manufacturer of product L. We can see that the PCA score plot in Figure 7 shows those two products nearly overlapping, which is a strong indicator that the PCA scores are representative of similar products. If only M-dist values and group clustering are observed, the relative positions of cluster groupings may be misinterpreted. Brands represented in differing quadrants of a PCA scores plot may appear similar if only observing the M-dist values. Likewise, it is challenging to evaluate the visual representations on a PCA scores plot with a quantitative measure such as M-dist values. This represents a need to pair these results with the visual representations of the score plots. Additionally, there is potential for quantification of the active ingredient, DMPA in injectable contraceptives through the application of benchtop or handheld spectroscopy, and future work is underway to assess the potential. Other aspects of future work could involve other preprocessing approaches such as differences in baseline adjustment algorithms, possible spectral derivatizations, various optimal component selection methods, categorization of excipient libraries, and potential wavelength reduction approaches (such as strategically removing certain regions of the spectra).
As additional manufacturers of DMPA are signified as potential suppliers of a product such as DMPA in global donation supply chains, the analysis could be re-run with the additional brands to see how they compare/contrast to existing supply chain options. As PCA rotations can change with additional samples, this would need to be done prior to identifying potential supply chain substitutions. For situations where public health programs need to search for alternate candidates for potential suppliers, a possible application with these instruments is that multiple handheld units could be deployed to the field in various locations simultaneously for screening samples of products of potential interest, where the most likely candidates of interest are sent to a central location for final spectral analysis with the benchtop spectrometer.
Conclusion
Sixteen brands of DMPA were obtained from five countries for diffuse reflectance spectral analysis with utilization of PCA and the M-dist metric to explore potential applications with supply chain substitutions. DMPA is an off-patent product with many international manufacturing sources. Comparing the PCA score plots and M-dist results of the two instruments results in the handheld data finding some similarities and differences between the brands, though they are not as sensitive as the benchtop due to some important wavelengths of the active ingredient (MPA) appearing just outside the data collection range of the handheld. For evaluating multiple brands of a product, the benchtop showed that it could statistically group similar brands with samples differing in the amount of water in the vial or addition of an extra active ingredient resulting in more pronounced differences. The handheld had similar results and for the cost (∼3% of benchtop), offering a possible field test to compare or contrast brands at a lower cost, while both methods could be considered rapid and non-destructive. As a proof-of-concept, DMPA samples from 16 brands were obtained from different sources throughout the international market and scanned with the DRS spectrometers. By using DRS to identify similar products, a short list of potential supply chain substitutions could be identified for further investigation through auditing activities to confirm the appropriateness of the program. Although this approach was conducted on DMPA, the same concept of using spectroscopy to develop a short list of manufacturing sources for further investigation can be applied to a number of medications and pharmaceutical devices within a global health supply chain.
Supplemental Material
sj-docx-1-app-10.1177_27551857241246753 - Supplemental material for Spectral Analysis of Injectable Depot Medroxyprogesterone Acetate From the International Market With Diffuse Reflectance Spectrometers: Potential Public Health Implications With Benchtop and Handheld Spectrometers
Supplemental material, sj-docx-1-app-10.1177_27551857241246753 for Spectral Analysis of Injectable Depot Medroxyprogesterone Acetate From the International Market With Diffuse Reflectance Spectrometers: Potential Public Health Implications With Benchtop and Handheld Spectrometers by Matthew Eady, Jeffery Tremelling, Steven Hamel and David Jenkins in Applied Spectroscopy Practica
Footnotes
Declaration of Conflicting Interests
The authors declared no potential conflicts of interest with respect to the research, authorship, and/or publication of this article.
Funding
The authors disclosed receipt of the following financial support for the research, authorship, and/or publication of this article. This work was supported through Contract No. AID-OAA-C-15-00001, USAID, Global Health Supply Chain Quality Assurance (implemented by FHI 360).
Supplemental Materials
All supplemental material mentioned in the text is available in the online version of this journal.
References
Supplementary Material
Please find the following supplemental material available below.
For Open Access articles published under a Creative Commons License, all supplemental material carries the same license as the article it is associated with.
For non-Open Access articles published, all supplemental material carries a non-exclusive license, and permission requests for re-use of supplemental material or any part of supplemental material shall be sent directly to the copyright owner as specified in the copyright notice associated with the article.