
Abstract
A new solution procedure for the one-dimensional radiation transfer equation, which describes the radiation propagation in semi-transparent media, is proposed. The resolution proposed, in this work for the first time, is based on spatial discretization and an iterative method. The emitter medium is subdivided into several layers and each layer is considered homogeneous and at the local thermodynamic equilibrium. The emission intensity of each layer is deduced from that of the previous layer. Comparisons are made between our method and other methods described in the literature. This solution is then used to model the line profiles of the Balmer Hα line emitted by a plasma created by the breakdown of a pulsed laser in water.
This is a visual representation of the abstract.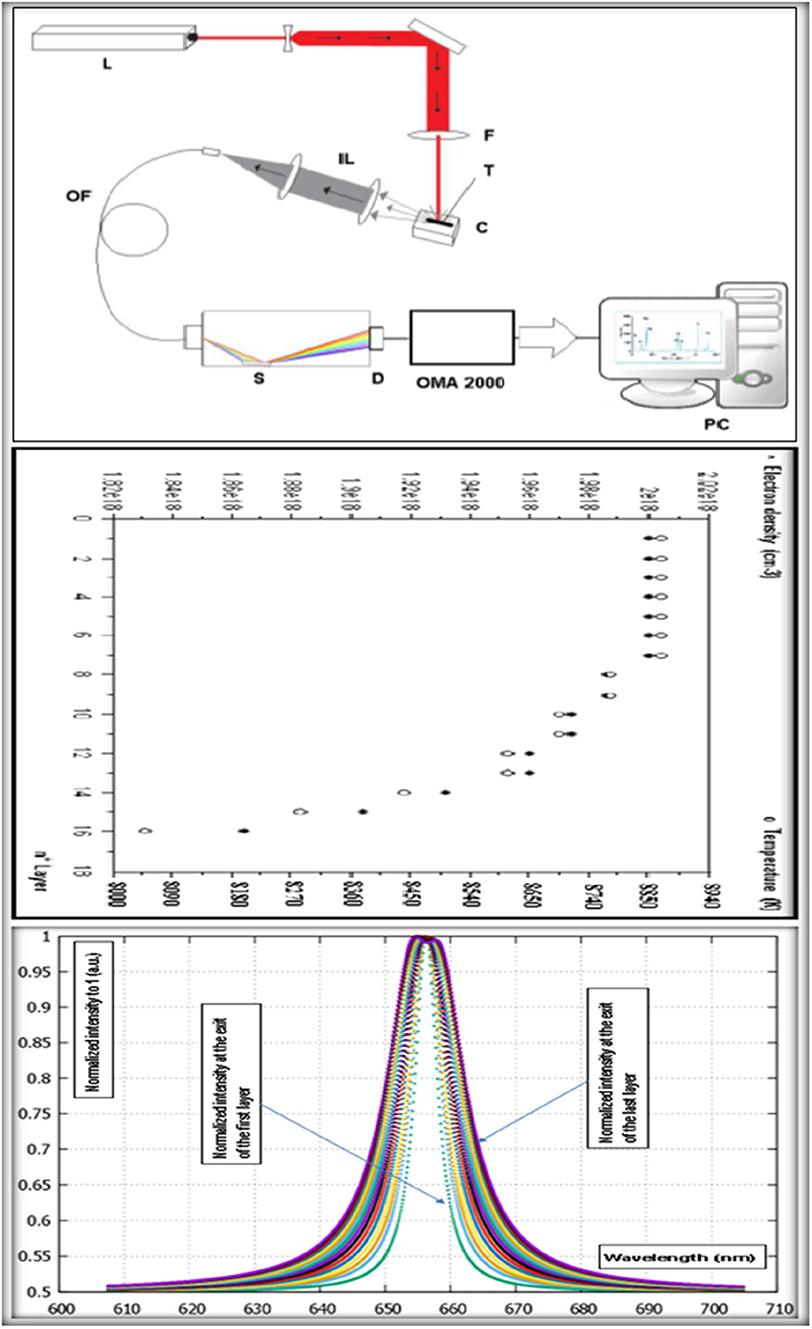
Keywords
Introduction
Different physical phenomena such as radiation scattering, absorption, and emission affect the radiation propagation inside an ionized medium, which is the radiative transfer phenomenon.1,2 Quite often, studies overlook and/or do not take diffusion effects into account. Inside an inhomogeneous plasma medium, this phenomenon of radiative transfer has a major effect on the intensity, width, and profile of spectral lines. Thus, it is necessary to be in the optically thin conditions at the centers of the spectral lines in particular or else it will be necessary to make appropriate corrections during the exploitation and the use of the quantitative analysis data. Large variations in line width and height caused by self-absorption have been observed by several authors.3,4
Thus, the radiative transfer equation (RTE) is of great interest in many scientific and engineering disciplines and plays a very important part in radiative transfer analysis in many media, e.g., ionized media and plasmas, liquids and semi-transparent solids, gaseous media, and porous and particulate media. Different forms of RTE exist,5–7 which are suitable for different and various applications. Thus, we find RTEs that are specific for refractive media for different analyses, e.g., RTE under different coordinate systems; several fundamental methods for the resolution of the RTE, among which one can quote the following numerical resolution methods; the finite volumes method, the finite elements method, the spherical harmonics method, and the discrete ordinates method.
The Balmer Hα line is a specific deep-red spectral line with a wavelength of 656.278 nm. Studying this line is one of the simplest means employed by astronomers to trace the content of ionized hydrogen in gas clouds. Filters selecting this line are often used in the observation of the Sun for protuberances, or in astrophotography to highlight the presence of hydrogen in nebulae. They can be used at the focus or the eyepiece.
In this work, we are interested in the one-dimensional RTE (1D-RTE). After the description of our method of resolution, we will apply it to the Balmer Hα spectral line resulting from emission by a plasma generated in water by a focused laser. A description of the experimental setup and different methods of deducing the experimental parameters will also be presented.
One-Dimensional Radiative Transfer Equation (1D-RTE)
During the emission of an ionized medium or a plasma, the quantity that can be measured, almost directly, is the intensity
Resolving the Procedure for the 1D-RTE
The plasma studied is considered to have cylindrical symmetry. We subdivide our plasma medium into N layers. Each layer n (for
By spatial discretization of Eq. 1, the 1D-RTE becomes as follows:


In the case of an inhomogeneous medium, the line profile

The frequency line shape and the wavelength line shape are related by: Calculation of radiation intensity of layer 1 (layer number n = 1): At the exit of the section made up of the N layers, the intensity emitted by the medium capable of being detected is calculated iteratively by Eq. 7:
One of the advantages of the present method compared to the methods of Amamou et al.
6
and Rezaei et al.
7
is that its mathematical formalism is very easy, and its application does not require heavy numerical processing and/or long calculation times.

Materials and Methods
Application to Experimental Data of the Balmer Hα Emission Line Emitted by the Interaction of a Pulsed Laser With Water
The components of the experimental device (Figure 1) include a pulsed laser (L), focusing lens (F), cell of interaction (C), target where plasma is created (T), optical coupler (IL), optical fiber (OF), spectrometer (S), detector (D), multichannel analyzer (OMA2000), and personal computer.

Experimental device.
At the center of interaction cell C, where the sample is placed to avoid any external pollution, is focused the neodymium-doped yttrium aluminum garnet laser pulse 1064 nm with a duration of 10 ns and energy between 10 and 115 mJ by a thin lens F of 50 mm focal length. The spot wide is about 62 μm and the plasma emission is sent to a spectrometer using an achromatic doublet IL focused on the input of an optical fiber OF by observation at by observation perpendicularly to the laser trajectory. The spectrometer disperses this light emission that is then intensified using a charge-coupled device, and then analyzed and recorded by an OMA2000 multichannel analyzer.
For our current study, the sample analyzed is water containing impurity traces of Ca and K. This allows to be determined the temperature of the plasma and the electron density by the Stark widths of the line, Ca(I), 422.67 nm, and of the doublet, Ca(II) 393.37 nm and 396.85 nm.
In this work and for more practical reasons, a Jobin-Yvon spectrometer with a dispersion of 240 Å mm−1 is used for the analysis of the Hα line, which is wider, but a high dispersion Chromex 500-IS spectrometer (16 Å mm−1) is used for the analysis of Ca lines which are narrower.
For a homogeneous and stationary hydrogen plasma, the criterion of LTE is
This criterion is always verified in our observation conditions of the studied spectral lines. But, given that the laser plasmas are time-dependent then equilibration time Te, checking is also necessary to reach a quasi-steady state, and close to LTE of plasma is sufficiently smaller compared to the observation time of the Hα line. Te represents the time required for the energy distribution of the excited states of the atom to be a Boltzmann distribution. Te < 0.2 ns in experimental conditions. 11 Ne ≥ 6 × 1017 cm−3 and T ≤ 10 000 K for the Hα observation times, thus the plasma is quasi-stationary, and it is at LTE.
The profile of Lorentz used for fitting the hydrogen Hα line is very adequate. 12 The full width at half area (FWHA) is equal to FWHM in the case of a Lorentzian profile. However, results are more accurate for electron density determination using FWHA because the dynamic effect of the ions influences the maximum intensity. But other authors 13 found that the usage of FWHM is preferred to FWHA for Ne density measurements ≥101017 cm−3.
The employment of the Abel inversion allows us to determine the local values of electron density. An x,y,z micro-positioning system allows high spatial resolutions, i.e., vertical (y-direction perpendicular to the laser beam) and longitudinal (z-direction along the laser beam). Considering a cylindrical symmetry, the observed spectra as a function of y are used to numerically solve the Abel inversion. 8 This makes it possible to obtain the local emission coefficients Sλ as a function of the distance r from the plasma center.
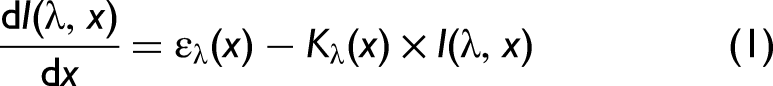
The variations of the intensities of the Ca and K lines as a function of the position on the vertical axis (by adding Ca and K traces to pure water) are used for the measurement of the diameter of the plasma. The profiles of temperature and electron density (Figure 2) obtained by Escarguel et al. 14 are used in this work. The plasma radius (plasma dimension) created and observed is L = 0.4 mm (Figure 3) and considered as a cylindrical symmetry and subdivided into 16 layers of thickness of Xe = 0.025 mm for each layer (Figure 3).

(o) Electron temperature experimental values versus position. (*) Electron density experimental values versus position. The duration of 500 ns is the time of integration and the duration of 200 ns is the delay from the beginning of plasma formation.
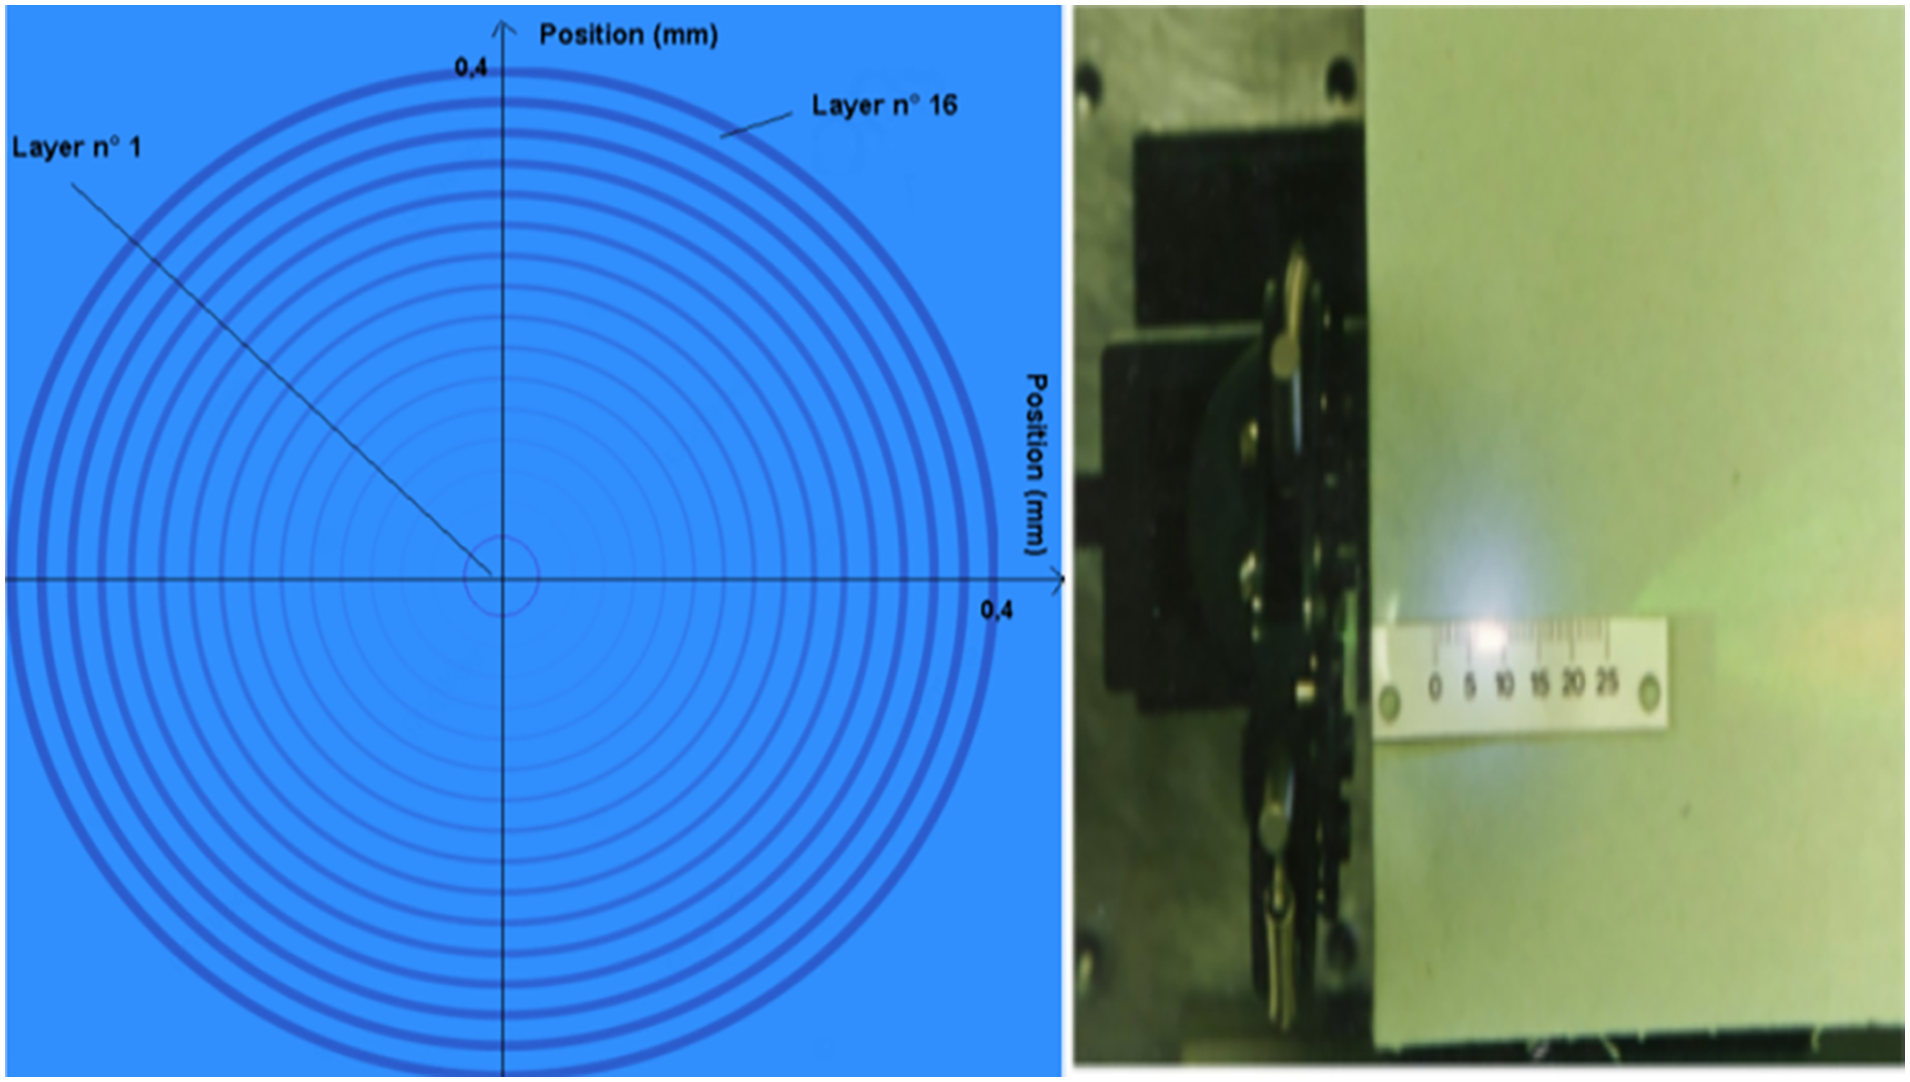
The 16 layers of plasma section and the created and observed plasma.
Because the center is hotter than the periphery, the electron temperature and the electron density, decrease from the plasma center to its periphery.
Study of the Hα Line of the Balmer Series Hα Emitted by the Interaction of a Pulsed Laser With Water
Among the spectral lines of hydrogen located in the visible part of the electromagnetic spectrum, we find the Hα. It is a specific dark red spectral line of the Balmer series, which is at a wavelength of 656.278 nm and is the first line of this series that corresponds to the transition from energy level with principal quantum number n = 3 to energy level with principal quantum number n = 2. In the literature, there are detailed studies15,16 of the Hα line broadening.
For the spectral lines of the hydrogenoid particles, the Stark broadening profile can be assumed to be Lorentzian. For each layer n the FWHM is
17

The Saha equation gives the singly ionized hydrogen density:

The measurement uncertainties obtained by the analysis of several spectra recorded under the same experimental conditions are 15% for the density of electrons and for the electron temperature at a value of 10% for FWHM.
Considering the fact that

The terms of the sum in Eq. 13 are the energies of all levels of this ionization state z. But the values of some energy levels are unknown, and this sum is often divergent. Thus, the disturbance is considered to only reach energy levels close to the ionization level, which means that only k terms are considered in this sum so that
Unsöld’s method is based on the fact that the emitter particle is disturbed by the ion's nearest neighbor. His reasoning gives the following relation:


By comparison, the values obtained using Griem's formula are slightly lower than those obtained using Unsöld’s formula.
For the hydrogen lines, the parameters used are
20
In this work, we considered the temperature and the density of electrons for a time of integration of 500 ns and a delay of 200 ns from the beginning of plasma. We also considered the contribution of the continuous radiation, as about half the intensity of the Hα line, which agrees with the results of Parigger and Oks. 21
Results and Discussion
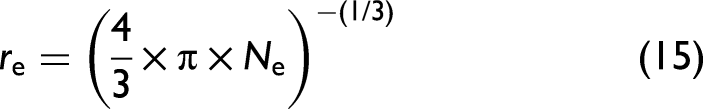
Figure 4 shows the normalized intensities evolution of the hydrogen Hα line emitted by plasma from the first layer to the last layer. Only the emission of the last layer can be detected. We notice that the width of the line increases as we move away from the center of the plasma. This is because the plasma is less dense and colder as one moves away from its center and therefore the atoms absorb more. 14

Evolution of normalized intensity of the hydrogen Hα line emitted by plasma from the first layer to the last layer.
Figure 5 illustrates the normalized intensity of the hydrogen Hα line emitted by plasma after the first layer. Figure 6 illustrates the normalized intensity of the hydrogen Hα line emitted by plasma after the last layer. The comparison of the two figures clearly shows that the width of the line has considerably increased after crossing the outer layers of the plasma. The physical phenomenon which is responsible for this enlargement is that of self-absorption.

Normalized intensity of the hydrogen Hα line emitted by the first layer of plasma.
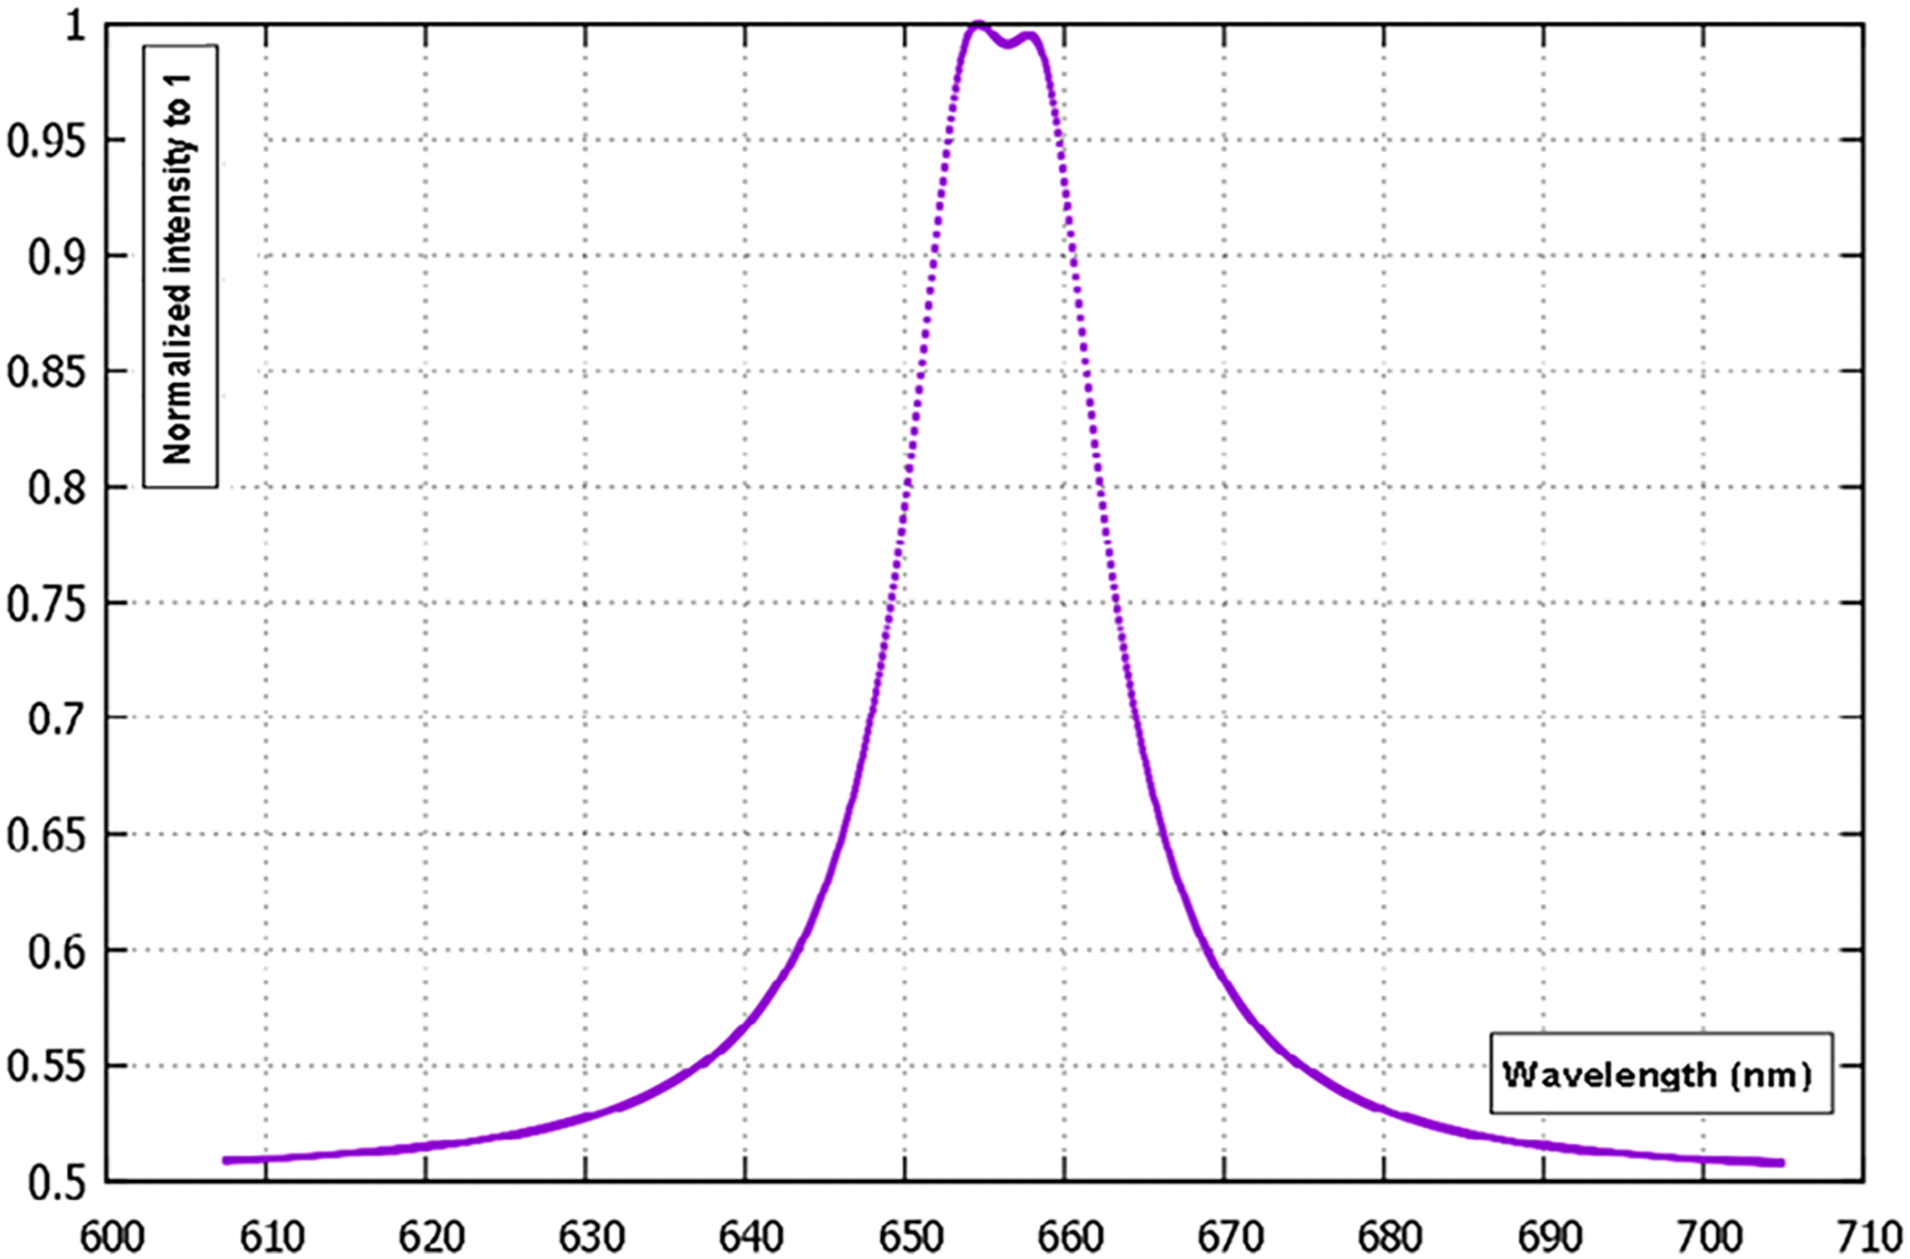
Normalized intensity of the hydrogen Hα line emitted by the last layer of plasma.
Figure 7 shows the evolution of the normalized intensity maximum of the hydrogen Hα line emitted by plasma from the first layer to the last layer. This intensity increases maximum as we move away from the center, but we notice that when we reach the eighth layer (or 0.2 mm) it begins to decrease. The increase in intensity from the center to the periphery is normal because we add the emissions from the layers of the first layer to the layer in question (obviously considering their absorptions). We will give later explanations for the reasons for this decrease.

Evolution of normalized intensity maximum of the hydrogen Hα line emitted by plasma from the first layer to the last layer.
Figure 8 illustrates the evolution of the FWHM of the hydrogen Hα line emitted by plasma from the first layer to the last layer. FWHM increases linearly as we move away from the center up to layer number 8. But this linear growth begins to flatten out thereafter. We will give later explanations for the reasons for this flattens.

Evolution of the FWHM of the hydrogen Hα line emitted by plasma from the first layer to the last layer.
The FWHM values of the hydrogen Hα line are in good agreement with those found by the authors.6,14,15,22
To understand this change in the variation of intensity maximum and of line width from the eighth layer (0.2 nm), we have also presented, the spectral line intensities at the exit of each of the 16 layers of the plasma. From these presentations, we have constated that from layer number eight, the spectral line begins to flatten, and from the 12th layer it begins to self-reverse. The inversion of the spectral lines has as one of its causes the inhomogeneity of the plasma. This inversion of the spectral lines is manifested by a hollow observed in the center of these lines, as has already been proven in other works.6,23
Our model is a very interesting model for many plasma types if there is no technical limitation for the measurements of the density of electrons and the temperature for layers with a very small thickness. But it is quite sufficient for plasmas which are not very inhomogeneous; that is the case of thermal plasmas.
Figure S1a (Supplemental Material) shows the theoretical Hα line, 6 Figure S1b (Supplemental Material) shows the theoretical Hα line (present work), and Figure S1c (Supplemental Material) shows the experimental line. 21
We found that the results obtained by these two works which use different methods are very similar or even identical.
The results from which this experimental line is derived are shown in Table I.
Experimental values of FWHM and Ne obtained by Parigger and Oks. 21

The conditions of these works are similar. By comparison of these lines, we can see that are very similar.
The Hα line that we obtain in our work is for a density of electrons of 18.4 × 1017 cm−3 (as can be deduced from Figure 2) and the associated FWHM value is 145 Å (as can be deduced from Figure 8). Table I presents the FWHM of the Hα line measured for different electron densities by Parigger and Oks 20 (for different experimental conditions of integration time and the delay from the beginning of plasma formation). From this table, we can deduce for a density of 18.4 × 1017 cm−3 the FWHM is between 54.4 and 254 Å, which allows us to affirm that our value is coherent. By comparing these results, we find that there is a very obvious consistency between the two results. Thus, we can say that our method leads to similar results to the experimental and theoretical results of other authors.
It can also be deduced that the inhomogeneities of the ionic field and the static quadratic Stark effect (to a lesser extent) are the main causes of the asymmetries of the H-line profiles observed in certain experimental spectra.
Conclusion
For the diagnostics of physical plasmas, self-absorption phenomenon and homogeneity effects or/and their importance are largely neglected. These two effects can be overcome by solving the equation of radiative transfer. However, the analytical resolution of such an equation in the general case remains very thorny. In this present work, we have proposed a new solving procedure for the one-dimensional radiation transfer equation. The resolution proposed, in this work for the first time, is based on spatial discretization and an iterative method. The emitter medium is subdivided into several layers and each layer is considered homogeneous. The emission intensity of each layer is deduced from the previous layer. This method does not require heavy digital processing compared to other resolution methods. This solution is then used to model the Balmer Hα spectral line resulting from emission by a plasma generated in water. The line profiles obtained are in very good agreement with those of other authors. The FWHM of the Balmer Hα spectral line is also in very good agreement with that observed experimentally. From the results presented in this work, we can affirm that our procedure resolution of the equation of radiative transfer is a very good method that gives results very much in adequacy with other theories and with the experimental results.
Supplemental Material
sj-docx-1-app-10.1177_27551857241228616 - Supplemental material for Procedure to Solve the One-Dimensional Radiative Transfer Equation (1D-RTE) of an Ionized Medium Using Spatial Discretization and an Iterative Process
Supplemental material, sj-docx-1-app-10.1177_27551857241228616 for Procedure to Solve the One-Dimensional Radiative Transfer Equation (1D-RTE) of an Ionized Medium Using Spatial Discretization and an Iterative Process by Hssaïne Amamou, André Bois and Belkacem Ferhat in Applied Spectroscopy Practica
Footnotes
Declaration of Conflicting Interests
The authors declared no potential conflicts of interest with respect to the research, authorship, and/or publication of this article.
Funding
The authors received no financial support for the research, authorship, and/or publication of this article.
Supplemental Material
All supplemental material mentioned in the text is available in the online version of the journal.
References
Supplementary Material
Please find the following supplemental material available below.
For Open Access articles published under a Creative Commons License, all supplemental material carries the same license as the article it is associated with.
For non-Open Access articles published, all supplemental material carries a non-exclusive license, and permission requests for re-use of supplemental material or any part of supplemental material shall be sent directly to the copyright owner as specified in the copyright notice associated with the article.