
Abstract
A rotational resolution cavity-enhanced absorption spectroscopy (CEAS) technique is presented for infrared (IR) absorption studies at temperatures between 77 and 300 K. The cavity consists of an aluminum tube with two highly reflecting near-IR mirrors at each end. The cavity is attached to the cold head of a liquid nitrogen cryostat inside a vacuum chamber. In this way, all the cavity components are the temperature of the cold head. The spectra are obtained with a tunable diode laser and lock-in detection. The laser is modulated with an electro-optic modulator and coupled to the optical cavity. To illustrate the use of the technique, the vibrational–rotational overtone transitions (υ = 0→3) of carbon monoxide at 295 and 80 K and the acetylenic C–H (υ = 0→2) bond of CH3C≡C–H at 293 and 165 K are obtained. Temperatures are obtained with a Boltzmann distribution calculation that involves rotational intensities and energies from the spectra. Spectroscopic constants agree with previous determinations using other methods. An average of signals over the entire range of the absorption produces a rotational intensity distribution with some deviations. The calculated temperature based on the Boltzmann distribution is in very good agreement with the temperature measured with a silicon temperature sensor attached to the cell. Comparison with other experimental approaches to CEAS and the importance of the technique for applications in astrochemistry are discussed.
This is a visual representation of the abstract.
Keywords
Introduction
The cavity-enhanced absorption spectroscopy (CEAS) technique has been developed in the last 30 years.1–4 In comparison with the cavity ring-down spectroscopy (CRDS) technique that produces direct absorption cross sections, CEAS requires averaging to obtain reproducible intensities and calibration with CRDS-derived cross sections. The CEAS is easier to implement than CRDS because of its simpler experimental setup and optical alignment. A disadvantage is that CEAS does not directly determine the reflectivity of the mirrors and the absolute magnitude of the absorption coefficient
The CEAS technique has not been applied to vibrational studies at cryogenic temperatures. After constructing a low-temperature cell for cavity ring-down (CRD) absorption studies, 17 our group has used phase shift CRDS with a continuous wave (cw) Ti:sapphire laser. We obtained oxygen absorption (γ and A bands) spectra to determine temperatures between 90 and 296 K in a cryogenic cell. 18 We have used the same technique flowing air into heated open tubes to obtain air temperatures from O2 spectra.19,20
To illustrate the use of the CEAS technique at low temperatures, the vibrational–rotational overtone transitions (υ = 0→3) of carbon monoxide (CO) at 295 and 80 K and the acetylenic C–H (υ = 0→2) bond of CH3C≡C–H at 293 and 165 K are obtained. The spectra of CO and CH3CCH have been used for identification, composition, and temperature determination in the atmosphere of planets and satellites of the outer solar system and interstellar clouds. For example, the rotational–vibrational transition (υ = 0
In this research, we changed the laser source and technique from a visible laser and CRD at low temperatures to a NIR diode laser and the CEAS technique to illustrate the use of the CEAS at cryogenic temperatures. We obtained the second overtone of CO at 298 and 80 K and the first overtone transition of the acetylenic C–H stretch of propyne at 298 and 165 K. The experiments are performed at pressures from 70 mTorr to 2 Torr. We conclude by comparing our experimental setup to other approaches and discuss the main improvement of the CEAS technique when using coherent supercontinuum sources combined with dispersion or Fourier transformation of the radiation.
Experimental
Materials and Methods
The experimental arrangement is illustrated in Figure 1. The Thorlabs (Intun TL-1550-B) laser, which operates within the 1490 to 1610 nm wavelength range, is utilized as the IR source. The narrow band cw laser is subjected to modulation at 1 kHz using a Conoptics electro-optic modulator (model 360-40). The NIR light is introduced into an optical cavity, which is comprised of two concave mirrors with a diameter of 12.7 mm, a radius of curvature of 1.0 m, and has a reflectivity of R = 0.9995 around 1550 nm. The cell and cryostat have been described in detail in a previous publication. 17 The cell is adjusted to facilitate efficient coupling of the laser light. The light that escapes from the cavity is detected by a Thorlabs InGaAs amplified photodetector (model PDA10CS). The detector signal is pre-amplified using a Stanford Research System (SRS model SR 560) and transmitted to an SRS lock-in amplifier (model SR830). The intensity data as a function of wavelength is transferred to a computer using a general-purpose interface bus interface. LabVIEW programs are employed to manage the data acquisition, laser wavelength scan, data processing and display, and output of the results to a text file.

Schematic of the cavity-enhanced absorption spectrometer.
The laser undergoes factory calibration to ensure accurate wavelength measurements, and we convert the spectra to wavenumbers. The resulting frequencies typically exhibit slight variations, necessitating precise calibration of the peaks in relation to the frequency. To achieve this, we utilized a calibration curve that correlates wavelengths with known transition frequencies, at high resolution. To obtain the spectra of CO and propyne at a specific pressure, it was important to identify the appropriate conditions by optimizing the laser scan rate and the time constant of the lock-in amplifier. Once the optimal conditions were determined based on the overall appearance of the spectrum, 10 spectra were acquired and subsequently averaged using a computer.
A brief description of the cryostat is given here. An International Cryogenics-controlled temperature cryostat (model 31-4000) system was used. A 45 cm long optical cavity was attached to the low-temperature cryostat. The novelty of the experimental setup is that the complete optical cavity is inside a vacuum chamber that insulates the cavity and the cold head of the cryostat from the environment. The cavity temperature can be changed between 10 and 298 K using liquid He or between 77 and 298 K using liquid N2. The cavity is connected to the external gas handling system through a small section of stainless steel tubing. The cryostat has four vacuum ports to allow electrical feed-through and vacuum measurement devices to be used without compromising the vacuum chamber. The electrical wires for the temperature controller unit use one port to allow access to two silicon diode temperature sensors (model Si-410A), one that measures the temperature of the cold block, and another for the cell. If the vacuum chamber pressure is below 10−8 Torr, both temperatures are the same. The temperature is controlled with a Scientific Instruments (model 9650) temperature controller and indicator. Calibration voltages and temperatures are provided by SI for the mentioned model. Lecture bottles of CO and propyne of 99% purity from Matheson were used for all experiments.
Results and Discussion
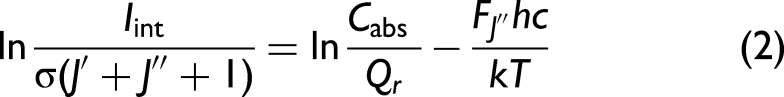
The vibrational–rotational frequencies of the overtone spectra can be represented by Eq. 1:31

The Boltzmann equation that reproduces the temperature
31
is given by:

Carbon Monoxide
The second overtone vibrational–rotational spectrum and spectroscopic constants of CO are well known32–34 from measurements at room temperature. The cavity-enhanced spectra of CO are shown in Figure 2 at 295 K, as well as experimental and simulated spectra at 80 K. The simulation was done with reported spectroscopic constants32–34 and the use of the program PGOPHER.
35
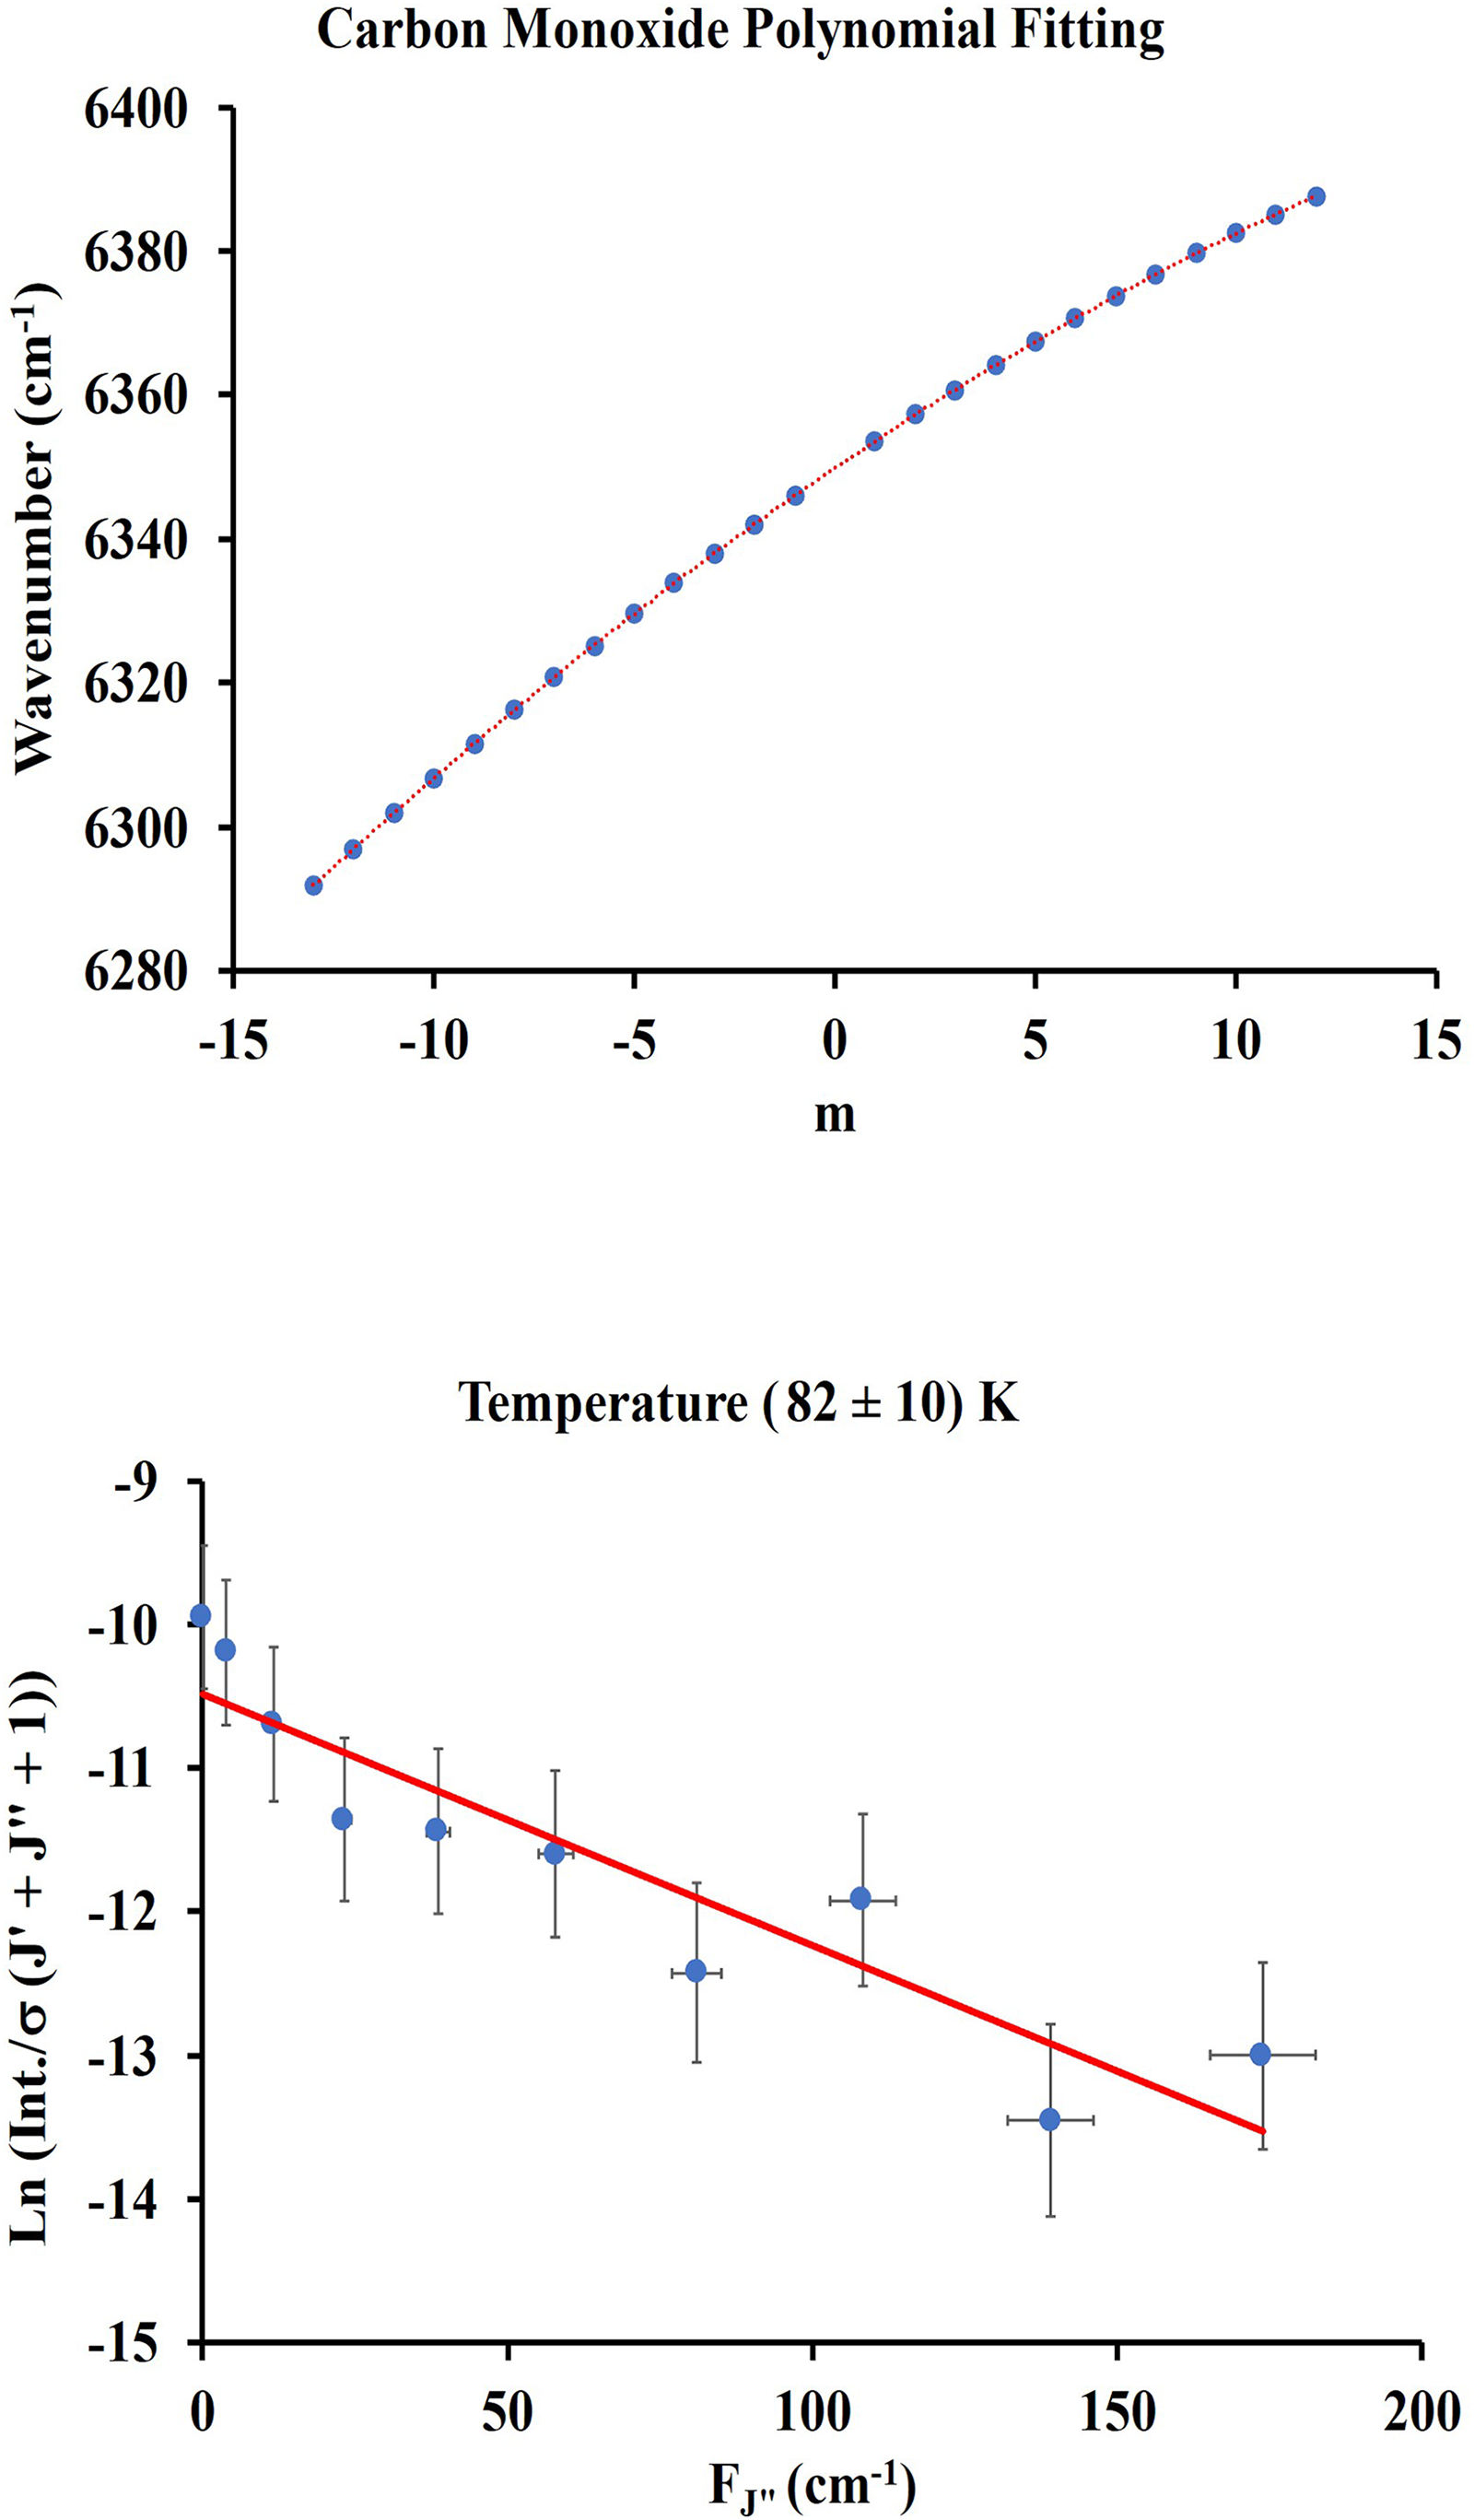
The pressure inside the cell is 2.0 Torr. Table I shows the measured wavenumbers and normalized intensities of the rotational transitions. Normalization was done with respect to the transition of the highest intensity, preserving the original intensity distribution. Figure 3 (top) shows the fit of the measured wavenumber as a function of the quantum number m. The fit can be represented by Eq. 4:


Cavity-enhanced absorption spectra of the second overtone (3ν) of CO at 295 K (top). Experimental (blue) and PGOPHER simulated (red) spectra at 80 K (bottom).

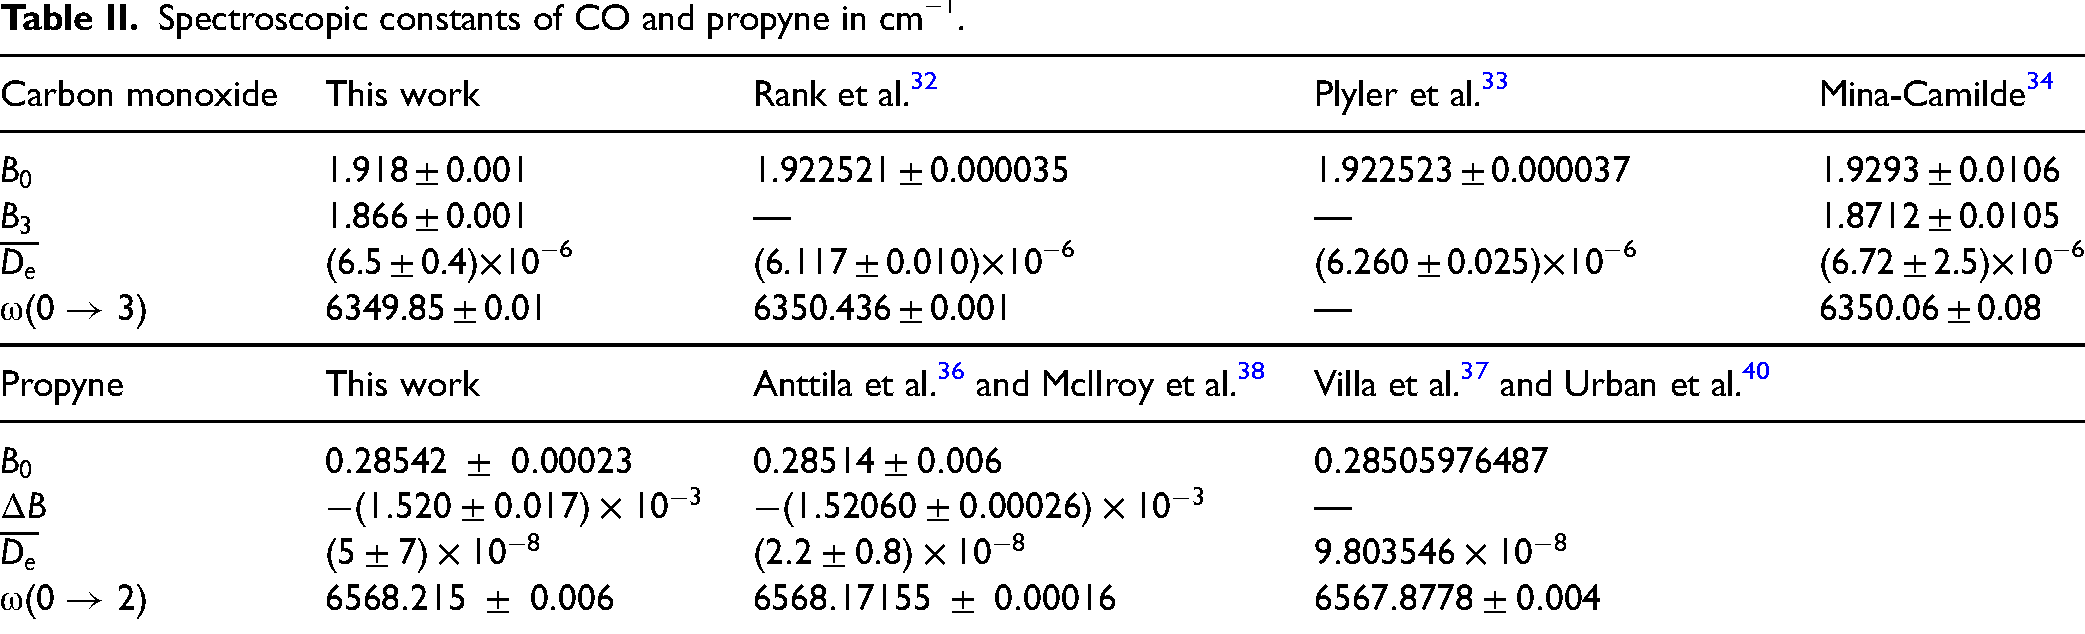
The coefficients of Eq. 4 with statistical errors are presented in Table II. The rotational constants (B0, B3, and De) and the transition frequency
Spectroscopic constants of CO and propyne in cm−1.
Propyne
The first overtone vibrational–rotational spectrum and spectroscopic constants of propyne are well-known from measurements at room temperature and low-temperature experiments.36–38 The vapor pressure of propyne is 1 Torr at 162 K. The experiments were done with pressures below 600 mTorr to avoid condensation of propyne inside the cell. The cavity-enhanced spectra of the acetylenic C–H of CH3CC–H (2ν1) are shown in Figure 4 at 293 K and the experimental and simulated spectra at 165 K. The simulation was done with reported spectroscopic constants37,38 and the use of the program PGOPHER.
35
The pressure inside the cell is 529 mTorr. Table III shows the measured wavenumbers and normalized intensities of the rotational P(J) and R(J) transitions at 165 K. Figure 5 (top) shows the fit of the measured wavenumber as a function of the quantum number m, assigned as m = J + 1 for the R(J) branch and m = 

Cavity-enhanced absorption spectra of the acetylenic first overtone (2ν1) of propyne at 293 K (top). Experimental (blue) and PGOPHER simulated (red) spectra at 165 K (bottom).

Propyne (2ν1) line positions in cm−1 and normalized intensities (Int.).

The coefficients of Eq. 5 with statistical errors are presented in Table II. The vibrational transition and the B rotational constants are in good agreement with overtone transition results at high resolution considering only K = 0 data.36–38 The order of magnitude of
The calculated temperature was obtained from a plot shown in Figure 5 (bottom) using Eq. 2 with wavenumbers and intensities of the P branch from Table IV. The intensities are the average of 10 spectra. Any of the two branches could have been chosen for the temperature calculation but the intensities of R(0) to R(3) could not be clearly determined. Error bars indicate scatter of intensities of 10 spectra (5%). The P branch was chosen because it showed slightly stronger intensities than the R branch and more experimental points could be included in the calculation. The slope of the line is – (8.8 ± 0.8) × 10−3 cm. The calculated temperature (164 ± 15) K is obtained from the inverse of the slope of the line multiplied by the Boltzmann constant 1.43879 K/cm−1. A similar temperature calculation based on the R branch transitions produces a temperature of 167 K which is within the range of the P branch calculation.

Conclusion
The CEAS technique has been extended to include for the first time a static optical cavity inside a low-temperature cryostat. The application of the low-temperature CEAS technique was demonstrated using CO and propyne showing that spectroscopic constants and temperatures can be derived from this method. In comparison with the phase shift CRD used in our laboratory for low-temperature studies, the mirrors in the cavity are easier to align. The cavity has a lower requirement for mechanical stability. The combination of mechanical stability at low temperatures and high sensitivity at pressures in the milliTorr range makes this an excellent technique for spectroscopic studies and astrochemical applications. The success of the experiment covering a large frequency range is based on the ability to co-add and average many signals to get the Boltzmann distribution of intensities. The spectra averaging process is not a problem for wide bands, but it reduces the resolution of the spectra for rotational resolution experiments. This is a disadvantage in comparison with the phase shift CRD in the same low-temperature system of our laboratory where no averaging is required. We conclude that mechanically scanning a tunable laser (or a monochromator) when using a continuous excitation source is not the most efficient method of doing the CEAS experiment. An efficient way to average without compromising the spectral resolution is to obtain simultaneously the complete spectra. Methods proposed in the literature with non-scanning parts that use a supercontinuum excitation source (with a larger frequency range) combined with dispersion grating spectrometers and charge-coupled device cameras7,8 seem to be the most promising experimental methods for the CEAS technique.
Footnotes
Acknowledgments
This work was supported by the Baylor University Research Committee and the Vice-Provost for research.
Declaration of Conflicting Interests
The authors declared no potential conflicts of interest with respect to the research, authorship, and/or publication of this article.
Funding
The authors received no financial support for the research, authorship, and/or publication of this article.