
Abstract
A handheld visible- and shortwave near-infrared spectrometer has been developed for monitoring daily changes in fruits and vegetables. The ripening processes of a mini tomato sample have been monitored daily for about 100 days by this instrument and color values L*a*b* and Brix were measured. Obtained reflection spectra in the 400–1050 nm range were converted to absorption spectra and daily changes of band areas of chlorophyll a (Ch1 a; 640–710 nm), carotenoids (460–520 nm), lycopene (545–600 nm), and water + sugar (920–1050 nm) were determined. The band area of lycopene increased rapidly from 36 to 44 days associated with the increase in a* value, indicating that the increase in the reddish color originated from the increase of lycopene. On the other hand, the band area of Chl a decreased exponentially over 100 days. This Chl a decrease could be well fitted by the first-order reaction giving the rate constant k = 4.07 × 10⁻⁷ s–1. These quantitative daily changes of pigments in fruits and vegetables are expected to provide comprehensive bases for their cultivation and harvest.
This is a visual representation of the abstract.
Keywords
Introduction
The ripening processes of vegetables and fruits such as tomatoes have been extensively studied by dividing them into several stages and analyzing representative chemical components.1–4 Tomatoes are one of the most important vegetables/fruits, since they contain sugars and many health-promoting compounds including carotenoids, phenols, and vitamins.2–4 Biochemistry and metabolic pathways of tomato fruit development have been studied through conventional chemical analyses by taking samples with their processing to powders or liquids.2–4
Visible spectroscopy with color measurements has often been conducted for fruits/vegetable ripening processes, since dramatic color changes occur during their ripening.5–8 For tomatoes, several visible wavelengths including 570 nm for lycopene 8 and 675 nm for chlorophylls, 6 and color a* (green/red) and b* (blue/yellow) values (Commission Internationale de l’Eclairage [CIE] 1976)5,9 have been used to correlate these with lycopene contents and ripening stages.
Near-infrared (NIR) spectroscopy has also been performed for fruits/vegetable ripening processes, especially for evaluating water and soluble solids such as sugars.10,11 For tomatoes, the Vis-NIR region was analyzed by chemometrics to evaluate the contents of chemical components with their sensory qualities, 12 and soluble solids and lycopene. 11
However, for farmers working at cultivation sites, the decision of harvesting and shipping of fruits and vegetables needs detailed data on quantitative daily changes of main chemical components in response to different ripening stages. Conventional analytical chemical methods are time-consuming and cannot be applied to the same samples. Therefore, nondestructive methods such as visible and NIR spectroscopy are required to provide quantitative daily changes of some representative chemical components during the ripening of fruits and vegetables.
The authors developed a handheld spectrometer in the 400–760 nm range by using a visible sensor (256 channels). 13 In this study, the authors combined two sensors to develop a handheld visible–NIR (Vis-NIR) spectrometer in the 400–1050 nm range covering wider spectral regions including the short wavelength NIR region. This new instrument was used to monitor the daily changes of a mini tomato for about 100 days. Daily changes of color L*a*b* values and Vis-NIR spectra were followed during the ripening of the same position of the mini tomato. Daily changes of chlorophyll, lycopene, and carotenoids and their relations to color values were examined.
Materials and Methods
A commercially available seedling of a mini tomato (Solanum lycopersicum; Suntory, Sweets Red) was purchased and planted in a planter set on a veranda of the first author's home in Osaka, Japan. The seedling was grown on the veranda by supplying just water every day from 22 April 2022 to 13 August 2022. No fertilizer was added.
Handheld Vis-NIR Spectrometer
A handheld Vis-NIR spectrometer has been originally developed (Fig. 1). This instrument uses two monochromators with 256 channels in the wavelength range of 340–780 nm (Hamamatsu, C12666MA) and 640–1050 nm (Hamamatsu, C11708MA-01). Since signals at shorter and longer wavelength regions are weak, effective wavelength regions are from 400 to 1000 nm by connecting at 700 nm. In the present study, spectra are presented in the 400–1050 nm range with about 330 channels, since signal-to-noise ratios are good at the longer wavelength region (Fig. 1).

Handy Vis–NIR spectrometer. (a) Schematic configuration of two monochromators, (b) measuring optics, and (c) photographic images of the spectrometer and the dark and white cover plates. (d) Reflection spectra of the white reference (MgO) and a mini tomato at 0 and 43 days. (e) Absorption spectra of the white reference (MgO) and the mini tomato at 0 and 43 days.
A xenon (Xe) lamp was used as a light source. This light was applied to the sample surface using a fiber guide and reflected lights from the sample were collected through fiber guides at angles of 45°. These reflected lights were then dispersed by the two monochromators (Figs. 1a and 1b).
The power of direct current 5 V can be supplied to the spectrometer from the universal serial bus (USB) cable connected to a personal computer (PC). The signals recorded by the two monochromators can be transferred to a Windows PC through the USB cable and a Windows program was used to measure and store spectra. By using four AAA batteries, the signals were sent via WiFi to a PC or iPhone. An iPhone application (PRISMO Mirage) can also be used to control the spectrometer (Fig. 1c).
A dark signal was first measured without the light source by using an original cover plate covering the measuring aperture of about 6 mm in diameter. Then, a reference signal was measured with the light source by using another face of the original plate with a white reference made of MgO with known reflectance (R) values (Fig. 1c). Reflected light intensities from a sample were obtained by the following equation:

The R spectrum of the white reference of MgO measured by this spectrometer is shown in Fig. 1d. By taking Abs = –log R, its absorbance (Abs) spectrum can be obtained as shown in Fig. 1e.
Since the signals of the two monochromators change with temperature, a temperature–humidity sensor was set inside the spectrometer. The temperature and relative humidity (RH) inside the spectrometer at the daily measurements were 30.1 ± 4.3 °C and 60.3 ± 13.2%, respectively, during the measurement period. Therefore, measured signals by the monochromators were used without correction.
Daily Measurements
The same position of a mini tomato grown on the veranda was measured daily around 8:00 a.m. by the handheld Vis-NIR spectrometer from 24 April 2022 to 13 August 2022 for 111 days (Fig. 2a).

Daily monitoring of the ripening processes of a mini tomato from 24 April 2022 to 13 August 2022 for 111 days. (a) Photographs of the mini tomato with color changes, (b) temperature changes with time, (c) RH changes with time, (d) Brix value changes with time, (e) L* value (black/white) changes with time, (f) a* value (green/red) changes with time, and (g) b* value (yellow) changes with time.
A handheld Brix meter (Atago, PAL Light Sensor 3 Mini Cat. No. 5403) was also used to measure Brix values at the same time as the above spectroscopic measurements. Temperature, humidity, and luminance values on the veranda were monitored every hour during this period by a temperature, humidity, and luminance sensor.
Results
Temperature, Humidity, and Luminance Values During Mini Tomato Ripening
Temperatures on the veranda during the measurement period of the mini tomato are plotted in Fig. 2b. Minimum and maximum temperatures were 10.2 °C and 41.8 °C, respectively, with an average value of 25.9 °C. The veranda is facing southeast and the direct sunlight is shining on the mini tomato around 7:00 to 9:00 a.m. Therefore, the temperature at the sample can increase under direct sunlight leading to a high temperature as high as 41.8 °C.
Relative humidity values at the veranda changed from 17.0% to 89.0% with an average value of 56.3% (Fig. 2c). Luminance values changed from 0 to 8882 Lux during this period (figure not shown).
Brix and Color Values During Mini Tomato Ripening
Brix values are around 10 at the start of the ripening and reached a maximum of about 13 at around 45 days, then decreased down to three (Fig. 2d).
Color values of L*, a*, and b* were calculated from the R spectra based on the L*a*b* color space recommended by the CIE (second CIELAB 1976 color space).14,15 Their daily changes are plotted in Figs. 2e–2g. L* (black/white) values decreased from about 50 to 20 during the mini tomato ripening (Fig. 2e).
The a* (minus green, plus red) values started from −6.7, stayed in minus values (green) until about 35 days, and then increased rapidly to about +13 at 43 days and after staying at red a*, which decreased and fluctuated at the late stage due to degradation of the mini tomato (Fig. 2f).
The b* (minus blue, plus yellow) values first decreased from about 20 to 10 and then increased to about 23; after about 50 days the b* values fluctuated due to degradation (Fig. 2g).
Reflectance and Absorption Spectra During Mini Tomato Ripening
Representative R spectra obtained by using the spectrometer are shown in Figs. 1d and 3a. They show changes with time in several wavenumber regions. In order to examine quantitative changes in absorption bands, R spectra are converted to Abs spectra by the following equation:


Representative spectra of the mini tomato during its ripening. (a) Changes in reflection spectra, (b) changes in absorption spectra, (c) details of absorption spectra in the 400–800 nm region with the baseline ranges for determining band areas of carotenoids (460–520 nm), lycopene (545–600 nm), Chl a (640–710 nm), and water + sugar (920–1050 nm) (shown in b).
Although diffuse R can be used as quantitative spectra for granular or powdery materials, mini tomato samples are not considered to be composed of granular structures with diffuse reflection. Moreover, the minus logarithm of R (Abs) is often taken as quantitative spectra in R spectroscopy of plants and food products.16–19
Representative Abs spectra of mini tomato converted from the reflection spectra are shown in Figs. 1e and 3b. Their 400 to 800 nm wavelength region is expanded in Fig. 3c.
A small band around 970 nm can be recognized in Figs. 1e and 3b. This band is considered to be mainly due to a combination of overtones of symmetric and antisymmetric stretching vibrations of water molecules.19–21 This band may include a small component around 980–960 nm due to OH vibrations of sugars.20,22
Although several bands due to sugar components have been reported around 730, 830, 910, and 930 nm together with the 960 nm band due to combinations and overtones of CH and OH vibrations in the direct spectroscopic measurement of foods,19,20,22 they are not recognizable in the present spectra.
In the wavelength region from 400 to 800 nm, several absorption bands are observed (Figs. 1e and 3c). A small band around 490 nm can be recognized during the early stage of mini tomato ripening. This 490 nm band can be mainly due to carotenoids such as β-carotene, since they have generally absorption bands in the 440–500 nm region.1,8
A band around 565 nm became apparent at the later stage of ripening (Figs. 1e and 3c). This band is considered to be due to lycopene based on the literature. 11 However, its band position is at a higher wavelength than the literature data in organic solvents around 500 nm. 23 This will be discussed later.
A large and wide band around 670 nm is present at the early stage of ripening and decreased at the later stage (Figs. 1e and 3c). This band is due to chlorophylls24,25 and will be discussed later.
Discussion
Absorption Band Positions of Chl a and Lycopene
The band at 670 nm of the mini tomato was considered to be due to Chl a in this study, since a 670–680 nm band was generally reported in direct spectroscopic measurements on plants including tomatoes.6,7,21,25,26 However, the absorption maxima of Chl a in organic solvents such as diethyl ether and acetone–hexane are reported to be around 430, 578, and 662 nm, with the longest one around 660 nm.1,24 This band is reported to shift to the longer wavelength (redshift) in the presence of charged polar components. 27 The redshift of Chl a in the plant tissue (in vivo) can be originated from the presence of water and the binding of Chl a in the photosynthetic complexes (photosystems).
The band at 565 nm in the mini tomato was assigned to lycopene in this study, since this position was generally reported in direct spectroscopic measurements on tomatoes.8,11,17,18 The absorption maxima of lycopene in organic solvents such as n-hexane and methanol are reported at 360, 442, 468, and 499 nm, with the longest wavelength peak around 500 nm.23,28 These bands can be redshifted by up to about 30 nm in nonpolar solvents having larger refractive indices for carotenoids including lycopene. 23 The redshift can also be originated from the binding of the carotenoids by photosynthetic complexes (photosystems). 23 The redshifts by up to 40 nm of these carotenoid bands have been reported in polar solvents. 29 Therefore, the redshifted band around 565 nm of lycopene in the plant tissue (in vivo) can be explained by the presence of water and the binding of lycopene in the photosynthetic complexes.
Changes with Time in Band Areas During Mini Tomato Ripening
In Vis-NIR spectroscopic measurements of tomatoes, several spectral analyses including chemometrics have been conducted to obtain good indicators having good correlations to contents of representative chemical components such as chlorophylls, carotenoids, lycopene, sugars, and soluble solids (Brix).5–12,17–22,25 However, in this study, it is impossible to conduct conventional chemical analyses of the same mini tomato sample at the different ripening stages. Therefore, the absolute contents of chemical components cannot be evaluated. Since the same position of the same sample was measured by the same method, changes with time of band intensities such as band areas of chlorophylls, carotenoids, and lycopene can provide at least relative changes in amounts of these components. Therefore, the following band areas were determined (Fig. 3c).
The band area around 490 nm due to carotenoids was determined by a linear baseline from 460 to 520 nm for avoiding overlaps with other bands in the shorter and longer wavelength regions (Fig. 3c). The band area around 565 nm due to lycopene was determined by a linear baseline from 545 to 600 nm for avoiding overlaps with the bands of carotenoids and chlorophylls (Fig. 3c). The band area around 670 nm due to chlorophylls was determined by a linear baseline from 640 to 710 nm for avoiding overlaps with the lycopene band (Fig. 3c). Since this narrow region corresponds to the absorption band of Chl a with only small contributions from chlorophyll b, 24 this band is taken as the Chl a band. The band area around 970 nm due to water and sugars was determined by a linear baseline from 920 to 1050 nm (Fig. 3b).
The 640–710 nm band area of Chl a decreased quasi-exponentially with time throughout the measurement period (Fig. 4a). This Chl a decrease will be analyzed later.
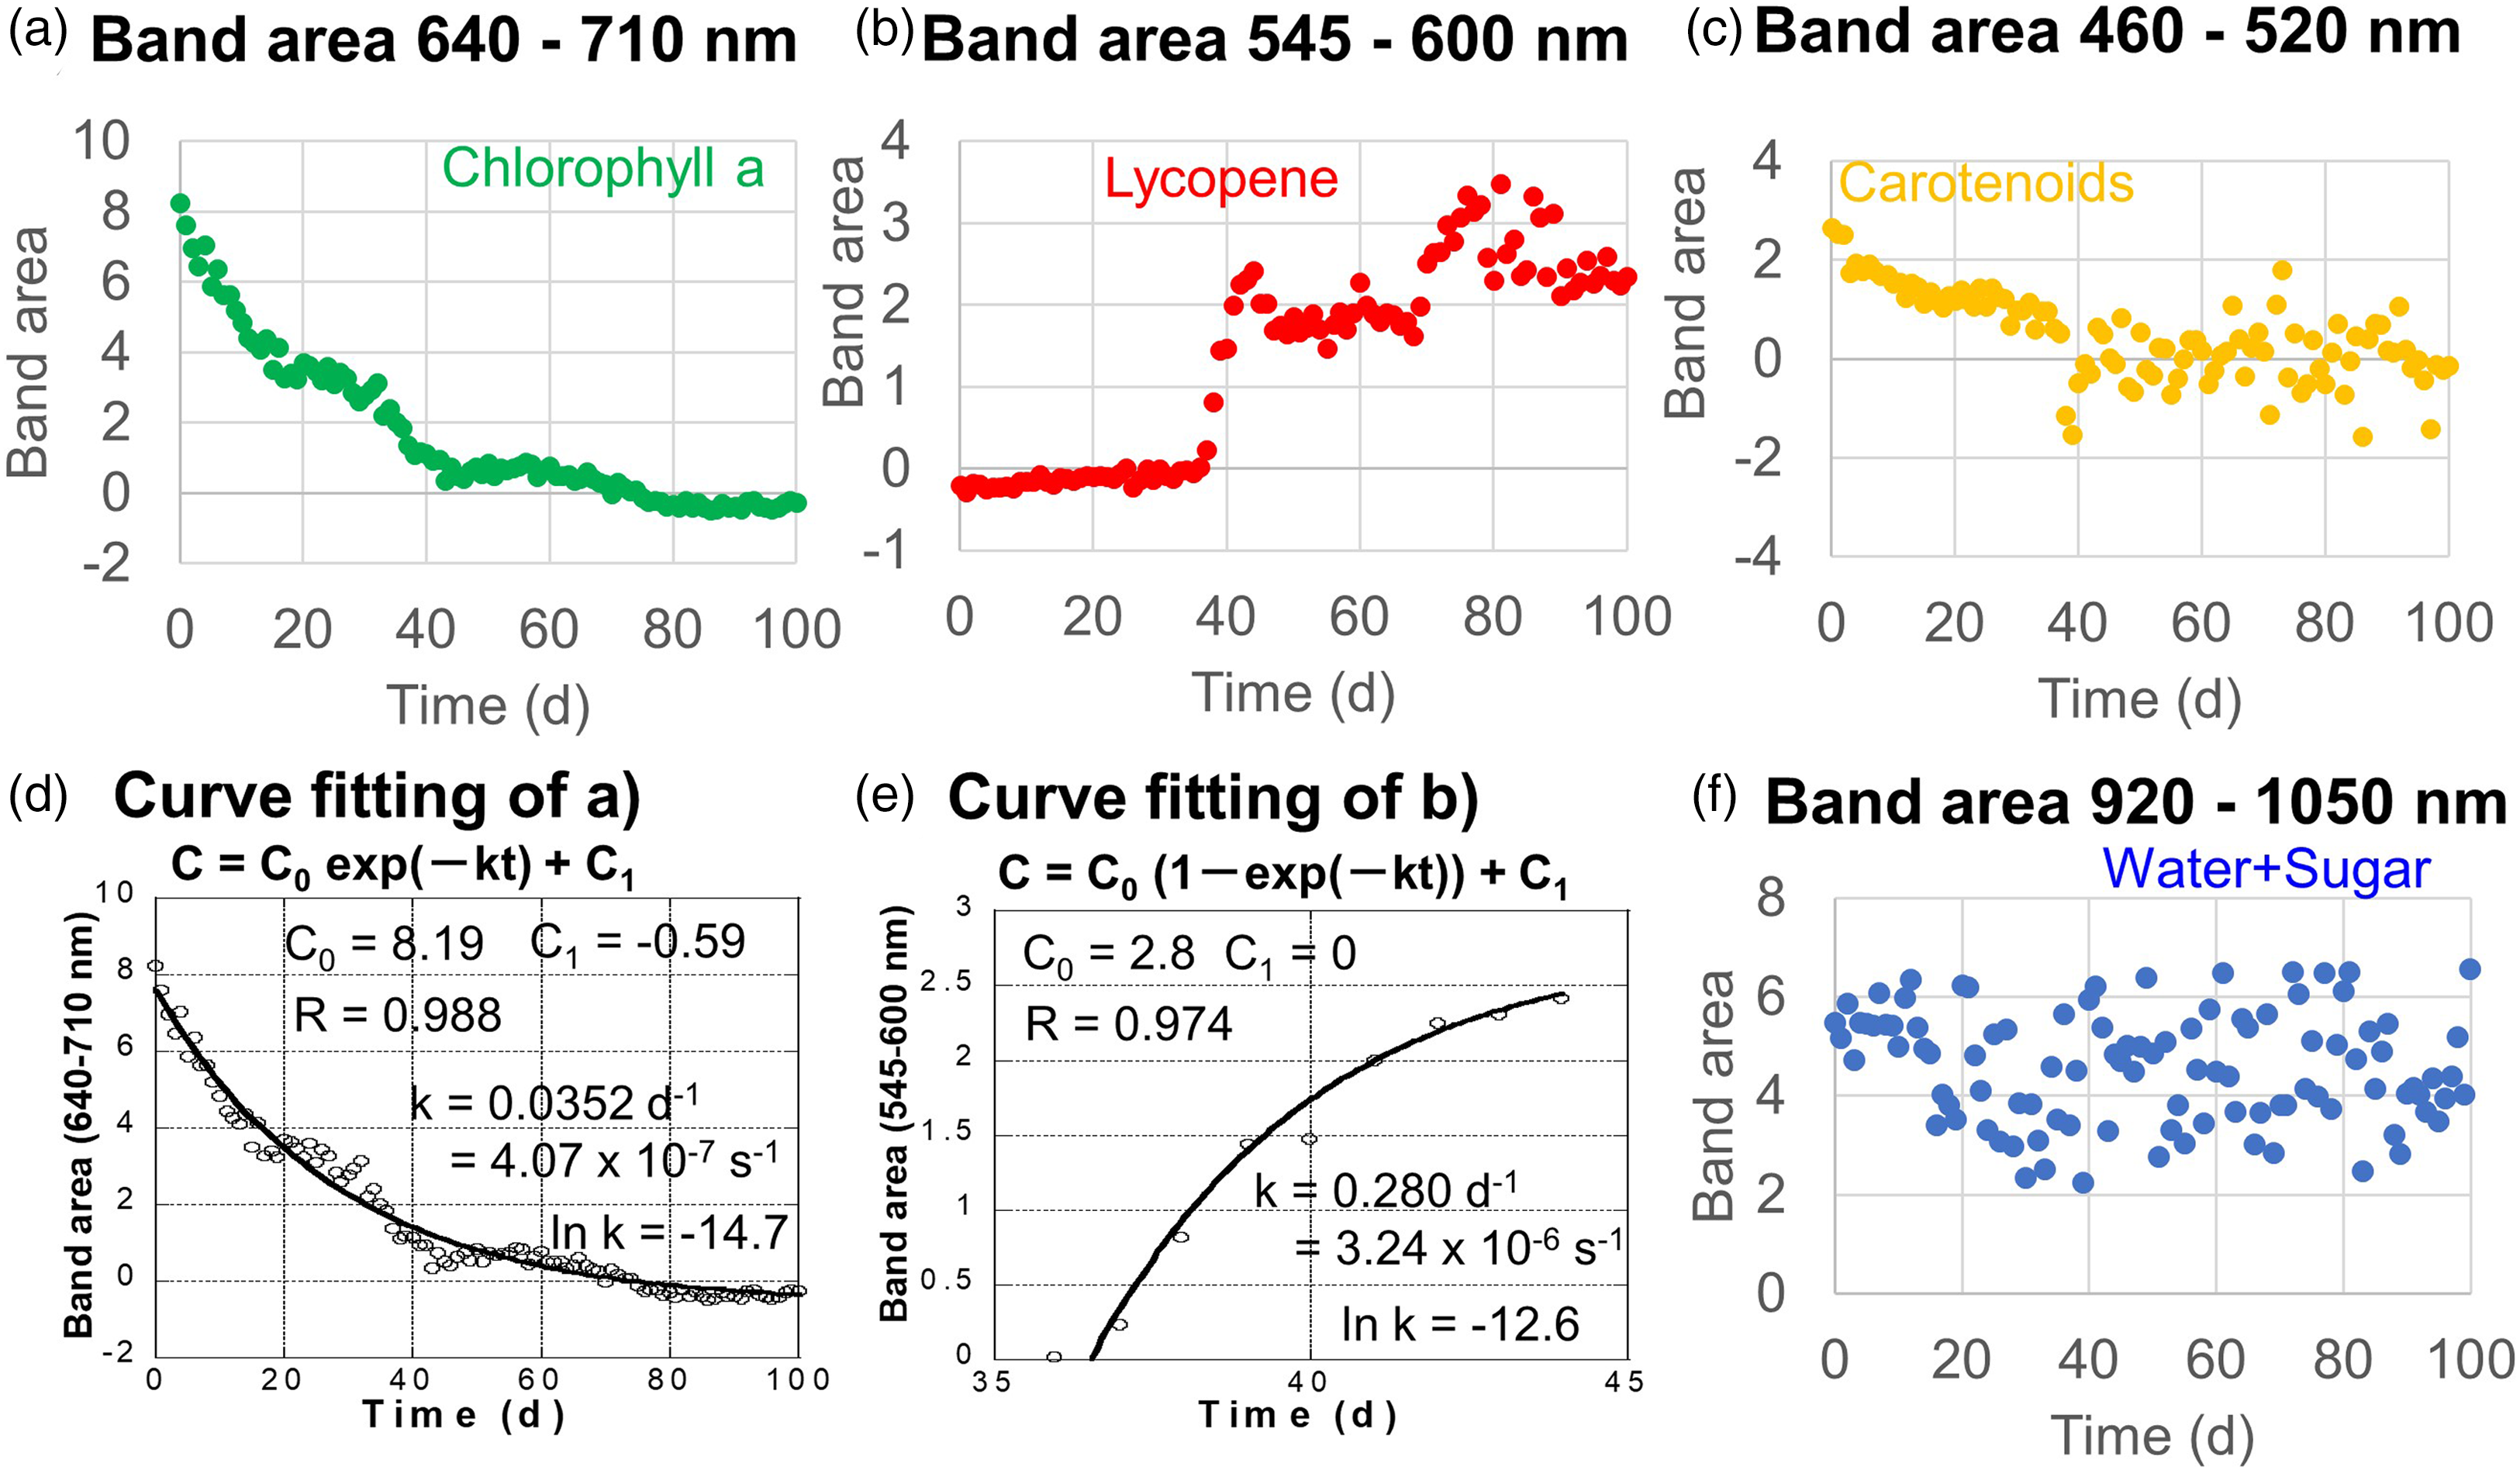
Changes with time in band areas of (a) Chl a (640–710 nm), (b) lycopene (545–600 nm), (c) carotenoids (460–520 nm), and (f) water + sugar (920–1050 nm). (d) Curve fitting of the band area changes with time of Chl a (640–710 nm) (a) by the first-order kinetic decrease for 100 days, (e) curve fitting of the band area changes with time of lycopene (545–600 nm) (b) by the first-order kinetic increase from 36 to 44 days.
The 545–600 nm band area of lycopene is almost zero at the early stage, and increased rapidly from 36 to 44 days, then decreased slightly but stayed relatively constant from 50 to 68 days. It increased and fluctuated at the final stage (Fig. 4b). These changes in the lycopene band are very similar to changes with time of a* values (green/red; Fig. 2f). Therefore, the lycopene band is considered to control the reddish color of the mini tomato; this band increased from 36 to 44 days and will be analyzed later.
The 460–520 nm band area of the carotenoid decreased quasi-exponentially during the early stage until 40 days but became fluctuated afterward (Fig. 4c).
The 920–1050 nm band due to water and sugars fluctuated throughout the period (Fig. 4f). Since water contents in tomatoes are very high around 95 wt%, this band area around 970 nm corresponds to the relatively constant water contents during the tomato ripening period. This trend is quite different from that of Brix (Fig. 2d). Therefore, even though this small band includes contributions from sugars, it cannot be used as a good indicator of sugar contents.
Chlorophyll a Decrease Rate During Mini Tomato Ripening
The decrease of the 640–710 nm band area due to Chl a appeared quasi-exponential with time throughout the measurement period (Fig. 4a). This trend was fitted by the following equation assuming the first-order reaction:

The decrease kinetics of chlorophylls have been evaluated at higher temperatures in food processing and cooking sciences.30–32 Chlorophyll synthesis and degradation rates have been evaluated for cyanobacteria (Synechocystis sp. PCC 68003) with and without photosystems I and II during its incubation at 30 °C. 33 However, the chlorophyll decrease rates in natural systems have never been quantitatively reported to the authors’ knowledge. Interestingly, the obtained chlorophyll decrease rate constant at around 26 °C of k = 4.07 × 10⁻⁷ s–1 is in the same order as that reported for the cyanobacteria with its photosystems I and II (k = 8.61 × 10⁻⁷ s–1 at 30 °C). Although further studies are required on the natural chlorophyll degradation rates in other plants including vegetables and fruits, the present study provides the first natural data.
Lycopene Increase Rate During Mini Tomato Ripening
The increase of the 640–710 nm band area due to lycopene appeared to be quasi-exponential with time for the ripening period (36–44 days; Fig. 4b). This trend was fitted by the following equation assuming the first-order reaction:

Quantitative Monitoring of the Daily Ripening Process of Mini Tomato
The ripening processes of fruits/vegetables such as tomatoes have been studied by dividing them into several stages and analyzing representative chemical components.1–4 Nondestructive Vis-NIR spectroscopy with color measurements has been conducted to evaluate the lycopene contents and soluble solid contents (Brix).5,8,9,11 However, quantitative changes of chemical components with small time intervals were lacking. Therefore, the present study provides the detailed daily changes of chlorophyll, lycopene, and carotenoids and their relations to color values. These quantitative data will be useful to decide the timing of the harvest of mini tomatoes. In fact, in the present study, the lycopene content appeared to be maximum at 44 days (Fig. 4b), two days after the maximum reddishness (a* value; Fig. 2f), and the Brix values showed a maximum of about 14 at 45 days (Fig. 2d). Therefore, the harvesting and shipping timing of mini tomato can be decided based on these daily data. The authors are applying this daily monitoring of the same samples to various fruits and vegetables including tomatoes, which will be reported in future reports. The present portable spectrometer is expected to be useful for future farmers for providing high-quality agricultural products to consumers.
Conclusion
A handheld visible and shortwave NIR spectrometer (400–1050 nm) was developed for monitoring daily changes in fruits and vegetables. This instrument was used for monitoring the ripening processes of the same position of a mini tomato sample daily for about 100 days. The following results were obtained.
The a* color value (green/red) of the mini tomato increased rapidly from 35 to 42 days, while the b* color value (yellow) first decreased and then increased from 35 to 42 days. Brix values showed a maximum at about 45 days.
Reflection spectra in the 400–1050 nm range were converted to absorption spectra and daily changes of band areas of Chl a (640–710 nm), carotenoids (460–520 nm), lycopene (545–600 nm), and water + sugar (920–1050 nm) were determined.
The band area of lycopene around 565 nm increased rapidly from 36 to 44 days associated with the increases in a* and b* values, indicating that the increase in the reddish color originated from the increase of lycopene.
The band area of Chl a around 670 nm decreased exponentially over 100 days. This Chl a decrease could be well fitted by the first-order reaction giving the rate constant k = 4.1 × 10⁻⁷ s–1 at an average temperature of 26 °C.
The quasi-exponential increase of the band area of lycopene around 565 nm from 36 to 44 days could be fitted by the first-order reaction giving the rate constant k = 3.2 × 10⁻⁶ s–1 at an average temperature of 23 °C.
The band areas for water plus sugars around 970 nm fluctuated and did not correlate with the Brix values.
The present study provides the detailed daily changes of chlorophyll and lycopene and their relations to color values. These quantitative data will be useful to decide the timing of the harvest of tomatoes. The portable spectrometer is expected to provide quantitative bases for the cultivation and harvest of fruits and vegetables.
Footnotes
Author Contributions
Satoru Nakashima contributed to conceptualization, methodology, software, validation, formal analysis, investigation, supervision, project administration, writing–original draft, writing–review, and editing. Aika Nagasawa contributed to the investigation, data curation, visualization, writing–original draft, writing–review, and editing. Kazuto Yokokura contributed to methodology, software, validation, investigation, resources, writing–review, and editing. Yasuaki Shukuin contributed to methodology, software, validation, investigation, resources, and project administration. Naoto Takeda contributed to methodology, software, validation, investigation, resources, and project administration. Kiyotaka Yamamoto contributed to methodology, software, validation, investigation, resources, and project administration.
Declaration of Conflicting Interests
The authors declared no potential conflicts of interest with respect to the research, authorship, and/or publication of this article.
Funding
The authors received no financial support for the research, authorship, and/or publication of this article.