
Abstract
Autistic individuals respond to sensory information in perceptual tasks differently than non-autistic individuals. However, it is unclear which component processes are altered, and how other aspects of neurodiversity (e.g., ADHD traits) affect these processing stages. Here, we applied diffusion models to decompose numerosity task performance into distinct processing stages, across two pre-registered studies with rigorous blinded analyses. In Study 1, we validated our approach and investigated relationships between diffusion-model parameters and autism- and ADHD-related traits in the general population (n = 130). Study 2 investigated group differences between diagnosed autistic (n = 100) and non-autistic (n = 100) adults with comparable non-verbal reasoning ability, and assessed relationships with ADHD traits. Study 1 found no relationships between diffusion-model parameters and autism and ADHD-related traits in the general population. Study 2 revealed that autistic individuals had shorter non-decision times than non-autistic individuals, reflecting less time taken for sensory encoding and/or response generation, with no group differences in sensory evidence accumulation or response caution. We also found that individuals with higher motor hyperactivity-impulsivity had lower non-decision times and that individuals with higher verbal hyperactivity-impulsivity accumulated evidence more slowly. The diffusion model, therefore, reveals the convergence and divergence of processing stages in autism and across ADHD-related traits.
Lay abstract
We know that autistic people often respond to sensory information differently than non-autistic people. However, there are multiple processing stages involved when responding to sensory information, and most previous studies do not allow us to say which of these processing stages are altered in autistic people, or how they are affected by ADHD traits, which tend to be higher in autistic people than non-autistic people. Here, autistic and non-autistic adults completed a task where they judged whether a visual display contained a ‘small’ or ‘large’ amount of dots. We used a mathematical model to break performance down into distinct processing stages. In Study 1, we looked at how these processing stages are associated with autism- and ADHD-related traits in the general population, and we found no evidence for any associations. In Study 2, we compared diagnosed autistic and non-autistic adults and investigated relationships with ADHD-related traits. We found that autistic adults had shorter non-decision times than non-autistic adults, which means that they took less time to process the stimuli and/or generate their responses. We also found that people with higher motor hyperactivity-impulsivity had lower non-decision times and that people with higher verbal hyperactivity-impulsivity accumulated sensory evidence more slowly when making their decisions. These results suggest that there are both shared and non-shared effects of autism and ADHD-related traits on processing stages.
Introduction
As reflected in the diagnostic criteria (World Health Organisation, 2019), autistic individuals often experience hyper- and/or hypo-reactivity to sensory information, which can cause significant challenges in everyday life (Robertson & Simmons, 2015). Researchers have aimed to understand how autistic people process sensory information, often by comparing the decisions they make about sensory information in perceptual tasks with those of non-autistic people. This body of research has revealed group differences across tasks, including orientation discrimination (Dickinson et al., 2016), motion discrimination (Van der Hallen et al., 2019) and visual search (Plaisted et al., 1998; Shirama et al., 2017).
Less well-studied in autism are tasks requiring judgements about numerosity: the number of elements in groups of non-symbolic items. Numerosity judgements are important for everyday decision-making, like estimating the number of food items on a plate or the number of people in a queue (Bagchi & Davis, 2016), and are causally linked to mathematical ability (He et al., 2016). Existing studies of numerosity judgements in autism have produced mixed results. Soulières et al. (2010) reported that one autistic child showed increased numerosity discrimination abilities relative to six comparison participants, while another matched comparison accuracy. Later studies have reported reduced numerosity sensitivity in autistic participants (Aagten-Murphy et al., 2015; Hiniker et al., 2016; Li et al., 2024; Wang et al., 2023) or no group differences (Meaux et al., 2014; Titeca et al., 2014, 2015, 2017).
To our knowledge, previous research into numerosity processing in autism has relied on accuracy data alone. However, by using the diffusion decision model (DDM; Ratcliff, 1978; Ratcliff & McKoon, 2008), we can jointly model accuracy and response time to explore distinct contributors to decisions about numerosity. Specifically, the DDM proposes that decisions are the result of noisy sensory information being accumulated over time until it reaches a decision bound. The DDM allows the data to be decomposed into four main parameters: drift-rate v, boundary separation a, starting point z and non-decision time ter (Figure 1). Drift-rate denotes the rate at which information is accumulated towards a boundary and reflects people's sensitivity to sensory evidence in a task (e.g., in a numerosity task, this could be sampling an array to gather evidence about the number of dots presented, to decide whether the array contains a small or large number of dots). Boundary separation represents the amount of evidence needed to make a decision and reflects a participant's speed-accuracy trade-off: wider separation yields generally slower, more accurate responses, whilst narrower boundary separation reflects a less cautious approach. The starting point denotes the initial evidence and reflects initial biases towards a specific response. Non-decision time represents the time for processes separate from the decision-making process, including sensory encoding (e.g., basic visual encoding of the dots/elements in a numerosity discrimination task), motor preparation and response execution. The DDM can therefore help us to understand whether any differences in numerosity processing between autistic and non-autistic participants arise at the level of early sensory processing, the accumulation of evidence for the different decision options, or differences in decisional strategies.
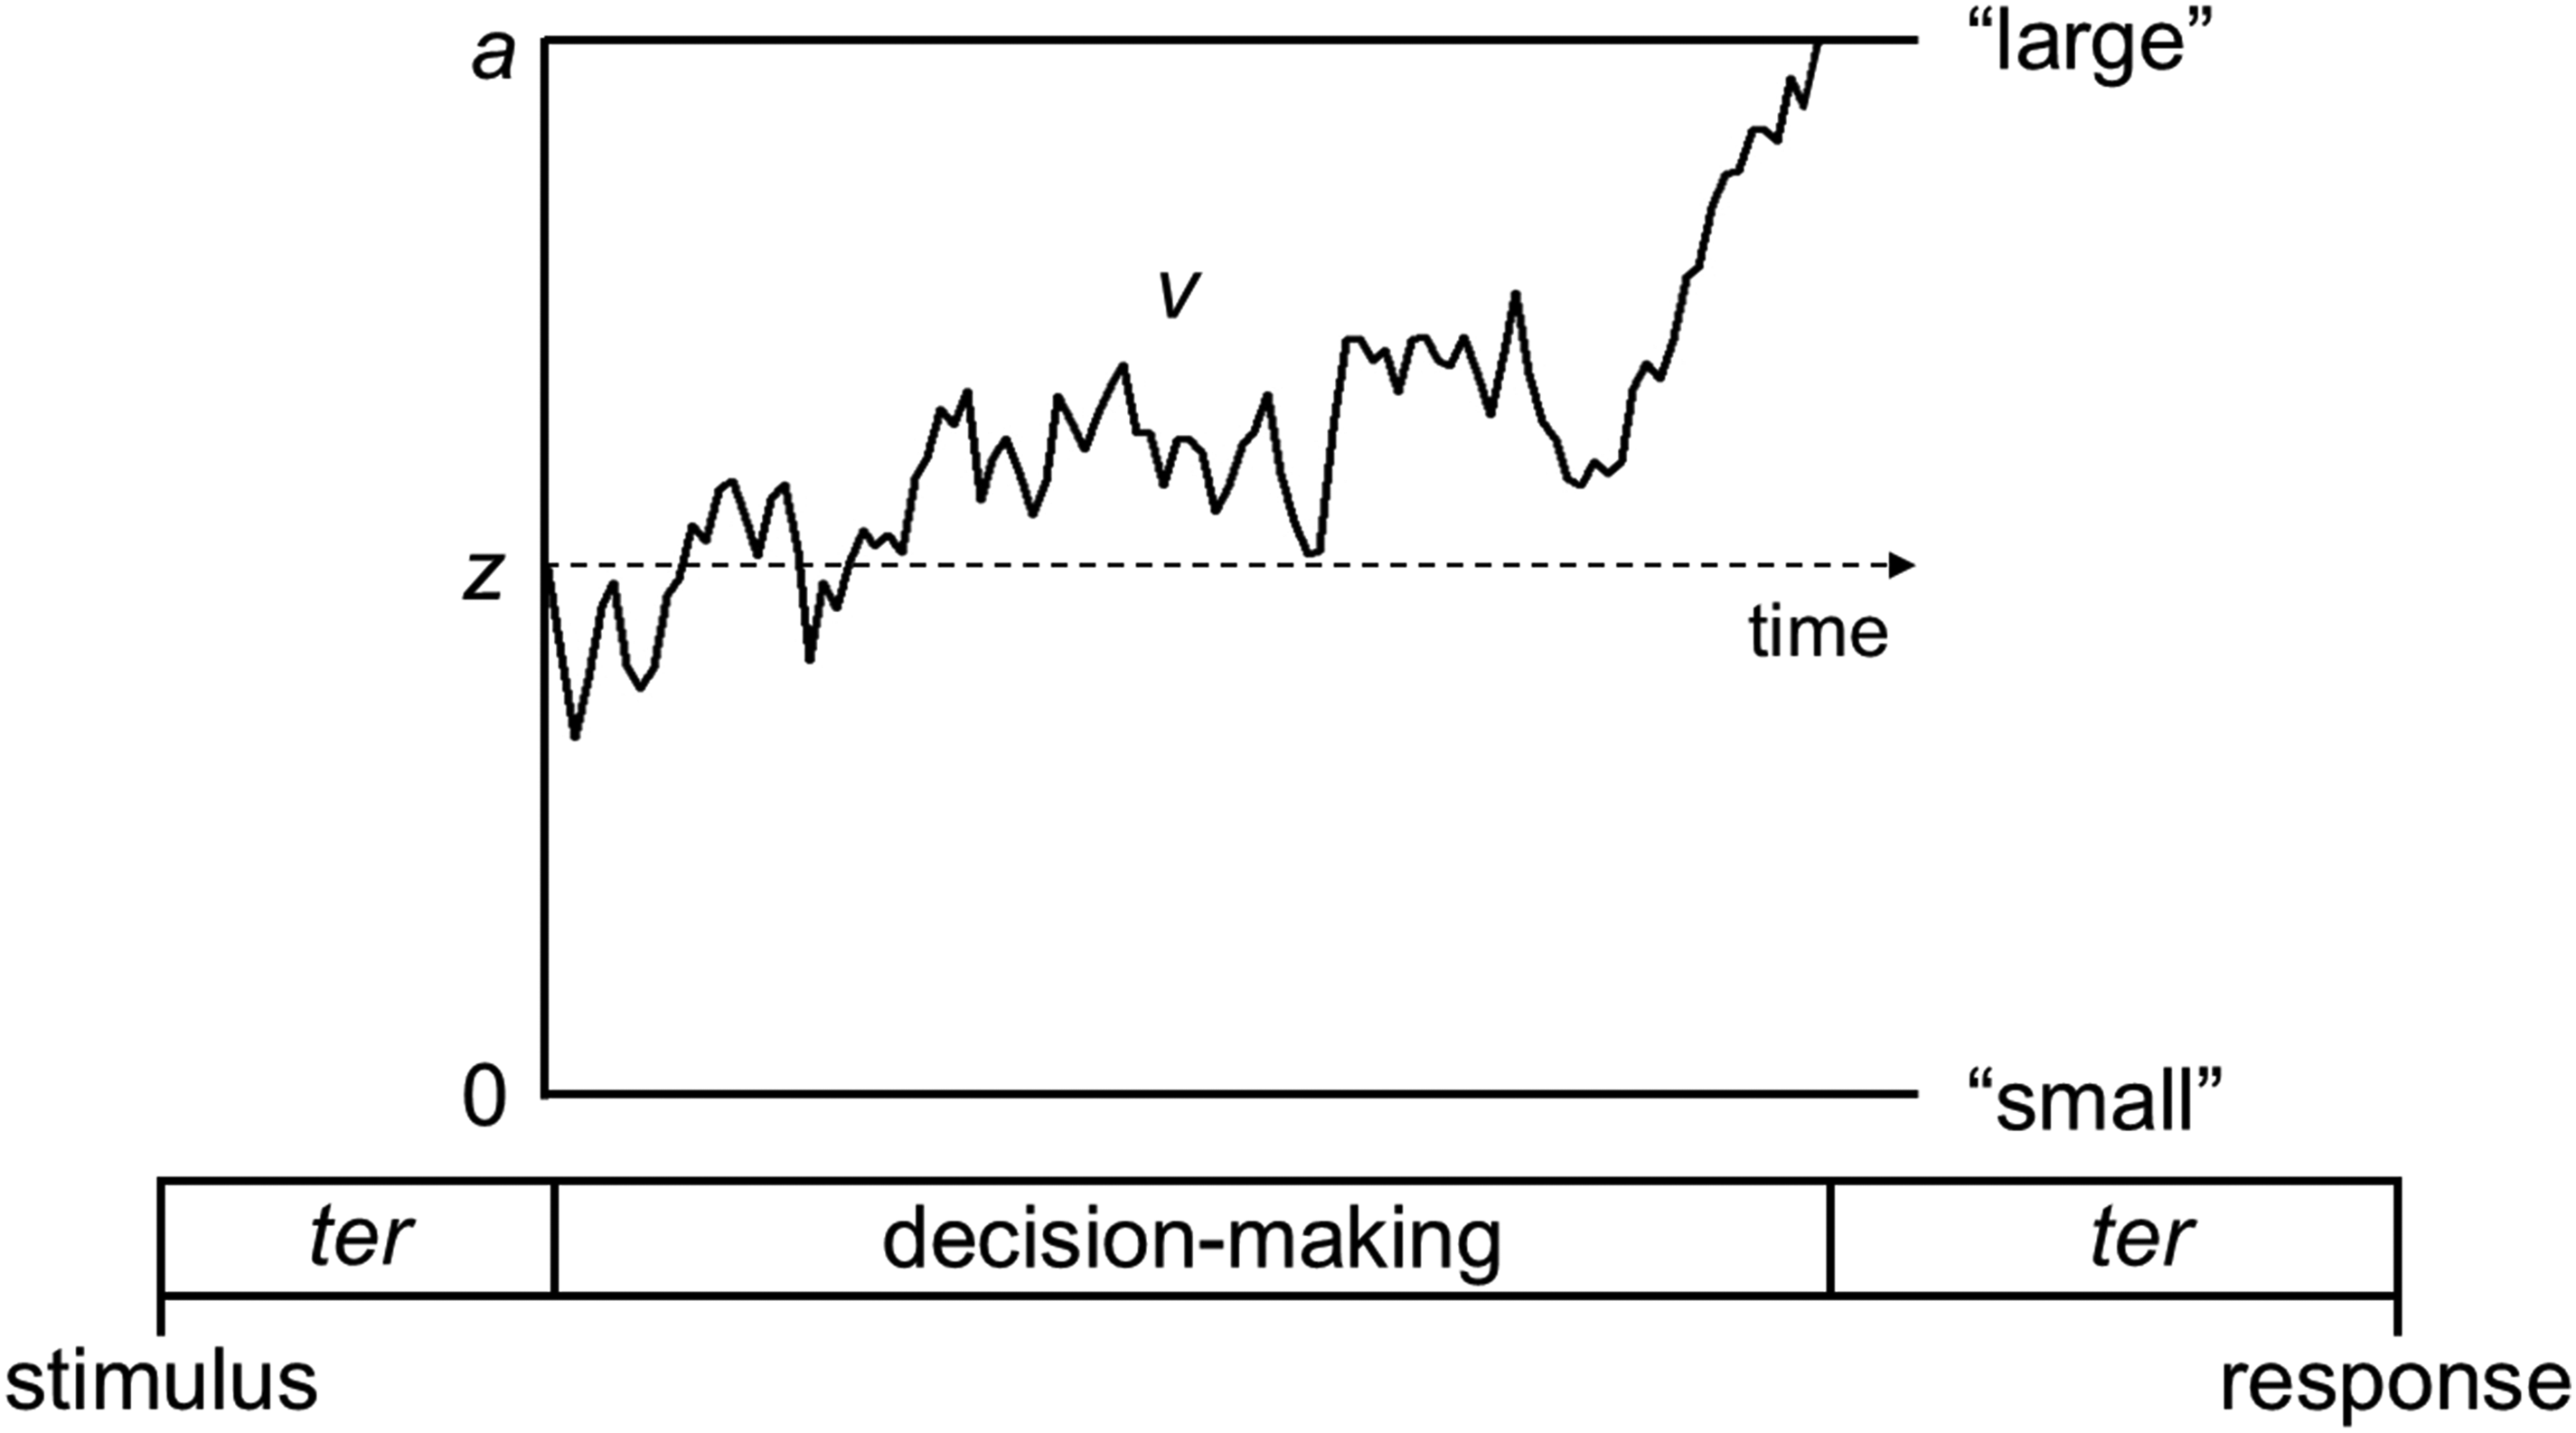
Representation of the Main Parameters in the Diffusion Decision Model. The Decision-Making Process Consists of a Noisy Accumulation of Information from the Starting Point, z, Towards One of Two Decision Boundaries. In Our Task, which Required Participants to Determine whether there are a ‘Small' or ‘Large' Number of Dots, the Boundaries would be for ‘Small' and ‘Large’. The Drift-Rate, v, Reflects the Rate of Evidence Accumulation, and Boundary Separation, a, Reflects Speed-Accuracy Trade-offs. Non-decision Time, ter, Reflects Stimulus Encoding Prior to the Decision-Making Process and Response Generation Processes Following the Decision-Making Process. Figure Reproduced from https://osf.io/ek572/ under a CC-BY 4.0 License.
Previous research applying the DDM to an orientation discrimination task reported wider boundary separation and longer non-decision times for autistic adults, but no difference in drift-rate relative to non-autistic adults (Pirrone et al., 2017). Further studies have also reported wider boundary separation in autistic people (Iuculano et al., 2020; Karalunas et al., 2018; Pirrone et al., 2020). However, DDM parameters may vary according to the task. For example, in a face processing task, autistic adolescents showed narrower boundary separation and lower drift-rates, but there were no group differences in non-decision times relative to non-autistic adolescents (Powell et al., 2019). Meanwhile, in motion processing tasks, autistic and typically developing children showed similar DDM parameters (Manning et al., 2022a). Here, we apply DDMs to autistic people's numerosity processing, for the first time, and hope to shed light on the underlying cognitive processes.
The DDM might also help us understand individual differences in numerosity processing across the general population. It has been posited that autistic traits are continuously distributed across the population, with autistic people occupying one end of the continuum (Baron-Cohen et al., 2001). Numerous studies have reported that both diagnosed autistic people and people with high levels of autistic traits perform similarly in perceptual tasks (Almeida et al., 2010; Bayliss & Kritikos, 2011; Stewart et al., 2009). Therefore, in Study 1, we investigated whether continuous measures of autism-related traits relate to DDM parameters across a non-selected sample. Pirrone et al. (2018) and Retzler et al. (2021) reported no correlations between autism-related traits and DDM parameters in non-autistic adults in orientation discrimination (n = 39) and motion coherence tasks (n = 222), respectively. However, no previous studies have assessed how DDM parameters vary with autistic traits for a numerosity task.
We also investigated the role of attention-deficit hyperactivity disorder (ADHD) traits in understanding variability across the population (Karalunas et al., 2014; Manning & Scerif, 2023). Attention-deficit hyperactivity disorder commonly co-occurs with autism, with autistic people having elevated levels of ADHD-related traits, overall (Rong et al., 2021). DDM studies have revealed reduced drift-rates in people with ADHD compared to those without ADHD (e.g., Feldman & Huang-Pollock, 2021; Karalunas & Huang-Pollock, 2013; Shapiro & Huang-Pollock, 2019; Weigard et al., 2018; Weigard & Huang-Pollock, 2014a). Evidence for group differences in boundary separation is more mixed, ranging from wider (e.g., in a flanker task, Merkt et al., 2013), to narrower boundaries (e.g., in a contextual cueing task, Weigard & Huang-Pollock, 2014b). Non-decision times have been reported to be reduced in those with ADHD (Feldman & Huang-Pollock, 2021; Karalunas & Huang-Pollock, 2013; Metin et al., 2013; Salum et al., 2014) or comparable to people without ADHD (e.g., Karalunas et al., 2012).
Therefore, Study 1 investigated whether autism- and ADHD-related traits contribute to variability in perceptual decision-making in a numerosity task in the general population, whilst validating our approach. Study 2 applied this approach to diagnosed autistic and non-autistic participants, to test for group differences in DDM parameters, whilst investigating whether ADHD traits correlate with variability. Previous work, albeit with a different task, showed that the DDM can reveal overlapping and distinct effects of autism and ADHD on decision-making (Karalunas et al., 2018), so we reasoned it may also help uncover how different aspects of neurodiversity are related to the cognitive processes underlying numerosity processing.
Study 1: General Population
Our pre-registered hypotheses were:
Higher autism-related traits would correlate with wider boundary separation (following Iuculano et al., 2020; Karalunas et al., 2018; Pirrone et al., 2017). Autism-related traits would correlate with increased or reduced drift-rates, following reports of increased (Soulières et al., 2010) and reduced (Aagten-Murphy et al., 2015) numerosity sensitivity in autism. Non-decision times would correlate with autism-related traits, following reports of longer non-decision times in autism (Pirrone et al. 2017, but c.f. Karalunas et al., 2018; Pirrone et al., 2020). Higher ADHD-related traits would correlate with lower drift-rates, following work in ADHD (Karalunas et al., 2012; Weigard & Huang-Pollock, 2014b). ADHD-related traits would correlate with boundary separation, following work showing wider (Merkt et al., 2013) or narrower (Weigard & Huang-Pollock, 2014b) boundaries in ADHD. Higher ADHD-related traits would correlate with shorter non-decision times, following studies showing faster non-decision times in ADHD (Karalunas & Huang-Pollock, 2013; Metin et al., 2013; Salum et al., 2014).
Separate pre-registrations were created for the hypotheses relating to autism-related (https://osf.io/d2e83) and ADHD-related (https://osf.io/b8s32) traits, as these formed separate undergraduate projects, although they were tested using the same dataset.
Methods
Participants
Our pre-registered sample size was 130, following resource limitations. We recruited 18- to 40-year-olds, with self-reported normal or corrected-to-normal vision and fluent English via Prolific (https://www.prolific.co/), using a Prolific approval rating filter (80–100%). We included participants diagnosed with autism, ADHD, or any other condition, to maximise the range of scores on our autism and ADHD measures. We recruited 140 participants and removed 10 from analysis following our pre-registered criteria (Supplementary Materials).
The remaining 130 participants (62 female, 67 male, 1 non-binary) were aged 18–40 years (M = 27.36 years, SD = 6.12 years), with 121 being right-handed. Eighteen participants reported one or more clinical diagnoses (autism: n = 8; ADHD: n = 5; other: n = 12). Autism Quotient (AQ; Baron-Cohen et al., 2001) total scores ranged from 5 to 46 (M = 20.64, SD = 8.84) and Adult ADHD Self-Report Scale (ASRS v1.1; Kessler et al., 2005) total scores ranged from 1 to 65 (M = 29.29, SD = 11.72). Participants gave informed consent. Ethical approval was granted by University of Oxford Medical Sciences Inter-Divisional Research Ethics Committee [R70528/RE001; R70529/RE001].
Measures
Autism Quotient
The 50-item AQ is rated on a 4-point scale from ‘definitely agree’ to ‘definitely disagree’. It has good reliability and consistency (Baron-Cohen et al., 2001) and is widely used to measure continuous variation in the population (Ruzich et al., 2015). Dichotomous scoring was used, with higher scores indicating more autism-related traits (maximum = 50). We used total AQ scores as we had no hypotheses regarding subscales.
Adult ADHD Self-Report Scale
The ASRS v1.1 includes 18 questions, rated on a 5-point scale, from ‘never’ to ‘very often’. The ASRS v1.1 has favourable psychometric properties (Kessler et al., 2005) and has been used to measure continuous variation in ADHD traits across the population (Albesisi & Overton, 2023; Barneron et al., 2024). Our pre-registered analysis was based on total scores (maximum = 72). However, Manning et al. (2022a) have since reported a negative relationship specifically between drift-rate and hyperactivity/impulsivity symptoms in autistic children. We therefore conducted additional analyses using subscales. We calculated three subscale scores, following Stanton et al.'s (2018) factor structure: (a) Inattentive, (b) Motor Hyperactive/Impulsive and (c) Verbal Hyperactive/Impulsive (see Supplementary Materials).
Numerosity Discrimination task
The numerosity task was based on Ratcliff et al. (2012). Stimuli were white and black dots (50:50 ratio) against a mid-grey background in a 7° × 7° square presented centrally. Dots were positioned according to a 10 × 10 grid. Each stimulus contained between 31 and 70 dots in randomly selected positions on the grid (Figure 2).

(a) Example Stimuli from the ‘Small' (31-50 Dots) and ‘Large' (51-70 Dots) Categories. (b) Schematic Representation of Trial Structure for Two Trials, Showing Feedback Following a Correct Response (Green Tick) and Feedback Following an Incorrect Response (Red Cross). The Stimulus was Presented on the Screen Until the Participant Made a Response (‘z' Keypress for Small, and ‘/' Keypress for Large), at which Point Visual Feedback was Presented Below the Stimulus for 500 ms. The Correct Response for Both Trials Shown is ‘Small', but the First Trial is Easier because it is Further Away from the Boundary between ‘Small' and ‘Large’.
Participants were told they would determine whether each bag of ‘chocolates’ displayed on screen contained a ‘small’ or ‘large’ amount of ‘chocolate’. Correct responses for arrays containing 31–50 and 51–70 dots were ‘small’ and ‘large’, respectively, but participants were not told this. Participants were initially shown examples of small (31 dots) and large (70 dots) arrays. Participants were instructed to press the ‘z’ key with their left index finger for ‘small’ and the ‘/’ key with their right index finger for ‘large’. Each stimulus was presented until the participant's response. Visual feedback was then presented below the array for 500 ms, to aid calibration of the small-large dimension before proceeding to the next trial. Text reminders of the required responses (‘small (z)’ and ‘large (/)’) remained on screen during trials.
Participants were asked not to count the dots on each trial, and were told that the configuration of dots and colours was irrelevant. Participants were instructed to guess if unsure, respond as quickly and accurately as possible and keep their index fingers over the appropriate keys. Participants completed 40 practice trials, followed by 10 experimental blocks of 40 trials (i.e., 400 experimental trials). Within each block, the number of dots on a given trial was selected randomly without replacement from 31 to 70. A novel stimulus set was used for each block, meaning no two arrays comprising the same dot number had the same configuration of dots. All participants saw the same stimuli, but in randomised orders. After each block, participants were encouraged to take a rest and shown their progress through the blocks. Task materials are shared here: https://app.gorilla.sc/openmaterials/210654.
Procedure
Data were collected online using Gorilla.sc (Anwyl-Irvine et al., 2020), on Google Chrome (Anwyl-Irvine et al., 2021). Participants first completed demographics questions. Before starting the task, participants were instructed to maximise their browser window, minimise distractions and stay as still as possible, maintaining the same distance from the screen throughout the task. Participants then completed a bot check before calibrating the sizes displayed on their monitors in visual angles using a bank card and their estimated viewing distance (the default was 50 cm; Anwyl-Irvine et al., 2020). Participants then completed the numerosity task, followed by the AQ and ASRS in a counterbalanced order. The whole session took ∼30 min. Participants received £5.
Analysis
We fitted Bayesian, hierarchical DDMs to response time and accuracy data from the numerosity task (Vandekerckhove et al., 2011). Our pre-registered plan (https://osf.io/d2e83; https://osf.io/b8s32) was to investigate relationships between DDM parameters and AQ/ASRS scores using a plausible values approach (Ly et al., 2017) to make the analysis feasible within undergraduate projects. However, for the publication, we exploited recent advances in joint modelling of behavioural data and questionnaire measures (e.g., Manning et al., 2022a), which allows for the direct estimation of the relationships of interest as part of the hierarchical model, rather than requiring ad-hoc estimation. While this deviates from our pre-registration, we used a blind-modelling approach (Dutilh et al., 2017) to ensure that modelling decisions were not biased by our hypotheses (see Supplementary Materials).
In addition to our pre-registered exclusions, one participant was excluded at the blind modelling stage as they did not reach 80% accuracy in the easiest trials (when there were 31–40 or 61–70 dots). Trials with RTs <300 ms or >3000 ms were removed (1.43% of trials). Our main model estimated five participant-level parameters (v.mean, a, ter, v.diff, z), with v.diff reflecting the relationship between drift-rate and difficulty (how close the number of stimulus dots was to the boundary between ‘small’ and ‘large’). Specifically, every number of dots was given its own drift rate, with v.diff reflecting the linear relationship between number of dots and drift rate. Within each model, an ADHD or ASRS score was covaried with v.mean, a and ter, with hyper-parameters for each correlation. To establish the robustness of our results, we also ran variants of the model which (a) estimated between-trial variability in drift-rate, (b) included a uniform contaminant process, (c) allowed for drift criterion bias (i.e., drift-rate can vary for ‘small’ and ‘large’ trials) and (d) estimated separate drift-rates for harder trials (41–60 dots) and easier trials (31–40 or 61–70 dots). See Supplementary Materials for further modelling details.
We report Bayes factors (BF) calculated using the Savage–Dickey ratio for each correlation between questionnaire measures and DDM parameters. BF > 1 reflects more evidence for the alternative hypothesis of group differences compared to the null hypothesis, whereas BF < 1 reflects more evidence for the null hypothesis than the alternative hypothesis. We interpret BF above 3 or below 1/3 to reflect at least moderate evidence for the alternative or null hypothesis, respectively (Jeffreys, 1961; Lee & Wagenmakers, 2014). Conversely, we interpret BF between 1/3 and 3 to represent weak, inconclusive evidence. Deidentified data, modelling code and fit statistics are available at https://osf.io/ek572/ (see also Supplementary Figures 1 to 2).
Results
Descriptive Statistics, Accuracy and RT
As expected, easy trials were associated with higher accuracy (M = .95, SD = .04) than difficult trials (M = .74, SD = .05), and shorter response times (M = 0.60 s, SD = .07 s) than difficult trials (M = 0.70 s, SD = .13 s; Figure 3). Neither mean accuracy nor median response times in easy and hard trials were correlated with AQ or ASRS scores (correlations with default priors in JASP 0.19.1 [JASP Team, 2024, BF < .46).

Beeswarm Plots Showing Individual Participants' Accuracy (Left) and Median RT (in Seconds; Right) for Easy Trials (31–40 or 61–70 Dots) and Difficult Trials (41–60 Dots). Diamonds Represent the Group Mean.
Diffusion Modelling: Relationships with AQ
In our basic model, there was conclusive evidence for the null hypothesis, with no correlations between AQ and mean drift-rate (posterior mean correlation [PMC] = −.02, 95% credible intervals [CI] = [−.20, .16], BF = 0.13), boundary separation (PMC = −.02, 95%CI = [−.19, .15], BF = 0.12) and non-decision time (PMC = .00, 95%CI = [−.17, .18], BF = 0.11). The same conclusion was reached for model variants which estimated between-trial variability in drift-rate, allowed for drift criterion bias, included a contaminant process and estimated a separate drift-rate for easy/hard trials (Supplementary Table 1).
Diffusion Modelling: Relationships with ASRS
There was conclusive evidence for the null hypothesis in our basic model, showing no correlations between ASRS and mean drift-rate (PMC = −.02, 95%CI = [−.20, .16], BF = .12), boundary separation (PMC = .03, 95%CI = [−.15, .20], BF = .12) and non-decision time (PMC = −.03, 95%CI = [−.20, .15], BF = 0.12). The same conclusion was reached for all additional model variants (Supplementary Table 2).
Following research published after our pre-registration (Manning et al., 2022a), we used the basic model to test for relationships between DDM parameters and ASRS subscales. For inattentiveness, there was conclusive evidence in support of the null hypothesis, demonstrating a lack of correlations between inattentiveness and drift-rate (PMC = −.02, 95%CI = [−.19, .16], BF = .11), boundary separation (PMC = −.04, 95%CI = [−.21, .14], BF = .12) and non-decision time (PMC = −.01, 95%CI = [−.18, .16], BF = .11). Similarly, no correlations were found between motor hyperactivity/impulsivity and drift-rate (PMC = .10, 95%CI = [−.09, .27], BF = .20), boundary separation (PMC = .06, 95%CI = [−.12, .23], BF = .14) and non-decision time (PMC = .06, 95%CI = [−.11, .23], BF = .14), with conclusive evidence for the null hypothesis in all cases. The evidence for a correlation between verbal hyperactivity/impulsivity and drift-rate fell within the inconclusive range, but with relatively more evidence for the null hypothesis (PMC = −.14, 95%CI = [−.31, .04], BF = .37). Inconclusive evidence for the null hypothesis was also found for the relationship between verbal hyperactivity/impulsivity and non-decision time (PMC = −.15, 95%CI = [−.31, .03], BF = .47]). Meanwhile, there was conclusive evidence in support of the null hypothesis for the correlation between verbal hyperactivity/impulsivity and boundary separation (PMC = .11, 95%CI = [−.06, .28], BF = .24).
Summary
Contrary to our hypotheses, DDM parameters were not correlated with autism- and ADHD-related total scores in our general population sample, with between 5 and 9 times more evidence for the null hypothesis than the alternative hypothesis. For most relationships between ADHD subscales and DDM parameters, there was conclusive evidence for the null hypothesis, while the evidence was inconclusive for the relationship between verbal hyperactivity/impulsivity and drift-rate/non-decision time, with a slight negative correlation, but with relatively more evidence for the null hypothesis.
Study 2: Autistic and Non-autistic Groups
Here, we investigated whether Study 1's findings generalise to diagnosed autistic adults, who will have generally higher levels of both autism- and ADHD-related traits. We presented the same paradigm to assess differences between autistic and non-autistic groups and assessed relationships between DDM parameters and ADHD-related traits.
Pre-registered Hypotheses.
Our pre-registered hypotheses (https://osf.io/bzevy/) were:
Autistic adults will show wider boundary separation than non-autistic adults (e.g., Pirrone et al., 2017). Autistic adults will show either lower or higher drift-rates than non-autistic adults (reflecting work showing reduced or increased numerosity discrimination performance: Aagten-Murphy et al., 2015; Soulières et al., 2010). There will be no group differences in non-decision time. This hypothesis diverged from Study 1, reflecting more recent work (e.g., Karalunas et al., 2018; Manning et al., 2022a; Pirrone et al., 2020). ADHD-related traits, and specifically hyperactivity/impulsivity traits, will negatively relate to drift-rate (Manning et al., 2022a). ADHD-related traits will be positively or negatively associated to boundary separation, based on previous work showing wider (Merkt et al., 2013) or narrower (Weigard & Huang-Pollock, 2014a) boundary separation in ADHD. ADHD-related traits will be negatively associated with non-decision times, reflecting previous work (Karalunas & Huang-Pollock, 2013; Metin et al., 2013; Salum et al., 2014).
Participants
Our pre-registered sample size was 100 participants per group. While there is no commonly accepted way of conducting power analyses for Bayesian hierarchical DDMs, this sample size was based on previous pre-registered studies with similar analysis methods (Manning et al., 2022a, 2022b) and exceeds previous samples (Pirrone et al., 2017, 2020).
We recruited an autistic and non-autistic group using Prolific filters. Participants could not have participated in Study 1. In addition to Study 1's exclusion criteria, we excluded those with low reasoning ability (<4 on The Matrix Reasoning Item Bank 12-item short form 1 [MaRs-IB SF-1; Zorowitz et al., 2024], indicating performance that is not above chance). We also excluded participants in the non-autistic group if they reported a clinical diagnosis of ADHD or any other neurological, developmental or psychiatric conditions or showed high levels of autism-related traits (AQ ≥ 26; Woodbury-Smith et al., 2005).
We recruited 135 autistic and 158 non-autistic participants, making exclusions as pre-registered (Supplementary Materials). Additionally, we excluded one participant in the non-autistic group who reported a diagnosis of autism, ADHD, or another condition, and four participants in the autistic group due to reporting no autism diagnosis. We did not foresee that participant responses may not correspond to Prolific filters, so we had not pre-registered this as a criterion. We also removed one participant in each group due to multiple attempts on items of the MaRs-IB, perhaps due to internet connection issues, obfuscating the interpretation of responses. We oversampled five autistic participants, who were also excluded, leaving 100 participants in each group, in line with our pre-registration. As expected, mean AQ and ASRS scores were higher for autistic than non-autistic participants (Table 1). Non-verbal reasoning ability was similar across groups. Fifty-nine autistic participants reported a clinical diagnosis of ADHD (n = 32) and/or another condition (n = 41). Participants gave informed consent. Ethical approval was provided by the University of Reading's School of Psychology and Clinical Language Sciences Ethics Committee (2023-151-CM).
Demographics of Autistic and Non-autistic Participants in Study 2.

AQ: autism quotient; ASRS: Adult ADHD Self-Report Scale.
Data are presented as M (SD) range, apart from Gender and Hand dominance which represent frequencies.
Procedure
The same procedure was used as in Study 1, with the MaRs-IB SF-1 (Zorowitz et al., 2024) appended to compare non-verbal reasoning ability across groups (Supplementary Materials). Participants received £9.
Analysis
We followed the same blind modelling process as in Study 1. One participant from each group was excluded at the blind modelling stage as they attained <80% accuracy in the easiest trials. Trials with RTs <300 ms or >3000 ms were removed (.95% of trials). The DDM parameterisation was the same as Study 1, though we estimated the difference between groups in each parameter by adding a hyper-parameter for this difference (δ). For joint models investigating relationships with ADHD traits, we estimated two variants: one that estimated the correlations constrained across groups, and one that allowed for different correlations between groups. Fit statistics are summarised in Supplementary Materials (see also https://osf.io/ek572/, including de-identified data and materials).
Results
The accuracy and RT distributions in the task were relatively similar across groups (see Figure 4; accuracy M(SD): non-autistic, easy = .96(.04); autistic, easy = .95(.04); non-autistic, difficult = .75(.05); autistic, difficult = .74 (.05); median RT (s): non-autistic, easy = .61(.11); autistic, easy = .59(.09); non-autistic, difficult = .70(.16), autistic, difficult = .67(.13)). Bayesian mixed analysis of variances conducted in JASP with default priors showed relatively more evidence for no group differences than for group differences in accuracy and median RT, although all BF were in the inconclusive range. Specifically, the BF for including group in the model (BFincl) was 0.73 for accuracy and 0.73 for median RT. The BF for including interactions between group and difficulty level (easy, hard) were 1.13 for accuracy and 0.50 for median RT.

Beeswarm Plots Showing the Individual Data Points for Non-autistic (Grey) and Autistic (Orange) Participants' Accuracy (Left) and Median RT (in Seconds; Right) for Easy Trials (31–40 or 61–70 Dots) and Difficult Trials (41–60 Dots). Diamonds Represent the Group Mean.
Diffusion Modelling: Group Differences
We hypothesised that autistic participants would have wider boundary separation, but here there was relatively more evidence for the null hypothesis (BF = 0.41), although this evidence was weak (Figure 5). We also expected group differences in drift-rate. Drift-rates were slightly reduced in the autistic group, but the BF's proximity to 1 (BF = 0.97) shows that this was inconclusive. Contrary to our hypotheses, we found moderate evidence for group differences in non-decision time, with autistic participants having shorter non-decision times than non-autistic participants (BF = 3.46, population effect size mean = −.21, 95%CI = [−.44, .02]). This pattern was robust over additional model variants (Supplementary Table 3).

Prior and Posterior Density Distributions for Group Differences. Prior (Blue) and Posterior (Purple) Density Distributions for Group-Level Parameters Reflecting Group Differences Relating to Each of Our Hypotheses (v.mean=Mean Drift-Rate Across Difficulty Levels; a =Boundary Separation; ter =Non-decision Time). Negative Values on the x-axis Reflect Lower Parameter Values in the Autistic Group Compared to the Non-autistic Group. BF=Savage-Dickey Bayes Factors in Favour of the Alternative Hypothesis Over the Null Hypothesis, where BF > 1 Reflects More Support for the Alternative Hypothesis
Diffusion Modelling: Relationships with ASRS
Next, we investigated relationships between ASRS subscales and DDM parameters within joint models that estimated single correlations across all participants (see Figure 6). Inattentiveness was not clearly related to any DDM parameter (drift-rate: PMC = −.16, 95%CI = [−.29, −.02], BF = .94; boundary separation: PMC = −.06, 95%CI = [−.20, .08], BF = .13; non-decision time: PMC = −.17, 95%CI = [−.30, −.03], BF = 1.52) in our basic model. These results were consistent in most other model variants (Supplementary Table 4). However, when drift-rate variability was modelled, there was a negative relationship between inattentiveness and drift-rate (posterior correlation = −.21, 95%CI = [−.35, −.07], BF = 5.19), but not between inattentiveness and boundary separation or non-decision time.
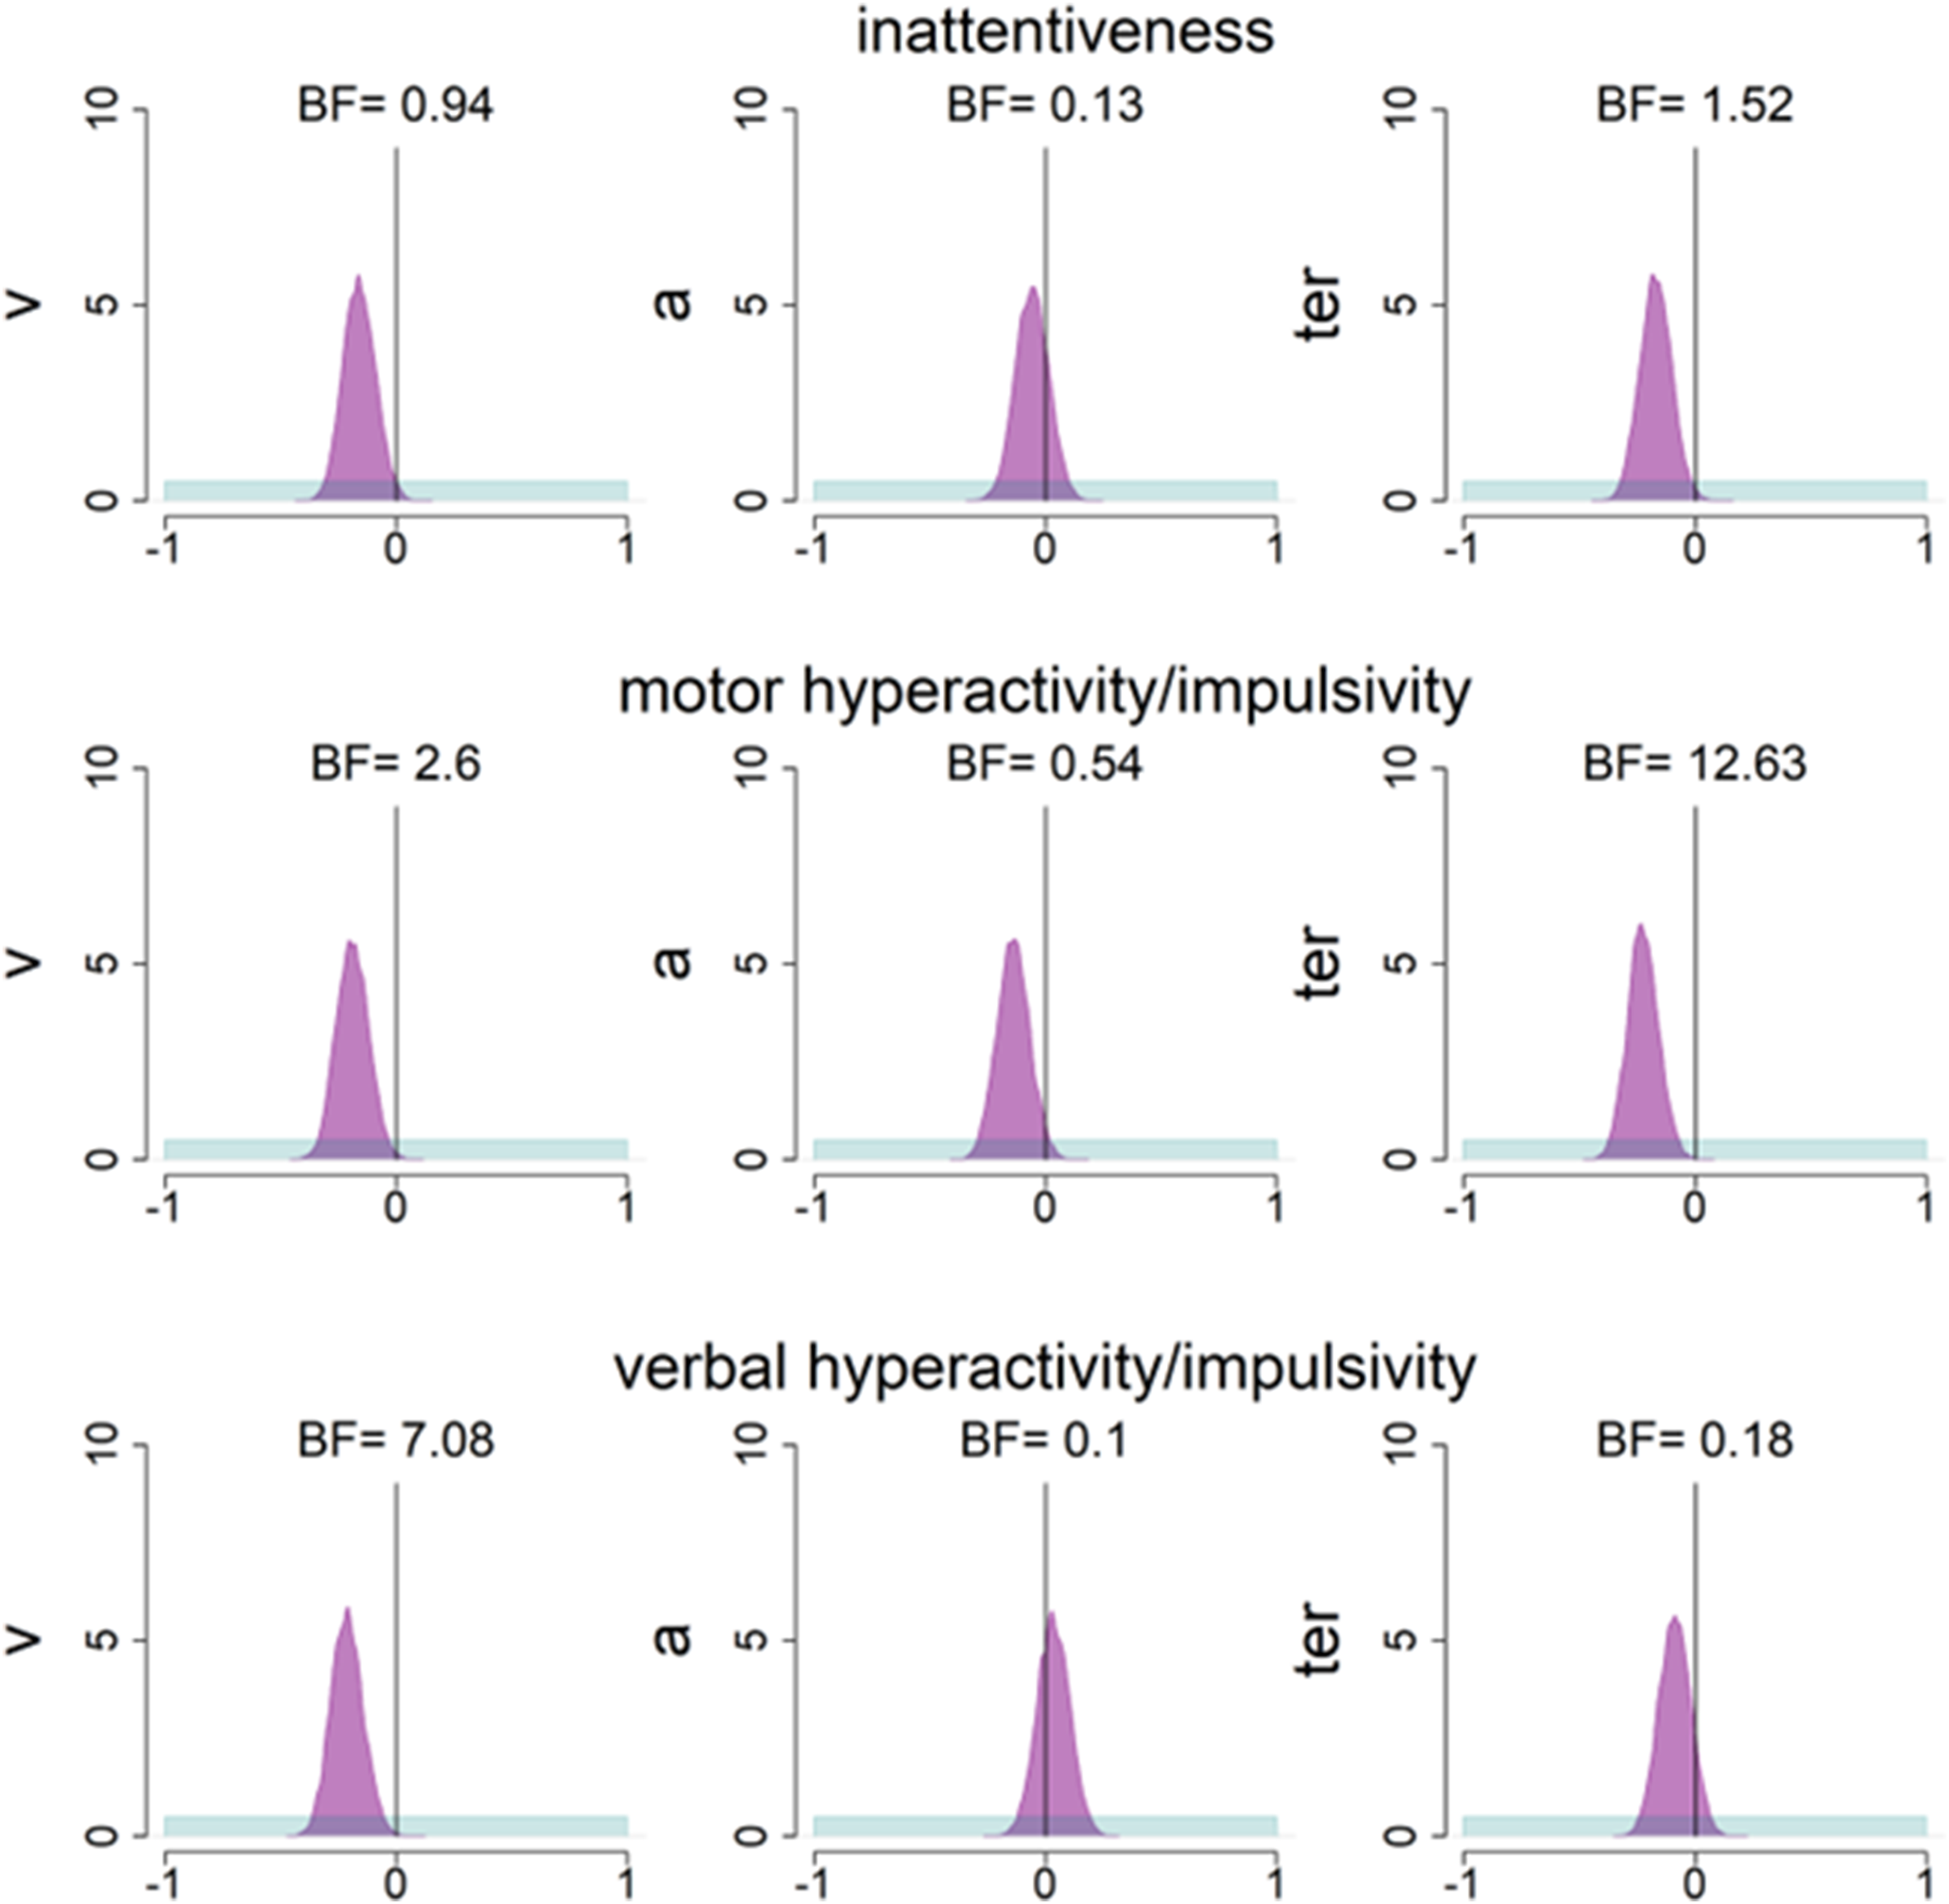
Prior and Posterior Density Distributions for Correlations Between Diffusion Decision Model (DDM) Parameters and Attention-Deficit Hyperactivity Disorder (ADHD) Subscales. Prior (Blue) and Posterior (Purple) Density Distributions for the Correlation Between DDM Parameters and Adult ADHD Self-Report Scale (ASRS) Subscales Across the Whole Sample in Study 2. BF=Savage-Dickey Bayes Factors in Favour of the Alternative Hypothesis Over the Null Hypothesis, where BF > 1 Reflects More Support for the Alternative Hypothesis.
In the basic model, there was strong evidence for a negative relationship between motor hyperactivity/impulsivity and non-decision time (PMC = −.22, 95%CI = [−.35, −.09], BF = 12.63), but inconclusive evidence for relationships with drift-rate (PMC = −.19, 95%CI = [−.32, −.05], BF = 2.60) and boundary separation (PMC = −.14, 95%CI = [−.28, .00], BF = 0.54). The negative relationship between motor hyperactivity/impulsivity and non-decision time, and inconclusive evidence for a relationship between motor hyperactivity/impulsivity and boundary separation, was robust across all additional model variants. However there was additionally moderate to strong evidence for a negative relationship between drift-rate and motor hyperactivity/impulsivity in models which estimated between-trial variability in drift-rate (PMC = −.20, 95%CI = [−.34, −.06], BF = 4.71) and included a contaminant process (PMC = −.22, 95%CI = [−.35, −.08], BF = 11.61).
There was evidence for a negative relationship between verbal hyperactivity/impulsivity and drift-rate (PMC = −.21, 95%CI = [−.34, −.07], BF = 7.08) in the basic model, with evidence for the null hypothesis for correlations between verbal hyperactivity/impulsivity and boundary separation (PMC = .03, 95%CI = [−.11, .17], BF = .10) and non-decision time (PMC = −.09, 95%CI = [−.22, .05], BF = 0.18). This pattern of results was robust across additional model variants (Supplementary Table 4).
Next, we ran joint models where we estimated separate correlation coefficients for each group. The aim was to test for the presence of correlations in each group. The posterior mean correlations and BF for each combination of subscale score and DDM parameter for each group are presented in Supplementary Table 5. We found that posterior distributions of correlation estimates were more peaked in the autistic group than the non-autistic group, reflected in narrower credible intervals. The only correlation for which there was conclusive evidence was that between non-decision time and motor hyperactivity/impulsivity in the autistic group (BF = 13.89 vs. .36 in the non-autistic group). However, there was no evidence of a difference between these correlations in the two groups (BF = .22). The relationship between verbal hyperactivity/impulsivity and drift-rate identified above was inconclusive in each group separately, but with relatively more evidence for a correlation in the autistic group (BF = 1.70 vs. .52 in the non-autistic group).
Summary
Our key findings were that autistic participants had shorter non-decision times than non-autistic participants, and that across the whole sample, there were negative correlations between motor hyperactivity/impulsivity and non-decision time, and between verbal hyperactivity/impulsivity and drift-rate. These effects were robust across all models tested. Additionally, we found some evidence of negative relationships between drift-rate and inattentiveness and drift-rate and motor hyperactivity/impulsivity, but these were not robust across all model variants. When estimating correlations in each group separately, we only found clear evidence of a relationship between non-decision time and motor hyperactivity/impulsivity in the autistic group.
General discussion
Overall, we found no relationships between diffusion-model parameters and autism- and ADHD-related traits in a general population sample (Study 1). However, group differences in non-decision time (but not drift-rate or boundary separation) emerged when comparing groups of autistic and non-autistic participants (Study 2). This pattern of results suggests that autistic participants do not differ from non-autistic participants in how they make decisions about numerosity information, but instead differ in processes linked to encoding dot stimuli and/or generating responses. In Study 2, we also found relationships between DDM parameters and aspects of ADHD-related traits.
The absence of group differences in boundary separation contrasted our hypotheses based on previous work (Iuculano et al., 2020; Karalunas et al., 2018; Pirrone et al., 2017), but aligns with Manning et al. (2022a). In the current study and Manning et al., participants were explicitly asked to emphasise both speed and accuracy, differing from some previous studies. It is possible that autistic participants tend to respond more cautiously, but can adjust their response boundaries if instructed as they were here. However, we note that the evidence for the group difference in boundary separation fell in the inconclusive range, leaving open the possibility that the lack of group difference reflects a Type II error.
The finding that autistic adults had shorter non-decision times was also not hypothesised, following reports of longer non-decision times in autistic individuals (Pirrone et al., 2017), or no group differences (e.g., Karalunas et al., 2018; Manning et al., 2022a; Pirrone et al., 2020). As non-decision time includes sensory encoding, it is conceivable that the presence and direction of group differences depend on the sensory stimuli presented. Certain aspects of autistic perception are enhanced, particularly when these involve detecting patterns and accurately reproducing surface properties (Mottron et al., 2006, 2013). However, autistic participants did not have increased accuracy or drift-rate in this task, as we would expect if they were more sensitive to numerosity information. Despite this, stimulus encoding could have been quicker in autistic participants, with non-autistic participants slowed by the global configuration of dots (Meaux et al., 2014), following the suggestion that top-down influences on perception are optional in autistic people, but mandatory in non-autistic people (Mottron et al., 2006).
Shorter non-decision times have been reported in ADHD (Karalunas & Huang-Pollock, 2013; Metin et al., 2013; Salum et al., 2014), and, as hypothesised, we found that higher ADHD-related traits correlated with shorter non-decision times in Study 2. We found a relationship specifically with motor hyperactivity/impulsivity, which could suggest that the effect of ADHD-related traits on non-decision time occurs primarily within motor preparation/generation. However, the DDM cannot disentangle the relative roles of sensory encoding and response preparation/generation, so this will need addressing in future research. As ADHD-related traits were elevated in our autistic group, it could be that the group difference in non-decision time results solely from the effect of ADHD-related traits. However, as ADHD-related and autism-related traits are so intertwined, with high co-occurrence, we maintain that our current characterization of the difference between autistic and non-autistic participants is valid, especially as attention difficulties are increasingly seen as integral to the autism phenotype (Hours et al., 2022).
Our results add to the mixed findings around numerosity judgements in autism. We found group differences in DDM parameters despite no clear differences in accuracy and response times, demonstrating the sensitivity of this modelling approach to group differences (Stafford et al., 2020). Therefore, even where previous studies have reported no group differences in the accuracy of numerosity judgements (e.g., Aagten-Murphy et al., 2015), there could have been differences in the underlying cognitive processes. Future replications, including with developmental populations, will help determine the generalisability of our findings, and replications with larger sample sizes will reduce the likelihood of Type II errors.
Next, we compare our results between those of the two studies. There was no correlation between autism-related traits and non-decision time in Study 1, despite non-decision time differing between autistic and non-autistic participants in Study 2. Additionally, relationships between DDM parameters and ADHD-related traits were observed in Study 2, but not Study 1. The first possibility for these differences is statistical: perhaps Study 1, with its smaller sample size and smaller variance in autism- and ADHD-related traits, was not powered to detect these relationships, therefore increasing the likelihood of Type II errors. Indeed, the relationship between verbal hyperactivity/impulsivity and drift-rate had a similar posterior mean correlation in both studies, but the evidence was inconclusive in Study 1, with conclusive evidence supporting the alternative hypothesis in Study 2. Moreover, the correlation between verbal hyperactivity/impulsivity and drift-rate found across the whole Study 2 sample was absent in each group separately, likely due to less precise posterior estimates with these smaller samples.
There may also be conceptual explanations for the difference in conclusions between Studies 1 and 2, particularly in the case of conclusive evidence against relationships between autistic traits and non-decision time in Study 1, despite Study 2's conclusive group differences in non-decision time. This discrepancy could be because certain cognitive differences in autistic participants do not extend to the broader phenotype (Gregory & Plaisted-Grant, 2016; Sasson & Bottema-Beutel, 2022), with a discontinuity between non-diagnosed participants with high levels of autistic traits and individuals with a clinical diagnosis (Abu-Akel et al., 2019). It is also possible that the lack of relationship with autism-related traits reflects measurement error in the Autism-Spectrum Quotient.
Our discussion so far has focused on results which were robust across model variants. However, when estimating between-trial variability in drift-rate for Study 2, additional relationships emerged between inattentiveness and drift-rate, and motor hyperactivity/impulsivity and drift-rate. In our basic model which did not model between-trial variability in drift-rate, our drift-rate measurements may have been less accurate, thus obscuring relationships with ADHD-related traits. The relationship between motor hyperactivity/impulsivity and drift-rate also appeared when the model included a contaminant process. A negative relationship between hyperactivity/impulsivity and drift-rate was previously reported in autistic children (Manning et al., 2022a), so this relationship was not unexpected, although in this previous study, there were no relationships between inattentiveness and drift-rate. However, we put most emphasis on results that were robust across model variants.
Overall, our findings suggest that different aspects of neurodiversity contribute to different processing stages involved in numerosity judgements. Specifically, autism appears to affect non-decision times, whereas different subcomponents of ADHD-related traits affect non-decision time (motor hyperactivity/impulsivity) and drift-rate (verbal hyperactivity/impulsivity). Previous work using the DDM also concluded there were converging and diverging aspects of cognitive processing in autism and ADHD, although the pattern of results differs from our own (Karalunas et al., 2018). They reported that both autistic and ADHD children showed lower drift-rates in a response inhibition task than typical children but only autistic children showed increased boundary separation. Differences between the results reported here could be due to the difference in participants (adults vs. children) or task (numerosity processing vs. response inhibition), or because we did not test participants diagnosed with only ADHD and not autism. However, our results and others (e.g., Karalunas et al., 2018; Manning et al., 2022a; 2022b) together show the potential of the DDM to identify distinct patterns of cognitive processes associated with different conditions.
A limitation of this study concerns the online data collection, which reduces experimenter control over stimulus presentation and precludes confirming autism diagnoses using ‘gold-standard’ tools. While we welcome replication of this result ‘in-person’, we believe that our large samples and stringent inclusion/exclusion criteria allow confidence in our results. We are also mindful that by relying on diagnoses for our group inclusion, our results may be biased towards autistic individuals who are able to access a diagnosis (McDonald, 2020). Future research is needed to understand the similarities and differences between self-identifying and diagnosed autistic individuals in perceptual decision-making tasks. As more DDM studies in autism are published, often with mixed results, it will be important to conduct meta-analyses, and re-analyse datasets with the same modelling framework, to establish the robustness of group differences across tasks. However, within the same modelling framework and task, as in our study, the DDM highlights aspects of neurodiversity having different effects on cognitive processes. Applying the DDM across tasks and aspects of neurodiversity, therefore, has the potential to better understand individual differences in cognitive performance.
Supplemental Material
sj-docx-1-ndy-10.1177_27546330251370662 - Supplemental material
Supplemental material, sj-docx-1-ndy-10.1177_27546330251370662
Footnotes
Acknowledgements
The authors thank all participants for taking part.
Funding
The author(s) disclosed receipt of the following financial support for the research, authorship, and/or publication of this article: This work was funded by a Sir Henry Wellcome Postdoctoral Fellowship awarded to CM (Wellcome Trust 204685/Z/16/Z) and funding for undergraduate projects from University of Oxford. For the purpose of open access, the author has applied a CC BY public copyright licence to any Author Accepted Manuscript version arising from this submission.
Declaration of Conflicting Interests
The author(s) declared no potential conflicts of interest with respect to the research, authorship, and/or publication of this article.
References
Supplementary Material
Please find the following supplemental material available below.
For Open Access articles published under a Creative Commons License, all supplemental material carries the same license as the article it is associated with.
For non-Open Access articles published, all supplemental material carries a non-exclusive license, and permission requests for re-use of supplemental material or any part of supplemental material shall be sent directly to the copyright owner as specified in the copyright notice associated with the article.