
Abstract
The production of cultivated land in China faces the risks of soil nutrient imbalance and functional instability. Measuring and analyzing the resilience of cultivated land systems (RCLS) is crucial for maintaining stable production and promoting green development in agricultural production. From the perspective of agricultural green transformation, this paper reveals the spatio-temporal evolution characteristics of the RCLS in China from 2008 to 2023 and uses a geographical and temporal weighted regression (GTWR) model to explore the factors influencing regional differences. The results are as follows: (1) The national RCLS increased from 0.1926 in 2008 to 0.5211 in 2023, with an average annual increase of 2.05%, thus indicating step-by-step growth. (2) National RCLS exhibited outward radiation from the ‘northwest–northeast’ dual-core high-resilience gathering area. Moreover, the differences were evident in the resilience space of RCLS in each region. (3) An analysis of the driving factors revealed that straw return, agricultural structure, farmer education level and a high standard farmland scale were the dominant factors affecting RCLS. In this context, a high standard farmland scale has a negative driving effect, whereas straw return, agricultural structure and farmer education level have positive driving effects. (4) The combined effect of the rotation fallow scale and grain yield per unit area had the strongest explanatory power with respect to the resilience of the cultivated land system. This paper provides a scientific basis for enhancing cultivated land sustainability and supports policymaking in the context of agricultural green transformation in China.
Keywords
Introduction
Improving the resilience of cultivated land systems (RCLS) is critical for efforts to ensure food security and coordinate the ecological–social–economic system of cultivated land. Moreover, this approach also represents an important step toward achieving the Sustainable Development Goals of zero hunger (UNEP, 2023). Sustainable farmland management can ensure a stable food supply and reduce hunger (Guo and Jin, 2025; Kross et al., 2022). However, the production mode of high inputs and diseconomies of scale tends to cause imbalances in soil nutrients and destroy the functional stability of cultivated land systems. Obviously, it can be challenging for land to adapt to self-regulation demands under external pressures such as water shortages, soil degradation, and the diverse demands of crops (Lv et al., 2022; Soubry and Sherren, 2022). The Chinese government has issued a green transformation and development plan for agriculture, which requires ecological protection to be strengthened, cultivated land to be restored, and the conservation function within the agricultural land subsystem to be enhanced. The objective of this plan is to meet the practical challenges involved in the task of improving the defensive capability of cultivated land systems (Vigani et al., 2024).
Agricultural green transformation involves not only the integration of a series of technical measures but also a systematic paradigm shift based on ecology and evolutionary resilience theory. Its core goal is to reshape the structure and function of the cultivated land system through resource recycling, technological innovation and biodiversity restoration (Wang et al., 2025). The relationship between agricultural green transformation and RCLS essentially involves reconstructing the structure, function and management mode of the cultivated land system by means of ecological, circular and intelligent methods with the aim of systematically improving its comprehensive ability to resist interference, adapt to changes and realize transformation. From this perspective, RCLS research can theoretically reveal how green transformation enhances the impact-resistance and self-organization ability of a system through structural restructuring and path innovation and provides a new analytical framework for solving the structural contradiction between stable production and ecological protection.
Scholarly research on RCLS has formed a relatively systematic academic accumulation, mainly focusing on three aspects: concept definition and measurement, spatial and temporal characteristics evolution and research scale differences. However, although the existing research has made progress in its respective paths, its inherent limitations also constitute the academic gap that this paper attempts to respond to.
In terms of concept definition and measurement, resilience theory has been gradually extended into many fields such as social ecological resilience, rural resilience, urban resilience and economic resilience. Since Holling (1973) pioneered the description of natural ecosystems (Greene et al., 2022; Han et al., 2023; Wang et al., 2024). The concept of RCLS has also been incorporated into the framework of the discussion of cultivated land systems (Liu et al., 2024; Qi et al., 2024; Skerratt, 2013). Scholars generally agree that a deep understanding of farming behavior, economic measures, land engineering, agricultural pollution and other factors will help to promote the utilization and protection of cultivated land (Gao et al., 2025; Hu et al., 2024). However, the above definitions and measurement frameworks are mostly derived from a single ecological or economic perspective, and fail to fully integrate the systematic perspective of ecological, economic and social interaction emphasized by the green transformation of agriculture. This makes the existing index system focus on the static description of the system status, the coupling relationship and the internal driving force of the transformation are insufficient, and it is difficult to comprehensively evaluate the adaptability and maintenance ability of the cultivated land system under the pressure of green transformation.
In terms of spatial and temporal characteristics, scholars have revealed that China’s RCLS is generally on the rise, where the low-value areas are concentrated in the central and western inland areas, and spread outward from the core area over time (Lyu et al., 2021). This growth trend has also been verified at the provincial and urban scales (Wang et al., 2024). These studies provide an important basis for understanding the macro pattern of RCLS, but their core contributions still remain in the description of phenomena and patterns, while failing to reveal the driving mechanism behind the evolution of the pattern. In particular, the analysis of the spatial heterogeneity and temporal dynamics behind the driving factors is obviously insufficient, which weakens the guiding value of the research results on the formulation of differentiated policies.
In terms of research scale, existing studies have covered different scales from the case of family farms in Europe (Ika et al., 2016) to the Yangtze River Delta region in China (Shiyin et al., 2022; Yin et al., 2024; Yu et al., 2019), which has accumulated experience for understanding the multi-scale characteristics of RCLS. However, studies at different scales are often separated from each other, and there is a lack of cross-scale mechanism correlation and comprehensive comparison. The existing cross-sectional comparisons between regions are mostly based on static or single-time sections, and fail to establish a dynamic analysis framework for multi-scale linkages on long-term sequences, making it difficult to capture how cross-scale interactions between macro-policy, regional development, and micro-subject behavior jointly shape the evolutional path of RCLS.
In summary, the existing research provides a good understanding of the concept, measurement and phenomenon description of RCLS. However, as a system of natural-artificial interaction, it has the functional contents of ecology, sociology, economics and engineering of cultivated land (Keegan et al., 2024). Natural disasters, resource dependence, climate change and a lack of adaptive engineering all threaten RCLS (Long and Qu, 2018). The theory of agricultural green transformation uses a systematic approach to explore the intricate interactions between ecological, economic and social dimensions, emphasizing the coordination and stability of RCLS (Jin et al., 2023). Therefore, based on the perspective of agricultural green transformation, this paper constructs a comprehensive evaluation system to measure the spatio-temporal evolution of RCLS, and uses the geographical spatio-temporal weighted regression model to reveal the spatio-temporal differentiation law of driving factors and the interaction effect between key factors. This paper aims to make up for the existing research gaps and provide a scientific basis for deepening the theory of cultivated land system resilience and promoting the practice of agricultural green transformation.
The contributions of this paper are as follows. First, from a theoretical perspective, the perspective of agricultural green transformation is used to innovatively reconstruct the connotation of resilience, upgrade the resistance and recovery paradigm of traditional resilience research to a new paradigm of adaptation and transformation, and highlight the ability of the system to adapt actively to ecological constraints and achieve functional upgrading. Second, in terms of methodology, the geographical and temporal weighted regression (GTWR) model and the multidimensional ecology–economy–society–engineering framework are integrated, which can overcome the shortcomings of the static panel model, ignore spatial and temporal heterogeneity, and quantify the different effects of different driving factors on spatial and temporal dimensions. Third, in terms of scale innovation, the RCLS evaluation system at the provincial scale was established for the first time, which filled the gap in the analysis of cross-regional RCLS in the existing research. Considering the distribution characteristics of RCLS and the relationship between cultivated land and the surrounding environment, the scope of RCLS research has broadened.
In fact, strengthening the robustness of RCLS is imperative for safeguarding food security and facilitating the transition to environmentally sustainable agriculture. This paper explores the dynamic relationship between RCLS and agricultural green transformation, which can facilitate the realization of the long-term sustainable development of agricultural production (Figure 1). The steps involved in this research are as follows: First, collect and process the data related to the characteristics of agricultural green transformation at the provincial scale and construct the ‘ecological–economic–social–engineering’ analysis framework to evaluate RCLS. Second, use spatial autocorrelation and other methods to explore the temporal and spatial pattern evolution attributes of RCLS throughout China. Third, explore the impacts of ecological, economic, social and engineering factors on RCLS via the GTWR model. Fourth, combine the empirical analysis results with regional case studies and propose an optimization path for RCLS in three regions.
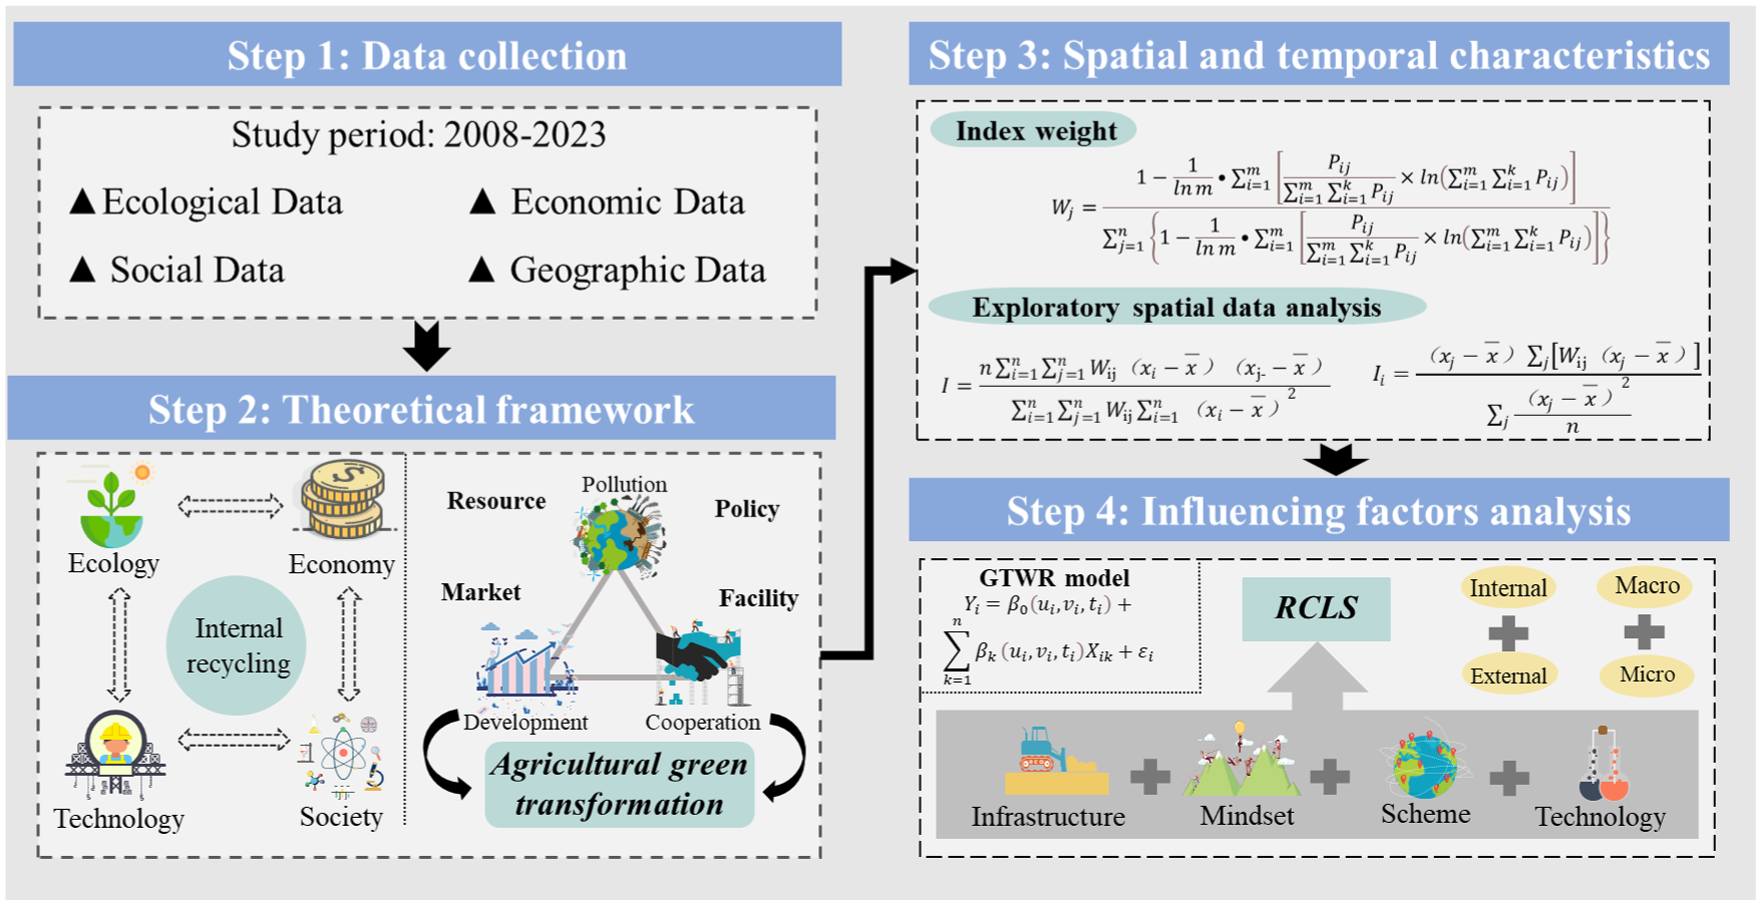
The technical roadmap.
Theoretical framework of RCLS
Definition of RCLS theory
The notion of RCLS is a compound concept based on ecological theory and includes subsystems of type, quantity, quality, and so forth (Lv et al., 2022b). Interactive systems are affected not only by external implementation, such as economic behavior inputs and social systems, but also by their ecological background and the construction of multiple engineering facilities. Moreover, interactive systems need to respond to policy implementation requirements such as ecological restoration and agricultural structure adjustment. The single-dimensional framework cannot capture this complexity; thus, the ecology–economy–society–engineering framework is used to reflect the integrity, adaptability, stability and elasticity of RCLS (Moragues-Faus et al., 2020).
Compared with generalized resilience, RCLS not only focuses on the ability of the system to resist disturbances and maintain core functions, but also emphasizes the ability to actively adapt to the new environment and achieve sustainable transformation in the context of agricultural green transformation. Its conceptual boundary is reflected in three aspects: first, it refers to the ability of cultivated land systems to coordinate food security and ecological security under the dual pressure of ecology and development; second, it not only includes resistance and resilience, but also pays more attention to promoting system upgrading through green transformation. The third is highly dependent on the multi-dimensional interaction of ecology-economy-society-engineering, with significant spatial embeddedness and policy orientation characteristics. RCLS expands the classical resilience theory, highlights the characteristics of transformation orientation and multi-dimensional coordination, and is more in line with the practical needs of sustainable development of agricultural systems (Figure 2).
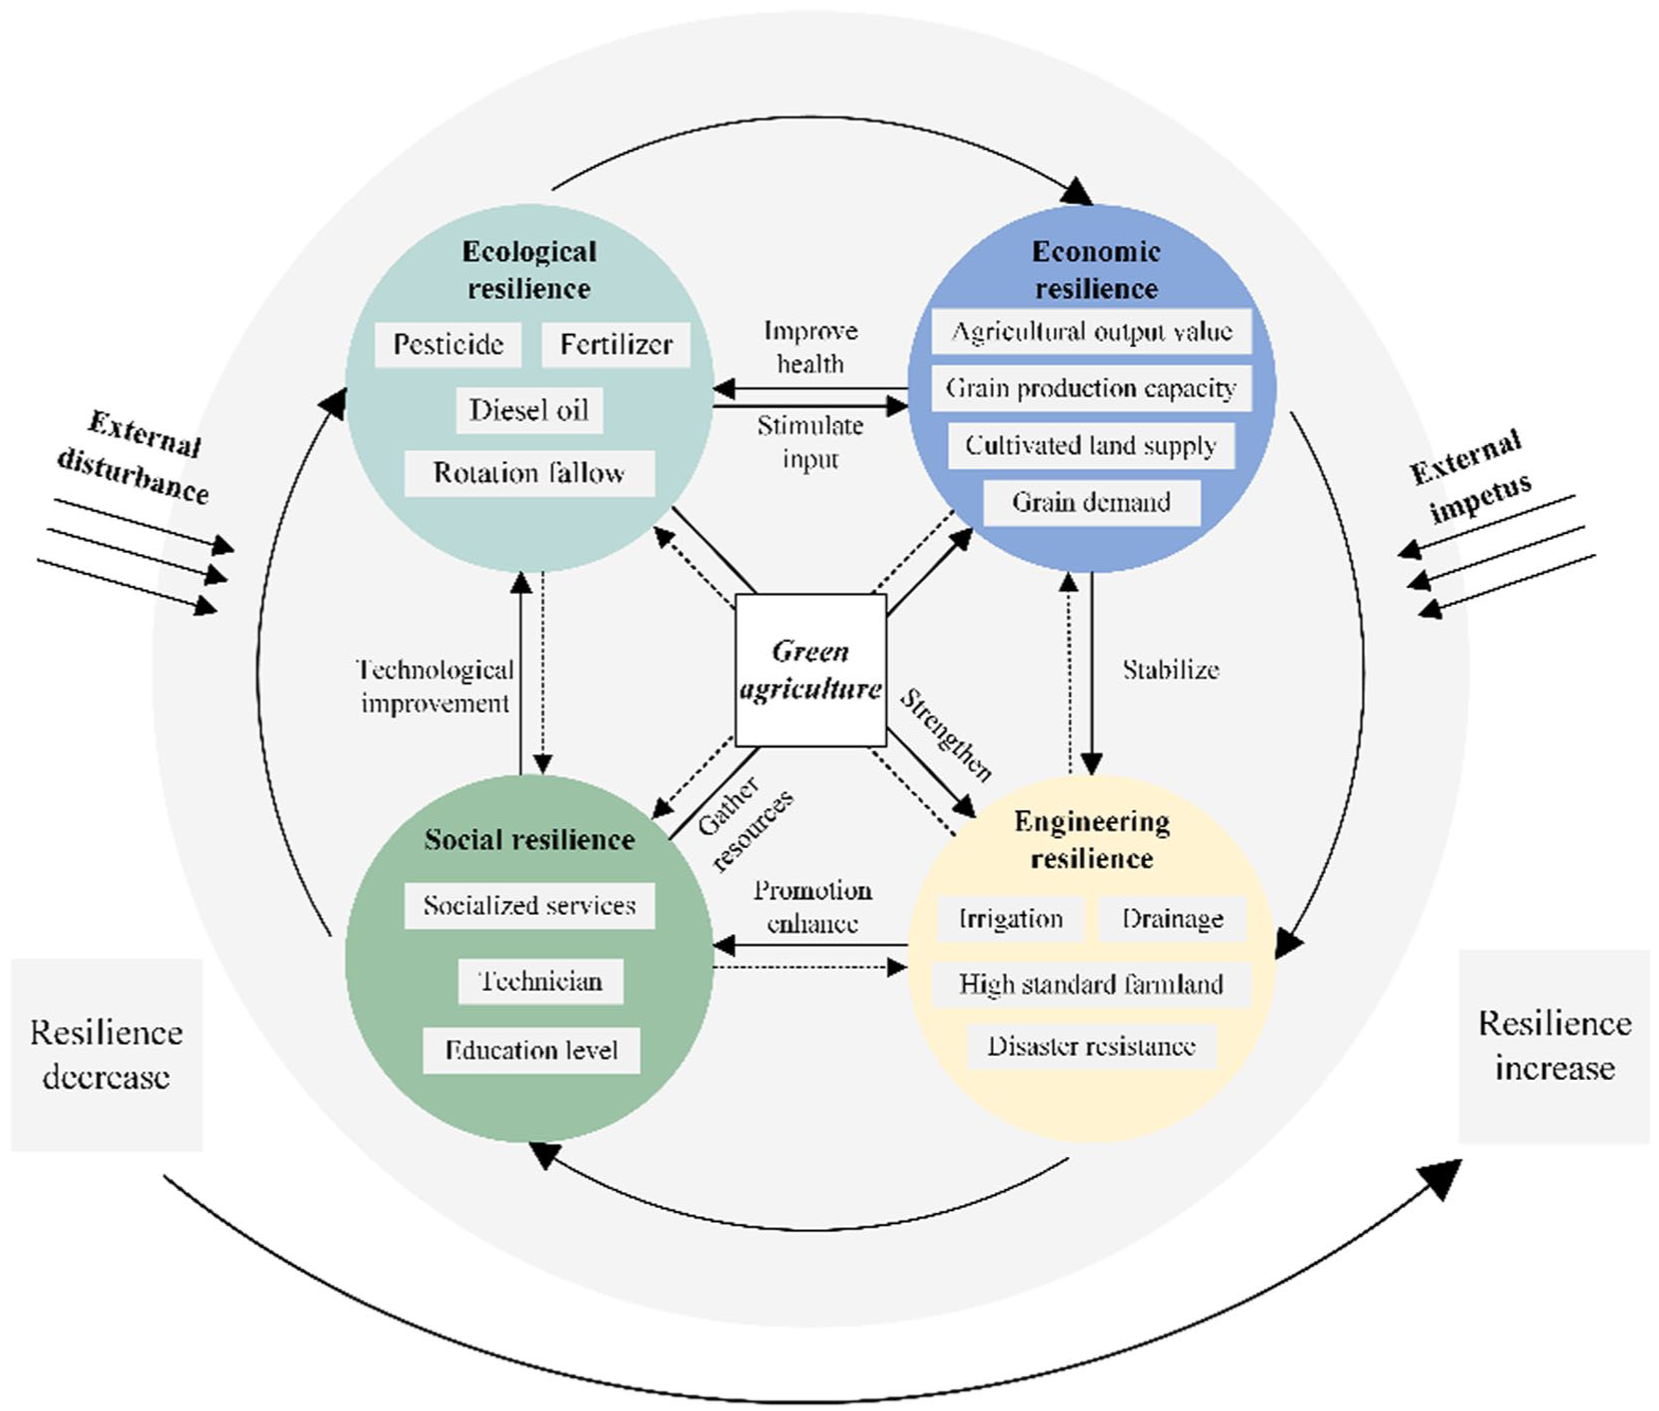
Evolution of the ‘ecology-economy-society-engineering’ structural diagram of cultivated land system.
Theoretical analysis of RCLS in the context of agricultural green transformation
The green transformation of agriculture represents a major adjustment to the traditional agricultural production mode with the goal of ensuring the harmonious coexistence of agricultural production and the ecological environment (Gao and Song, 2020). Under the constraints of agricultural green transformation, RCLS should ensure that available land can maintain stable production capacity, continuous self-improvement and recovery ability in the face of various challenges. RCLS also provide strong support for green transformation and the sustainability of agricultural practices (Bless et al., 2023; Xie and Gao, 2023). The theoretical analysis of RCLS involves multiple levels, ranging from resource utilization to ecological environmental protection and from the choice of agricultural production mode to policy system design. Multiple levels and factors constitute a multidimensional framework for analyzing RCLS, which provides theoretical background and practical guidance for the realization of agricultural green transformation. Therefore, RCLS are viewed as a complex framework of multidimensional dynamic interactions, in which ecological resilience, economic resilience, social resilience and engineering resilience constitute the core of the framework. The four resilience structures do not exist in isolation but jointly shape RCLS through interaction and feedback cycles (Figure 3).
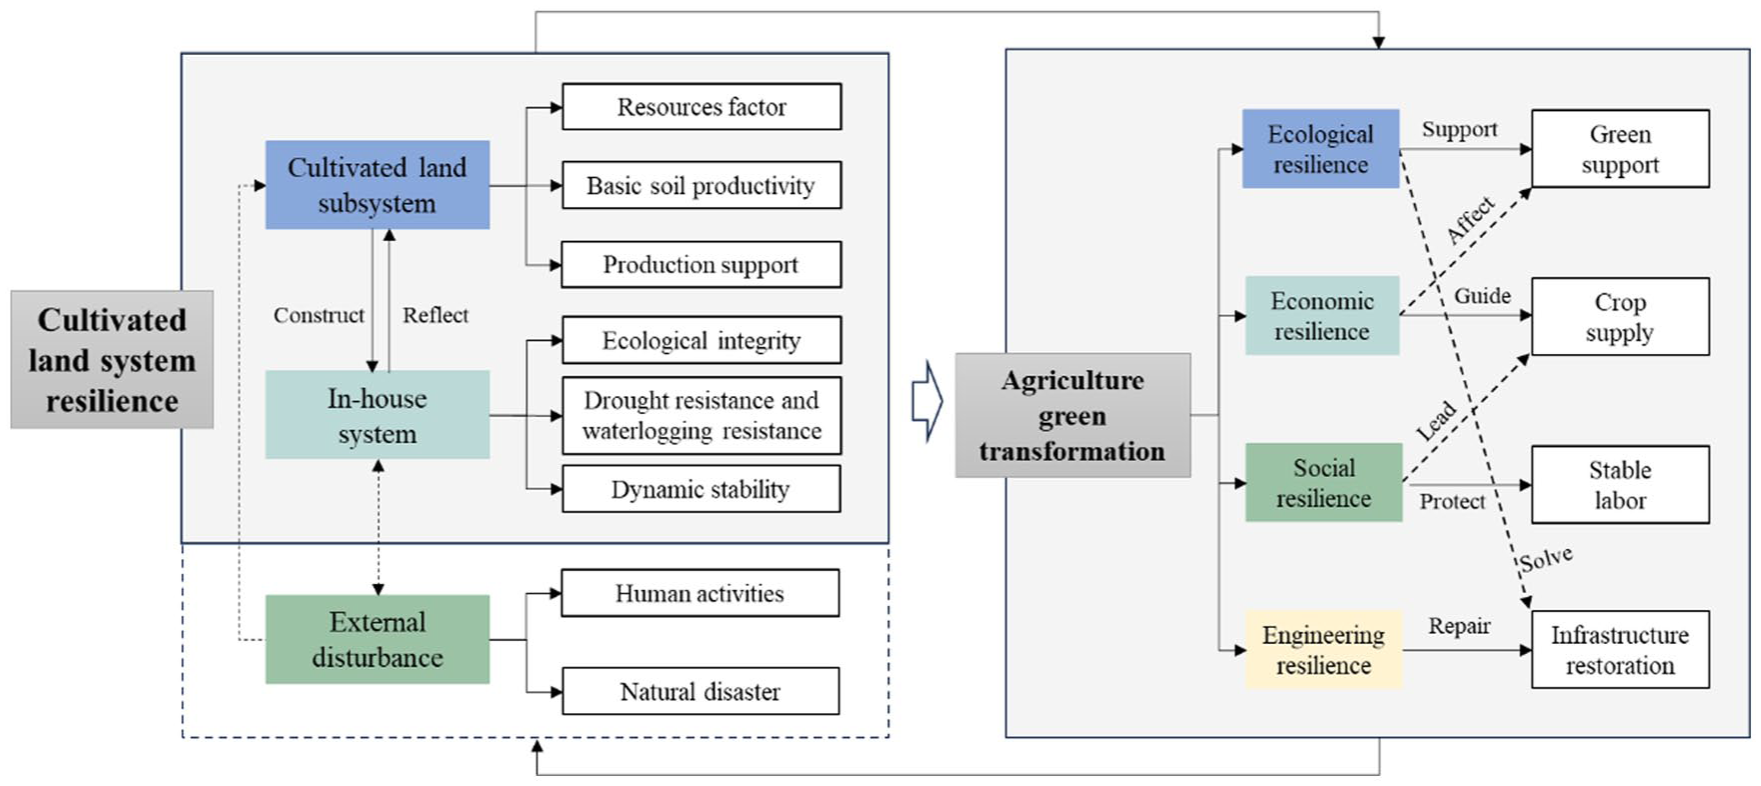
Relationship between RCLS and agricultural green transformation.
The ecological–economic–societal–engineering multidimensional framework constructed in this paper not only systematically evaluates the ability of the cultivated land system to maintain its basic functions in the face of disturbances but also emphasizes the potential of this system to adapt to changes and achieve sustainable transformation. It is an important deepening and expansion of the traditional ‘resistance-recovery’ resilience paradigm. First, ecological resilience constitutes the foundation of RCLS, which is related to the factors influencing production, such as pesticides and fertilizers (Yang et al., 2022). Enhanced ecological resilience provides an internal impetus to optimize the investment of human capital and technology in cultivation, thereby improving the quality of cultivated land and increasing agricultural productivity (Lv et al., 2024). From a geographical perspective, the spatial differentiation of ecological resilience is jointly shaped by natural background conditions and the intensity of human activities, and its promotion process has significant regional adaptability. Second, economic resilience is gradually enhanced in the process of quantifying and intensifying external inputs, which is reflected not only in the improvement of cultivated land production efficiency but also in the satisfaction of food demand. The spatial structure of economic resilience has a profound impact on resource flow and system recovery path. Similarly, economic resilience helps improve engineering resilience and significantly enhances the stability and resilience of the physical dimension of the system through infrastructure construction and maintenance. Moreover, improvements in economic resilience can improve the health status of the ecosystem and thereby achieve a stable state of ecological resilience. Finally, by enhancing farmers’ adaptive capacity and promoting green technology adoption, social resilience can promote the positive transformation of system behavior patterns. Improving social RCLS and motivating households to adopt green farming technology help increase the productivity and adaptability of cultivated land, promote a stable cycle of ecological, economic and engineering resilience, and form a dynamic balance of mutual benefit symbiosis.
The four dimensions are linked through multiple feedback and synergy mechanisms to form a cyclical and mutually reinforcing resilience enhancement path, which jointly promotes the systematic transformation of the cultivated land system from single resistance to adaptive adjustment and from static maintenance to dynamic transformation. This framework reveals the coupling mechanism and spatial expression of different dimensions in specific regions by integrating geographical process analysis, thus providing a more explanatory theoretical tool for understanding and intervening in the spatial pattern evolution of RCLS.
Methodology and materials
Entropy method
The entropy method was used to calculate the objective weight of the RCLS index (Li et al., 2024). The generated weight was multiplied by the standardized value of each RCLS index, which helps to quantify the degree of contribution of RCLS. Owing to the dimensionality, size order and positive and negative differences of the factor indicators, it is necessary to standardize the data to reduce the randomness of subjective weighting, calculate the index proportion Yij, calculate the entropy value ej, and finally determine the weight Wj of the RCLS index according to the index difference coefficient. The calculation formula is as follows:
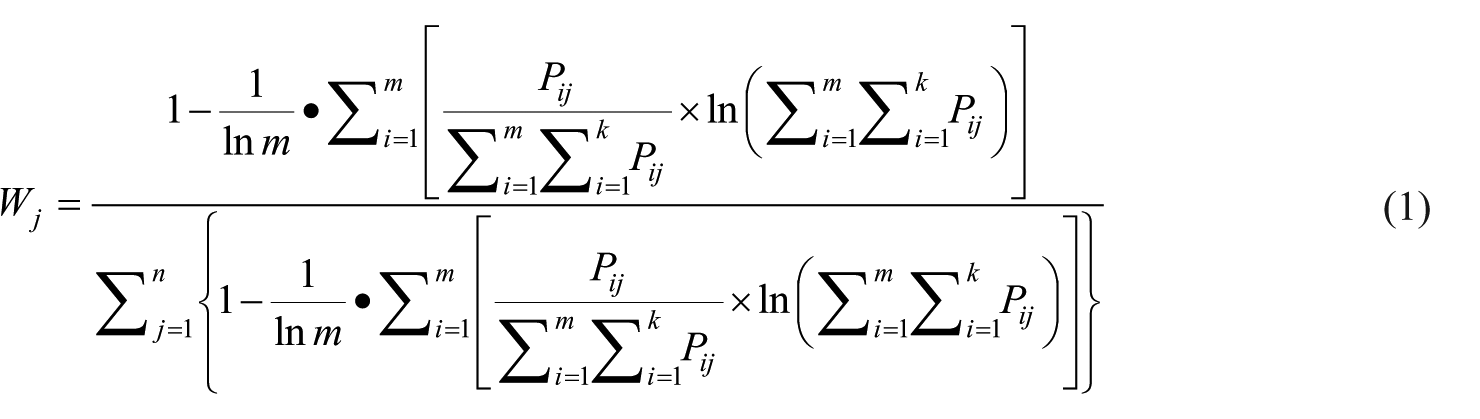
In formula (1), m represents the research year, k represents the number of samples, P ij represents the standard value of the jth index in the i year, and W j represents the weight of the j th index.
Exploratory spatial data analysis
Exploratory spatial data analysis (ESDA) entails a visual analysis of the correlation and agglomeration of RCLS based on geographical spatial neighborhoods. In this manner, the spatial agglomeration characteristics of national RCLS can be effectively distinguished through global spatial autocorrelation and the local spatial autocorrelation coefficient (Lu et al., 2024).
Global spatial autocorrelation coefficient
The spatial overall equilibrium of RCLS, as expressed by the global Moran’s index of the statistics, is explored. The formula is as follows:
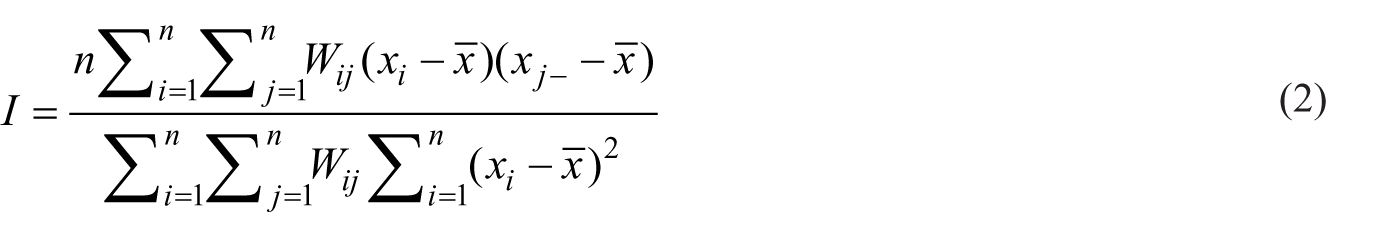
where I is the global Moran index and where x
i
and x
j
are the RCLS values in region i and region j, respectively.
Local spatial autocorrelation analysis
The local agglomeration of spatial sample observations, which is represented by the local Moran’s index, is verified. The local indices of spatial association (LISA) aggregation distribution is used to represent the similarity between the changing trends of RCLS, representing four types of agglomeration. The formula is as follows:
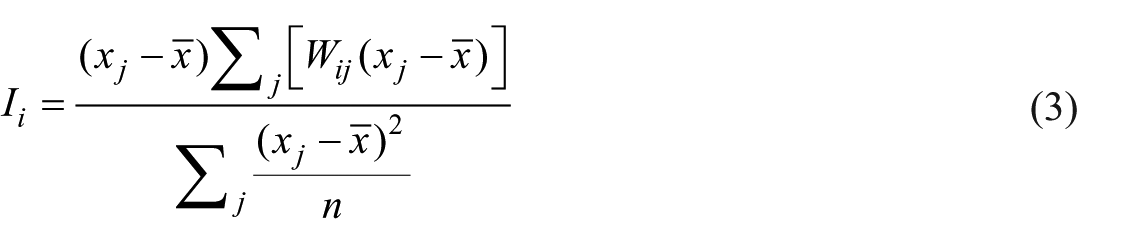
where I
i
is the local Moran index, x
j
represents RCLS in region j,
GTWR model
Compared with the geographically weighted regression (GWR) model, the most important feature of the GTWR model is the association of time attributes with spatial attributes via geographically weighted regression (Hu et al., 2022; Zhang et al., 2024). Using the GTWR, the spatial and temporal heterogeneity of the factors influencing RCLS can be explored. The formula is as follows:
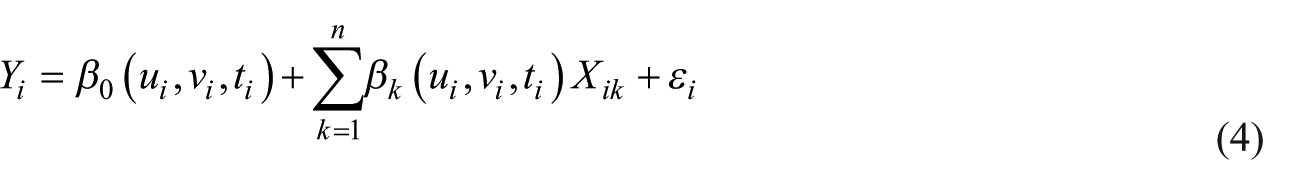
where Y
i
is the RCLS in the i region,
In the GTWR model, the regression coefficient is obtained by weighted regression of data within a certain range around each observation point. The formula is as follows:
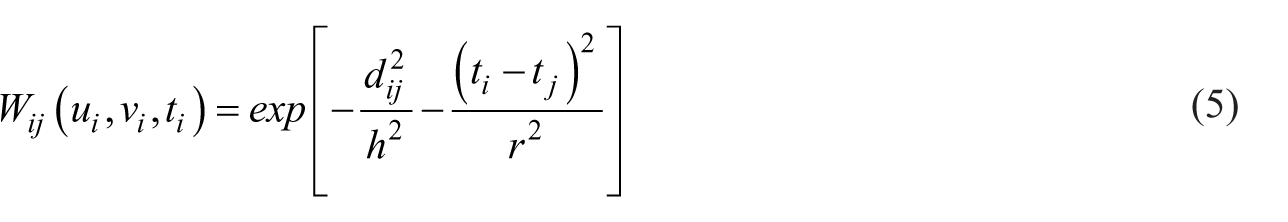
where
Indicator selection and data sources
RCLS index system
Against the backdrop of the green transformation of agriculture, RCLS constitute complex systems that involve not only natural ecological factors, such as soil fertility and biodiversity, but also economic, social and engineering technology. Therefore, RCLS are divided into four components: ecology, economy, society, and engineering. Fifteen representative indicators that conform to China’s national conditions are selected to construct the RCLS evaluation index system. The specific index weights calculated by the entropy method are shown in Table 1.
RCLS index.
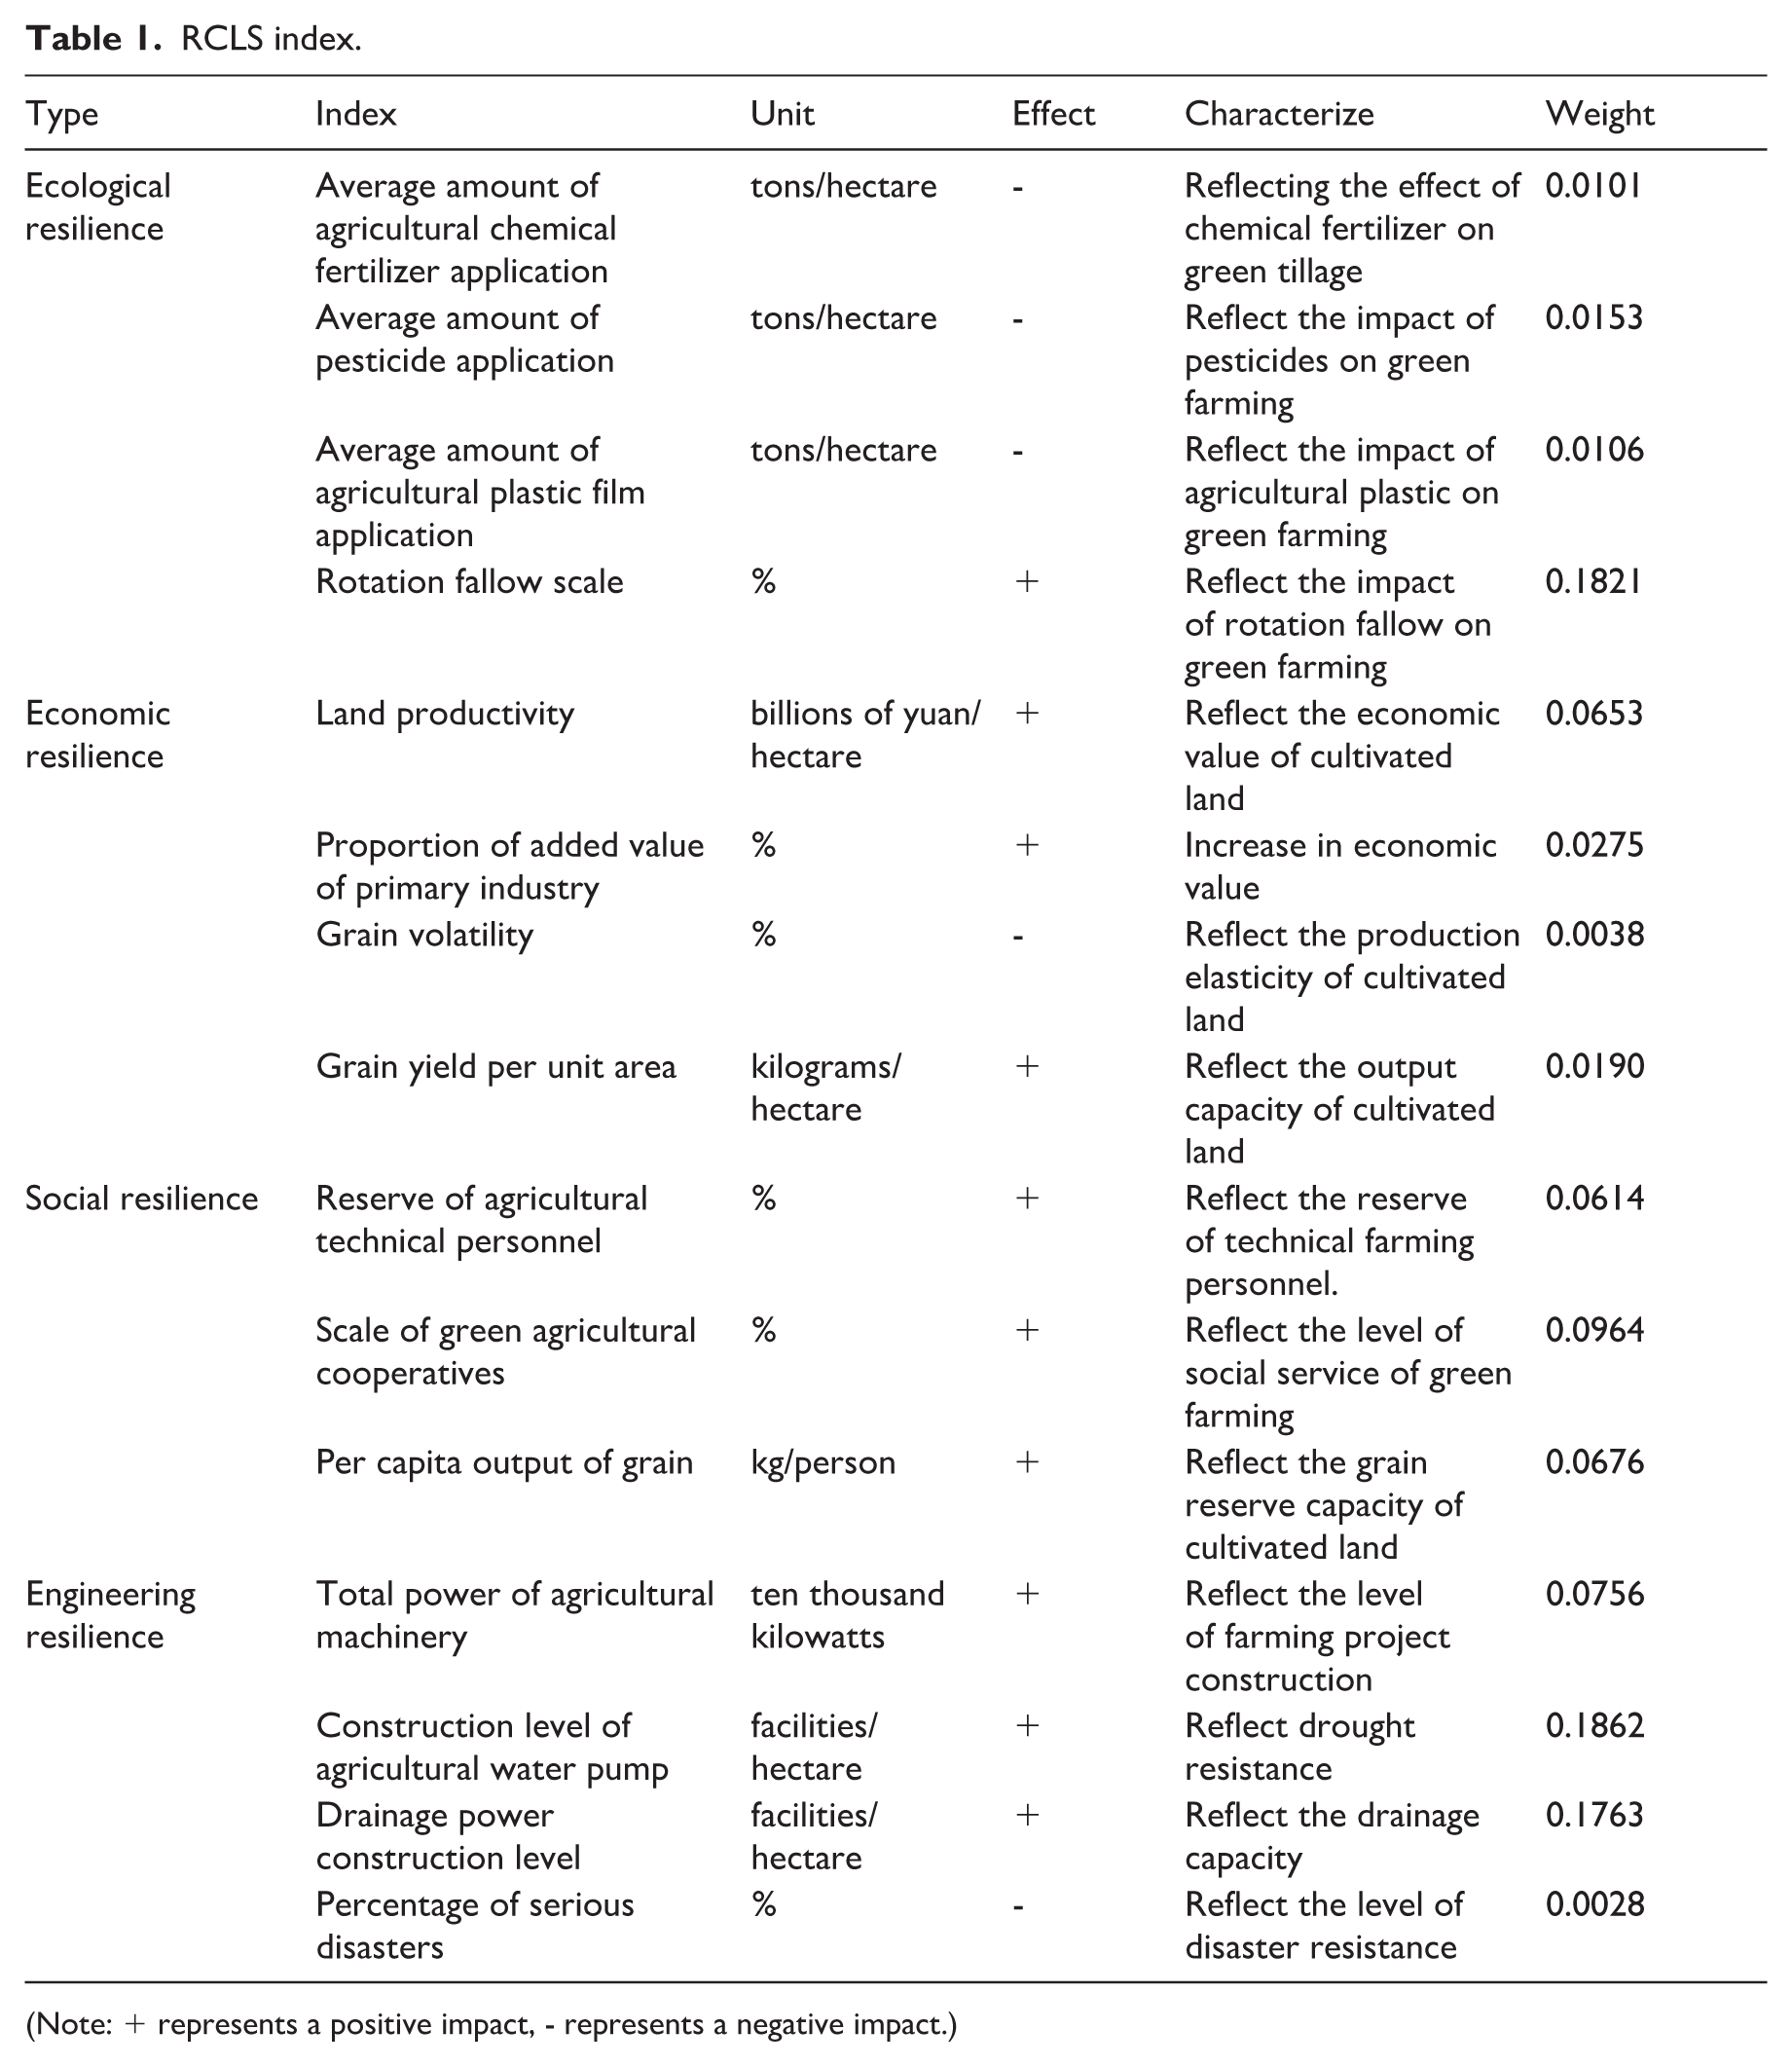
(Note: + represents a positive impact, - represents a negative impact.)
First, ecological resilience. At present, the risks of ecological processes in cultivated land mainly involve severe pollution and low quality soil. In the production process, farmers rely too much on the external supply of chemical inputs such as pesticides, fertilizers and plastic films, and the amount used is far beyond a reasonable range (De Vries et al., 2012; Hung et al., 2016). Therefore, four indicators, namely, the agricultural fertilizer application amount, pesticide application amount, agricultural diesel oil application amount and rotation fallow scale, are selected to reflect the ecological RCLS.
Second, economic resilience. The economic process is reflected in the food production of cultivated land and the economic value of crops (Lu et al., 2020. Therefore, land productivity, the proportion of added value of primary industry, grain volatility and grain yield per unit area are used to represent the economic resilience of cultivated land.
Third, social resilience. In a broad sense, social resilience refers to the ability of multilevel subjects such as individual and collective farmers to respond properly and flexibly to economic shocks and is closely related to farming awareness (Huang et al., 2018; Liao et al., 2022). Three indicators are selected to represent social resilience: the reserve of agricultural technical personnel, the scale of green agricultural cooperatives and the per capita output of grain. These indicators reflect social resilience from social-related aspects such as social talent support, social cooperation organization development and social resource allocation.
Fourth, engineering resilience. Engineering resilience reflects the ability of cultivated land to resist drought and flood, which is closely related to technical input and the construction of modern agricultural infrastructure (Deng et al., 2024). Therefore, four indices, namely, the total power of agricultural machinery, the construction level of agricultural water pumps, the drainage power construction level and the percentage of serious disasters (damage area/affected area), are used to express engineering resilience. This context indirectly reflects the lack of a buffer function for the system.
Multicollinearity test of RCLS index
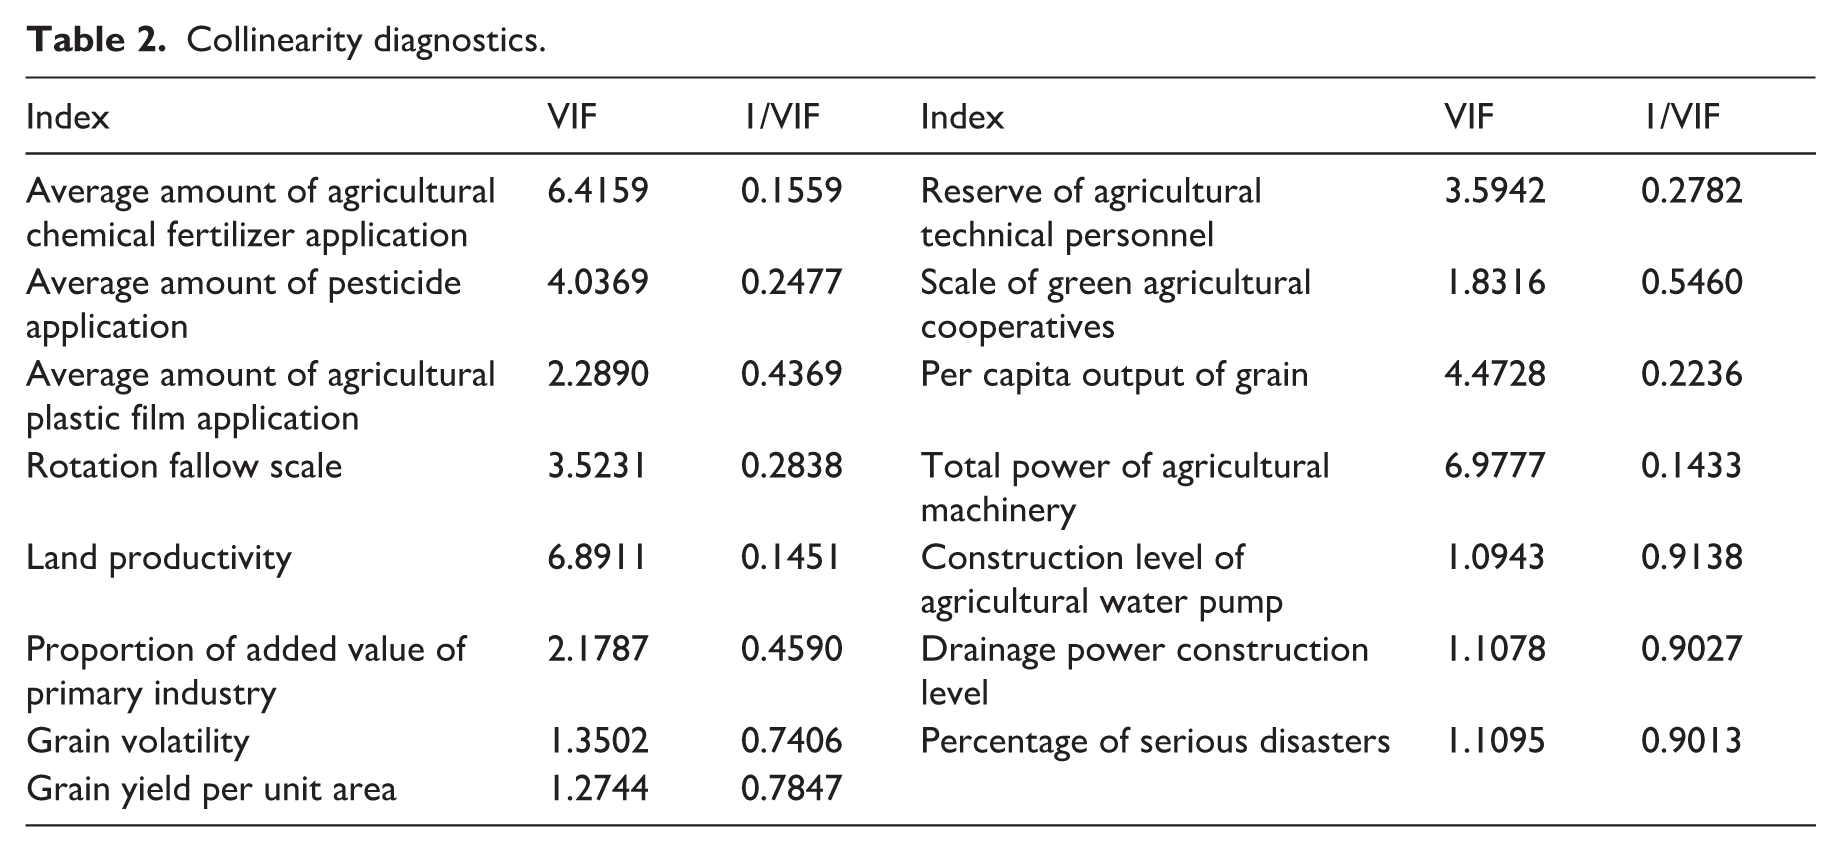
To prevent any deviation resulting from serious multicollinearity between variables, it is necessary to eliminate variables with high collinearity. Therefore, in this paper, the variance inflation factor (VIF) method is used to test the collinearity between the selected indicators and RCLS variables.
The VIF test results reveal that the VIF values of all variables are less than 10; the maximum VIF value is 6.9777, the minimum value is 1.0943, and the average value is 3.2098, which is within the acceptable range of 0 to 5. These results reveal the absence of any serious multicollinearity problems between the variables and indicate that the selected indicators meet the requirements of this paper (Table 2).
Collinearity diagnostics.
Data sources
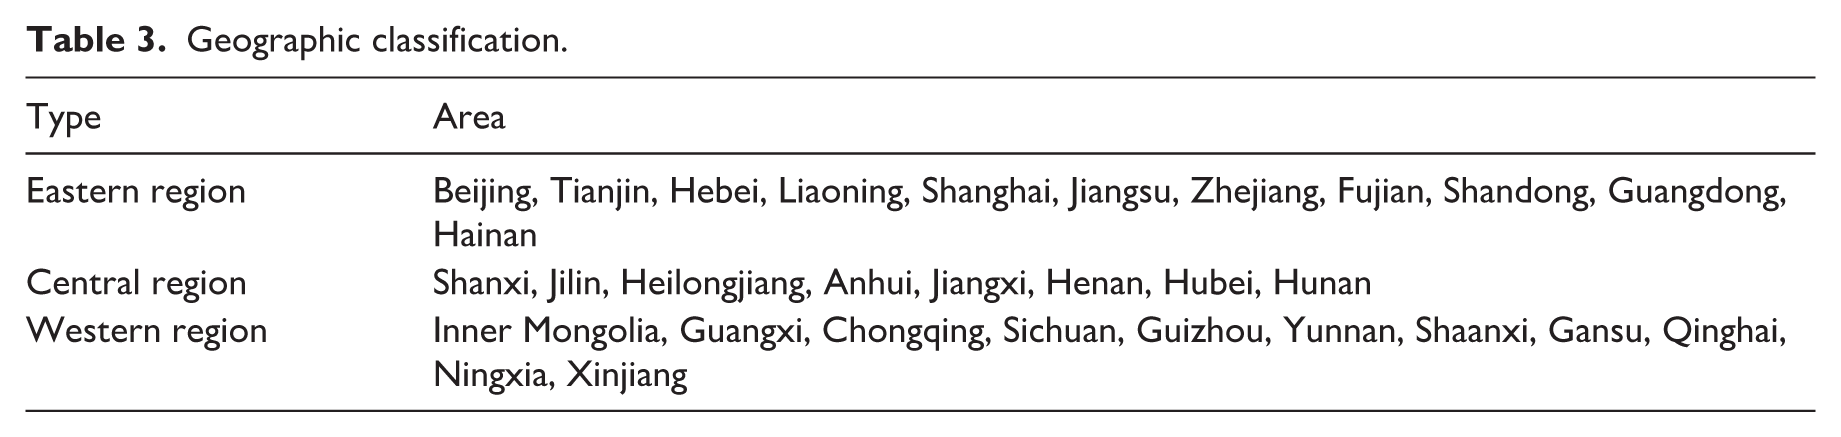
In this paper, panel data from 30 provinces in mainland China from 2008 to 2023 are constructed. In accordance with the regional division criteria of the National Bureau of Statistics, the study area is categorized into eastern, central and western regions (Table 3). Owing to the lack of data, Tibet, Hong Kong, Macao and Taiwan are not included in this paper. The data used are from the ‘China Statistical Yearbook’, ‘China Urban Statistical Yearbook’, ‘China Rural Statistical Yearbook’, ‘China Population and Employment Statistical Yearbook’ and the annual statistical bulletin of each province and city. These findings are consistent with research needs until 2023. In addition, data concerning cultivated land-related policies, such as farmland rotation fallow, agricultural machinery purchases and application subsidies, were lacking. Based on the evolution of agricultural sustainable development policy and the early practice report of the region, the data of rotation fallow scale and drainage power construction level were reasonably supplemented by linear interpolation method and trend extrapolation method based on time series.
Geographic classification.
Driving factors model selection
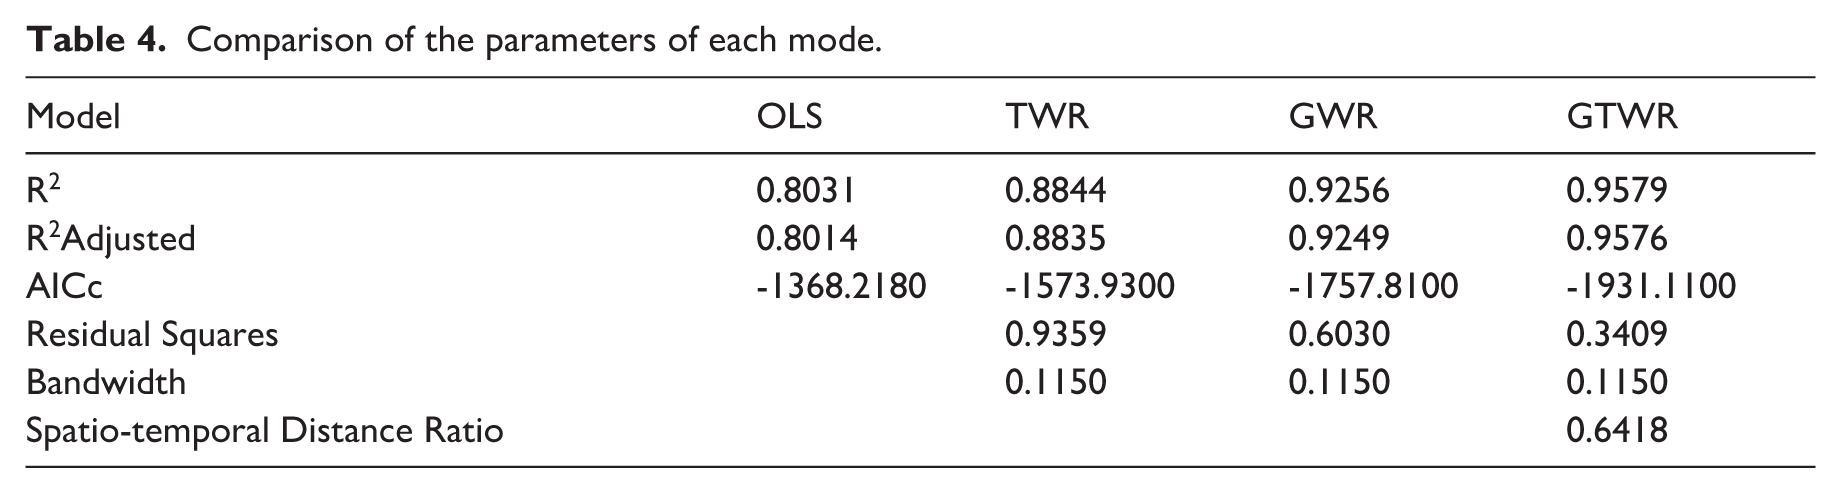
The ordinary least squares (OLS), temporally weighted regression (TWR), GWR and GTWR models are used to compare the model fitting results and analyze the spatial and temporal variation characteristics of the influencing factors. From the aspects of green ecology, economic development, social support and engineering guarantees, four indicators are selected as the impact indicators of RCLS. The ecological aspect is represented by the scale of straw return (%) X1, the economic aspects represent the agricultural structure (%) X2, the social aspects include farmers’ education level (%) X3, and engineering is a high standard farmland scale (%) X4. ArcGIS software is used to test for multicollinearity. The VIF of each variable is less than 10, and the tolerance is greater than 0.1, indicating that there is no multicollinear factor.
To compare different models, R2, R2Adjusted and Akaike Information Criterion, corrected (AICc) are selected as the evaluation criteria to determine the goodness of fit of the model (Table 4). The results indicate that the AICc value of the GTWR model is the lowest, at -1931.110; the R2 of the GTWR model is 0.9579, which is higher than those of the OLS, TWR and GWR models. The data reveal that the goodness of fit of the GTWR model is significantly better than that of the other three models; thus, the GTWR model can better explain the impact of each variable on the national RCLS more accurately. The fixed bandwidth and space-time distance ratio of the GTWR model are 0.1150 and 0.6418, respectively.
Comparison of the parameters of each mode.
Spatio-temporal evolution characteristics of RCLS in China
Temporal and spatial dynamic evolution characteristics of RCLS in China
Temporal differentiation characteristics of RCLS in China
First, the nationwide RCLS exhibited a progressively increasing trajectory from 2008 to 2023, as depicted in Figure 4. The period from 2008 to 2018 is characterized by a modest but consistent increase, with RCLS remaining relatively low. However, RCLS underwent a pronounced surge between 2018 and 2023, indicating a significant overall increase. This trend indicates that the RCLS remained stable during the observation period, the internal structure of the system was coordinated, and the strict implementation of the protection policy jointly promoted the improvement of land quality and soil fertility conservation, thus not only guaranteeing the foundation of food security but also promoting a shift to an environmentally sustainable direction.
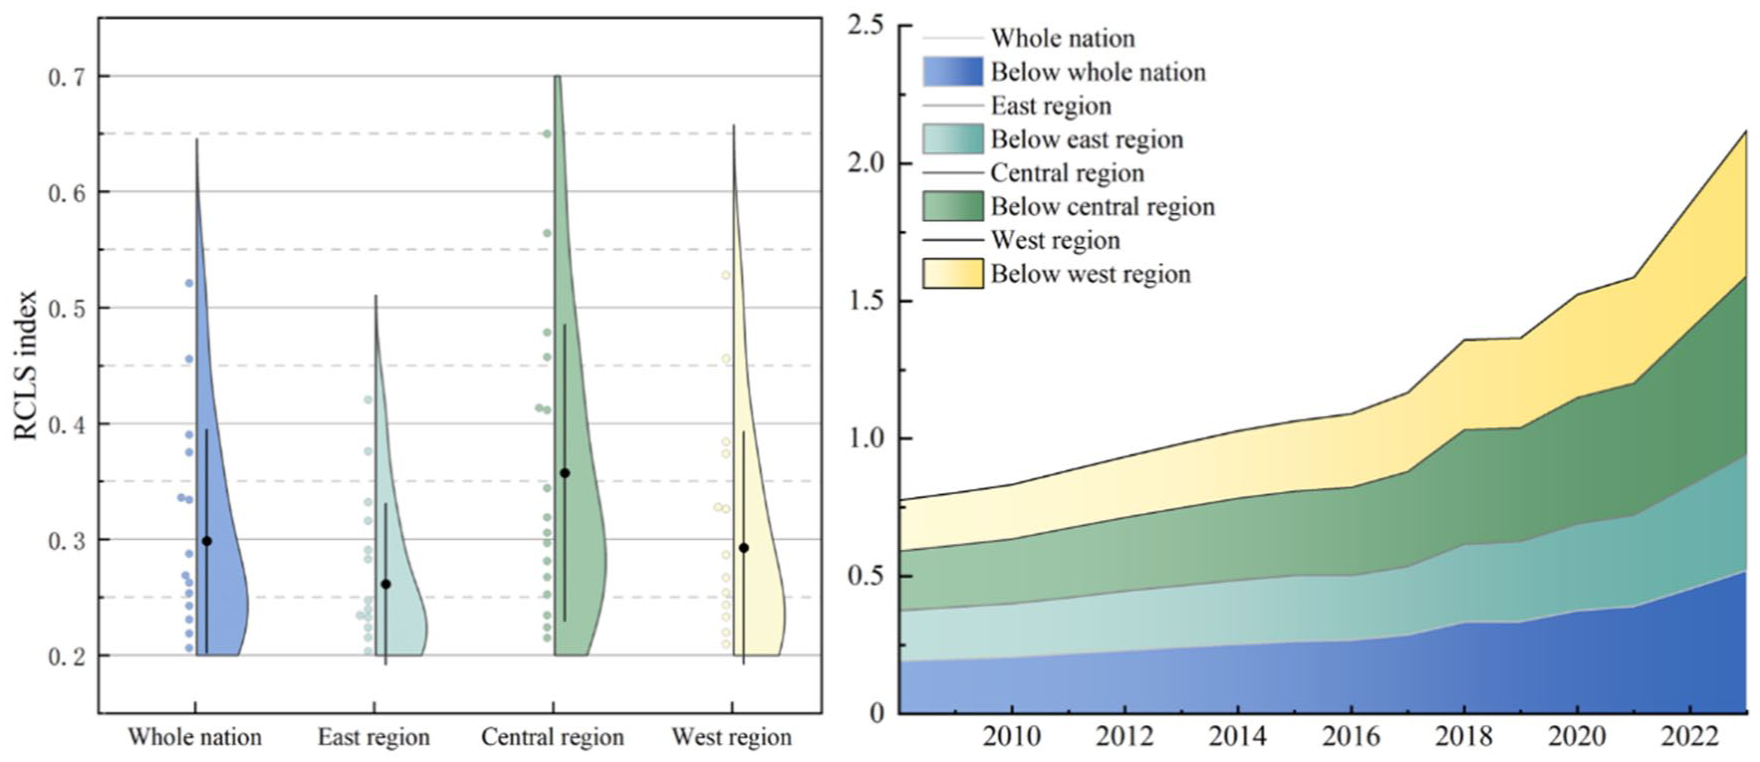
The overall situation of RCLS.
Second, the RCLS of the central region (0.3574) are obviously better than those of the western region (0.2929) and the eastern region (0.2616). During 2008–2018, the difference between the RCLS of the three regions mentioned above was not significant. Since 2018, the growth rate in the eastern region has been sluggish. The growth rate in the central region has increased significantly. The growth rate in the western region is similar to the national trend. The average annual increase in the eastern region is 1.48%, which is lower than the national average. This situation is primarily the result of the relatively mature economic development in the eastern region and the expansion of developed land, which has resulted in the shrinkage of cultivated land, the destruction of the tillage layer, and a relative shortage of reserve cultivated land resources. During the study period, the growth rates of RCLS in the central region were the highest, with an average annual increase of 2.72%. Among all areas, Heilongjiang, Anhui and Henan have the highest growth rates. In contrast, the central region has benefited from superior agricultural background conditions, policy support under the national food security strategy, as well as the rapid process of agricultural scale and modernization. It has achieved remarkable results in terms of cultivated land protection, ecological development and green production technology promotion, thus laying a solid foundation for the improvement of RCLS. This shows that there are still obvious interprovincial differences in RCLS.
Spatial evolution pattern of RCLS in China
In accordance with previous studies, the natural breakpoint method is used to divide the resilience level of each region into low-resilience areas, medium–low-resilience areas, medium-resilience areas, medium–high-resilience areas and high-resilience areas in ArcGIS software (Miao et al., 2024). The natural breakpoint method is based on the statistical distribution characteristics of the data itself to find the best classification interval, so as to minimize the internal differences of each category and maximize the differences between categories, so as to objectively reveal the spatial differentiation pattern of resilience level. Thus, the pattern of spatial evolution exhibited by RCLS can be analyzed. The outward radiation of the ‘northwest–northeast’ core high-resilience gathering area is shown in Figure 5, and spatial differences are evident in each region. The influence of the RCLS in Heilongjiang, Inner Mongolia and other northern provinces radiates outward.
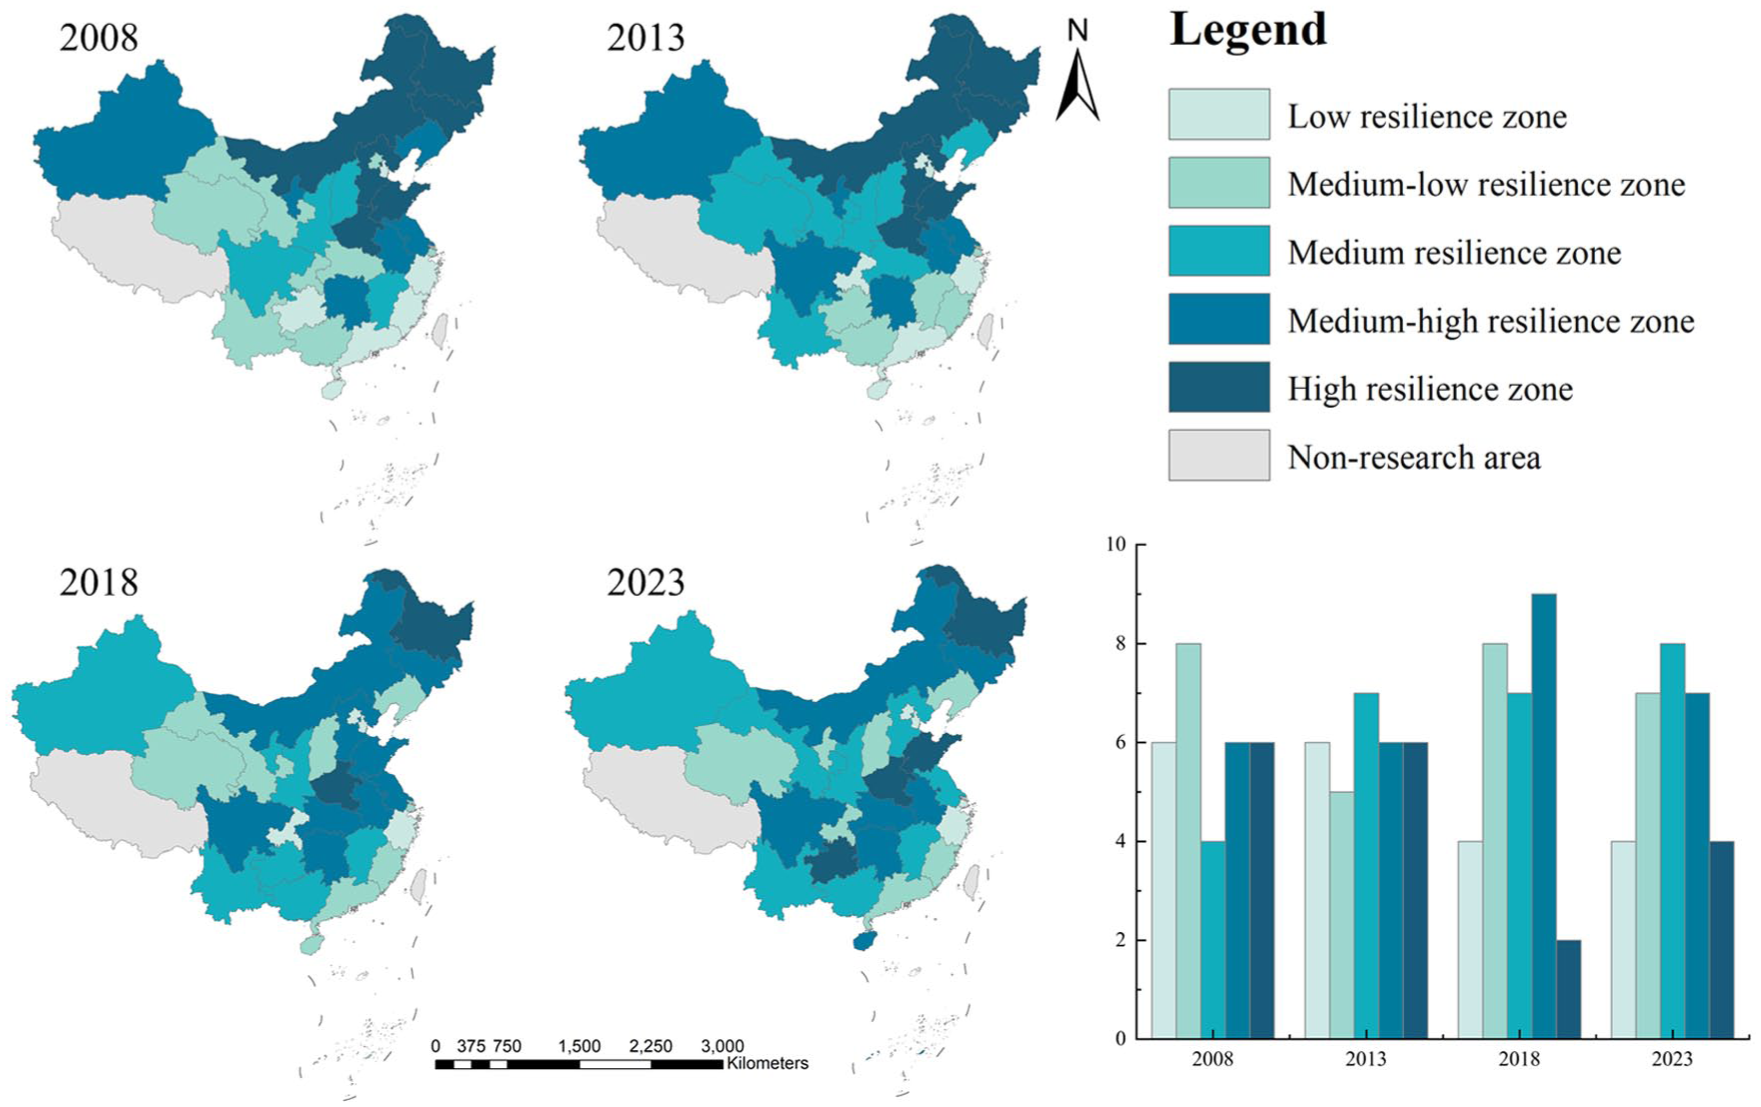
Spatial evolution pattern of RCLS in China.
In the northeast, the leading effect gradually weakened, but the overall spatial pattern of RCLS was more stable. Namely, the problem of black land degradation in Northeast China is particularly prominent. In the early stage, uncontrolled urban expansion in eastern China led to dual pressures of quantitative loss and qualitative degradation of cultivated land resources. However, eastern China benefits from various conservation measures, such as the vigorous promotion of ecological remediation, strict control of nonpoint source pollution, excessive fertilization and adoption and dissemination of conservation tillage practices.
The cultivated land in the eastern region is flat terrain with abundant precipitation. These conditions are suitable for producing high-quality agricultural products, and this land also has advantages in terms of location, labor, capital and technology. The optimization trend of RCLS is significant. In general, the pattern of RCLS has developed from dispersion to agglomeration, which has formed a basic spatial pattern. The quantitative structural changes in the medium–low-resilience area, medium-resilience area and medium–high-resilience area tend to be stable. However, areas with low resilience, weak infrastructure and a low capacity to face risks persist. It is necessary to formulate effective measures to improve RCLS as soon as possible. High-resilience gathering areas have failed to maintain regional advantages, attract resources such as capital, technology and talent, and promote the integration of the RCLS of surrounding areas into the national RCLS.
Spatial correlation pattern of RCLS in China
Global correlation features
The global Moran’s index of RCLS from 2008 to 2023 is calculated with the assistance of GeoDa software. The global Moran’s index values passed the significance test at the 1% or 5% level. The overall fluctuation was large, with a downward trend. The global Moran’s index initially declined but then began to rise in 2010, reaching its peak of 0.2770 in 2014. Broadly speaking, the reason for these findings is that the government proposed reinforcing cultivated land protection and enhancing the system of cultivated land requisition–compensation balance, which ensured that the red line of cultivated land protection was not broken and guaranteed food security. From 2014 to 2017, the index fluctuated from 0.2420 to 0.2770, indicating a significant positive correlation. The correlation is stable in this range, thus indicating that RCLS show a stable optimization trend. The index was stable from 2018 to 2021 and subsequently decreased to 0.2190 by 2023 (Table 5).
Global Moran’s index.
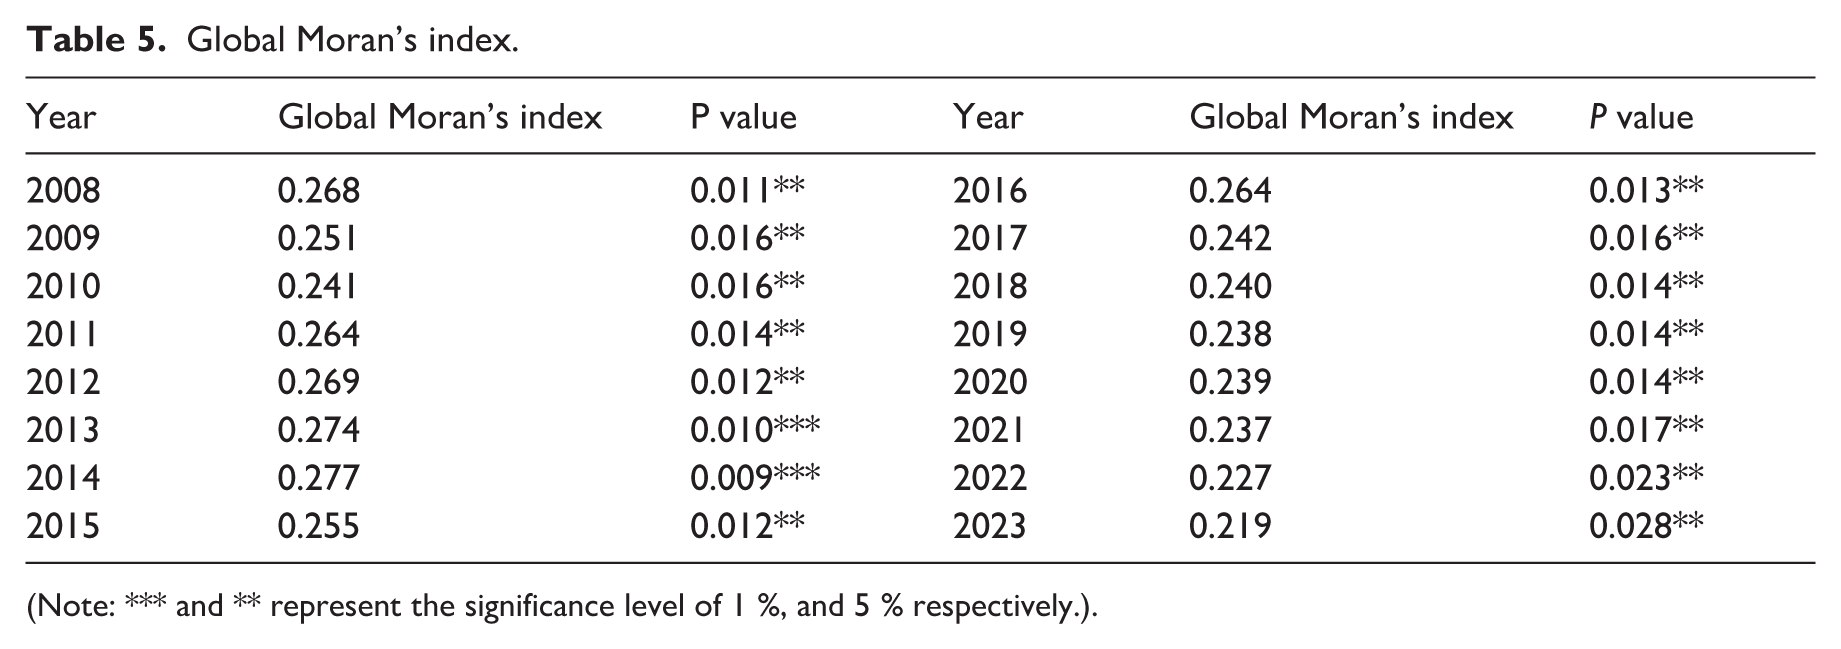
(Note: *** and ** represent the significance level of 1 %, and 5 % respectively.).
The main reason for this change is related to the acceleration of urbanization and the profound transformation of the social and economic structure. The scale of developed land continues to expand, directly encroaching on the high-quality cultivated land around the edge of the city and destroying the spatial integrity and functional continuity of the cultivated land system, resulting in the expansion of regional RCLS level differences and the weakening of spatial linkage effects. In 2023 particularly, the demand for developed land around the country rebounded significantly because of economic recovery, thereby weakening the overall spatial autocorrelation intensity of the cultivated land system and reflecting the urgent need to coordinate the contradiction between cultivated land protection and economic development against the background of high-quality development.
Local correlation features
The global Moran index reveals the spatial dependence of RCLS in general, but does not identify the specific location and type of agglomeration. In order to explore its spatial heterogeneity, this research focuses on an analysis of the Moran index from 2008 to 2023 and a mapping analysis of the national RCLS in 2008, 2013, 2018 and 2023 (Figure 6). The spatial correlation of the national RCLS was high from 2008 to 2014. After 2014, the spatial agglomeration weakened, and the spatial correlation became less obvious. In 2018 and 2019, the degree of spatial correlation increased briefly; however, the degree of spatial correlation subsequently decreased once again. After 2020, the spatial correlation of the national RCLS was not obvious. The local spatial pattern changed from the northwest high to the central high.
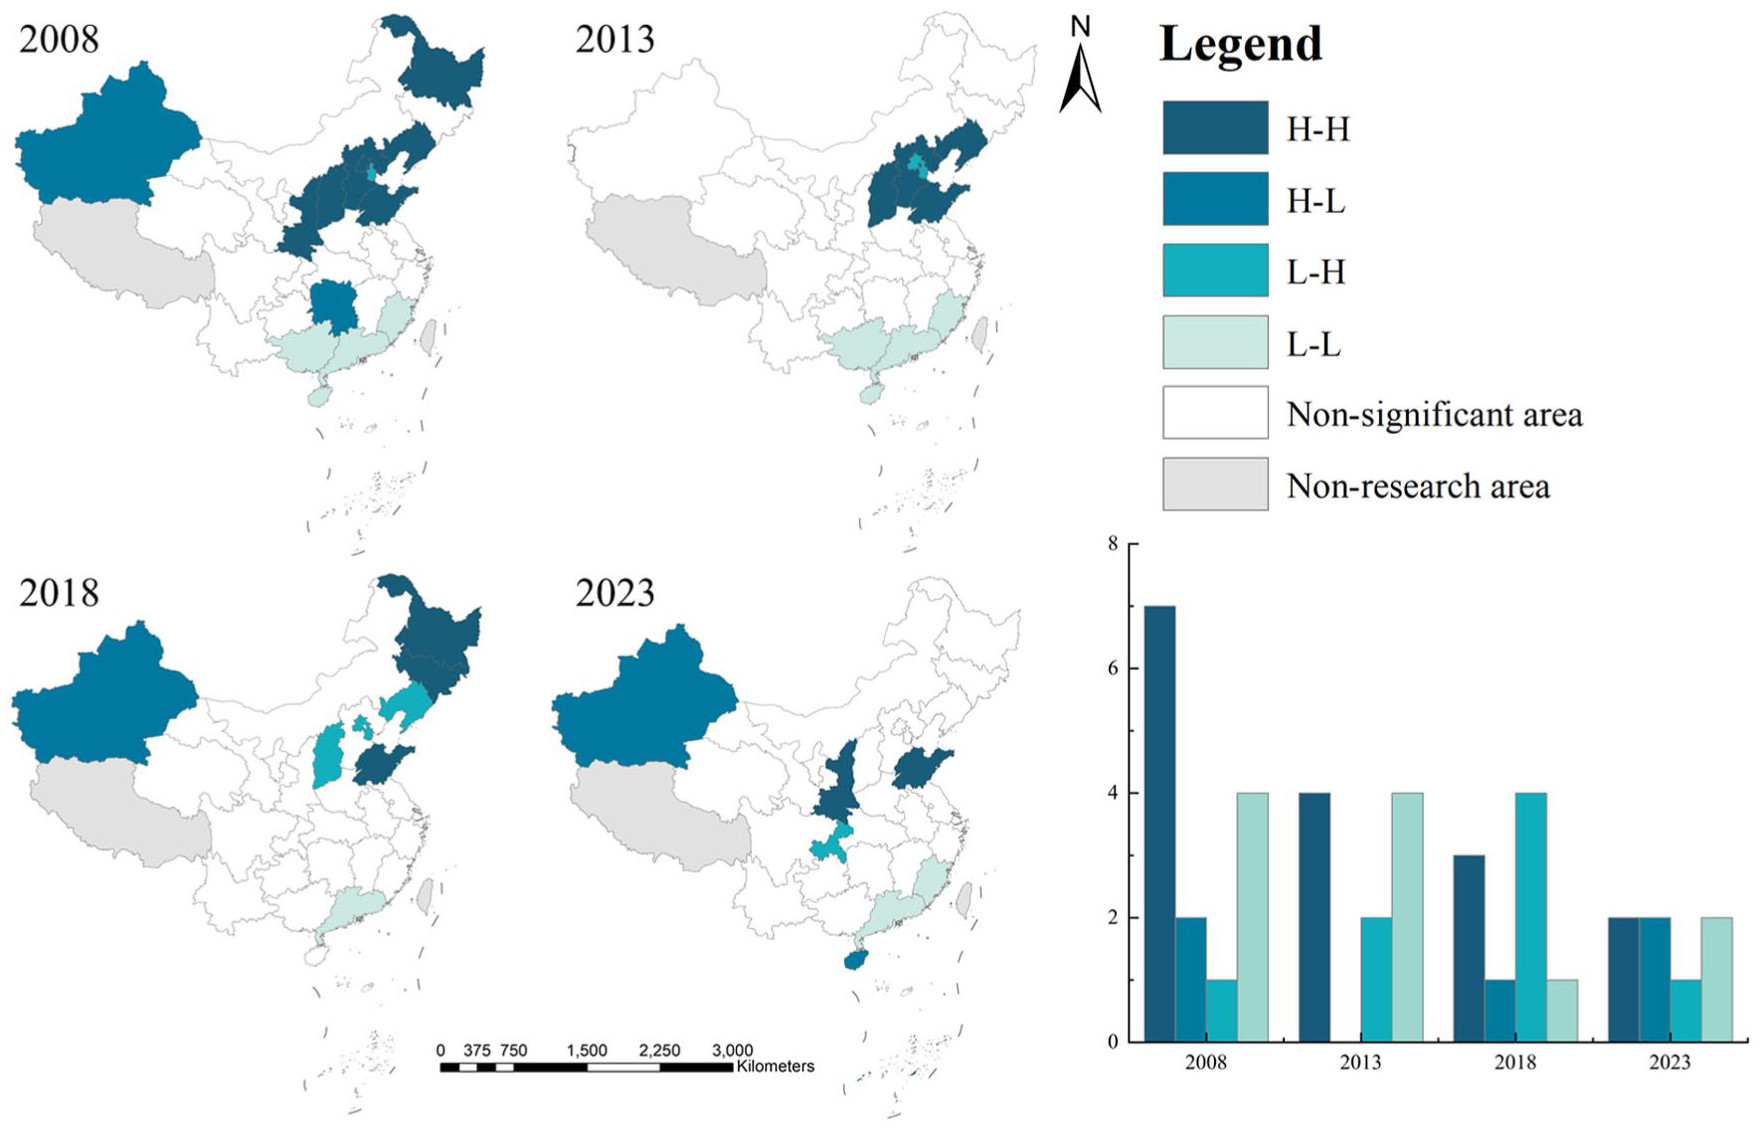
LISA of RCLS.
The ‘H–H’ agglomeration shows strong persistence and is concentrated mainly in Shandong and Liaoning. Correspondingly, the agglomeration situation in other regions is characterized by significant volatility. This is the result of superior natural background conditions, high-intensity agricultural inputs and concentrated policy dividends, which ultimately manifests as the efficient spatial agglomeration of the resilience of the cultivated land system. The stable existence of this type of region is an important reason for the early increase of global high aggregation. The ‘H–L’ agglomeration area is relatively stable in Xinjiang, showing an ‘island’ state where the high toughness value is surrounded by the low value area. The ‘L–H’ agglomeration areas are mostly adjacent to ‘H-H’ agglomeration areas, such as Tianjin and Chongqing. In 2008, the agglomeration of Beijing, Hebei, Shandong and other places was particularly prominent, forming a high toughness linkage development zone. However, after 2018, the agglomeration effect gradually weakened, reflecting the lack of power of the high-value area to the surrounding radiation belt, which was consistent with the downward trend of global correlation. The ‘L–L’ agglomeration areas are concentrated in Fujian, Guangdong and other provinces. The contiguous existence of these low-ductility areas constitutes a spatial depression, which lacks effective spatial interaction with high-value areas, further exacerbating the weakening of global spatial correlation.
In summary, RCLS has shown obvious spatial agglomeration at the national and provincial levels, but this phenomenon has weakened in recent years. This suggests that it is necessary to strengthen inter-regional coordination, through policies, infrastructure and benefit-sharing mechanisms, to promote the effective radiation of high-toughness areas to drive the surrounding areas, thereby enhancing the integrity and balance of the resilience of the cultivated land system.
Driving mechanism associated with of RCLS in China
In this paper, the average value of the GTWR regression coefficient from 2008 to 2023 is selected, and the spatio-temporal differentiation characteristics of the factors influencing RCLS in China are analyzed. The data from 2008, 2016 and 2023 are visualized with the assistance of ArcGIS 10.2 software from four perspectives: green ecology, economic development, social support and engineering guarantees (Figure 7).
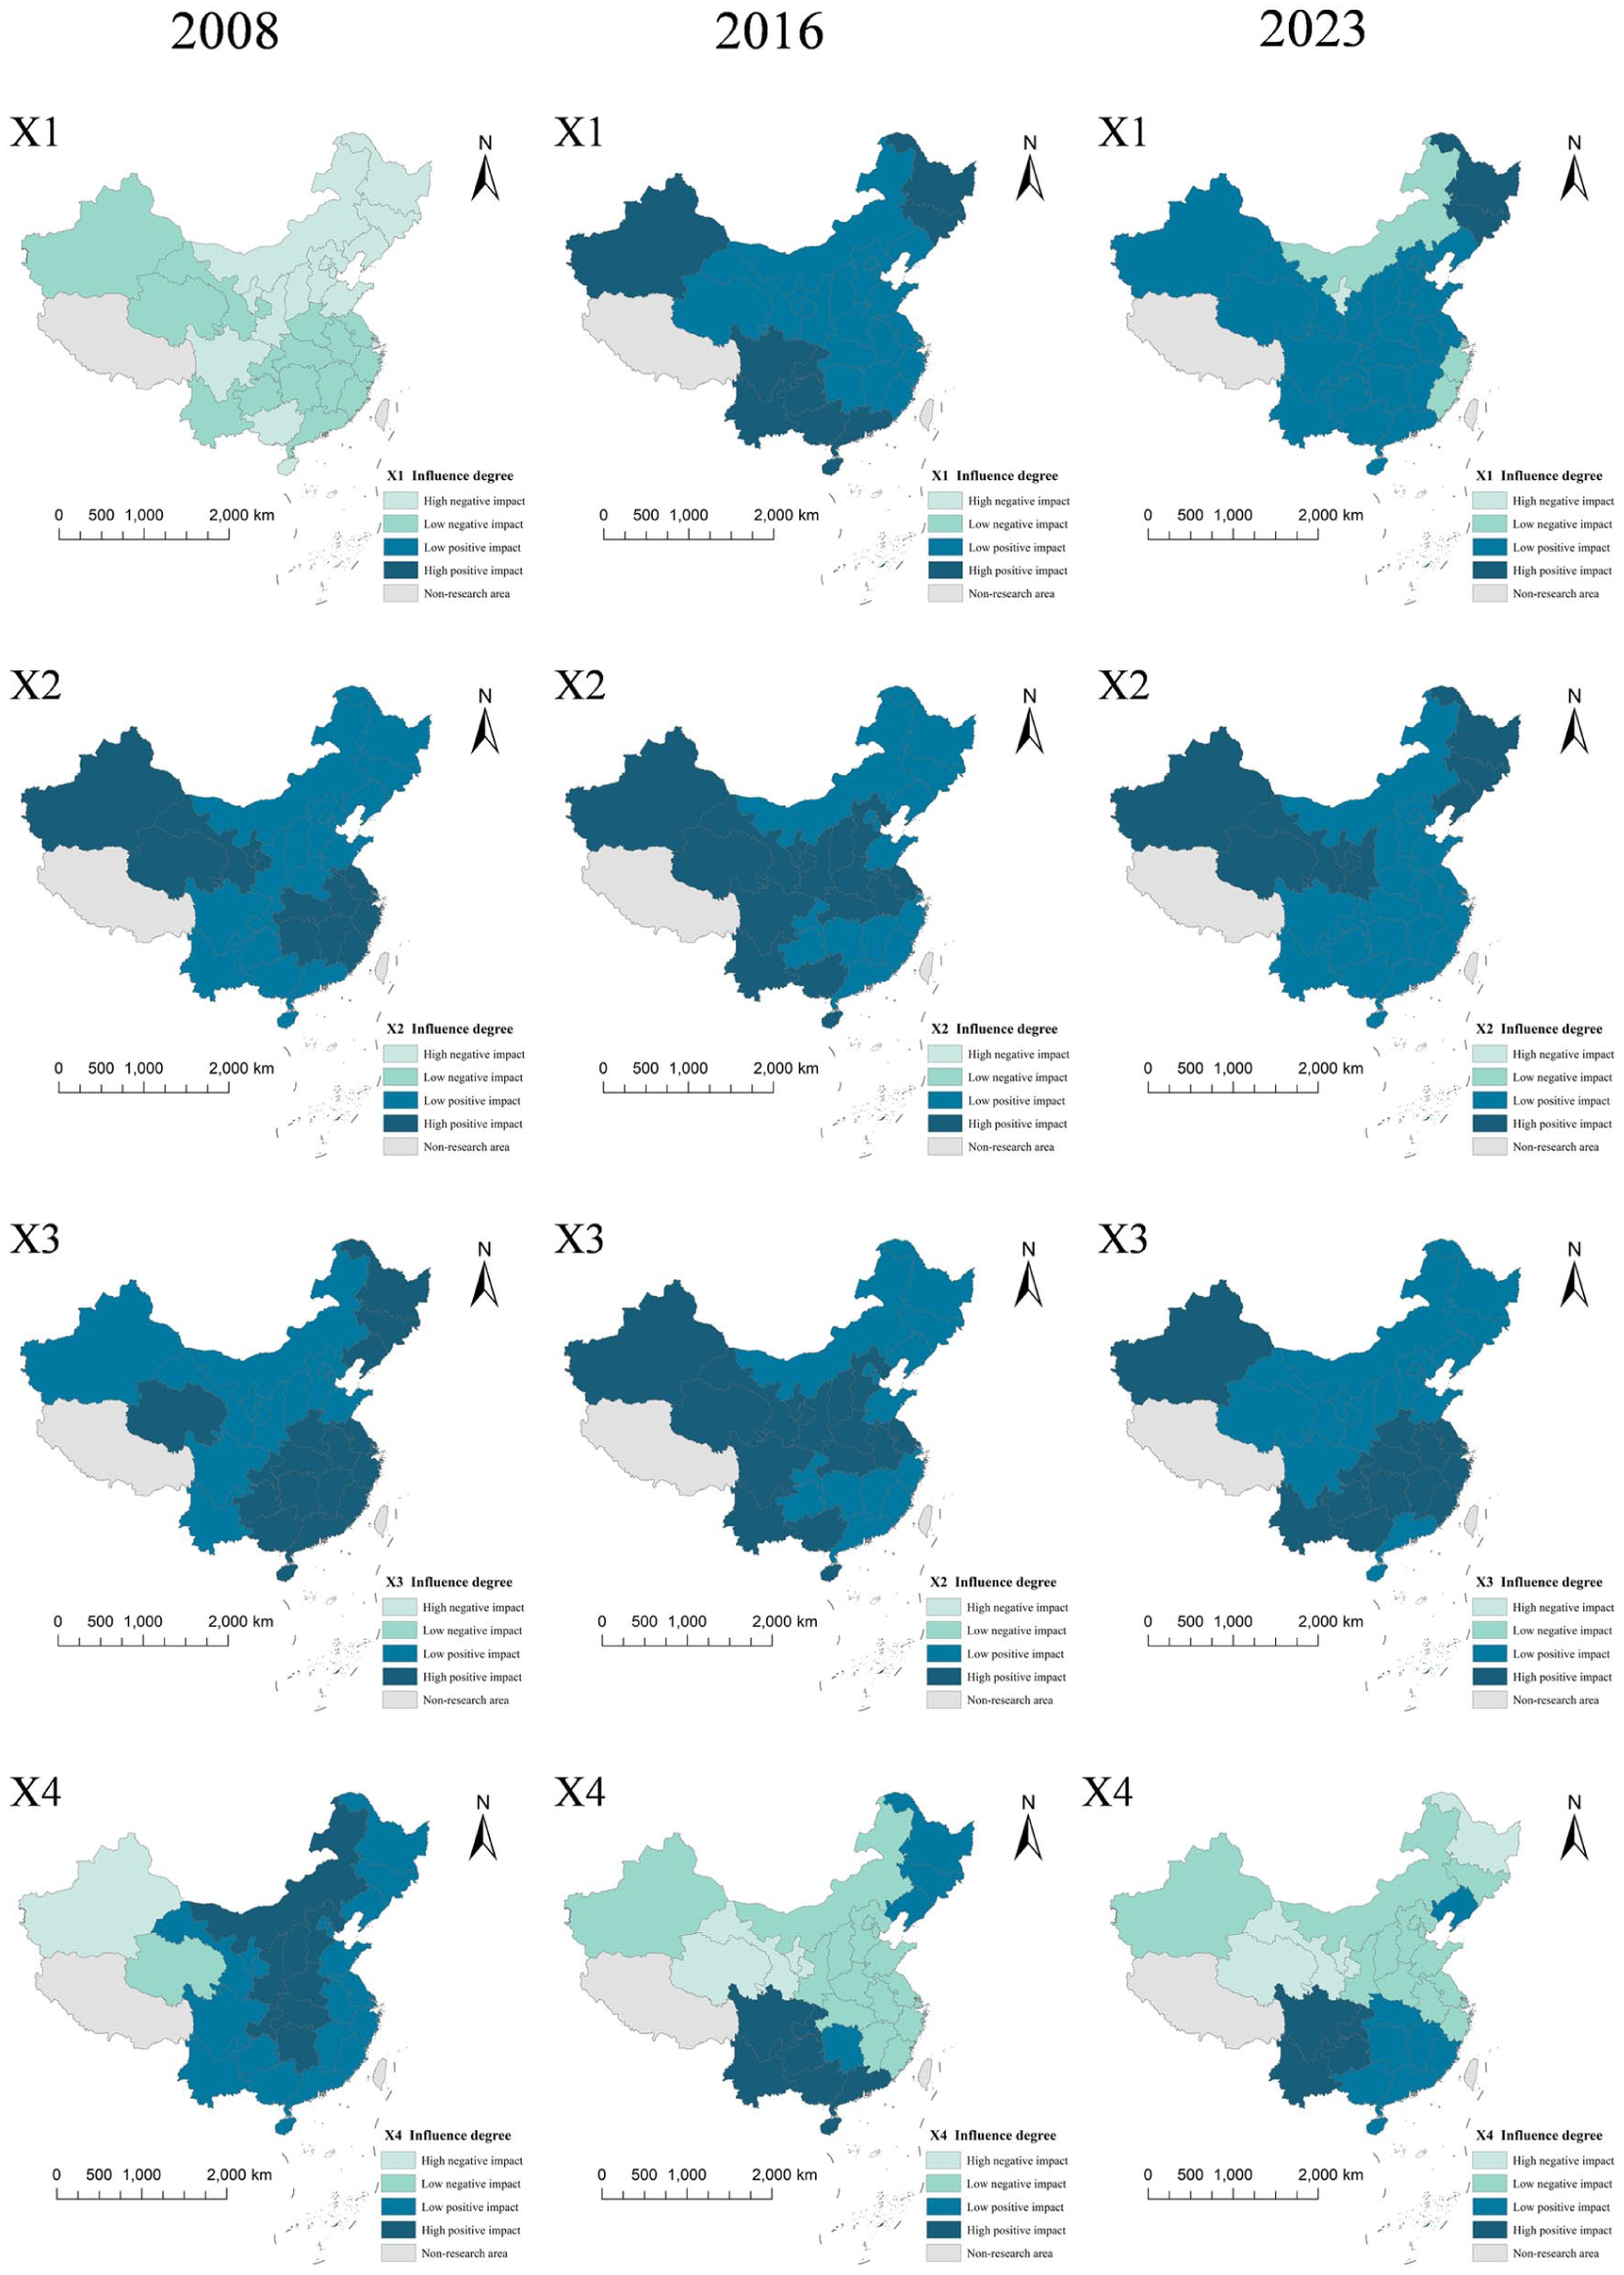
The spatial and temporal distribution of the influencing factors level of RCLS.
First, green ecology. There was a positive correlation between straw returning and RCLS in general. In 2008, the regression coefficient was between -0.0552 and -0.1538, showing a negative correlation. With the passage of time, the correlation changed from negative to positive, and by 2016, it was generally positive nationwide. After 2023, the regression coefficients of most provinces remain positive, although some eastern provinces such as Fujian and Zhejiang still show a negative correlation. Among them, the region with the highest positive correlation intensity appeared in Heilongjiang Province, with a coefficient of 1.5475, indicating that straw returning was particularly closely related to the improvement of RCLS in the province. It is worth noting that the range of the high value area of the regression coefficient is gradually narrowing, suggesting that the positive correlation between straw returning and RCLS is weakened in the later period.
As an agricultural recycling measure, straw return has the potential advantages of enhancing soil aggregation, increasing the organic carbon content and optimizing cycling processes. However, technical implementation bias in practice may weaken the expected benefits of this factor. For example, the negative effects in 2008 may have been related to the insufficient depth of straw return, improper regulation of the carbon–nitrogen ratio and unsatisfactory decomposition conditions, which can easily lead to short-term inhibition of soil microbial activity, nutrient fixation and even crop emergence obstacles. Therefore, the promotion of straw return should be combined with regional characteristics, and technical adaptation and agronomic matching should be strengthened to maximize the positive ecological role of this factor.
Second, economic development. The impact of the agricultural structure on the RCLS in this context was positive, and the overall trend was ‘high in the west and low in the east’. The areas with high positive regression coefficients are stably distributed in the western regions of Xinjiang, Qinghai, Gansu and Ningxia. The highest value changed from 0.2860 in Qinghai to 2.0616 in Heilongjiang, and the impact gradually increased. In addition, the high positive area shows significant spatial dynamic changes. In the initial stage, the high positive area is located mainly in eastern coastal areas such as Jiangsu, Zhejiang and Fujian and then gradually shifts inland to central provinces such as Hubei, Henan and Anhui. In 2023, the highly positive area is stable in the three northeastern provinces, with coefficients greater than 1. This shows that the positive correlation between agricultural structure and RCLS is the strongest in the west, relatively weak in the middle and east, and the overall correlation strength changes with time. The diversified development of the agricultural structure helps promote the development of characteristic agriculture and advantageous industries in the western region.
A reasonable agricultural structure is conducive to efforts to protect and improve the ecological environment in the western region. Notably, the process of optimizing the agricultural structure in some areas is not smooth, and the potential advantages of advantageous agricultural structures are not fully understood.
Third, social support. The education levels attained by farmers have a significant positive effect on RCLS, and its spatial distribution is characterized as ‘high around, low in the middle’. In general, the regions with highly positive regression coefficients are concentrated mainly in the central regions of Hunan and Hubei and the western regions of Chongqing and Guizhou. The highest value increased from 0.6071 in 2008 to 0.9290. The data for each year indicate that the highly positive areas are distributed around the four provinces and cities mentioned above. The areas with positive regression coefficients show a stable trend over the period studied, which is maintained between 0.2753 and 0.9290. The results show that the positive correlation between farmers’ education level and RCLS remained stable and did not change significantly during the observation period.
Specifically, the higher the level of a farmer’s education is, the stronger that farmer’s ability to adopt advanced technologies, implement scientific management and optimize resource allocation in agricultural production practices. These farmers tend to better understand and implement soil protection measures, such as rational fertilization, straw return and rotation systems, more accurately and to promote the development of eco-friendly farming methods to maintain soil fertility and ecological balance more effectively.
Fourth, engineering guarantee. The scale of high-standard farmland is mainly negatively correlated with RCLS, showing the differentiation characteristics of ‘positive in the south and negative in the north’ in space. For example, in southern regions such as Guangxi, Guangdong, Fujian, Yunnan and Sichuan, the regression coefficient is positive, and the highest is 0.4248 in Sichuan. On the contrary, in the central and northern regions, it shows a strong negative correlation, and the intensity of negative correlation increases with time. By 2023, Gansu will become the region with the strongest negative correlation.
This paper revealed significant north–south spatial differentiation in the correlation of high-standard farmland scale on RCLS, including positive driving in the south and negative driving in the north. The negative driving effect of high-standard farmland scale in the northern region is essentially a systematic response caused by the intensity of human intervention exceeding the threshold of regional resource and environmental carrying capacity. Specifically, in arid and semi-arid areas such as Gansu Province, water resources are in a tight balance. The surge in irrigation demand brought about by large-scale high-standard farmland construction has either intensified the predatory exploitation of deep groundwater or induced soil secondary salinization due to improper irrigation methods, resulting in a continuous weakening of the ecological background. At the same time, some projects have a structural mismatch in the construction, which makes the farmland facilities lack regional pertinence and long-term management and protection. It not only fails to alleviate the resource pressure through technological upgrading, but also enlarges the negative disturbance to the cultivated land resource system due to the mismatch of the system, and finally shows the dilemma of scale expansion and bearing capacity decline.
Discussion and policy implications
Differentiation analysis of the results of this research
In this paper, RCLS are described as the ability of cultivated land to maintain its production capacity, ecological function and social service ability when the land is subjected to environmental and anthropogenic drivers. High RCLS are important with respect to efforts to cope with the negative impacts of climate change and human activities and promote the green transformation of agriculture. This factor enables the structure and function of the system to be stable after an external disturbance. Moreover, high RCLS enables the system to adapt to new cycles of disturbance, thereby achieving the sustainable development of farming. In this context, this paper introduces the concept of agricultural green transformation into the research on RCLS and combines the sustainability of agricultural production with the health and stability of RCLS.
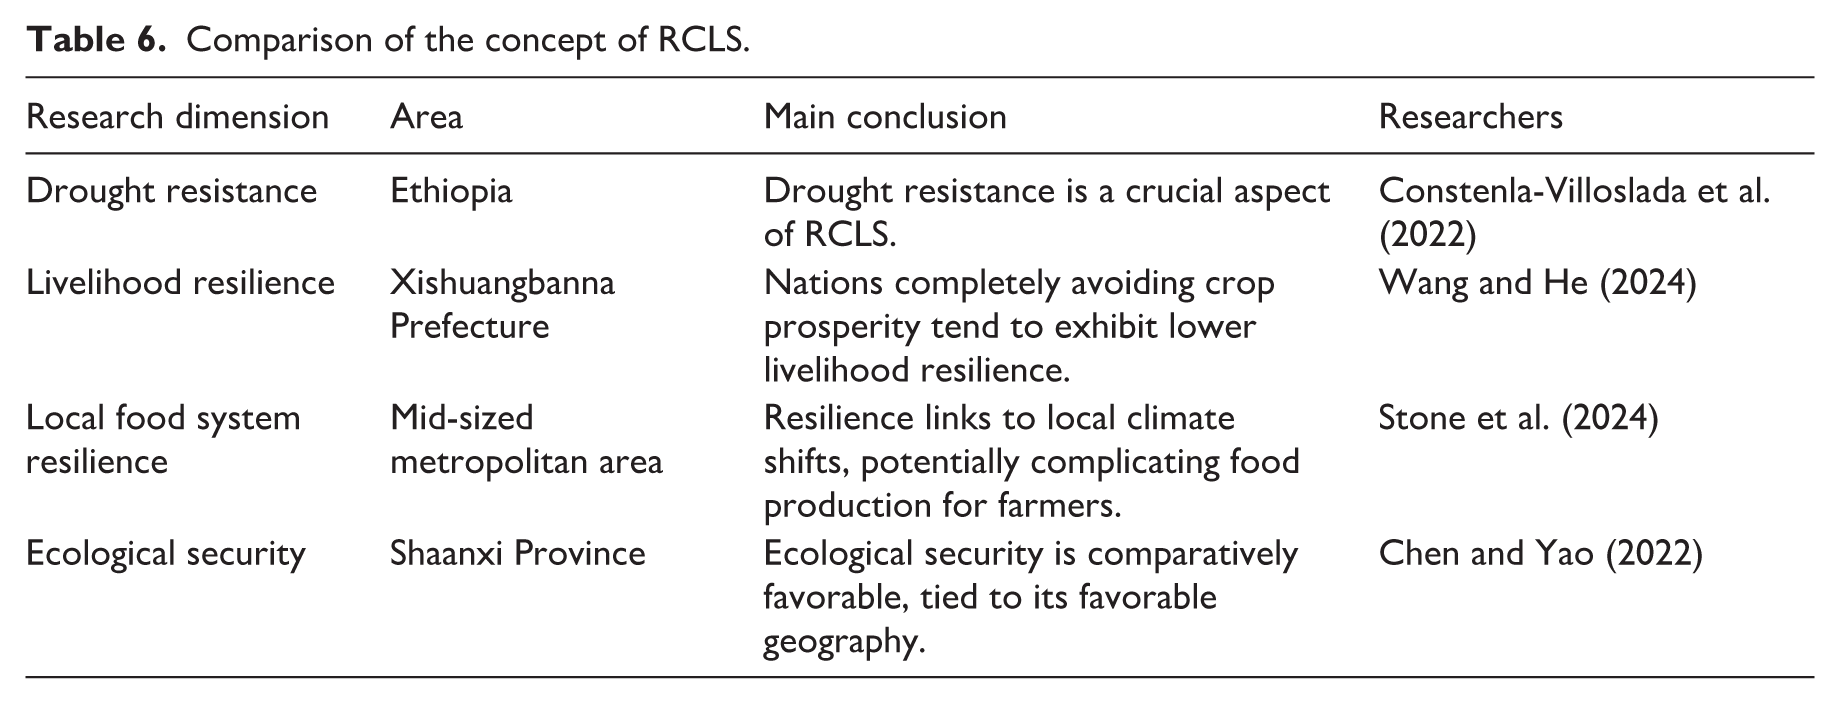
Different scholars have investigated the concept of RCLS in different disciplines (Table 6). Constenla-Villoslada et al. (2022) combined satellite observations with quasi experimental impact assessment methods to measure the recovery of land productivity and resilience to weather shocks in arid areas of Ethiopia. Most of the methods involve causal inference, but the explicit spatial analyses in this context remain slightly insufficient. In addition, Wang and He (2024) and Stone et al. (2024) studied RCLS from the perspective of the resilience of farmers and producers. When farmers can obtain land and markets more effectively, crop prosperity may provide them with more possibilities to pursue agricultural diversification and livelihood expansion to increase their livelihood flexibility. Research on this topic has been successful in revealing microscopic mechanisms, but the scale of such research has often been limited to the local level. The paper verifies the positive driving effect of social resilience on RCLS at the provincial level, which links the micro mechanism with the macro pattern to a certain extent, indicating that improving human capital is an important way to enhance the resilience of regional cultivated land system. In terms of index selection, Chen and Yao (2022) assessed the comprehensive status of socio-economic conditions, resource and environmental aspects, and ecological security in Shaanxi Province, delving into ecological security assessment metrics such as per capita energy and water usage. However, its indicators focus more on static pressure and pay only limited attention to the system’s dynamic response and negative environmental impact. Their research focuses on the static assessment of resource and environmental pressure and ecological security. When constructing the ecological resilience dimension, this study incorporates the negative environmental impacts such as agricultural non-point source pollution into the framework, which is more in line with the dynamic connotation of the resilience theory that the system withstands interference and makes adjustments. It is an important expansion of the traditional static assessment indicators.
Comparison of the concept of RCLS.
In summary, the findings of this paper and the existing literature not only corroborate each other, but also promote the research. The results show that the spatial pattern of RCLS is highly consistent with the local climate and socio-economic conditions, which emphasizes the importance of selecting a reasonable research scale. Future research needs to further explore the analytical framework of multi-scale coupling and select research scales that adapt to the characteristics of different regions to reveal the formation and evolution mechanism of the resilience of cultivated land system more comprehensively and deeply, so as to provide a solid scientific basis for differentiated agricultural green transformation policies.
Hidden causes of resilience for the double ladder type
In this paper, by reference to provincial-scale panel data from China, the new requirements of agricultural green transformation on RCLS were analyzed based on the definition of RCLS, after which the index system framework of RCLS was constructed. The spatio-temporal evolution characteristics and four-dimensional driving factors of RCLS in the study area were discussed on the basis of spatial autocorrelation and a geographical detector.
The conclusions are as follows: RCLS in China exhibit a double-step fluctuating upward trend, and the coordination of the internal structure of the cultivated land system is enhanced. In 2008, the initial point was the lowest point of 0.1926. Subsequently, this value slightly increased until 2018, when it increased sharply overall to 0.5211 in 2023 (Figure 8). First of all, the promotion of green technology has achieved remarkable results. After experiencing the early technical running-in, straw returning has generally turned into a positive correlation nationwide after 2016, which has become a key ecological factor to promote the improvement of RCLS. Secondly, the optimization of agricultural structure has a stronger positive correlation in the western region, and its high-value area has gradually shifted from the eastern coast to the inland and northeast regions, confirming the differential contribution of industrial layo ile its ecological cost needs to be carefully evaluated in areas with pro ut adjustment to the improvement of resilience. Thirdly, the positive impact of farmers’ education level is stably distributed in the central and western regions, indicating that human capital accumulation constitutes the social basis for the continuous improvement of resilience. Finally, high-standard farmland construction is positively correlated in areas with favorable hydrothermal conditions in the south, while its ecological cost needs to be carefully evaluated in areas with prominent water resource constraints in the north. The in-depth implementation of national policies, such as “storing grain in the land” and rotation and fallow, is through the activation of the mechanism path: First, promote the implementation of green technology; then, guide the adjustment of agricultural structure, strengthen the capacity building of farmers; and finally, realize the coordinated enhancement of the internal structure coordination of the cultivated land system and grain production capacity.
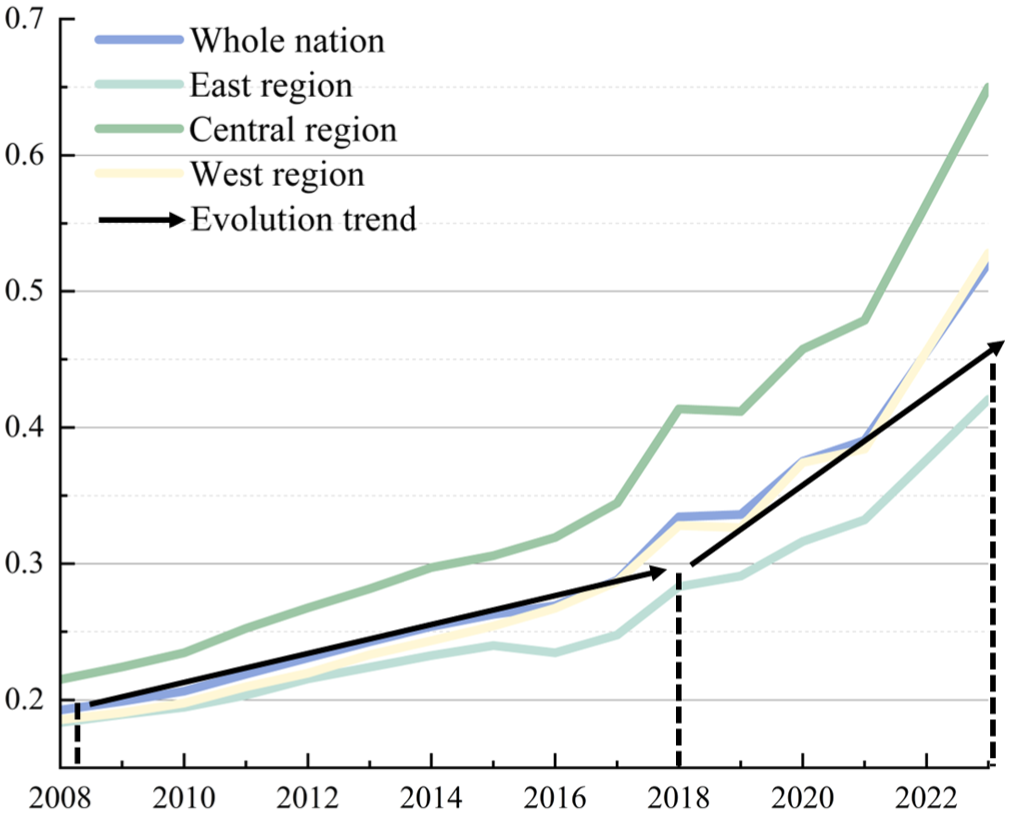
Trend of the four areas’ RCLS.
Limitations and prospects
In light of the new requirements of green agricultural development and the rapid development of China’s economy and society, cultivated land resources are facing unprecedented pressure. In this context, the proposal of agricultural green transformation provides new ideas and methods for protecting cultivated land and ensuring food security. Resilience theory provides a new perspective on agricultural green transformation. Research on RCLS has reached a certain consensus, thus laying a foundation for the application of resilience theory in cultivated land systems.
However, there are still some limitations in this paper. In terms of analysis scale, this paper takes provincial administrative units as the basic analysis unit, mainly based on the consistency of provincial statistical data and the consideration of policy implementation unit. Although this scale is conducive to revealing the macro pattern and benchmarking provincial policies, the functions and processes of the cultivated land system are often controlled by natural boundaries and do not fully coincide with administrative boundaries. Therefore, the analysis at the provincial level may cover up the geographical heterogeneity within the province to a large extent. For example, there may be significant differences in the resilience of cultivated land in different watersheds or ecological types in the same province, which affects the in-depth identification of local mechanisms and differentiated governance strategies. In addition, due to the limitations of data availability and model complexity, this paper failed to incorporate key external disturbance factors such as the implementation of regional farmland protection policies, the frequency and intensity of extreme climate events into a unified analysis framework, which may lead to incomplete evaluation of policy intervention and climate impact effects, and to a certain extent affect the systematic analysis of the formation and evolution mechanism of RCLS. Future research can explore the following aspects: how to reveal the relationship between external disturbance factors and RCLS on a finer scale such as city and county, combined with natural geographical units. Try to figure out how to more effectively integrate the ‘resilience concept’ into the index system construction of ecological and engineering dimensions.
Policy implications
To increase agricultural resilience and sustainability, targeted regional strategies are essential: First, for the ‘L-L’ agglomeration areas in eastern coastal areas such as Fujian and Guangdong, the RCLS values in these areas have been low for a long time and form spatial depressions. According to the results of GTWR model, the synergistic potential of straw returning and other technologies have not been fully utilized. Therefore, the focus of the policy should be to break the low-level equilibrium. The core objective is to strengthen the quality and efficiency improvement and precise management of high-standard farmland construction, and to cooperate with the promotion of suitable straw returning and soil improvement technologies. At the same time, the construction of disaster early warning system should be strengthened to systematically improve the basic level of resilience in the region and prevent its negative spillover to the surrounding areas. Second, for ‘H-H’ agglomeration areas such as Shandong and Liaoning, these areas are stable high-toughness cores. The research shows that the optimization of agricultural structure and the education level of farmers have a continuous positive effect on RCLS in such areas. The policy focus should focus on consolidating advantages and radiation driving. While continuing to deepen the upgrading of agricultural industrial structure and strengthen the training of professional farmers, it is necessary to spread successful technical models and management experience to the surrounding areas, especially the ‘L-H’ transition zone, through cross-regional cooperation mechanisms, so as to exert its positive spatial spillover effect. Third, in the process of optimizing resource endowment according to local conditions, some western regions with low resilience should coordinate the relationship between high-value agricultural development and cultivated land protection (Wang et al., 2019). Ecologically fragile areas such as Xinjiang and Gansu should gradually reduce the cultivation of high water-consumption crops and implement water-saving and drought-resistant agriculture. Moreover, the behavior of nongrain production should be strictly regulated in line with the goal of ensuring food security, high value-added industries such as characteristic fruits and vegetables and Chinese herbal medicine should be developed to a moderate degree, and ecological protection, the sustainable use of cultivated land and rural income should be promoted. Fourth, as the rural labor force transitions to a new context, investment in agricultural technology is crucial, particularly with respect to the inputs of seeds and machinery, with the aim of promoting the adoption of green production technologies. Fiscal incentives and tax breaks should be provided to encourage eco-friendly farming practices while strengthening the agricultural chain to add value to products and incentivize sustainable land use.
In the context of efforts to enhance RCLS, facilitate the green transformation of agriculture, and achieve the objectives outlined in Sustainable Development Goal 2, strategies for agricultural development must ensure a balance between current needs and the long-term sustainability of ecosystems.
Conclusions
This paper delineates the concept of RCLS and examines its dynamics in the context of agricultural green transformation. To construct panel data for 30 Chinese provinces and cities, an index system encompassing ecological, economic, social, and engineering resilience is developed. The evolutionary path and factors influencing RCLS in China from 2008 to 2023 were investigated on the basis of the entropy weight method, exploratory spatial data analysis, and the GTWR model. The key findings are presented below.
RCLS across 30 provinces in China steadily increased from 0.1926 in 2008 to 0.5211 in 2023, with an average annual increase of 2.05%. However, the eastern region lags, with an average annual growth rate of 1.48%. In contrast, the central region and western region exhibit a fluctuating upward trajectory, with average annual growth rates of 2.72% and 2.14%, respectively. Spatially, the national RCLS reflect the spatial characteristics of the center-radial distribution. The results of this research indicate that the leading influence of the central region is diminishing, stabilizing the overall spatial pattern and establishing a basic distribution pattern of the national cultivated land system. Straw return, the agricultural structure, the farmers’ education level and high-standard farmland scale are the main factors affecting RCLS, in which context straw return and the agricultural structure have positive effects; however, this positive effect gradually weakens over time. Education level has a positive effect, with no significant change. The high-standard farmland scale has a negative effect, which increases gradually.
The strategic application of RCLS theory is crucial for efforts to adapt to environmental changes and uncertainties. In light of the findings of this research, future efforts should focus on advancing green production technologies and tailoring land management strategies to national conditions. The implementation of rational strategies can increase RCLS to address environmental changes, ensure food security in a manner that is consistent with human nutritional needs, and promote sustainable agriculture.
Footnotes
Funding
The authors disclosed receipt of the following financial support for the research, authorship, and/or publication of this article: This study was supported by the National Natural Science Foundation of China (No.42261049; 72473130); Jiangxi Provincial Natural Science Foundation (No.20232BAB203061); Jiangxi Provincial Social Science Foundation (No.25GL12) and Jiangxi Provincial Special Program for the Cultivation Young Early-Career Sci-Tech Talents (No.20244BCE5208).
Declaration of conflicting interests
The authors declared no potential conflicts of interest with respect to the research, authorship, and/or publication of this article.