
Abstract
The relationship between urbanization and soil health is currently a global concern. Therefore, it is necessary to quantify an urbanization indicator in the context of soil environmental pressures. Our study analyzed five core cities in the central Yunnan urban agglomeration to investigate the relationship between urbanization and soil heavy metal concentrations. The results show that soil heavy metal concentration in old urban blocks were higher than that in the new urban blocks with different urbanization contexts. We constructed a new Urbanization Environmental Pressure Index using a genetic algorithm. Segmented regression analysis indicated that there were often thresholds in the relationships between urbanization and heavy metal pollution; when urbanization exceeds the thresholds (between -0.502 and 0.260), soil heavy metal pollution significantly increased. The study also employed spatial correlation analysis to identify areas of heavy metal pollution caused by urbanization, which are mainly concentrated in old urban blocks. This research provides a new perspective for understanding the impact of urbanization on soil heavy metal pollution and offers a scientific basis for the prevention and control of urban soil heavy metal pollution.
Introduction
Human society is developing and progressing rapidly, and urbanization is an important manifestation of this. Urban areas, as the most intensive and concentrated regions of human socio-economic activity, disproportionately experience significant ecological and environmental impacts during the process of urbanization (Grimm et al., 2008). With the expansion of old cities and the establishment of new ones, human activities such as industrial production, transportation and construction activities have increased the emission of pollutants (Fang et al., 2017). These pollutants enter the soil through wastewater discharge and atmospheric deposition, causing soil contamination. Soil plays an important role in ecosystems, and its pollution also poses a threat to human health.
Urbanization has led to severe soil heavy metal contamination in Asia, Europe, and the Americas (Nezat et al., 2017; Qi et al., 2025; Różański et al., 2018). In China, soil heavy metal contamination has become more severe in the decades of rapid development following the reform and opening up, especially in industrialized and developed regions (Luo et al., 2015). The research of Li et al. (2020a) indicates that from 1989 to 2005, the increase in the concentrations of arsenic (As), nickel (Ni), copper (Cu) and zinc (Zn)was due to the transformation of land use patterns caused by urbanization. Heavy metals in soil can enter the human body through ingestion, inhalation, and dermal contact. Excessive intake of heavy metals (e.g. lead (Pb), As) can induce neurological diseases, damage kidney function, and even increase the risk of cancer (Doabi et al., 2018; Pan et al., 2018). Therefore, clarifying the impact of urbanization on soil heavy metal contamination and identifying key prevention and control areas are crucial for maintaining a healthy living environment.
The current research results on the spatial distribution characteristics of heavy metals under the urbanization gradient are not consistent. The urbanization features used are singular and cannot capture multiple environmental pressures, failing to fully reflect the relationship between urbanization and heavy metal pollution in soil. For example, Zou et al. (2024) used the percentage of impervious surface area as a proxy for the degree of urbanization, and their research results indicated that the degree of heavy metal pollution increases with the level of urbanization. Napoletano et al. (2023) divided the study area into urban, non-urban, and peri-urban areas based on geographical location and examined the spatial distribution characteristics of seven heavy metals (cadmium (Cd), Cu, iron (Fe), manganese (Mn), Ni, Pb, and Zn). Their findings revealed that the concentrations of Zn and Cu were highest in peri-urban areas, while the concentrations of the other five heavy metals were highest in urban areas. Li et al. (2019) analyzed the spatial distribution characteristics of heavy metals based on the intensity of human activities, and their results showed that heavy metal pollution was most severe in urban parks and residential areas, while agricultural fields had the lowest levels of pollution. Since soil heavy metal pollution is influenced by a variety of environmental factors, it is unscientific and unreasonable to analyze the impact of urbanization on soil heavy metal pollution based on a single environmental element.
There is a close and complex relationship between soil heavy metal pollution and the background of urban development. Industrial and agricultural activities, as well as changes in land use types and patterns during the urbanization process, profoundly affect the accumulation levels, distribution characteristics, and ecological risks of heavy metals in the soil. Zheng et al. (2023) found in their study on the spatial distribution characteristics of soil heavy metals in Baoding that industrial facilities are mainly located in the suburbs of Baoding. The waste, wastewater, and slag generated by these facilities enter the soil through atmospheric deposition, wastewater irrigation, and slag dumping. There is also polluted irrigation in suburban farmland, and a large amount of urban waste is landfilled in the suburbs, resulting in more severe soil heavy metal pollution in the suburbs than in the urban areas. Li et al. (2022) conducted a study on Lanzhou, a heavy industrial city in China. The results showed that the Xigu District, located upstream of the Lanzhou section of the Yellow River and serving as an industrial area, discharges industrial wastewater containing heavy metals such as Pb, chromium (Cr), and As into the Yellow River. The downstream districts, such as Qilihe District, rely on Yellow River water for agricultural irrigation, which exacerbates the accumulation of heavy metals in the agricultural land within the urban area. With the rapid development of urbanization, most of the agricultural land in the main urban area of Lanzhou has been transformed into construction land, indirectly reducing the impact of industrial wastewater on other urban areas. Meanwhile, during the urbanization process, the number of motor vehicles in Lanzhou has increased sharply, and severe traffic congestion has led to severe Cu pollution.
It is necessary to adopt a comprehensive indicator system with multiple dimensions and scales to scientifically measure the level of urbanization and combine it with spatial analysis and statistical models. However, previous studies have not applied a multidimensional environmental indicator to investigate the relationship between urbanization and soil heavy metal pollution. Using only population density and distance from the urban center to reflect the relationship with pollution is too simplistic. Therefore, this study selects five cities with different urbanization backgrounds within the central Yunnan urban agglomeration and explores the spatial distribution patterns of soil heavy metals from a new perspective, that is, exploring the distribution patterns of heavy metals along the area of urbanization gradient under a comprehensive urbanization index rather than the traditional patterns along the urban-rural gradient or a single urbanization characteristic gradient. We need to construct a dynamic comprehensive urbanization index based on the development characteristics of each city to clarify its relationship with soil heavy metal pollution. The research analyses whether there is a threshold for pollution, that is, when urbanization exceeds a threshold, does the level of heavy metal pollution increase significantly? It also identifies key prevention and control areas for heavy metal pollution caused by the urbanization process. This study aims to provide applicable and operational suggestions for mitigating heavy metal pollution.
Materials and methods
Study area
The central Yunnan urban agglomeration is the core area for the economic and social development of Yunnan Province. Its ecological and environmental target for the year 2035 is positioned as a “plateau ecological livable urban agglomeration”, focusing on the construction of ecological security barriers, improvement of environmental quality, and green and low-carbon transformation. The urban agglomeration (101°-104.5° E, 24°-26.5° N) is one of the 19 national urban agglomerations in China (Figure 1). It covers four prefecture-level cities of Kunming, Qujing, Yuxi, Chuxiong, and seven counties and cities in the northern part of the Honghe Hani and Yi Autonomous Prefecture, with a total area of 111,400 square kilometers, accounting for 29.07% of the total area of Yunnan Province. Kunming City: While focusing on the development of biomedicine and the greater health industry, new materials, advanced equipment manufacturing, and digital economy, it has also accelerated the development of modern service industries such as tourism, culture, modern logistics, and financial insurance. Qujing City: Focuses on the development of advanced manufacturing, green food, and modern service industries. Yuxi City: Focuses on the development of cigarettes and supporting industries, mineral and equipment manufacturing, biomedicine and the greater health industry, as well as cultural tourism. Chuxiong Prefecture: Focuses on the development of tobacco and supporting industries, biomedicine and the greater health industry, as well as cultural tourism. The seven counties and cities in the northern part of Honghe Prefecture: Focus on the development of modern agriculture and green processing industries, nonferrous metals and new materials as well as electronic equipment manufacturing industries, and cultural tourism and general aviation industries. The terrain of the Central Yunnan Urban Agglomeration is dominated by plateau mountains and intermontane basins, the altitude of most areas is between 1,500 and 2,500 meters. In 2020, the region's Gross Domestic Product (GDP) accounted for 61.5% of Yunnan Province's total GDP. The urbanization rate increased from 30.62% in 2000 to 59.90% in 2020, indicating a significant acceleration in the urbanization process. The ecological environment of the central Yunnan urban agglomeration is generally good, but due to the rapid urbanization and industrialization processes, some areas are facing problems such as soil pollution, water and soil loss, and biodiversity decline (Deng et al., 2023; Huang et al., 2023). This study selected the core districts of five cities as representatives for the research: Kunming City includes Wuhua District, Guandu District, Chenggong District, and Jinning District; Yuxi City includes Hongta District; Honghe City includes Mengzi City; Qujing City includes Qilin District and Zhan Yi District; and Chuxiong City includes Chuxiong City.
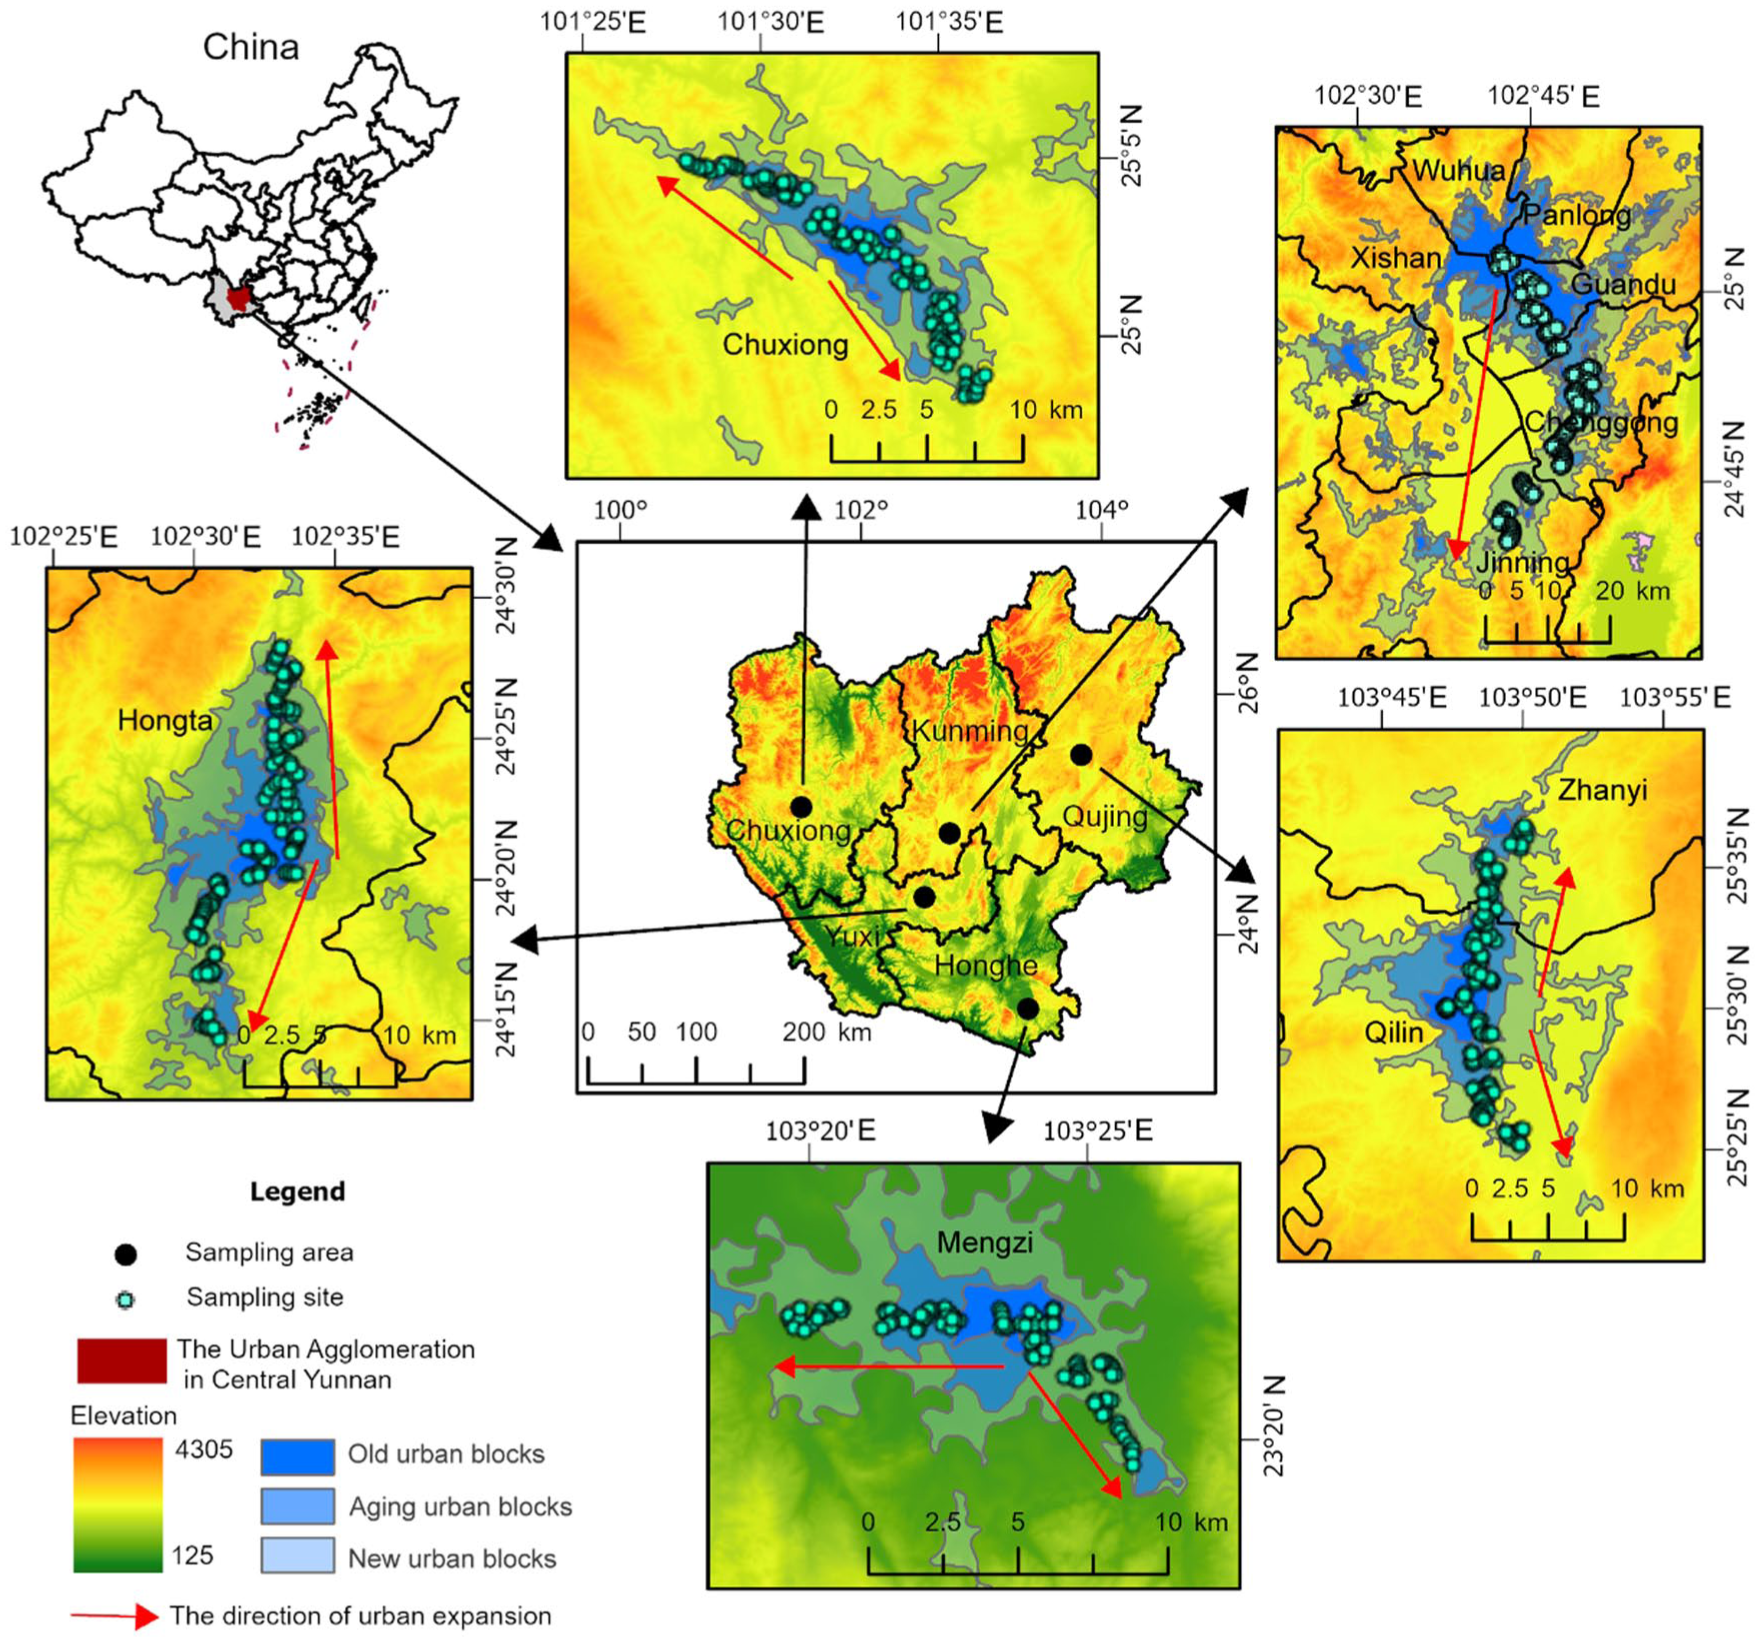
Study area and sampling map.
Division of new and old urban blocks
The classification of different urbanization areas in this study is based on the urban boundary data by Li et al. (2020b). Regions within the early urban boundary ranges began urbanization earlier. Therefore, this study categorized the research area according to the urban boundaries in the dataset for the years 2000, 2010, and 2020. Areas within the urban boundary delineated in 2000 were defined as old urban blocks, areas developed between 2000 and 2010 as aging urban blocks, and areas between 2010 and 2020 as new urban blocks. Farmlands near the boundary in the new urban area were defined as non-urban areas (Figure 1.).
Soil sampling and measurements
Based on the urban boundary dataset (Li et al., 2020b), the direction of urban expansion has been determined and constrained by natural topography and government planning, the city exhibits a ribbon-like expansion pattern. The transect is arranged based on the urban expansion pattern and the direction of expansion (Figure 1). To achieve the research objectives, the study evenly distributed sampling points along the transects. During the sampling process, obvious pollution sources (50 meters away) such as gas stations and sewage outlets were avoided to prevent point-source pollution from interfering with the study. The five-point sampling method was adopted, where five sub-samples of equal weight were mixed to form a representative topsoil sample (0-20 cm). Approximately 100 soil samples were collected from each study area, resulting in a total of 509 soil samples from the five cities.
Prior to experimental analysis, all soil samples were air-dried and sieved through a polyethylene sieve with a pore size of 125 micrometers. Since As, Cr, Ni, Cu, Zn, and Pb are characterized by their widespread pollution, clear toxicity, traceable sources, and comprehensive standards they have, therefore, become the core objects of soil heavy metal pollution research. This study measured the concentrations of six soil heavy metals that are significantly affected by human activities: As, Cr, Ni, Cu, Zn and Pb. Each soil sample was accurately weighed at 0.1 g and placed into a polytetrafluoroethylene tube, where it was digested with a mixture of 2 mL of HF and 8 mL of HNO3. The concentrations of Ni and Zn were determined using inductively coupled plasma-optical emission spectrometry (ICP-OES), while the concentration of As was analyzed using atomic fluorescence spectrometry. The air-dried soil samples were ground and sieved to form a uniform fine powder, which was then pressed into thin pellets for the determination of Cr concentration using X-ray fluorescence (XRF) spectroscopy. The concentrations of Cu and Pb were measured using inductively coupled plasma-mass spectrometry (ICP-MS). During the analysis, quality control was ensured by using blank samples, duplicate samples, and national standard soil samples (from the National Standard Materials Center of China, GSS-8). The relative deviation of the measurements was controlled within ±10%, and the recovery rates of the samples ranged from 90.3% to 105.5%. The pH of the samples was measured using a pH-3C acidimeter, following a soil-to-water ratio of 1:5 (Qiang et al., 2007).
Statistical analysis of the impact of urbanization on soil heavy metal concentration
Selecting the urbanization factor
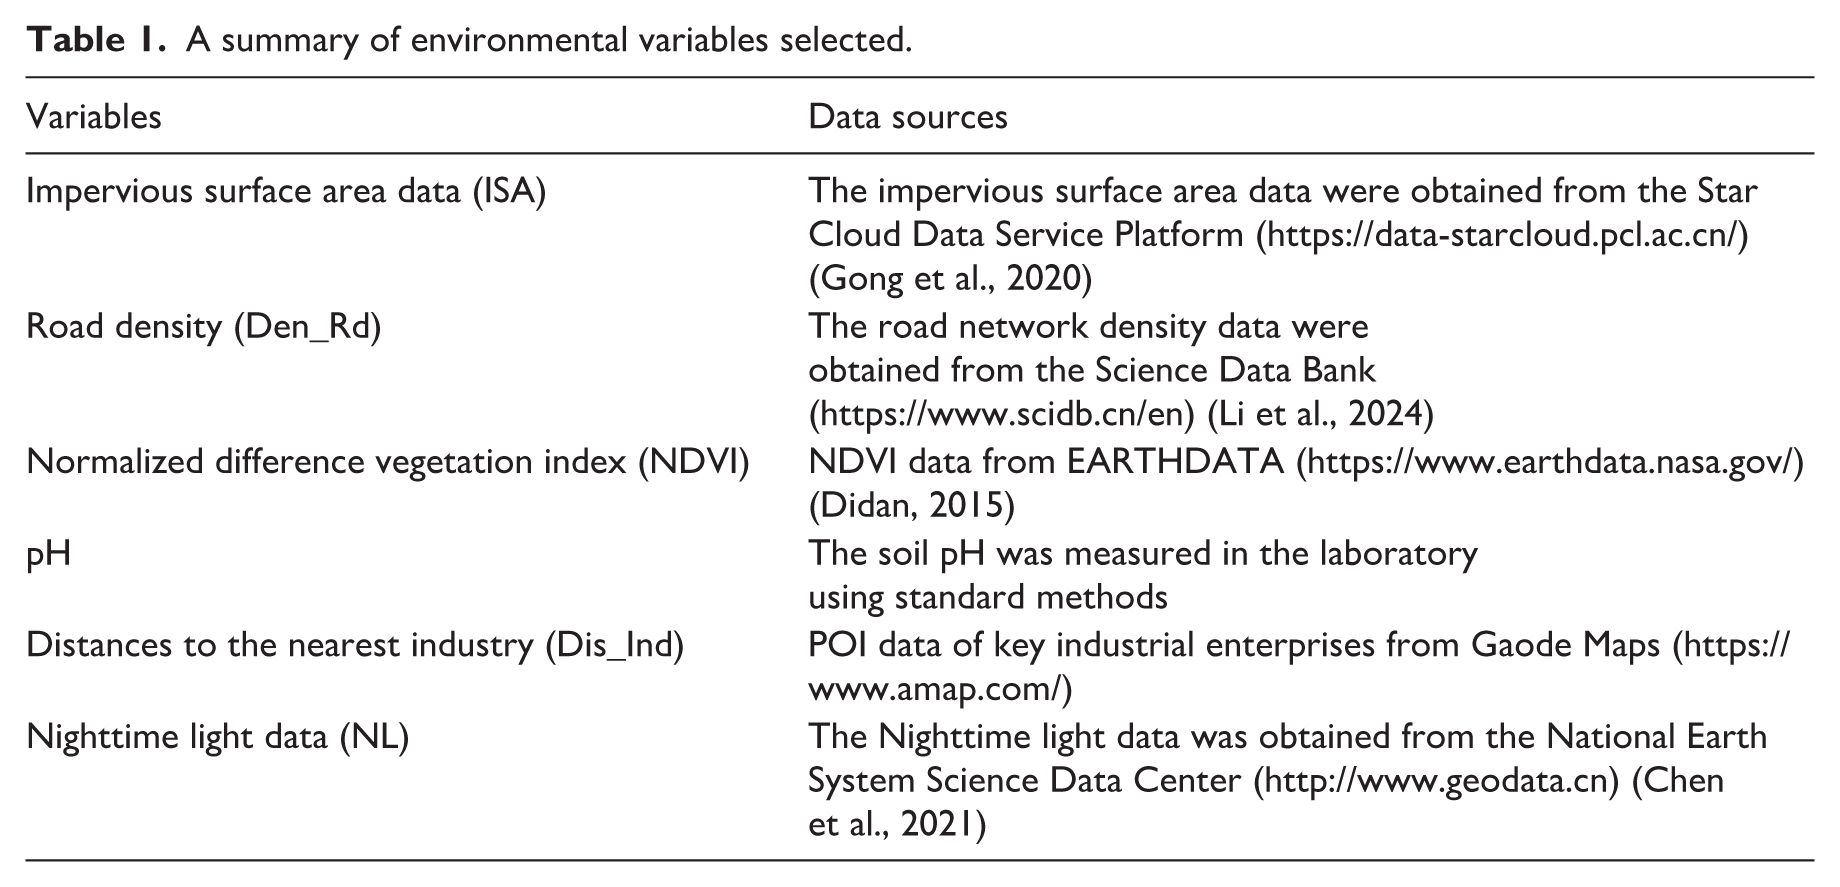
In selecting the urbanization factors for this study, the precision and suitability of the variables were fully considered according to the area of the study region. Drawing on previous research, we screened a large number of variables. Given that the sampling points were located in the core urban areas, with a small scope and minimal elevation changes, and considering the insufficient precision of data such as soil type and the multi-data-integrated GDP and population density, these factors were taken into account during the variable selection process. Considering all these factors, the study ultimately selected six types of variables: nighttime light data (NL), which reflects population activity and the intensity of urbanization; annual impervious surface area data (ISA), which reflects the relative age or newness of the urban area; normalized difference vegetation index (NDVI), which reflects the barrier and interception effects on heavy-metal particulate matter; distance to the nearest industrial enterprise (Dis_Ind), which reflects the distance to pollution sources; pH, which effectively indicates the intensity of human industrial and related activities; and road density (Den_Rd), which reflects the influence of transportation activities on soil heavy-metal contamination (Table 1). These variables have been proven to have a significant impact on soil heavy metals (Li et al., 2020a; Yang et al., 2024a). The study used variable mean values within buffer zones of 1 km, 2 km, and 3 km radius around the sampling points for analysis, in order to obtain the optimal research scale. The study employed stepwise linear regression to validate the correctness and effectiveness of the selected variables (Online Supplementary Table S1). The results indicated that the chosen variables significantly affect soil heavy metal concentrations in the study area, and there is no multicollinearity among the variables, which confirms the rationality of the variable selection.
A summary of environmental variables selected.
Statistical analysis
This study employed IBM SPSS 27.0 for descriptive statistics, ANOVA, and stepwise linear regression analysis, with results visualized using Origin 2022. Environmental variables were extracted using ArcGIS Pro 3.0.2. The Urbanization Environmental Pressure Index (UEPI) was constructed using the “GA” package in R 4.3.3. Pollution thresholds were determined using the “segmented” package in R 4.3.3. Key polluted areas were identified through bivariate local spatial autocorrelation analysis using GeoDa 1.16. The research framework is illustrated in Online Supplementary Figure S1.
Constructing the Urbanization Environmental Pressure Index (UEPI)
Traditional proncipal component analysis relies on linear assumptions, and the equal-weight method ignores the differences in the importance of indicators. Conventional methods are prone to falling into local optima. The relationship between urbanization and heavy metals is often nonlinear (e.g., threshold effects, interactions). Genetic algorithms, through mechanisms of natural selection (selection, crossover, and mutation), conduct a global search in the solution space, avoiding local optima and finding weight combinations that are closer to the global optimum (Al-Haidarey et al., 2010; Chen and Song, 2012).
The environmental factor data were standardized by Z-Score, based on variable fitness scores, individuals were selected for the next generation using the roulette wheel selection method, with a few of the best-performing individuals retained (elitism). Pairs of individuals produced offspring through single-point crossover, and genes (weights) were altered with a low mutation rate via Gaussian mutation to introduce variability. The newly generated generation replaced the old one, and this process was repeated until a specified number of generations was reached or convergence criteria were met. By optimizing the weights of multiple factors using the GA, the limitations of traditional subjective weighting methods (e.g., Analytic Hierarchy Process) were overcome, achieving data-driven objective weight allocation (Fang et al., 2025). Based on six environmental factors, the study employed a genetic algorithm (GA) to construct the Urbanization Environmental Pressure Index (UEPI), revealing the relationship between urbanization and soil heavy-metal concentrations and further exploring pollution thresholds.
Segmented regression to identify the pollution threshold
Segmented regression analysis is a method that divides data into multiple linear segments, where the relationship between data points within each segment can be described by different linear equations (Hu et al., 2020). The core of this method lies in identifying “breakpoints” in the data, which are points where the trend of the data undergoes a significant change. These breakpoints segment the data, allowing for a more accurate fit of the relationship between the UEPI and heavy metal concentrations within each segment. This approach reveals how heavy metal concentrations respond to different levels of urbanization. By identifying breakpoints, the method allows us to more intuitively determine the urbanization thresholds at which heavy metal pollution intensifies or mitigates, thereby enabling the formulation of scientifically sound and effective intervention measures.
Spatial correlation analysis
The core of bivariate local spatial autocorrelation analysis is to assess the local spatial correlation between two variables. It calculates the local Moran's I index for each observation point using the GeoDa spatial analysis software and evaluates the significance of the local Moran's I index for each point through a Z-test, thereby identifying spatial clustering patterns between the two variables. By calculating the local Moran's I index for each observation point, the study identifies spatial clustering patterns based on the values of the local Moran's I index and their significance results. High-High: In these areas, both the UEPI and soil heavy metal concentrations are high, indicating that urbanization activities may exacerbate heavy metal pollution. Low-Low: In these areas, both the UEPI and soil heavy metal concentrations are low, suggesting that these regions are less affected by urbanization and have lower pollution levels. High-Low and Low-High: These patterns may indicate spatial heterogeneity and require further analysis to understand their causes. Through bivariate local spatial autocorrelation analysis, this study is able to reveal the spatial relationship between urbanization and soil heavy metal pollution, providing a scientific basis for urban planning and environmental management.
Results
Heavy metal concentrations in different urbanization context
The region with the least pollution is Chuxiong (Table 2), where both the coefficient of variation and the heavy metal concentrations are lower than those in the other four cities. Moreover, the majority of the samples did not exceed the soil background values, indicating that the soils in Chuxiong have been less disturbed by human activities and are at a lower level of contamination. The heavy metal concentrations in the soils of the other four cities all exceeded the background values to varying degrees, indicating that human activities during the urbanization process have had a significant impact on them. These activities include transportation, industrial production, and mining, among others (Li et al., 2022; Wang et al., 2022). The results of ANOVA indicate that the heavy metal concentrations in the old urban blocks are significantly higher than those in the new urban blocks and non-urban areas (Figure 2).
Descriptive statistics of heavy metals concentrations (mg/kg) the study area soil.
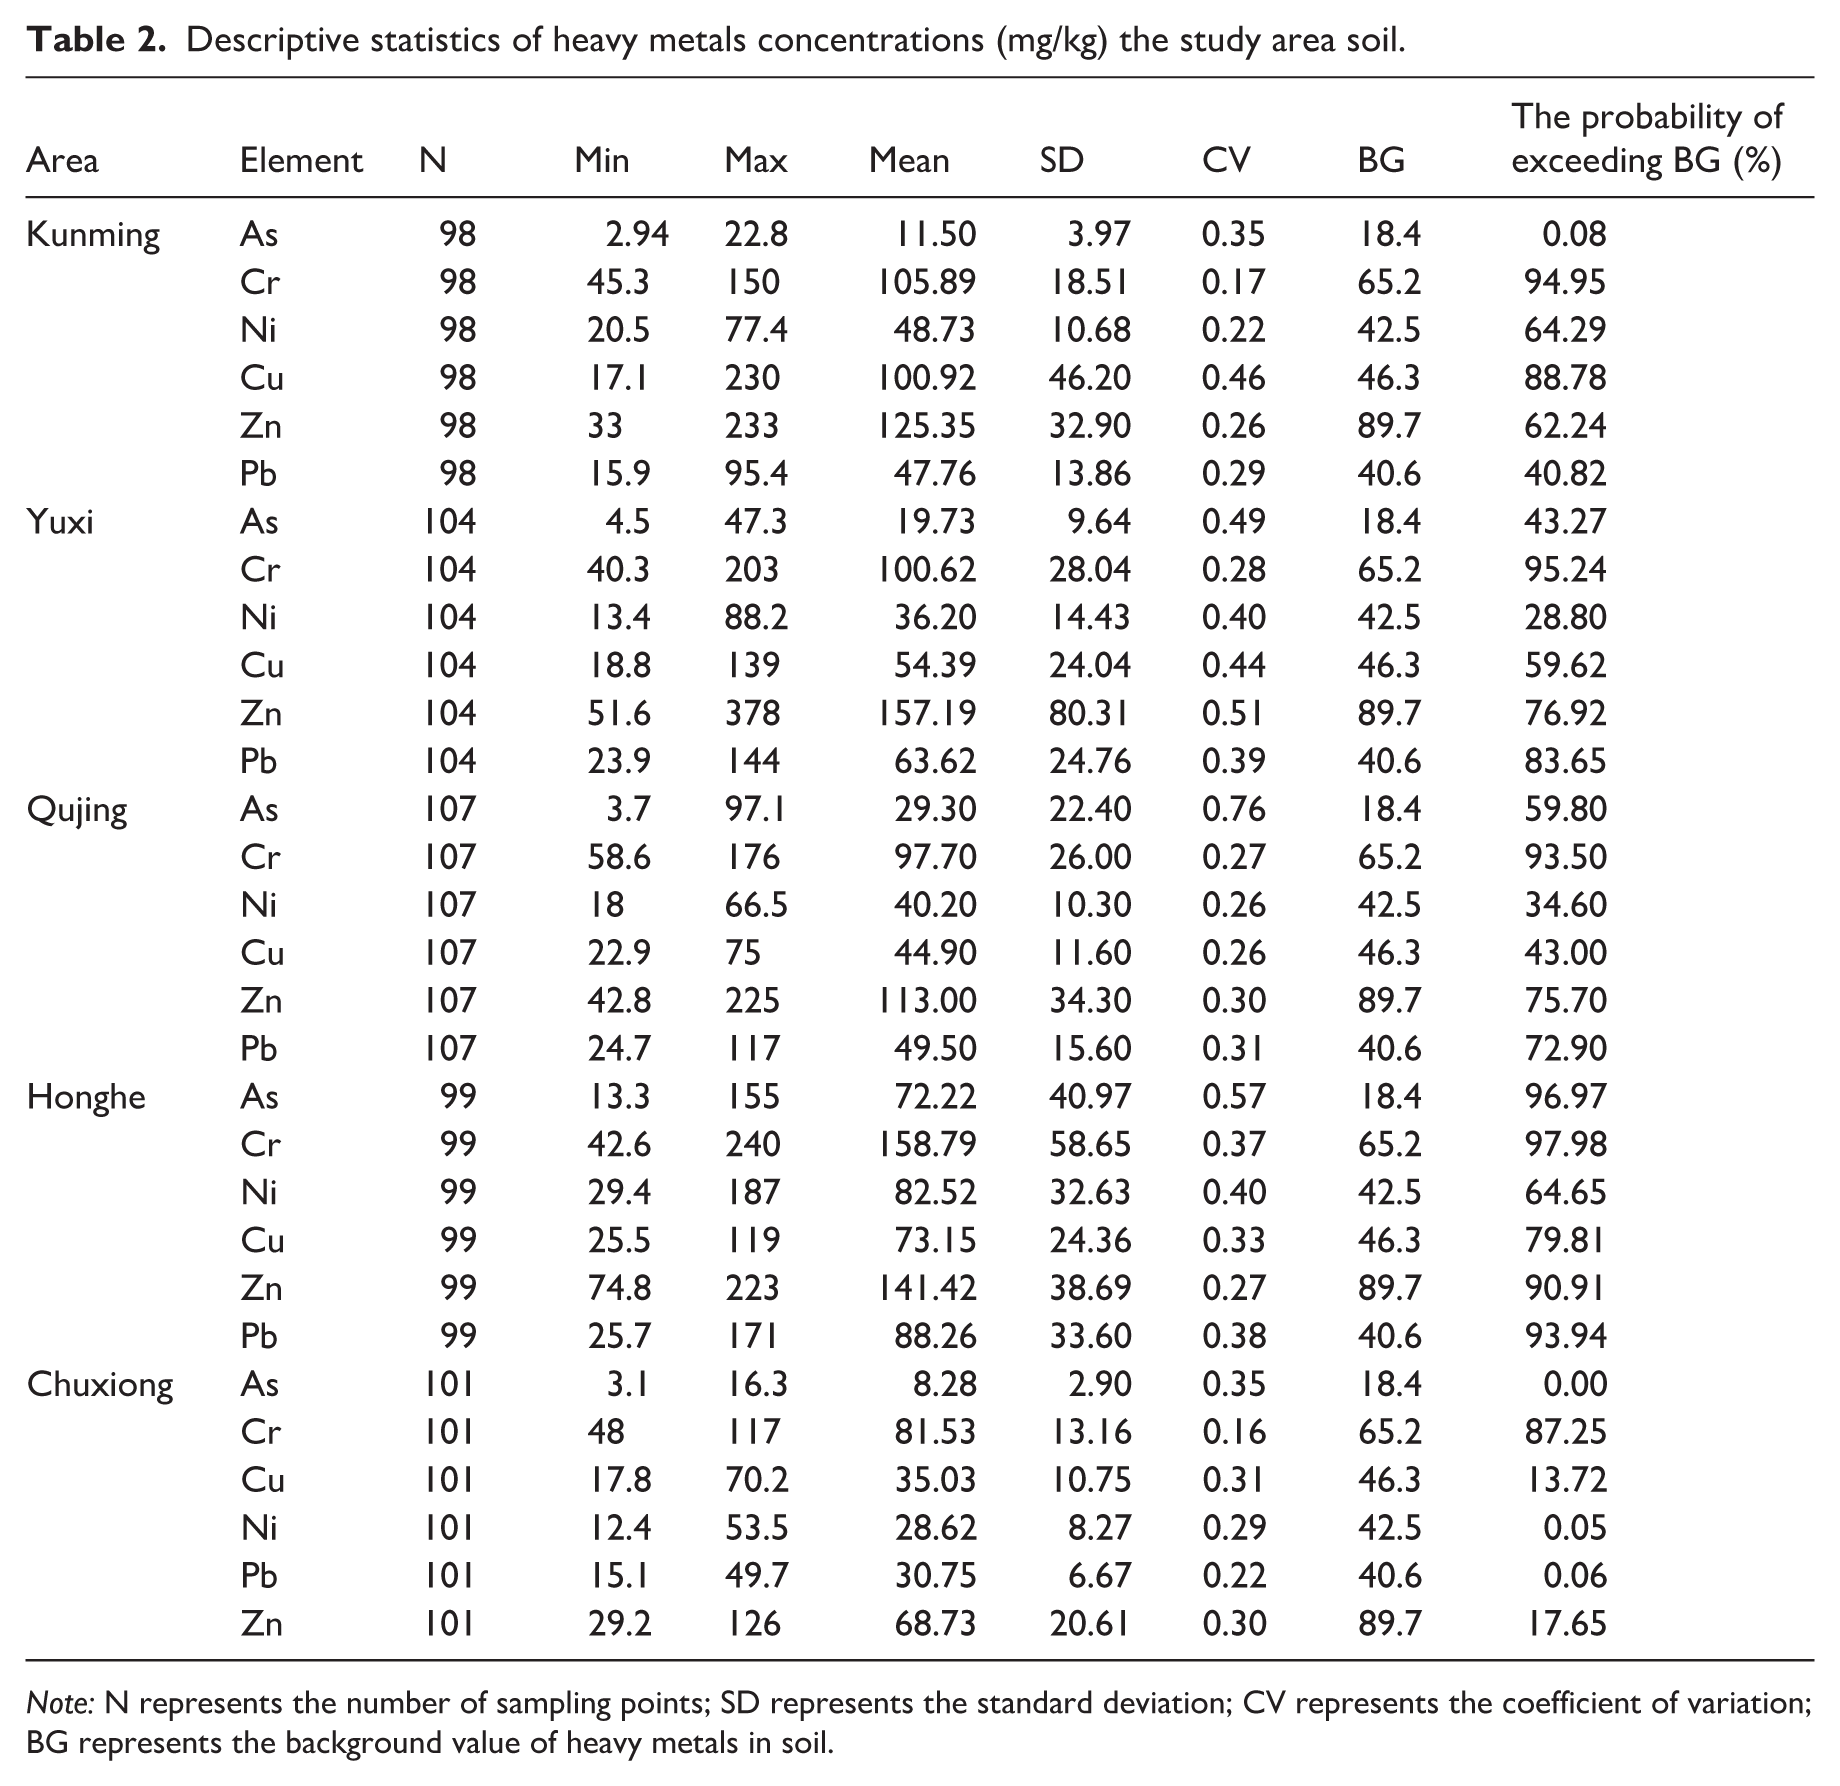
Note: N represents the number of sampling points; SD represents the standard deviation; CV represents the coefficient of variation; BG represents the background value of heavy metals in soil.
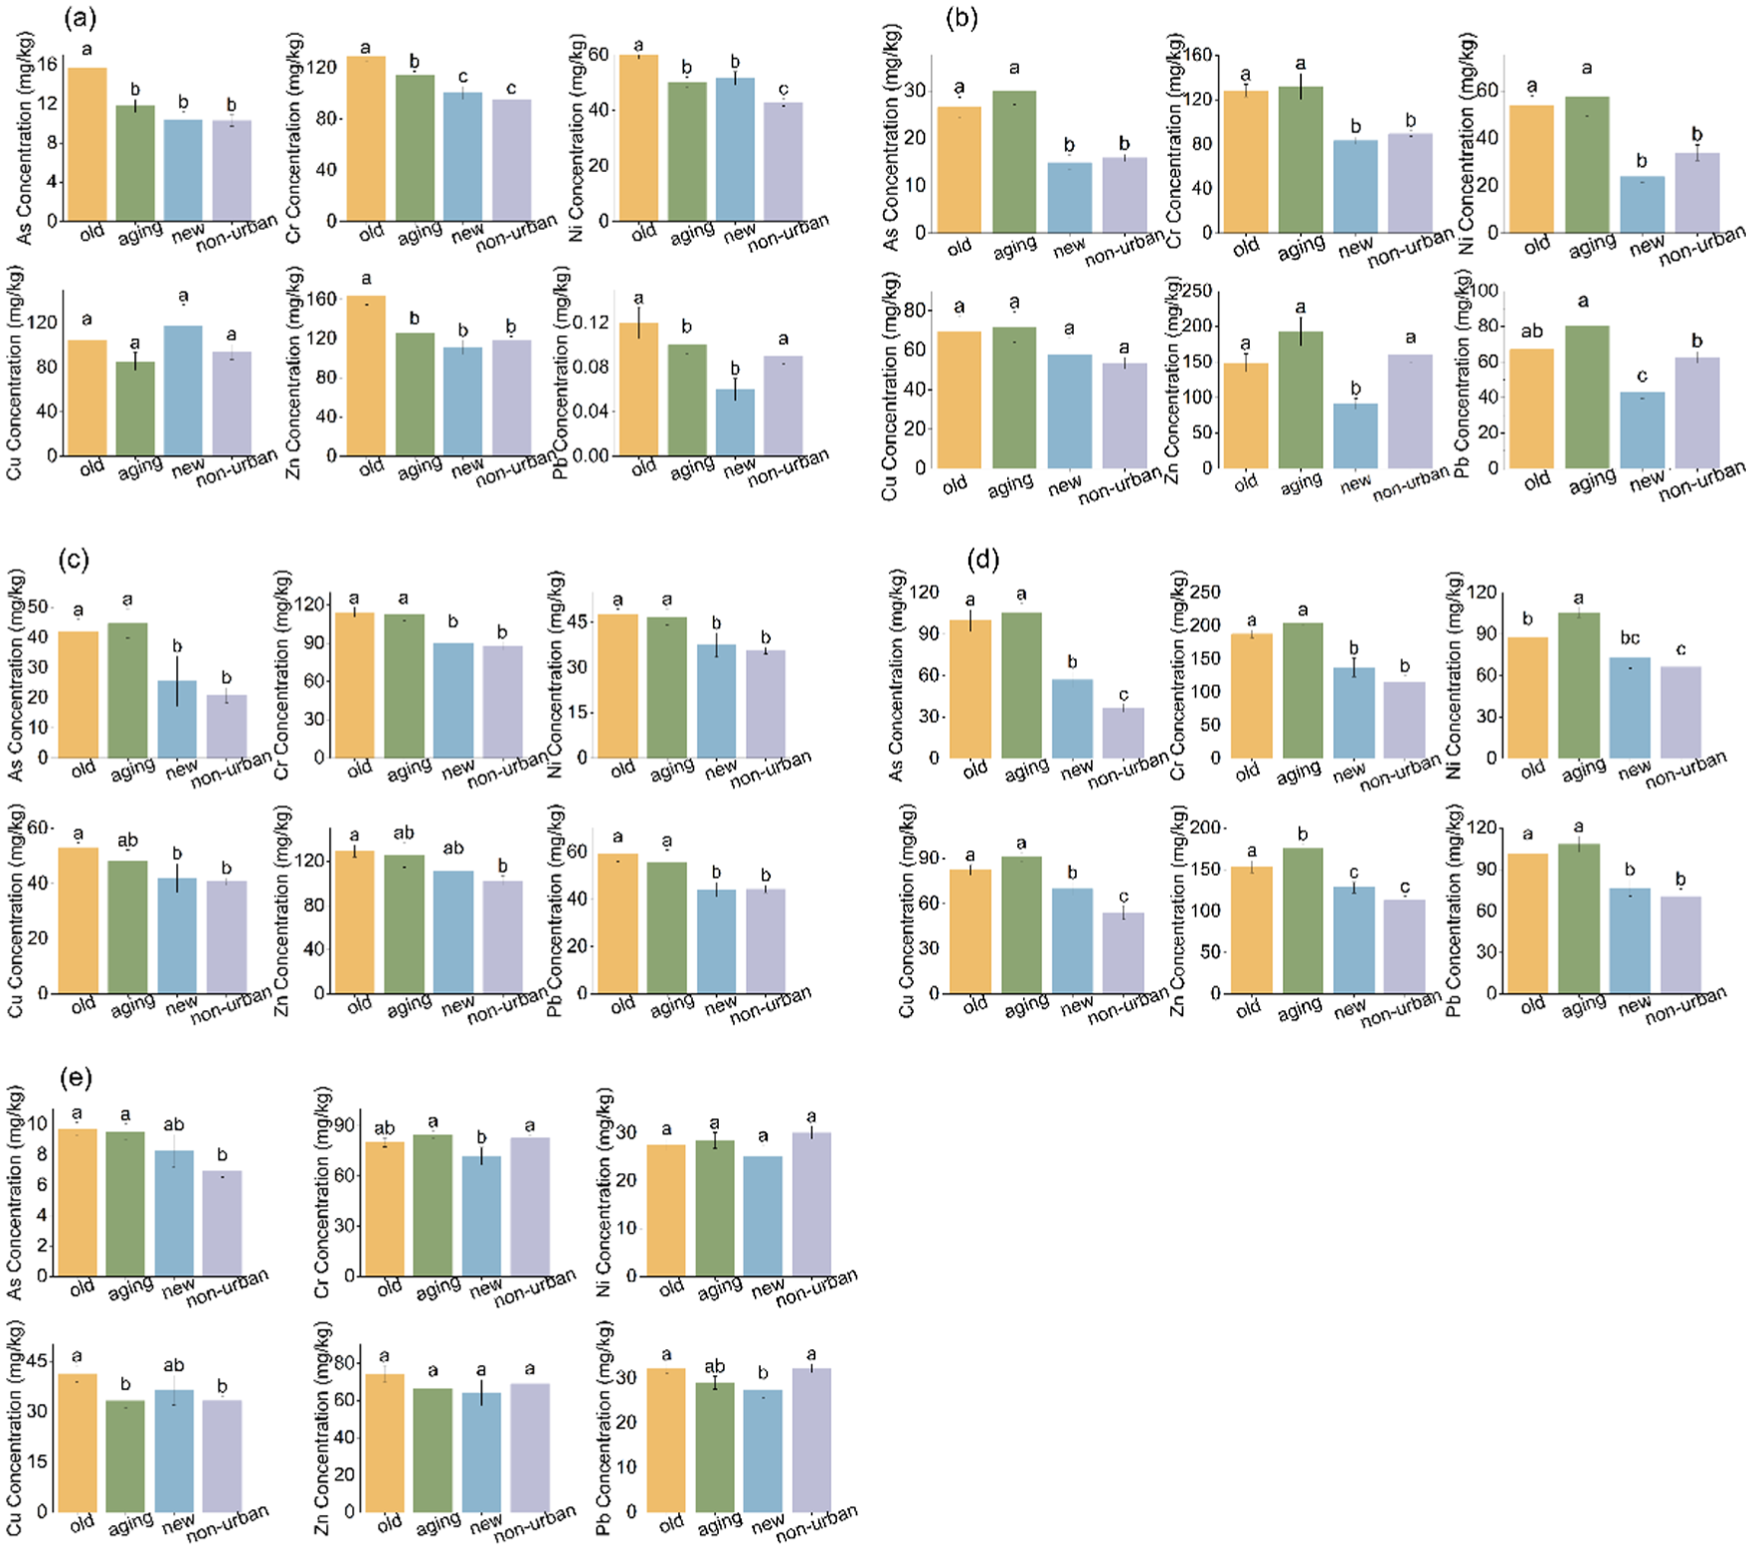
The distribution characteristics of heavy metal concentrations in soil. Letters marked the same indicate no significant difference, while different letters indicate significant differences: (a) Kunming, (b) Yuxi, (c) Qujing, (d) Honghe, and (e) Chuxiong.
The non-linear relationship between urbanization and soil heavy metal concentrations
The stepwise linear regression analysis revealed the significant influencing factors of different heavy metals in various cities (Online Supplementary Table S1). There are differences in influencing factors among different cities, and there are also differences in influencing factors for different heavy metals within the same city. The collinearity diagnosis and significance results indicated that the degree of collinearity among different influencing factors was low (VIF below 10) and that these factors had an impact on heavy metal concentrations in the soil, thereby demonstrating the reliability of the model used. We constructed the UEPI using six urbanization factors (Table 3). The results indicated that the UEPI had varying explanatory power for different heavy metals, and the weights of the influencing factors differed across cities (Table 4).
Construction of UEPI based on GA.
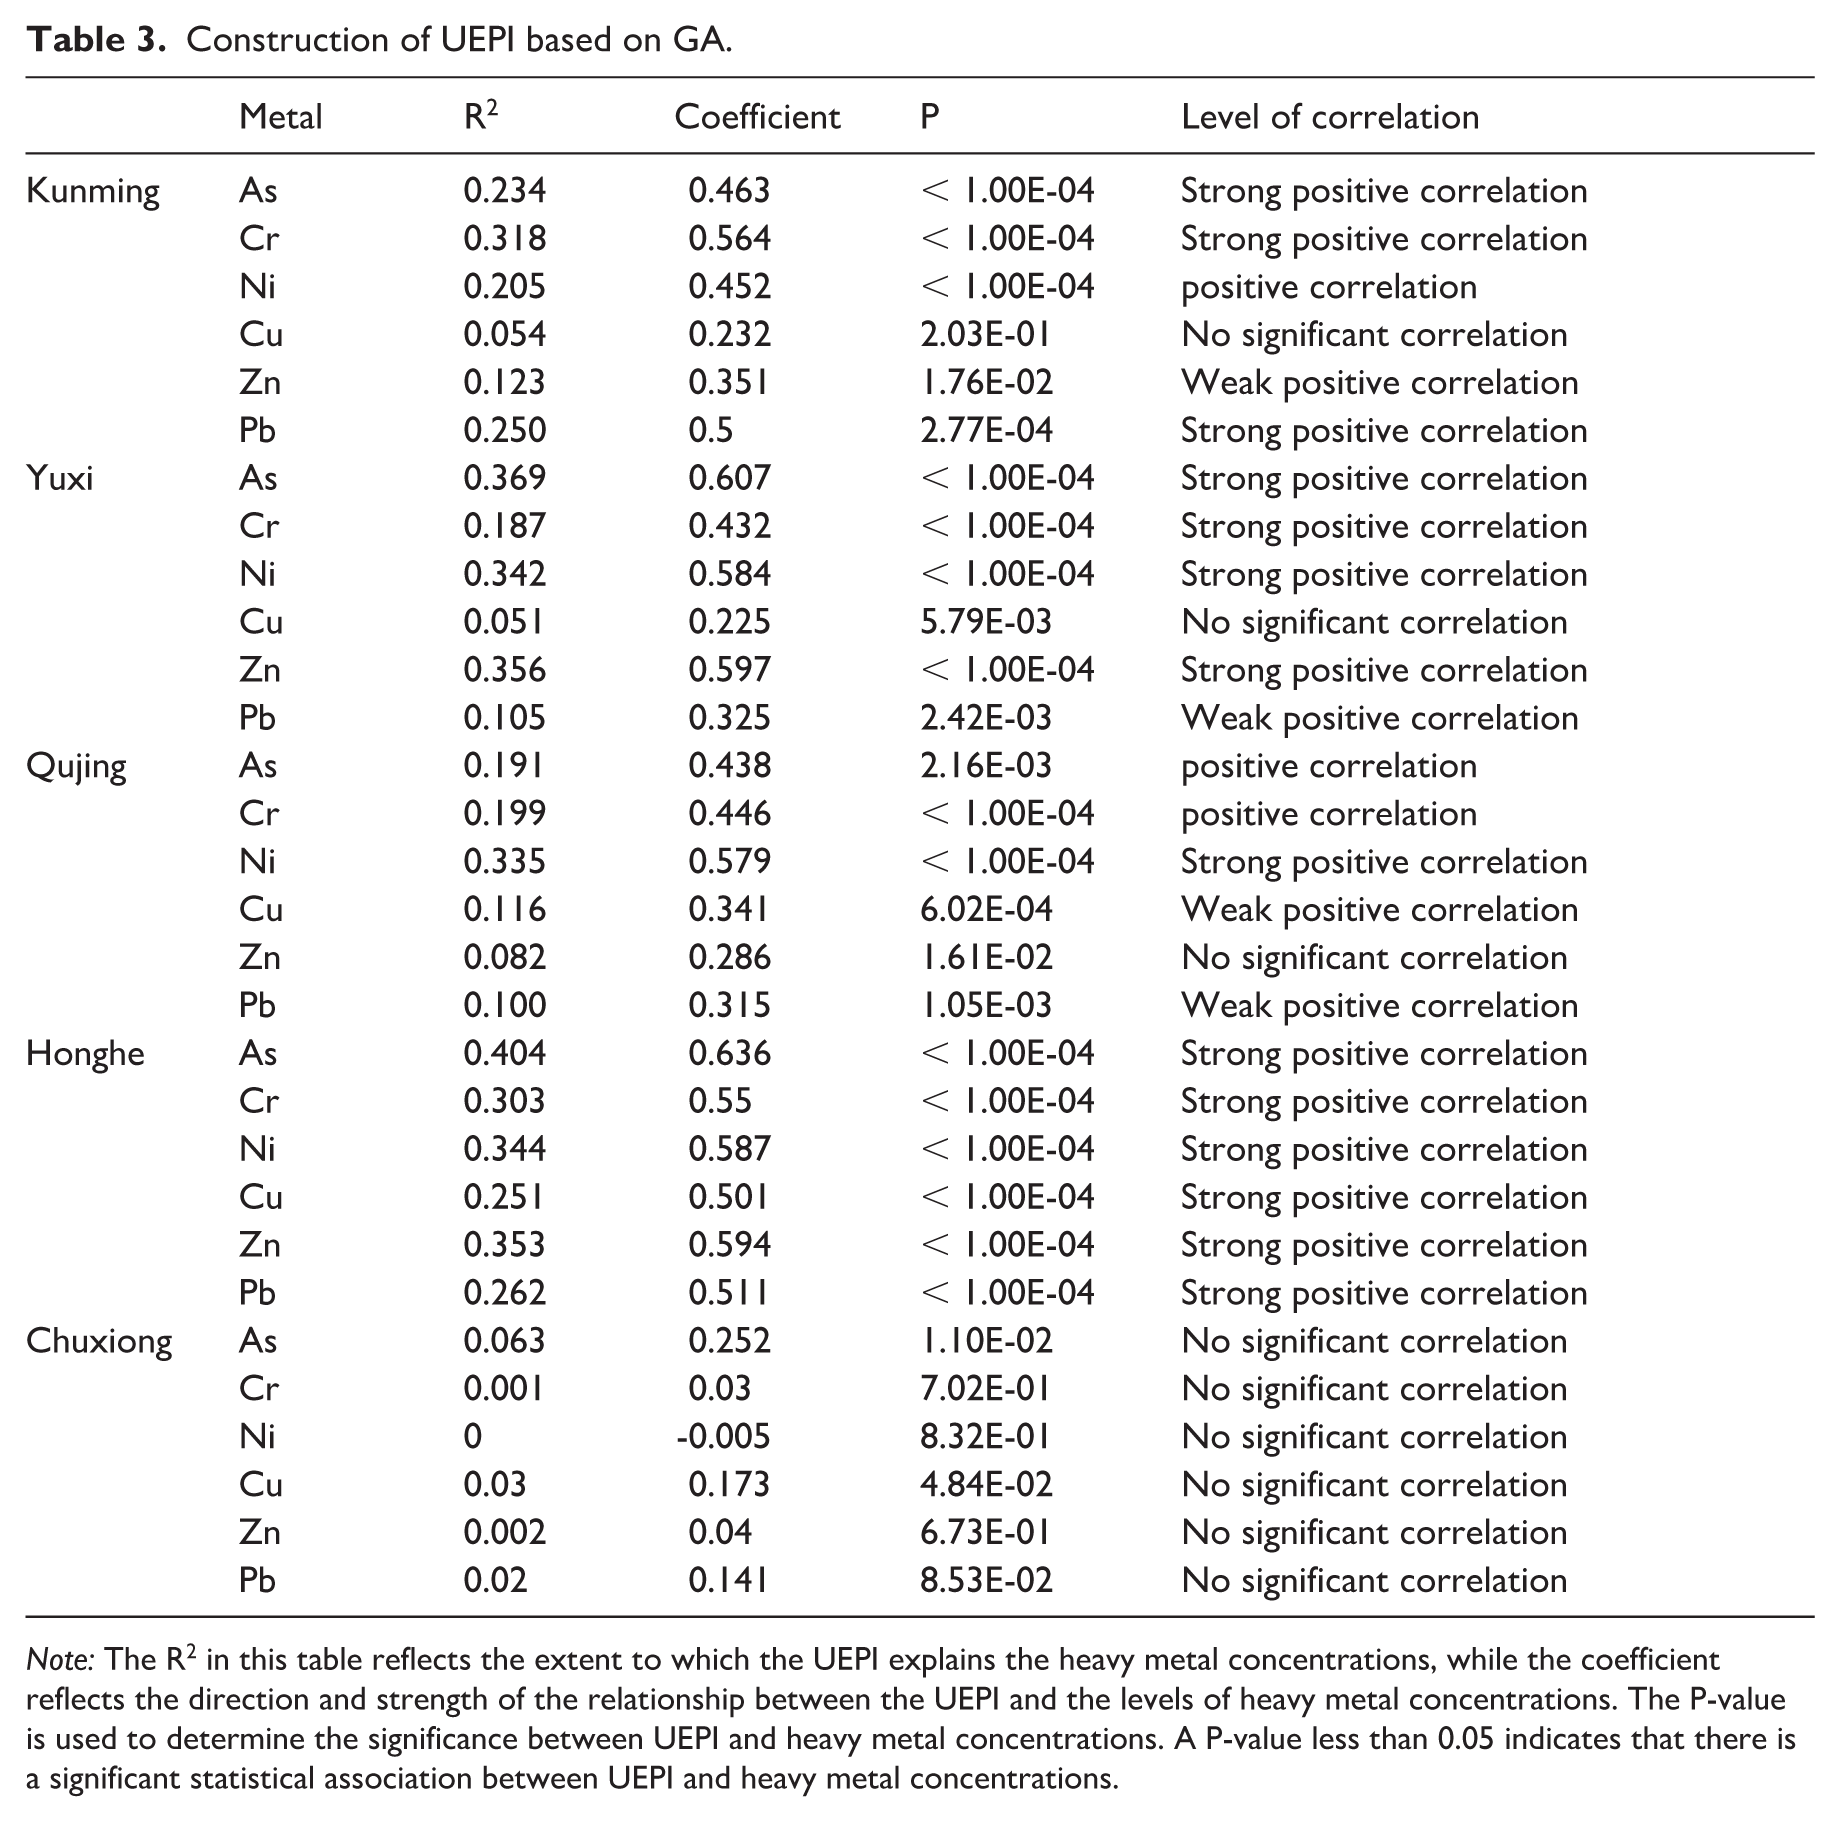
Note: The R2 in this table reflects the extent to which the UEPI explains the heavy metal concentrations, while the coefficient reflects the direction and strength of the relationship between the UEPI and the levels of heavy metal concentrations. The P-value is used to determine the significance between UEPI and heavy metal concentrations. A P-value less than 0.05 indicates that there is a significant statistical association between UEPI and heavy metal concentrations.
The proportion of different urbanization factors.
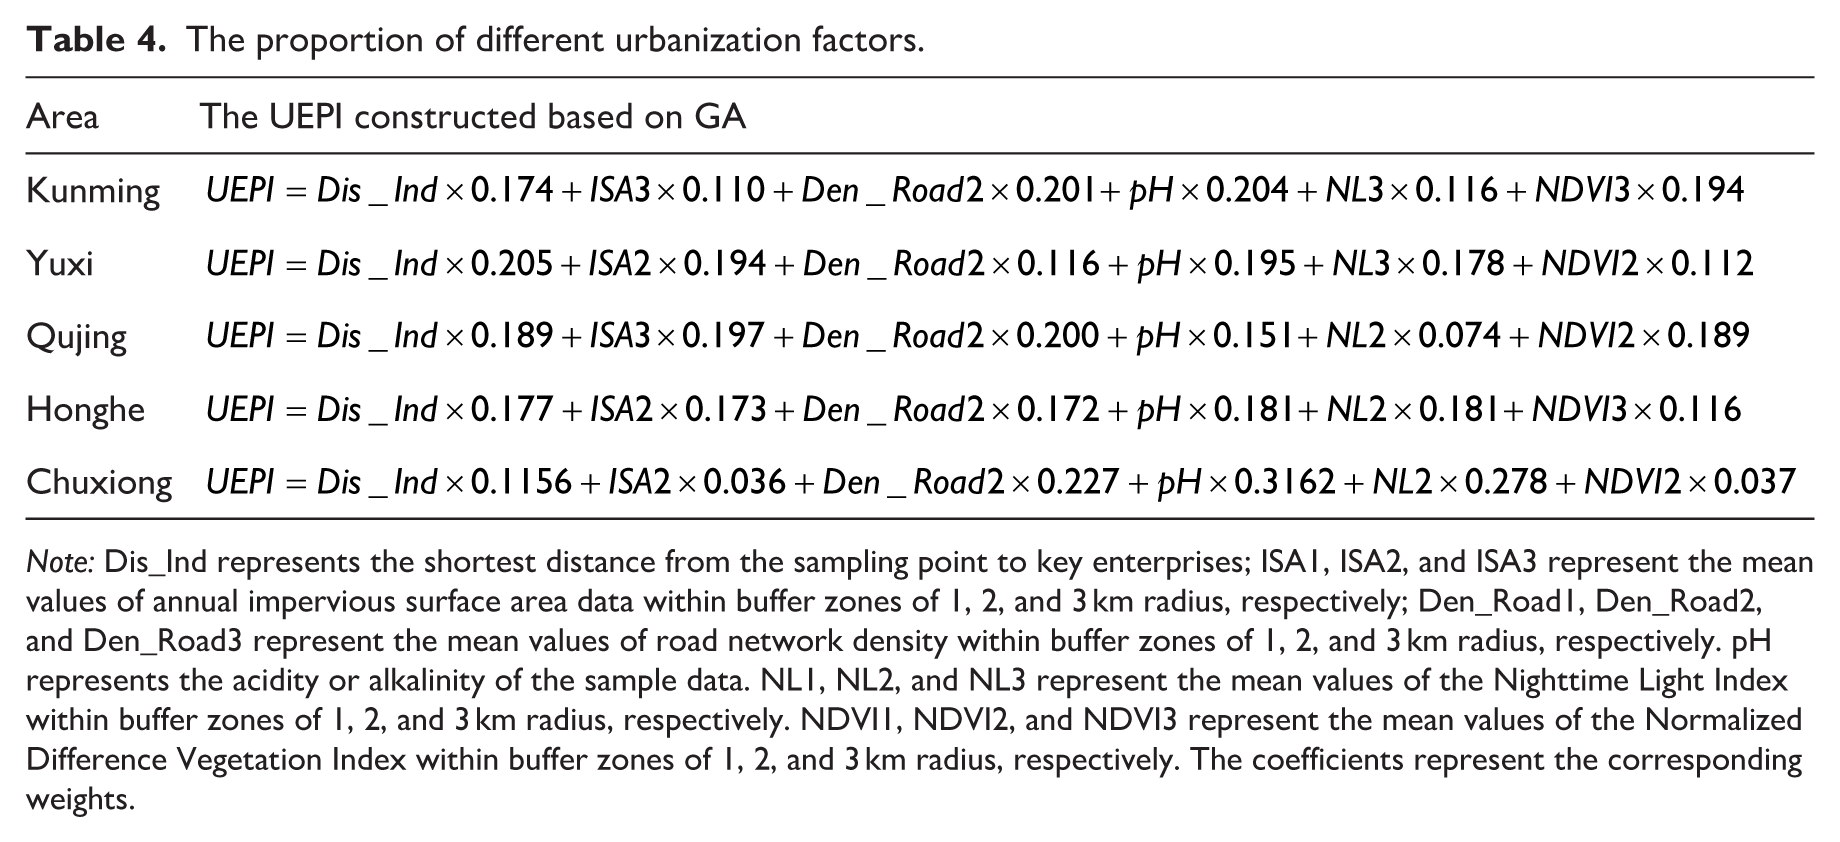
Note: Dis_Ind represents the shortest distance from the sampling point to key enterprises; ISA1, ISA2, and ISA3 represent the mean values of annual impervious surface area data within buffer zones of 1, 2, and 3 km radius, respectively; Den_Road1, Den_Road2, and Den_Road3 represent the mean values of road network density within buffer zones of 1, 2, and 3 km radius, respectively. pH represents the acidity or alkalinity of the sample data. NL1, NL2, and NL3 represent the mean values of the Nighttime Light Index within buffer zones of 1, 2, and 3 km radius, respectively. NDVI1, NDVI2, and NDVI3 represent the mean values of the Normalized Difference Vegetation Index within buffer zones of 1, 2, and 3 km radius, respectively. The coefficients represent the corresponding weights.
The segmented regression analysis clearly demonstrated the relationship between the UEPI and heavy metal concentrations, and identified the critical breakpoints where significant changes occurred (Figure 3, Online Supplementary Figure S2 and Supplementary Table S1). The results indicated that the breakpoints varied among different cities and also among different heavy metals within the same city. This indicates that there is a close relationship between heavy metal concentrations and the urbanization context. However, we found that, apart from Chuxiong, different heavy metals in different cities share a common feature: once the heavy metal concentration reaches the breakpoint, the slope of its increase becomes steeper, this phenomenon reflects the nonlinear response mechanism of ecosystems.

Threshold analysis was conducted using the piecewise regression model. The red dotted line represents the breakpoint position, and the numbers near it represent the breakpoint value: (a) Kunming, (b) Yuxi, and (c) Qujing.
Identifying the key contaminated areas
The study employed Empirical Bayesian Kriging to conduct spatial interpolation of heavy metal concentrations. By inputting data to simulate multiple semivariograms, the results indicated that the spatial interpolation results were relatively accurate within a 2-kilometer range, while larger errors occurred beyond this range. Consequently, the study ultimately selected the area within a 2-kilometer radius of the sampling points for further research. We analyzed the spatial relationships between the constructed UEPI and the concentrations of each heavy metal (Figure 4.), categorizing the relationships into five types: High-High, High-Low, Low-High, Low-Low, and Not Significant. Areas characterized by the High-High feature are defined as key contaminated areas, which are characterized by both a high UEPI and high soil heavy metal concentrations. Among the heavy metals with higher correlation to the UEPI, the High-High characteristics are mainly distributed in the old urban blocks and their vicinity, while the Low-Low characteristics are primarily found in the new urban blocks and non-urban areas. The Low-High, High-Low, and Not Significant characteristics are mainly distributed in the relatively aging urban blocks between the new and old urban blocks, as well as in some parts of the new urban blocks and non-urban areas.
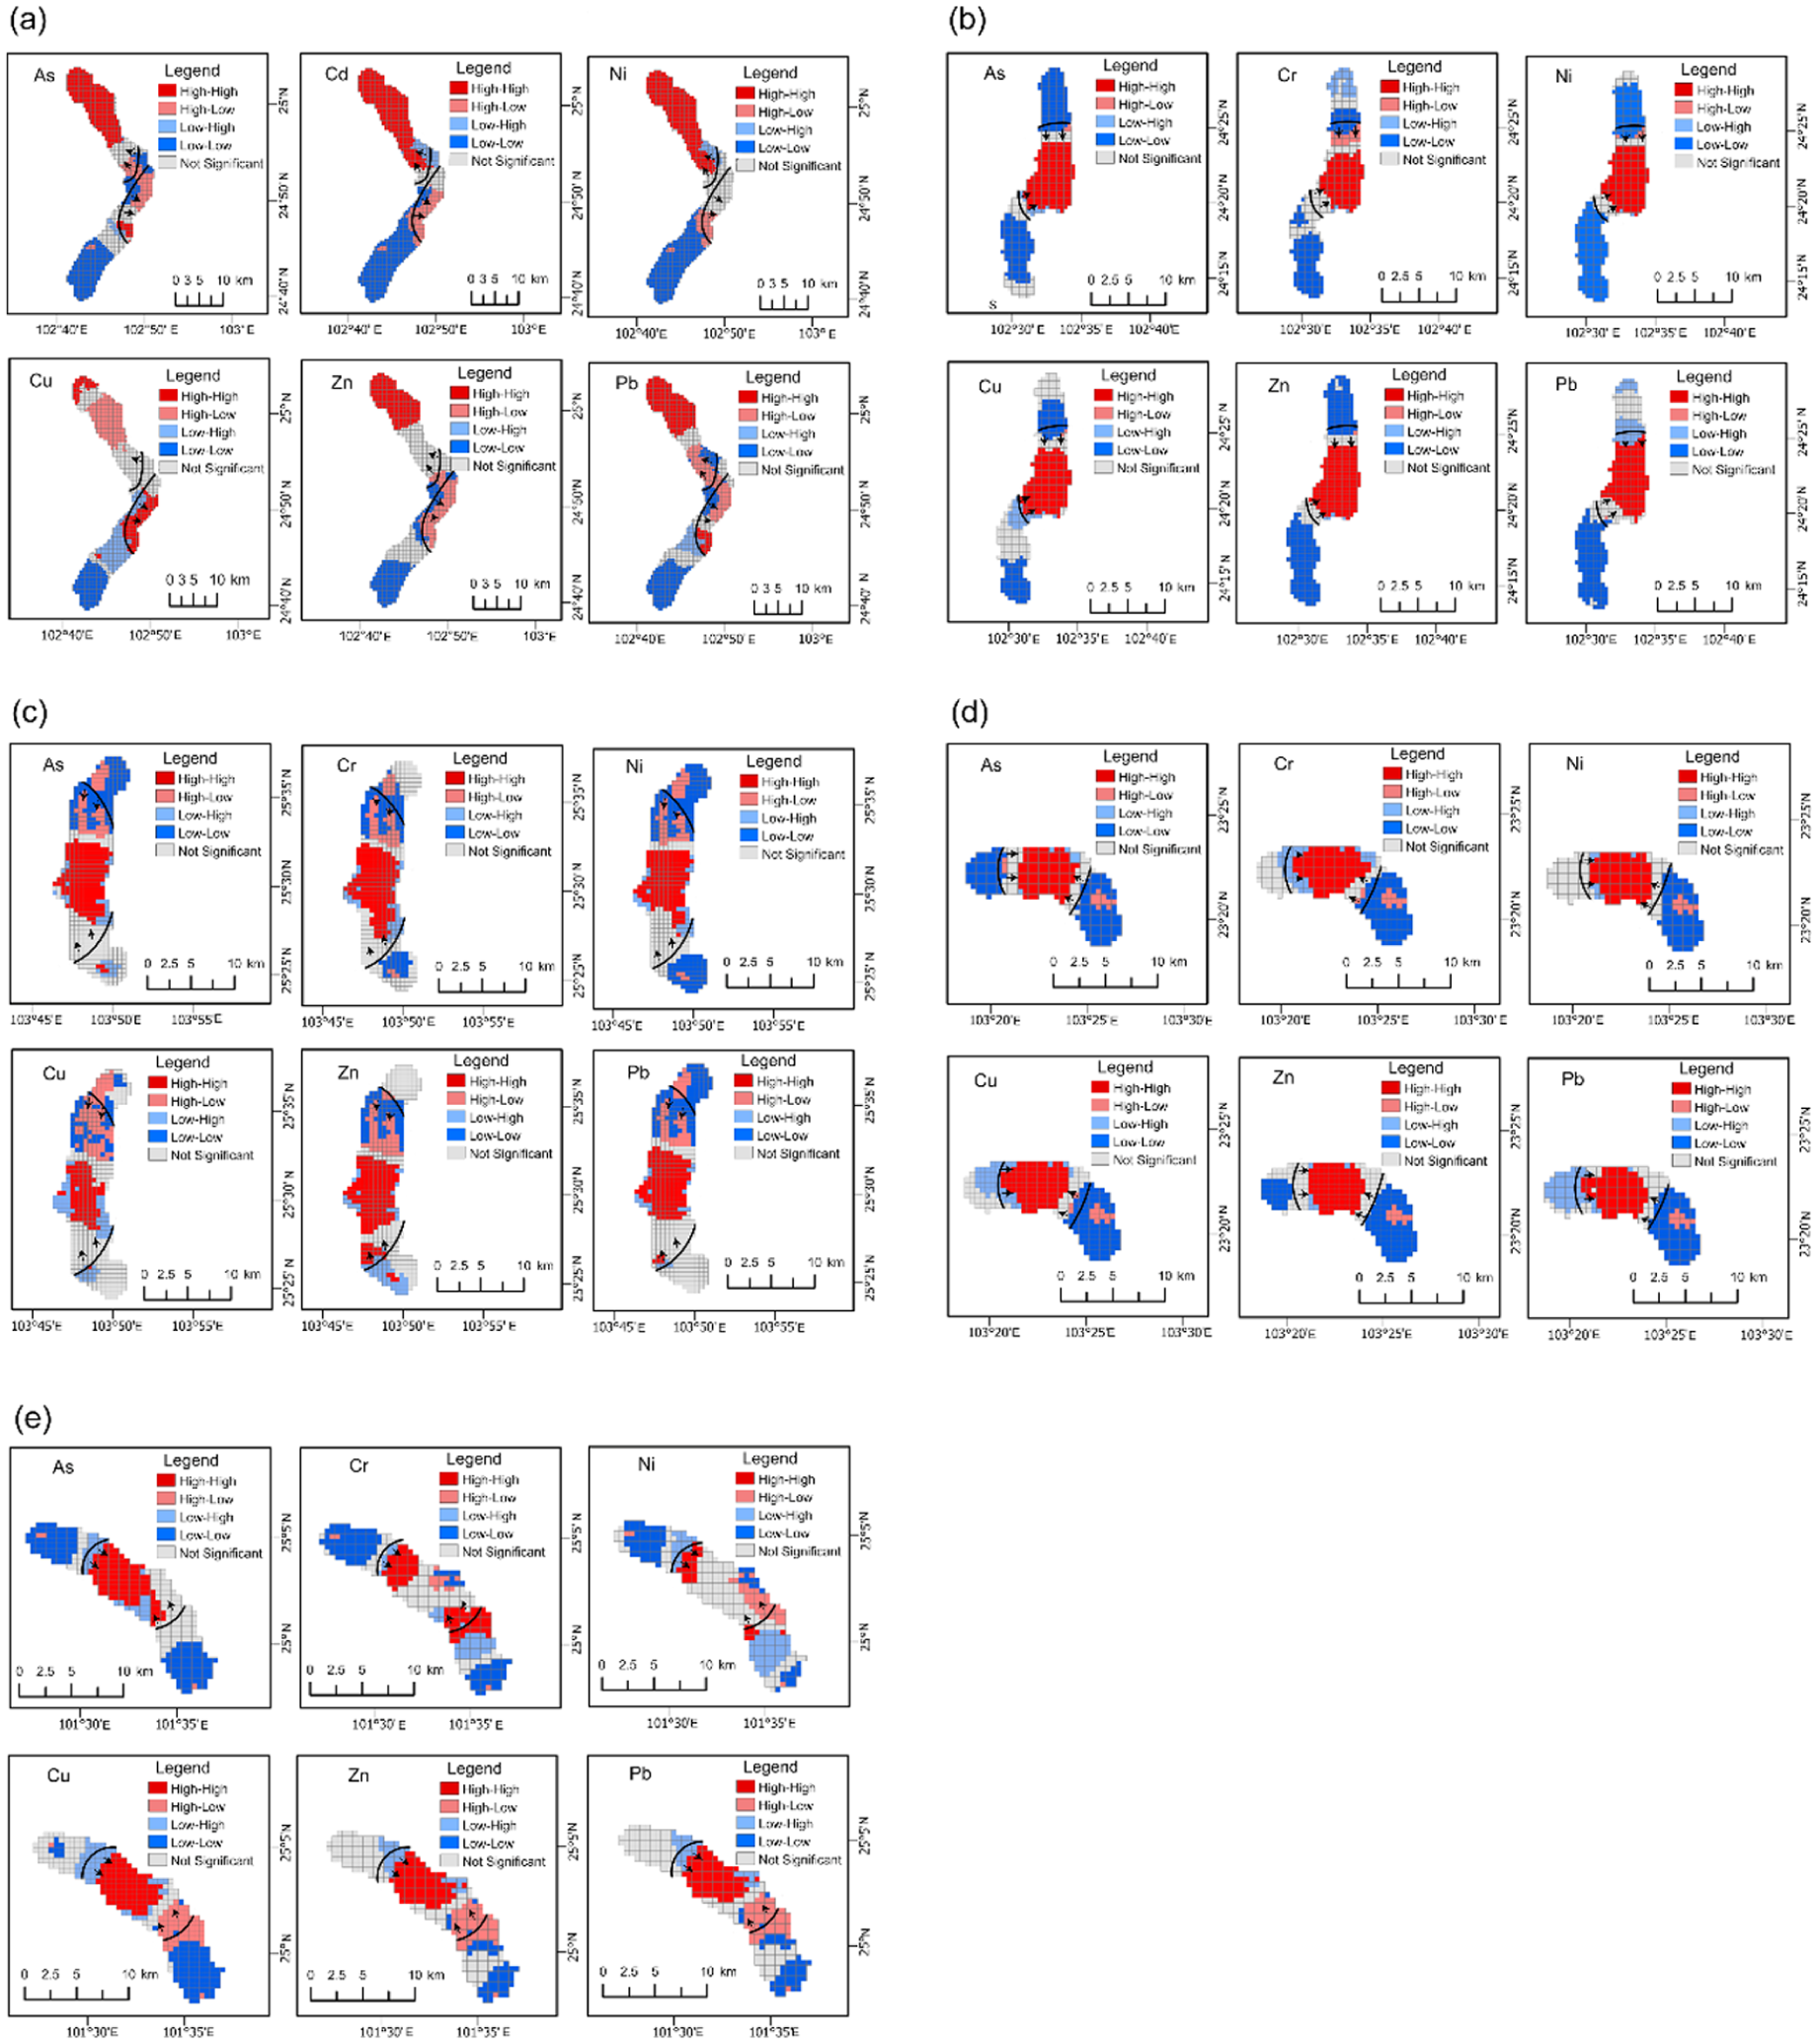
The spatial interaction between urbanization and heavy metals in soil. High-High represents high UEPI and high heavy metal concentrations. High-Low represents high UEPI and low heavy metal concentrations. Low-High represents low UEPI and high heavy metal concentrations. Low-Low represents low UEPI and low heavy metal concentrations. Not Significant indicates that the relationship between the UEPI and heavy metal concentrations is not significant in space. The area on the inner side of the arc-shaped line (indicated by the arrow) represents the region exceeding the threshold of the UEPI: (a) Kunming, (b) Yuxi, (c) Qujing, (d) Hunghe, and (e) Chuxiong.
Discussion
The differences in heavy metal concentrations among different urban districts
Because old urban blocks are typically concentrated zones of early industrial development in cities, decades or even centuries of industrial production activities have led to substantial emissions of heavy metals into the environment in the form of exhaust gases, wastewater, and waste residues (Huang et al., 2021).
For example, the northern research area of Kunming includes parts of Wuhua District, Guandu District, Xishan District, and Panlong District, which are old urban blocks. Among them, Wuhua District has important industrial parks, mainly distributed in tobacco and supporting industries, light industry, and electronic information industry. Xishan District has equipment manufacturing, new materials, and fine phosphorus chemical industries. Guandu District has new-type industry and equipment manufacturing. Moreover, this area is the most densely populated area in Kunming. The important industrial parks in Yuxi City, namely the Hongta Industrial Park and Yuxi National High-tech Industrial Development Zone, are located in the central and eastern parts of Hongta District, and the population there is relatively large. The National Mengzi Economic and Technological Development Zone and the Honghe Comprehensive Bonded Zone are located in Mengzi City, Honghe Prefecture. The main industries are metallurgy, energy, and building materials, and the population activities are concentrated in the central part of the research area. In the research area of Qujing City, the regions with more severe soil pollution are home to large steel plants, as well as multiple chemical and machinery manufacturing enterprises. There are no heavy industrial enterprises in the research area of Chuxiong City. The heavy metals generated by these industrial activities enter the soil and accumulate over time (Chen et al., 2022). The old urban blocks also experience heavy traffic, with a large number of motor vehicles contributing to mechanical wear and exhaust emissions. Vehicle exhaust contains heavy metals such as Pb, Cr, and Ni, which are released into the atmosphere as particulate matter (Lee et al., 2006; Yadav et al., 2019; Zeng et al., 2020). Additionally, the long-term residential activities in old urban blocks have led to the continuous discharge and accumulation of various domestic waste materials, which have had a lasting impact on the soil environment (
The trend of the impact of urbanization on heavy metals in soil
The UEPI had varying explanatory power for different heavy metals, and the weights of the influencing factors differed across cities, this is primarily attributed to the complex sources of heavy metals in urban areas and the varying urban development orientations and levels among different cities. For example, Kunming is the core city of the Central Yunnan urban agglomeration, with the highest urbanization rate and a diversified industrial structure; Yuxi is mainly focused on tobacco processing, machinery manufacturing, and non-ferrous metal processing; Chuxiong has a slow urbanization rate and is dominated by green industries; Qujing is an important industrial base in Yunnan; Honghe is primarily based on traditional industries such as non-ferrous metals, new materials, and chemicals (Zhang et al., 2019; Zhu et al., 2024). The impact of the UEPI on heavy metal concentrations in Chuxiong soil is not significant, which is consistent with our previous results (Table 2), as the region is subject to relatively weak human activity disturbances. In Kunming, Yuxi, Qujing, and Honghe, the UEPI showed a significant positive correlation with the concentrations of most soil heavy metals, indicating that soil heavy metals are significantly affected in the current rapid urbanization process. However, Cu in Kunming and Yuxi, and Zn in Qujing exhibited very poor correlations. In the ANOVA (Figure 2.), these three heavy metals did not show significant differences across different regions. Therefore, it can be concluded that these three heavy metals are less affected by human activities.
By analyzing the optimal weights of the environmental impact factors used to construct the UEPI (Table 4), it was found that for each city, the road network density within a 2-kilometer radius had a significant impact on soil heavy metal concentrations. Therefore, it can be inferred that transportation has a substantial influence on soil heavy metal concentrations within a 2-kilometer radius, this is consistent with the research findings of Fang et al. (2025). NL and NDVI mainly affect soil heavy metal concentrations within a radius of 2 km or 3 km. Within the 2 km and 3 km ranges, a higher nighttime light index typically indicates more frequent human activities in the area, including industrial production, commercial activities, and residential life. These activities generate a large amount of heavy metal pollutants. Vegetation within a 2 km range captures broader interception dynamics. These findings can provide effective assistance for our urban planning and related work.
Once the heavy metal concentration reaches the breakpoint, the slope of its increase becomes steeper. When subjected to a certain level of disturbance, ecosystems can tolerate a certain degree of change through natural processes such as adsorption, sedimentation, and redox reactions. However, when the disturbance reaches a critical point and exceeds the self-purification capacity of the soil ecosystem, the pollution level changes dramatically (Persson et al., 2022). This suggests that keeping the UEPI within a threshold can help to minimize the increase in soil heavy metal concentrations.
By constructing the UEPI, we clearly elucidated the distribution characteristics of soil heavy metal concentrations along the urbanization and their influencing factors. Compared with methods in other literature (Cui et al., 2019; Ma and Sun, 2020), the UEPI we constructed based on GA is innovative and applicable for soil heavy metal research because it optimizes the weights and selection of urbanization factors and can generate different indices for different regions. Combined with the segmented regression analysis, it can dynamically adapt and accurately identify thresholds, thereby providing more effective assistance for future urban management and planning.
Spatial autocorrelation analysis identifies urbanized polluted areas
The results of the spatial autocorrelation analysis are consistent with the conclusion that soil heavy metal concentrations are significantly influenced by the urbanization process. However, the high frequency of High-Low, Low-High, and Not Significant characteristics in the aging urban blocks necessitates a comprehensive analysis in combination with the results of the segmented regression analysis. This phenomenon is likely due to the fact that, although the degree of urbanization in these aging urban blocks is higher than in the new urban blocks, it has not exceeded the environmental threshold, leading to the occurrence of High-Low and Not Significant characteristics. It is also possible that heavy metals in the old urban blocks have been dispersed to surrounding regions through atmospheric and water flow actions (Cui et al., 2024; Schwab et al., 2014), despite the relatively low level of urbanization, the area is heavily polluted, exhibiting Low-High and Not Significant characteristics. A small portion of High-Low characteristics also appeared in the new urban blocks. This might be due to the relocation of enterprises from the old urban blocks, which led to population migration and created zones with relatively high levels of urbanization. However, in the new urban blocks, heavy metals emitted by enterprises have not had sufficient time to accumulate in the soil. Additionally, the lower building density compared to the old urban blocks may facilitate the dispersion of these pollutants over greater distances (Yang et al., 2020), resulting in less pronounced accumulation of heavy metals in the new urban blocks.
To further verify the practical applicability of the UEPI threshold determined in this study, we have identified the areas within the study regions that exceed the average threshold (Figure 4). Except for Chuxiong, the polluted areas identified in the other study regions all lie within areas that exceed the threshold. Therefore, the identified threshold has significant application value for environmental protection.
Due to the complex pollution sources and physicochemical properties of soil heavy metals, there are challenges in the fine identification of their pollution sources. Although methods such as isotope ratio analysis can accurately identify pollution sources, their high cost and technical complexity limit their widespread application. In this study, the UEPI was constructed via GA, and bivariate spatial autocorrelation analysis was performed. This approach can effectively identify heavy metal pollution areas caused by urbanization, and based on the weights of urbanization factors, soil pollution control and prevention were carried out with an emphasis on the level of correlation featuring high efficiency and low cost. By replacing independent variables and dependent variables this method can be applied to the study of other environmental pollutants and extended to a wide range of other fields, demonstrating significant advantages compared with other methods.
Conclusions
Based on GA, this study developed the UEPI and clarified the spatial distribution of soil heavy metals along urbanization gradient. The study effectively linked the urbanization process with soil heavy metal concentrations by combining UEPI with bivariate spatial autocorrelation, and clearly identified the key contaminated areas. Despite the diverse viewpoints in numerous previous studies on the distribution patterns of soil heavy metals along the urban-rural gradient, this study reveals a clear pattern along areas of urbanization, where the concentration of heavy metals increases with the increase in urbanization, and this process has a threshold. The key contaminated areas are mainly concentrated in old urban blocks. Reasonably regulating urbanization factors, such as industry and transportation, and optimizing control intensity in combination with regional characteristics will help keep pollution within the threshold. The integration of dynamic GA and spatial analysis offers a dynamic research framework for studies in the field of environmental pollution, and it can also be extended to other fields. In the future, we will conduct an in-depth analysis of heavy metals in deeper soil layers to determine the impact of urbanization on the vertical soil pollution.
Supplemental Material
sj-docx-1-tee-10.1177_2754124X251414334 – Supplemental material for An urbanization environmental pressure index to disentangle the threshold effects of urbanization on soil heavy metal pollution
Supplemental material, sj-docx-1-tee-10.1177_2754124X251414334 for An urbanization environmental pressure index to disentangle the threshold effects of urbanization on soil heavy metal pollution by Honglin Liu, Xiao Sun, Liding Chen, Linjun Shen, Kaifeng Yang and Fangkai Zhao in Transactions in Earth, Environment, and Sustainability
Footnotes
Funding
The authors disclosed receipt of the following financial support for the research, authorship, and/or publication of this article: This work was supported by the Yunnan Provincial Science and Technology Project at Southwest United Graduate School (202302AO370012), the Yunnan University (CZ22621211), and the Scientific Research and Innovation Project of Postgraduate Students in the Academic Degree of YunNan University (KC-24248953).
Declaration of conflicting interests
The authors declared no potential conflicts of interest with respect to the research, authorship, and/or publication of this article.
Data availability statement
The data used in this study will be available upon request from the corresponding author.
Supplemental material
Supplemental material for this article is available online.
Author Biographies
References
Supplementary Material
Please find the following supplemental material available below.
For Open Access articles published under a Creative Commons License, all supplemental material carries the same license as the article it is associated with.
For non-Open Access articles published, all supplemental material carries a non-exclusive license, and permission requests for re-use of supplemental material or any part of supplemental material shall be sent directly to the copyright owner as specified in the copyright notice associated with the article.