
Abstract
The cooling and humidifying effects of urban blue-green space (UBGs) have been widely recognized as the nature-based solutions (NbS) for improving urban thermal comfort. However, the synergistic effects and impact pathways of water bodies and green spaces on urban thermal environment have not been thoroughly explored. Here, by integrating meteorological factors (MFs) data and GF-2 images in Shanghai, China, we comprehensively investigated the synergistic effects and impact pathways of UBGs on MFs and physiological equivalent temperature (PET) through generalized additive models (GAM) and structural equation models (SEM). The results demonstrated that air temperature (Ta) exhibited a stronger correlation with the distribution of UBGs at larger scales than relative humidity (Rh) did. In contrast, Rh was primarily influenced by adjacent UBGs within an 80 m buffer. The synergistic effects of UBGs on MFs exhibited nonlinear characteristics, which were dependent on specific threshold ranges of UBGs parameters. Consequently, increasing UBGs does not necessarily enhance cooling or humidifying effects. In addition, the influence of UBGs on MFs was scale-dependent. This scale dependency resulted in distinct dominant pathways through UBGs patterns-MFs variations-PET distributions. Specifically, at the 80 m buffer scale, UBGs significantly affected Rh, but its indirect effect on PET was limited and non-significant. While at the 1500 m scale, Ta modulation emerged as the dominant pathway, as evidenced by its higher path coefficients. These findings are essential for further understanding the synergistic effects and impact pathways of UBGs on MFs and thermal comfort, as well as providing actionable insights for climate-adaptive UBGs planning.
Keywords
Introduction
Cities modify their surface energy balance and generally show higher temperatures than surrounding rural areas. This phenomenon, known as the urban heat island (UHI) effect, poses severe adverse impacts on coupled human-earth system, such as impaired air quality, increased cooling energy consumption, and compromised health of urban residents (Chen et al., 2024a; Stewart et al., 2021). Therefore, implementing mitigation strategies to improve urban thermal environment is of great significance for researchers, policymakers, and citizens (Matthews et al., 2025). Compared to measures such as high albedo materials and cool pavements, the thermal environment effects of urban blue-green spaces (UBGs), particularly their cooling and humidifying effects, are widely recognized as a nature-based solution (NbS) for improving urban thermal comfort (Kim et al., 2024; Wang et al., 2024). Consequently, an increasing number of studies seek to understand the thermal effects of UBGs, especially their cooling effect, in order to inform actionable UHI mitigation strategies (Li et al., 2023a; Rahman et al., 2024).
In contrast to single-component landscapes comprising only water bodies or green spaces, the combination of blue and green spaces predominates as the more common form of UBGs (Yu et al., 2020). However, green and blue spaces exhibit fundamentally distinct microclimate regulation mechanisms, resulting in more complex thermal effects when integrated as UBGs (Zhou et al., 2023). Specifically, green spaces regulate the urban thermal environment through transpiration and the shading effect, thereby impacting air temperature (Ta) and relative humidity (Rh). In contrast, blue spaces moderate microclimates primarily through evaporation, which subsequently regulates Ta and Rh (Gunawardena et al., 2017; Rahman et al., 2024). Additionally, it is noted that the biophysical processes of UBGs are reciprocally regulated by the microclimates they modify. For instance, evapotranspiration of UBGs can regulate RH of surrounding areas, while these modified RH conditions subsequently impact the evapotranspiration rates of UBGs through vapor pressure deficit (VPD) feedbacks (Yan et al., 2023). Therefore, exploring the synergistic effects of UBGs presents significant challenges and has drawn increasing scholarly attention (Fei et al., 2023).
Current evidence regarding the synergistic effects of UBGs comes mainly from comparing individual components to their combinations. (Dzyuban et al., 2022; Li et al., 2023). For example, compared to green spaces alone, urban parks incorporating both vegetation and water bodies provide a stronger and more stable cooling effect under different background meteorological conditions (Geng et al., 2024). The integration of UBGs enhances the synergistic cooling effects, demonstrating superior thermal regulation performance to that of individual blue or green spaces (Zhou et al., 2023). Furthermore, UBGs jointly modify the spatiotemporal patterns of Ta and Rh, with the resulting impacts on thermal comfort characterized by diurnal and seasonal asymmetries (Hu and Li, 2020). Nevertheless, the interactive effects between the blue and green spaces within these integrated UBGs remain poorly understood.
Identifying the key factors that govern the thermal effects of UBGs is fundamental to understanding the interactive mechanisms between blue and green spaces and to optimizing urban ecological landscapes for better thermal comfort (Budzik et al., 2025). Landscape patterns, particularly green spaces coverage and distance to blue space are commonly identified as potential drivers of UBGs synergistic effects (Park et al., 2024). Supporting this, Wu et al. (2018) observed an interaction between the cooling effects of a reservoir and surrounding vegetation, with the reservoir's influence diminishing and the vegetation's influence strengthening with increasing distance. Additionally, the synergistic effects of UBGs exhibit a distance-dependent pattern. For example, Fei et al. (2023) found the synergistic effect of the water body and vegetation was the most significant at 6 m from the water body. While Shi et al. (2020) revealed the synergistic cooling effects of UBGs were obvious in 7-12 m surrounding waterfront areas, where the mean Ta reduction was 3.3 °C higher than the combined cooling effects of standalone water and forest. While these observations are valuable, they offer limited analytical insight into the fundamental synergistic mechanisms operating within UBGs. (Shi et al., 2024; Zhao et al., 2023).
Urban thermal comfort is influenced by multiple factors, such as Ta, Rh and wind speed (Ws). However, existing studies have predominantly focused on cooling effects of UBGs, potentially leading to opposite effect for urban thermal comfort enhancement when neglecting their influence on other meteorological factors (MFs) (Acero et al., 2024; Wadman, 2024). For instance, high humidity under hot conditions may inhibit the evaporative heat loss by sweat on human bodies, and even increase heat risk in wet climate induced by urban humid heat (Zhang et al., 2022). The thermal comfort benefit due to green spaces can be offset by water bodies because of intensified night-time warming and humidifying effects during the warm months (Cruz et al., 2021; Hu and Li, 2020). Consequently, the benefit of green spaces in relieving heat stress is less pronounced than what Ta measurements alone would suggest, due to the concurrent humidifying effects (Chen et al., 2024b). Furthermore, MFs impact urban thermal comfort through multiple pathways. For example, the relative contributions of cooling and humidifying effects from green spaces to universal thermal climate index (UTCI) regulation vary significantly across different climate zones (Yu et al., 2025). Therefore, investigating the complete pathways through which UBGs impact thermal comfort is critical to enabling more targeted optimization strategies for urban heat mitigation (Sheng et al., 2025; Yang et al., 2024a).
In summary, UBGs regulate the spatiotemporal distribution of MFs such as Ta, Rh and Ws, thereby modifying urban thermal environments and human comfort. However, current understanding of the synergistic effects and impact pathways through which UBGs influence these MFs and urban thermal comfort remains insufficient, particularly regarding their combined impact on Rh. This knowledge gap may result in adverse effects on urban thermal comfort when implementing UBGs-based mitigation strategies (Park et al., 2024). To address this, we analyzed hourly MFs data for Ta, Rh, and Ws from 31 meteorological stations in Shanghai, China, to investigate UBGs synergistic effects and impact pathways. The specific objectives of this study are as follows: (1) quantify the synergistic effects and scale-dependent responses of UBGs on MFs (Ta, Rh, and Ws); (2) identify the dominant pathways through which UBGs influence urban thermal comfort; and (3) propose targeted optimization strategies for UBGs to enhance urban thermal comfort.
Materials and methods
Study area
Shanghai is located in the Yangtze River Delta region, covering a total area of approximately 6340.5 km2 and has a northern subtropical monsoon climate (Figure 1). As one of the largest Chinese megacities, rapid urbanization and climate change have led to undesirable impacts on urban thermal environment, e.g., UHI effect and extreme heat. Consequently, the Shanghai government has implemented numerous initiatives to improve urban thermal comfort, particularly through the enhancement of UBGs. These UBGs improvements are recognized as NbS for mitigating urban heat stress (Geng et al., 2024). According to the Shanghai Master Plan (2017-2035), the city plans to establish hundreds of new UBGs, including urban parks, community parks, and pocket parks, to strengthen climate adaptation and enhance urban resilience. Therefore, a full understanding of how UBGs interactively influence MFs and urban thermal comfort is crucial for evidence-based policymaking, which also provides actionable insights for optimizing UBGs design to maximize thermal comfort benefits.
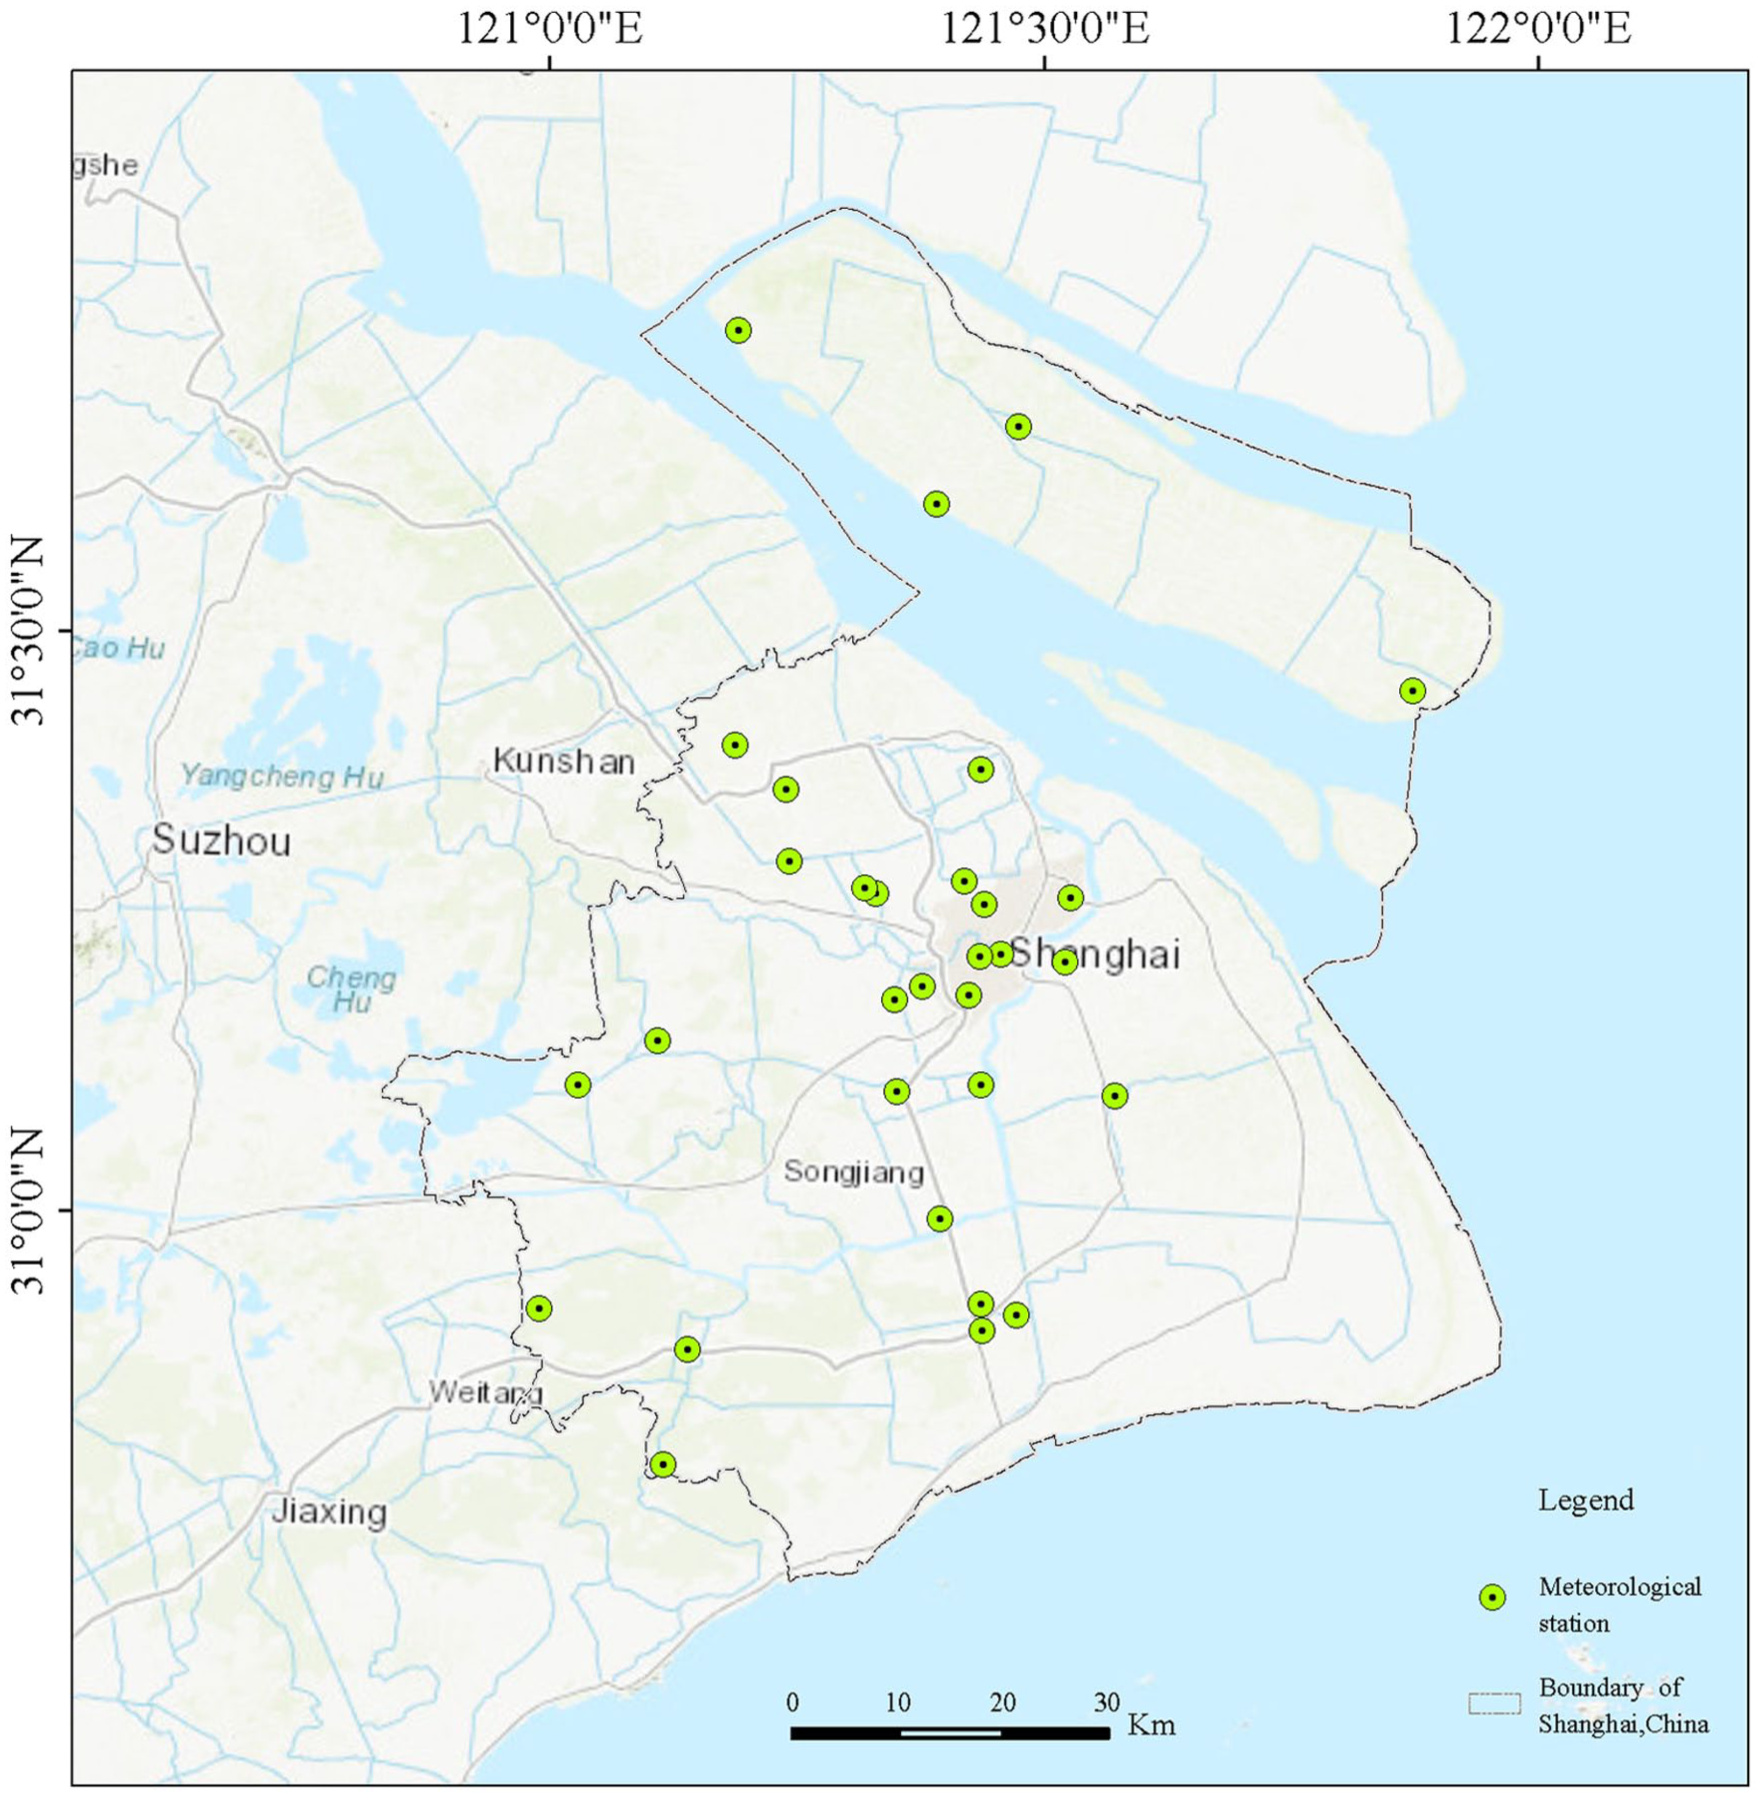
The study areas and location of 31 sampled meteorological stations in Shanghai, China. The specific names of 31 sampled meteorological stations are shown in Online Supplementary Table 1.
Data sources
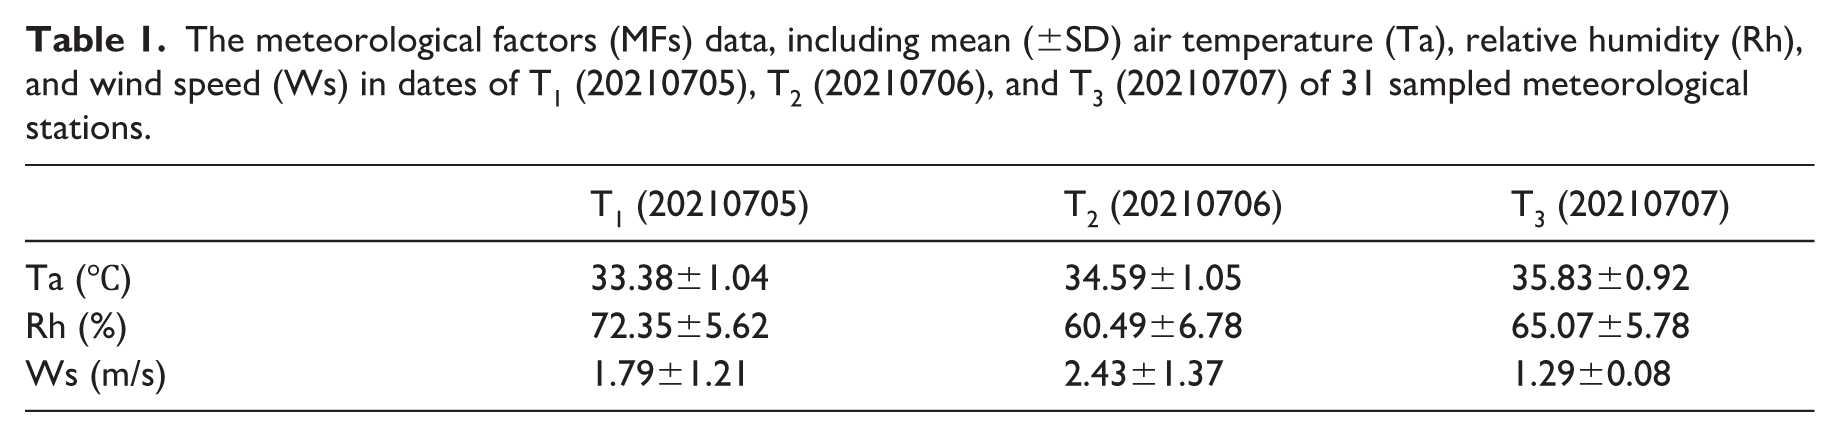
Here, two primary datasets were utilized to investigate the interactive impacts of UBGs on MFs and urban thermal comfort. First, hourly meteorological data, including Ta, Ws, and Rh, were collected from 31 meteorological stations in Shanghai, China. All data were sourced from the State Ecology and Environment Scientific Observation and Research Station for the Yangtze River Delta at Dianshan Lake. Data were selected for the period from 11:00 to 14:00 during July 5-7, 2021. These three selected days were sunny with wind speeds below 4m/s, representing typical summer sunny conditions. The statistical characteristics of these MFs are presented in Table 1. Second, land cover classification was performed using GF-2 satellite imagery, which has a 1-meter spatial resolution in the panchromatic band. These high-resolution data were applied to characterize the UBGs within the surrounding area of each meteorological station (Online Supplementary Figure 1). Specifically, satellite images from April and November 2019 were used. After pre-processing (radiometric calibration, atmospheric correction, and image sharpening), the images were classified using the support vector machine (SVM) algorithm. The landcover was categorized into six types: forestland, grassland, impervious surface, water body, farmland, and bare land. This process, conducted in ENVI 5.3, achieved an overall classification accuracy exceeding 93%.
The meteorological factors (MFs) data, including mean (±SD) air temperature (Ta), relative humidity (Rh), and wind speed (Ws) in dates of T1 (20210705), T2 (20210706), and T3 (20210707) of 31 sampled meteorological stations.
Methods
Determination of impact factors and analysis scale
To investigate the synergistic effects and interactive impacts of UBGs on MFs, five widely-used impact factors were selected based on existing studies, i.e., percentage of green space (G), distance to green space (GD), percentage of water body (W), distance to water body (WD) and percentage of ecological space (E), where E is defined as the sum of G and W (Gunawardena et al., 2017; Hu and Li, 2020; Zhou et al., 2023). Specifically, the G, W, and E were defined as their respective ratios to the total area of the buffer zone surrounding each meteorological station. The GD and WD were measured as the Euclidean distance from each meteorological station to the geometric centers (centroids) of green space and blue space within buffer zones.
Furthermore, given that the impacts of UBGs on MFs exhibit scale-dependent variations, we adopted a multi-scale approach. Eight circular buffer zones with radii of 20, 40, 60, 80, 100, 500, 1000, and 1500 m were established around each monitoring point to comprehensively assess the scale-dependent responses of UBGs on MFs (Bai et al., 2024; Li et al., 2021; Yang et al., 2023) (Figure 2).
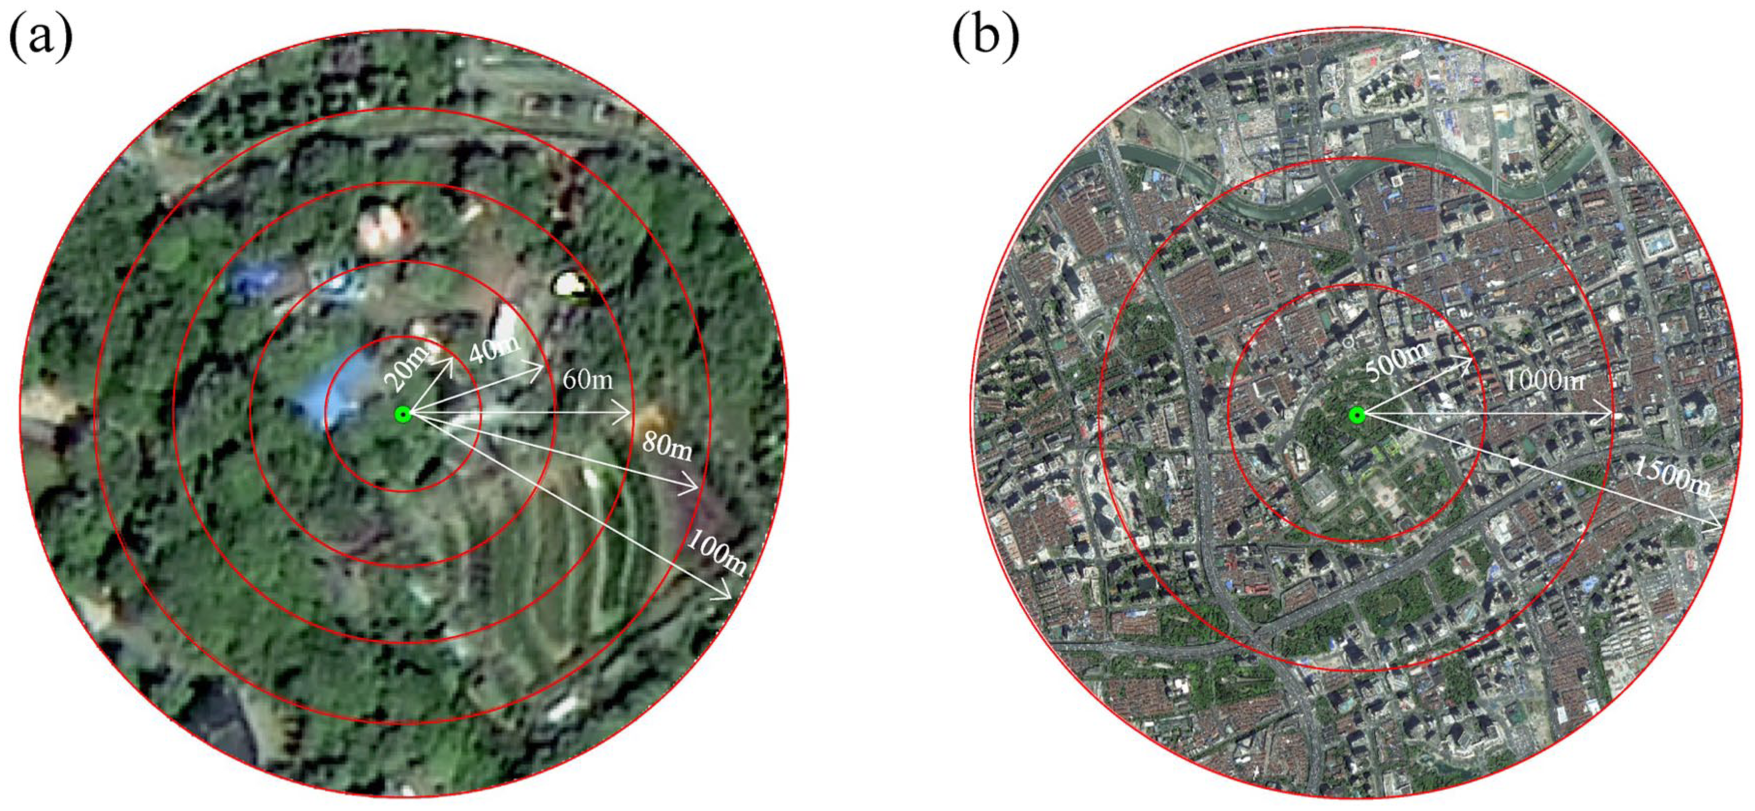
The different buffer sizes, i.e., 20, 40, 60, 80, 100, 500, 1000 and 1500 m of sampled meteorological stations, taken Renmin Park meteorological station as an example: (a) Buffer_20–100 m and (b) Buffer_500–1500 m.
Measurement of urban thermal comfort
Several indices, such as PET, UTCI, and perceived temperature (PTj), are applied to measure outdoor thermal comfort (Lai et al., 2019). Among them, PET is widely regarded as a suitable index for assessing urban thermal comfort (Lehnert et al., 2021). In addition, PET’s use of fixed parameters prevents the parameter drift associated with adaptive models such as UTCI, ensuring a consistent benchmark for cross-regional thermal comparison and making it especially suited for evaluating short-term urban heat stress ((Dzyuban et al., 2022). Hence, we selected PET to quantify the synergistic effects of UBGs. The required input data, including MFs (Ta, Rh and Ws), simulated solar radiation data (Global radiation was set at a fixed value of 1000 W/m2), and human factor conditions (35-year-old male with a height of 172 cm and a weight of 70 kg, summer clothing thermal resistance is 0.44 clothing, metabolic rate was 80 W/m2) were processed using RayMan1.2 to calculate PET values (Xiong et al., 2022).
Statistical analysis
To investigate the scale-dependent relationships and identify the optimal scale, we conducted a Pearson correlation analysis between MFs and UBGs. Then generalized additive models (GAM) were utilized to quantify the marginal interactive and nonlinear effects on the spatial anomalies of Ta and Rh across different scales (Hu and Li, 2020; Wood, 2006). Finally, we deployed a structural equation model (SEM) to establish the causal pathways from UBGs to urban thermal comfort, owing to its strong explanatory power for covariation (Yu et al., 2025). The function of GAM is as follows:

where
The flowchart of this study is shown as Figure 3.
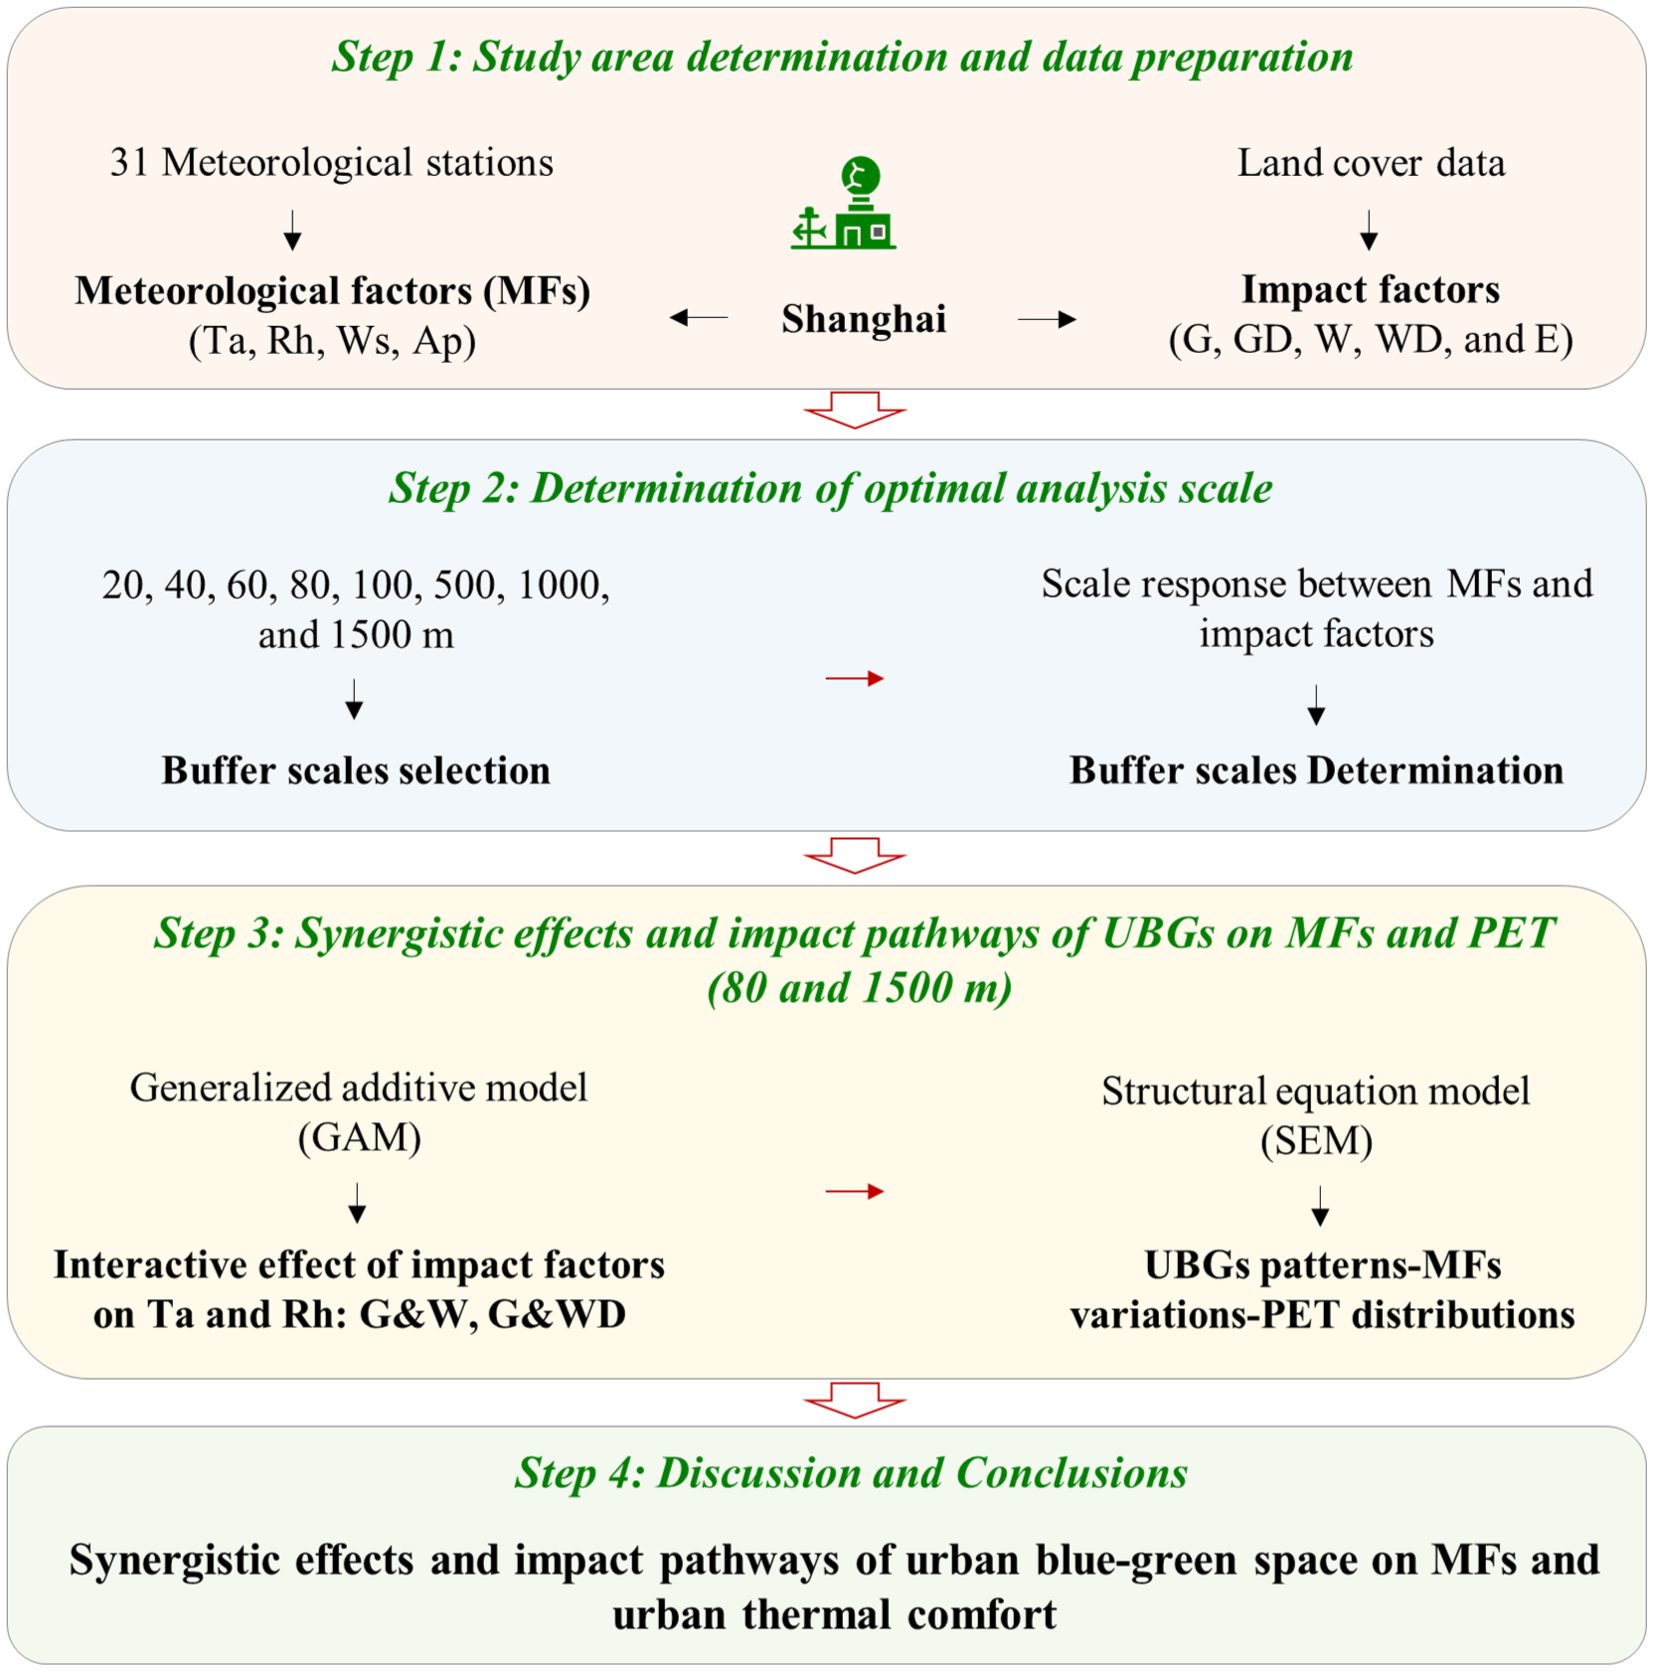
Framework illustrating all the methodological steps taken in this study. The G, GD, W, WD, and E are the abbreviations of percentage of green space, distance to green space, percentage of water body, distance of water body, and percentage of ecological space.
Results
Correlation and scale response of MFs to impact factors
The correlations and scale-dependent responses of MFs to impact factors were analyzed across eight scales for three selected dates. As shown in Figure 4, impact factor E was predominantly negatively correlated with Ta, but this relationship was significant only at larger buffer scales, i.e., E500, E1000 and E1500, with the exception of a weak negative correlation at the 100 m scale in T1 (r = -0.34, P < 0.05). In contrast, E was positively correlated with Rh, primarily at smaller buffer scales, e.g., E40 in T1, E60 in T2 and E100 in T3, with the exception of G500 in T3 (r = 0.48, P < 0.05). Overall, impact factor E was the primary driver of the MFs, with only a few exceptions where other factors showed significant correlations at specific buffer sizes and dates, e.g., G40 and Rh in T1 (r = 0.36, P < 0.05), W1500 and Ta in T2 (r = -0.43, P < 0.05) and W100 and Ta in T3 (r = -0.60, P < 0.05). These findings indicated that the distributions of MFs were shaped by the collective effect of UBGs, rather than by blue or green space alone. Furthermore, Ta and Rh exhibited distinct scale-dependent relationships with UBGs: Rh was significantly positively correlated with E at the 80 m buffer scale, whereas Ta was significantly negatively correlated with E at the 1500 m buffer scale.
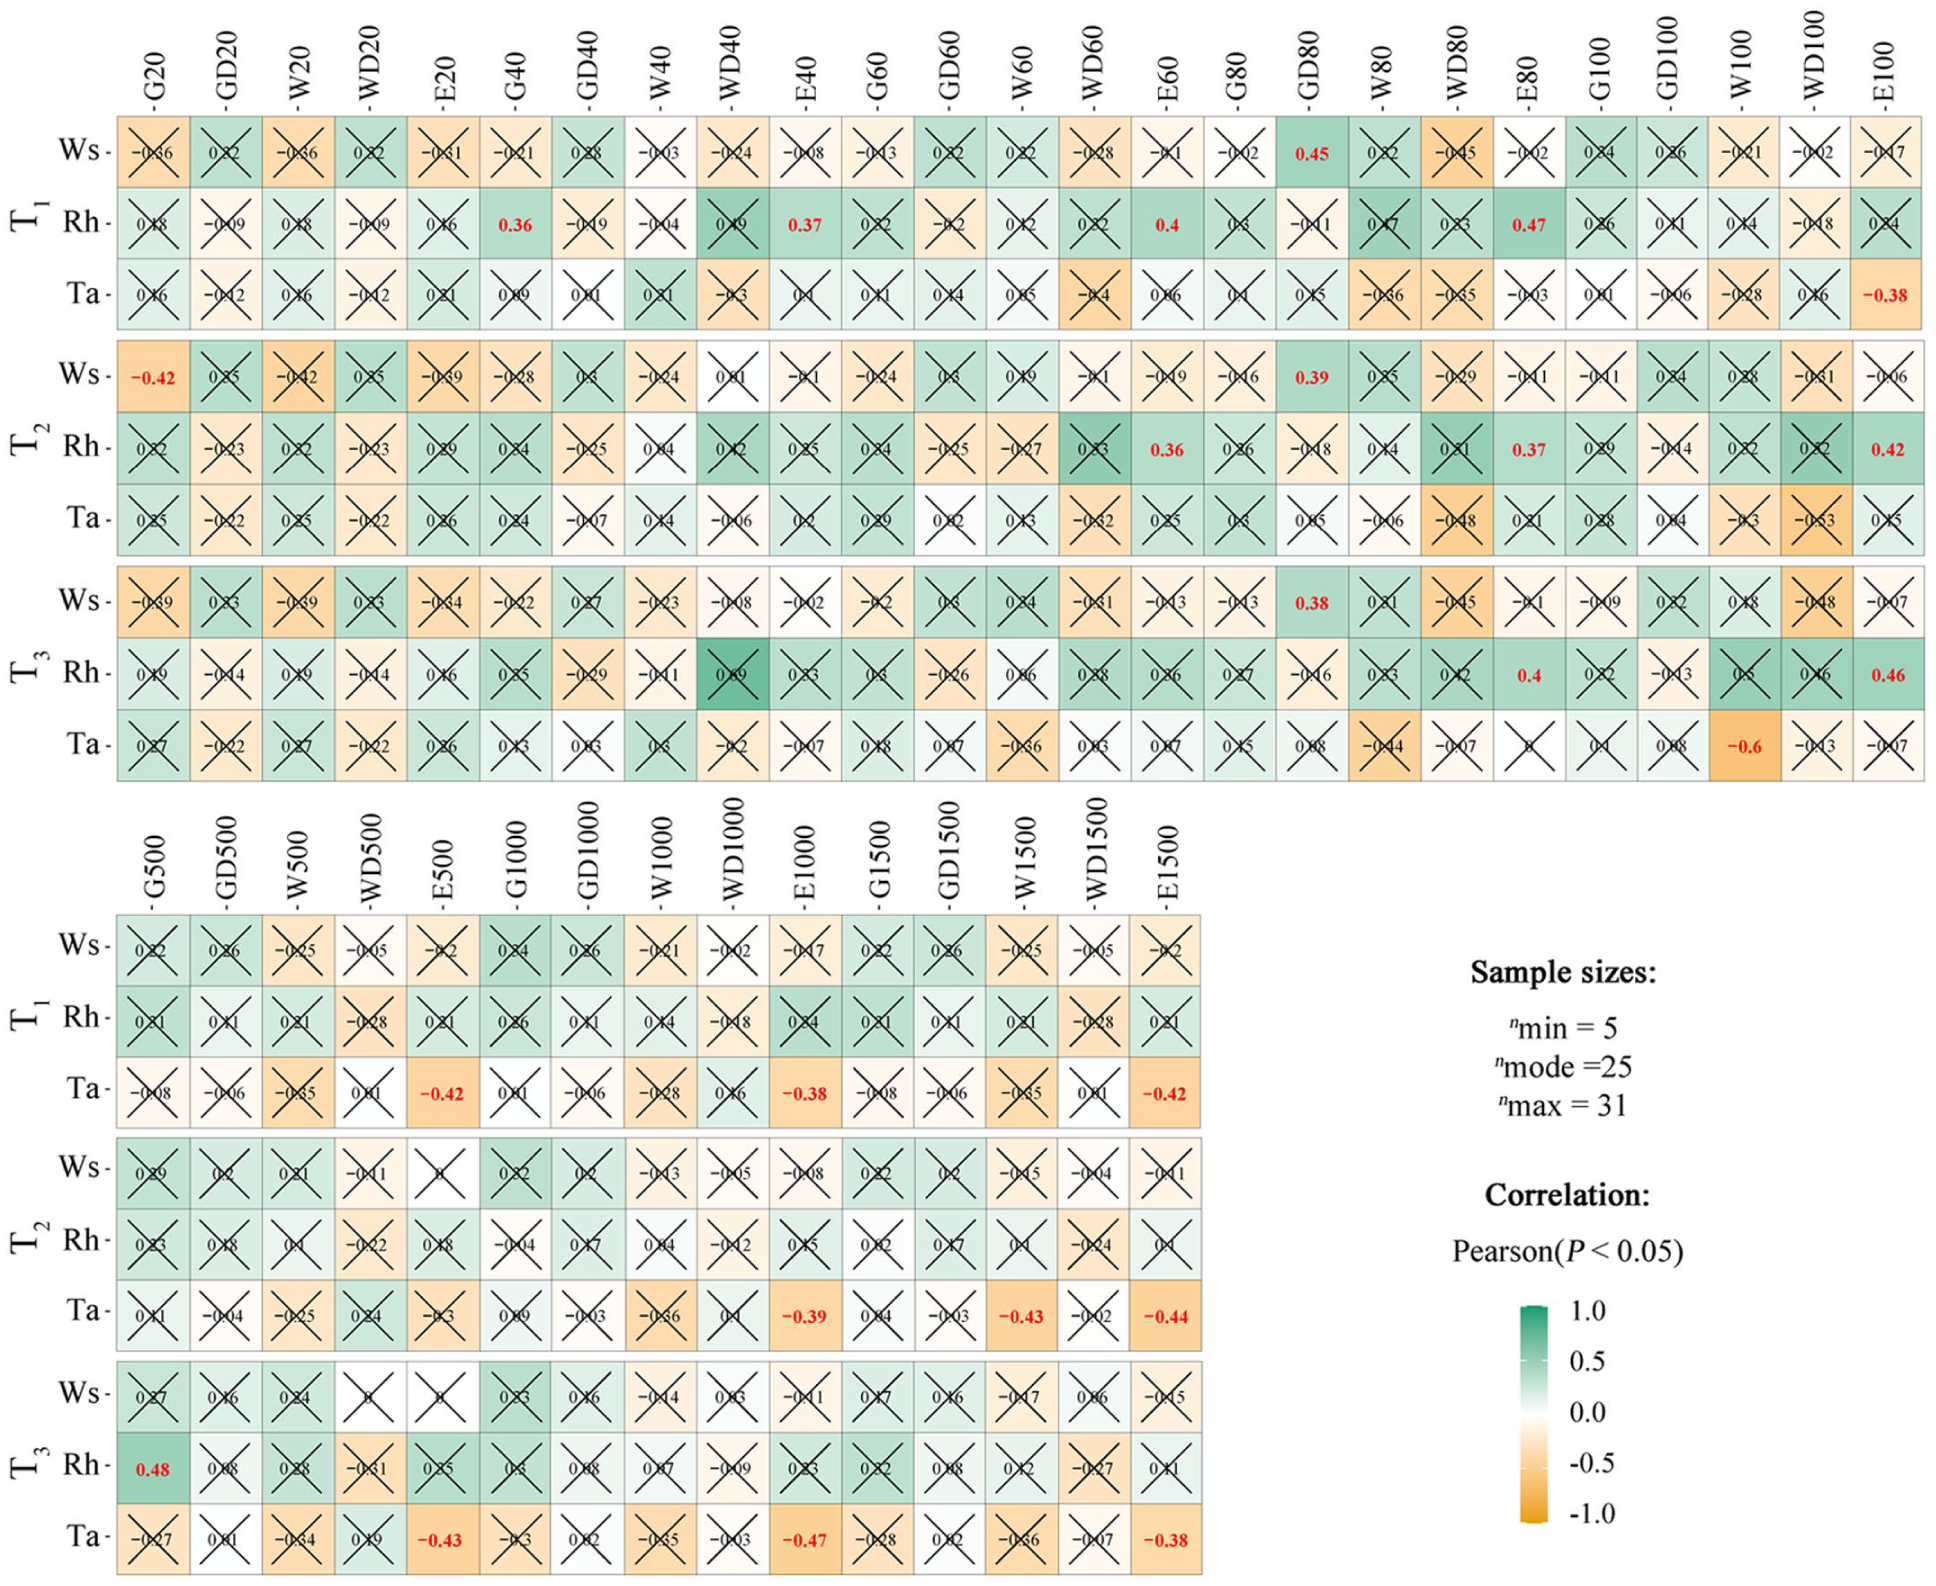
The correlation coefficient (r) between meteorological factors (MFs), i.e., wind speed (Ws), relative humidity (Rh) and air temperature (Ta) and impact factors under different analysis scales, i.e., from buffer 20, 40, 60, 80, 100 to 500, 1000, 1500 m in date of T1 (20210705), T2 (20210706) and T3 (20210707). The "×" symbol denotes a lack of statistical significance in the correlation analysis.
Synergistic effects of UBGs on MFs variations
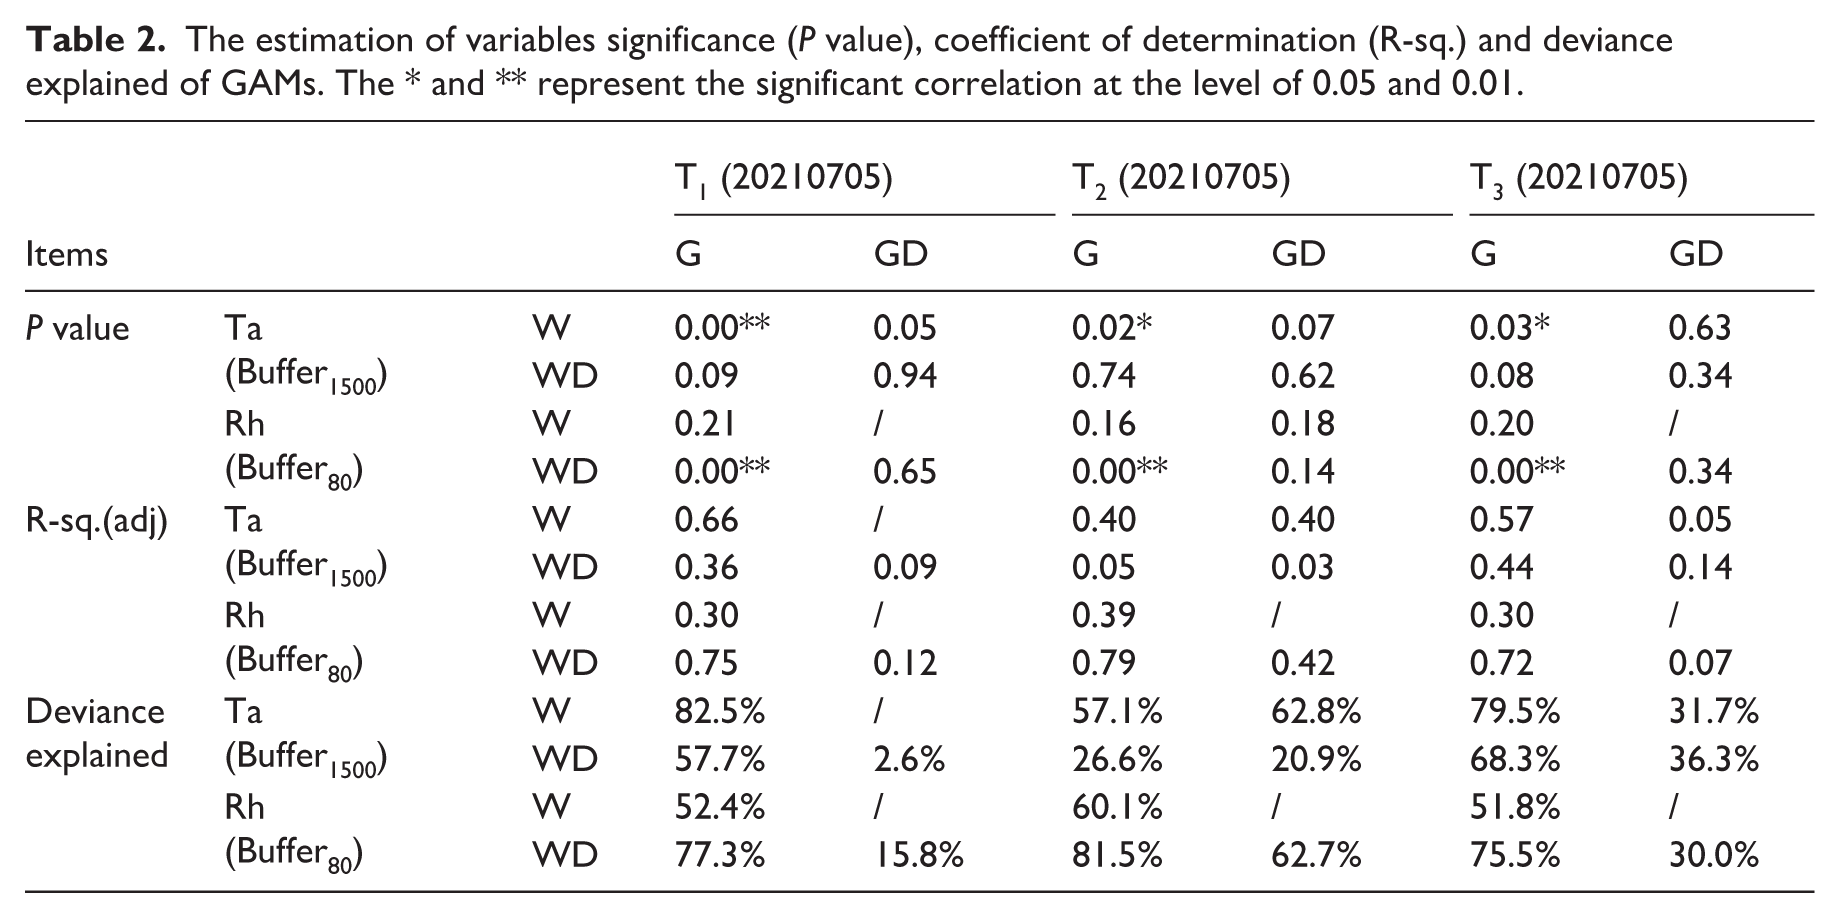
Based on the correlation and scale-response analysis, two characteristic spatial scales were selected to investigate the interactive effects of UBGs on Ta and Rh: the 1500 m and 80 m buffer zones, respectively. As shown in Table 2, GAM were employed to quantify the synergistic effects of pairwise combinations of four UBGs impact factors (G, GD, W, and WD) on Ta and Rh. The variable E was excluded from the analysis, since it inherently represents the combined effects of UBGs on MFs. Based on the significance (P value), coefficient of determination (R2), and deviance explained, the interactive pairs G-W and G-WD were selected for subsequent analysis of their synergistic effects on Ta and Rh, respectively.
The estimation of variables significance (P value), coefficient of determination (R-sq.) and deviance explained of GAMs. The * and ** represent the significant correlation at the level of 0.05 and 0.01.
As shown in Figure 5, the synergistic interaction between G and W had a non-linear influence on Ta at the 1500 m buffer scale. Despite minor inter-daily variations, the effect magnitude was consistently dependent on specific threshold ranges. The general rule can be summarized as follows: when W ranged from 0.10 to 0.20 and G was above 0.02, increasing G enhanced the cooling effect. In contrast, at moderate green coverage i.e., G value was around 0.015, increases in W did not significantly enhance the synergistic cooling. Figure 6 illustrated the interactive effects of G-WD on RH at the 80 m buffer scale. The G-WD interaction exhibited synergistic and non-linear influences on Rh. A general pattern was that the peak humidifying effect occurred when G approached 0.30 concurrently with WD around 40 m. Furthermore, the GAM results indicated the response of Rh to WD was more pronounced than its response to the corresponding factors for Ta.
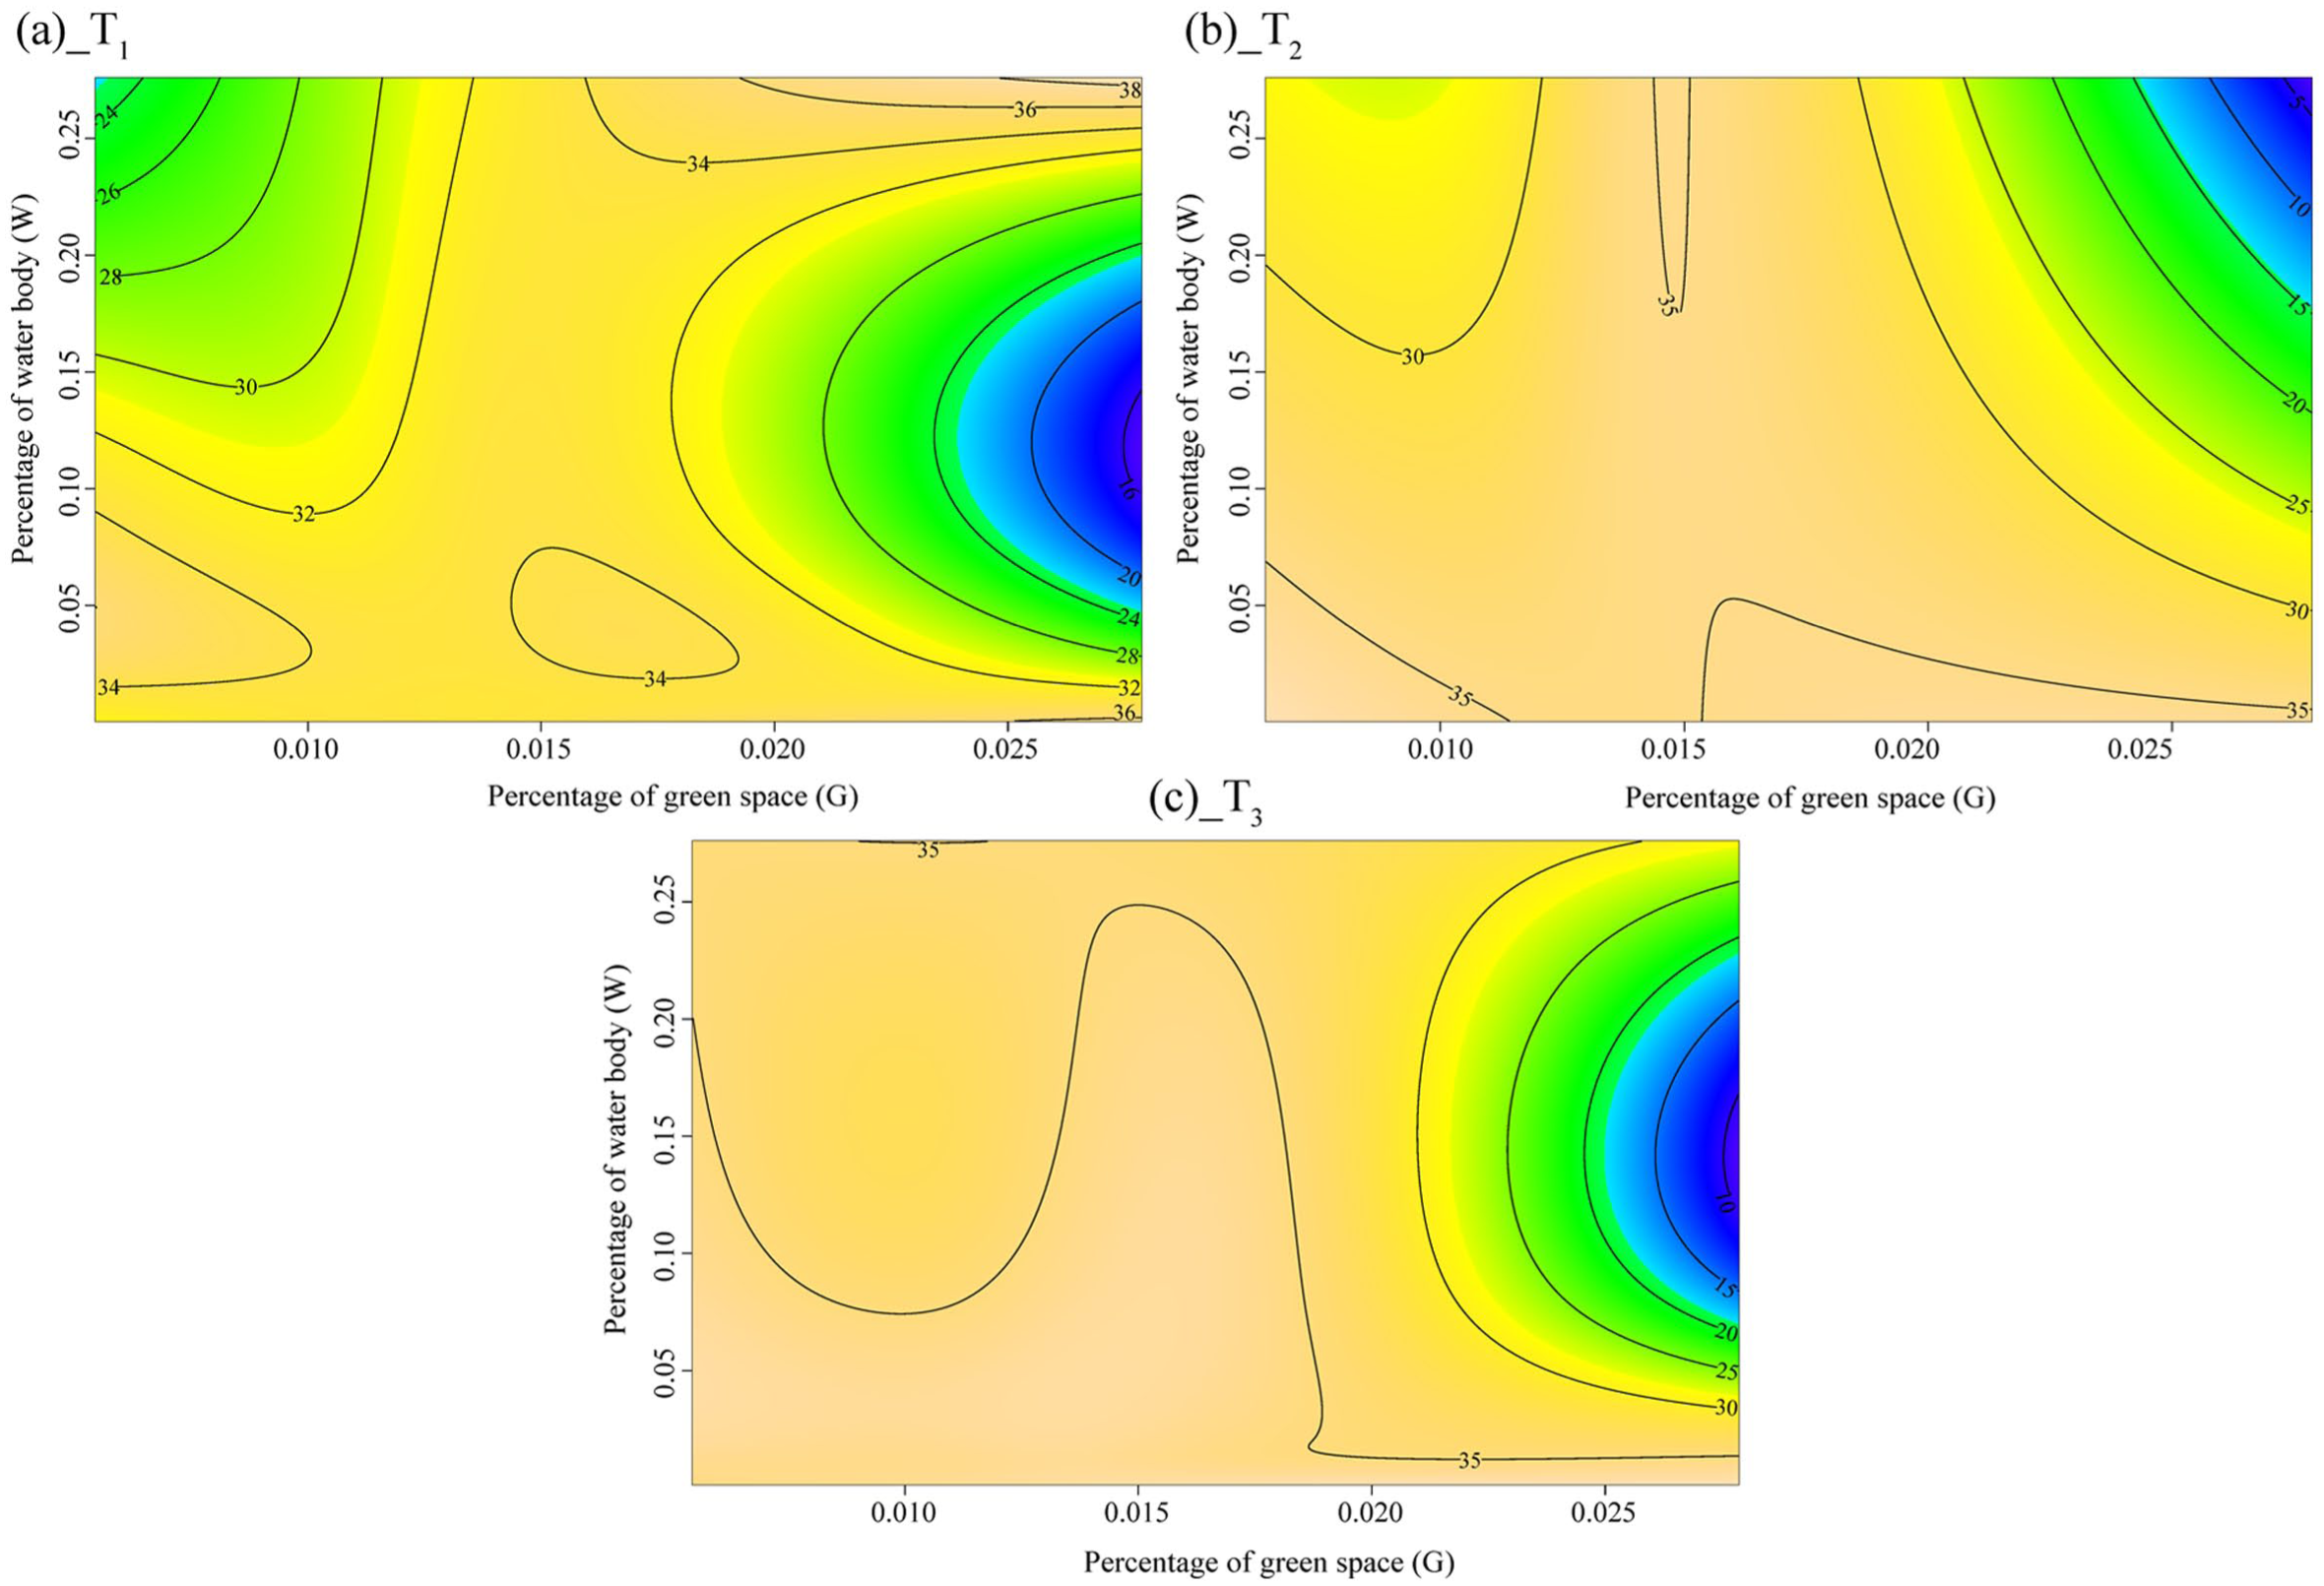
Estimations of synergistic effect of percentage of green space (G) and percentage of water body (W) on the air temperature (Ta) in date of (a) T1 (20210705), (b) T2 (20200706) and (c) T3 (20220708) at scale of buffer 1500 m.
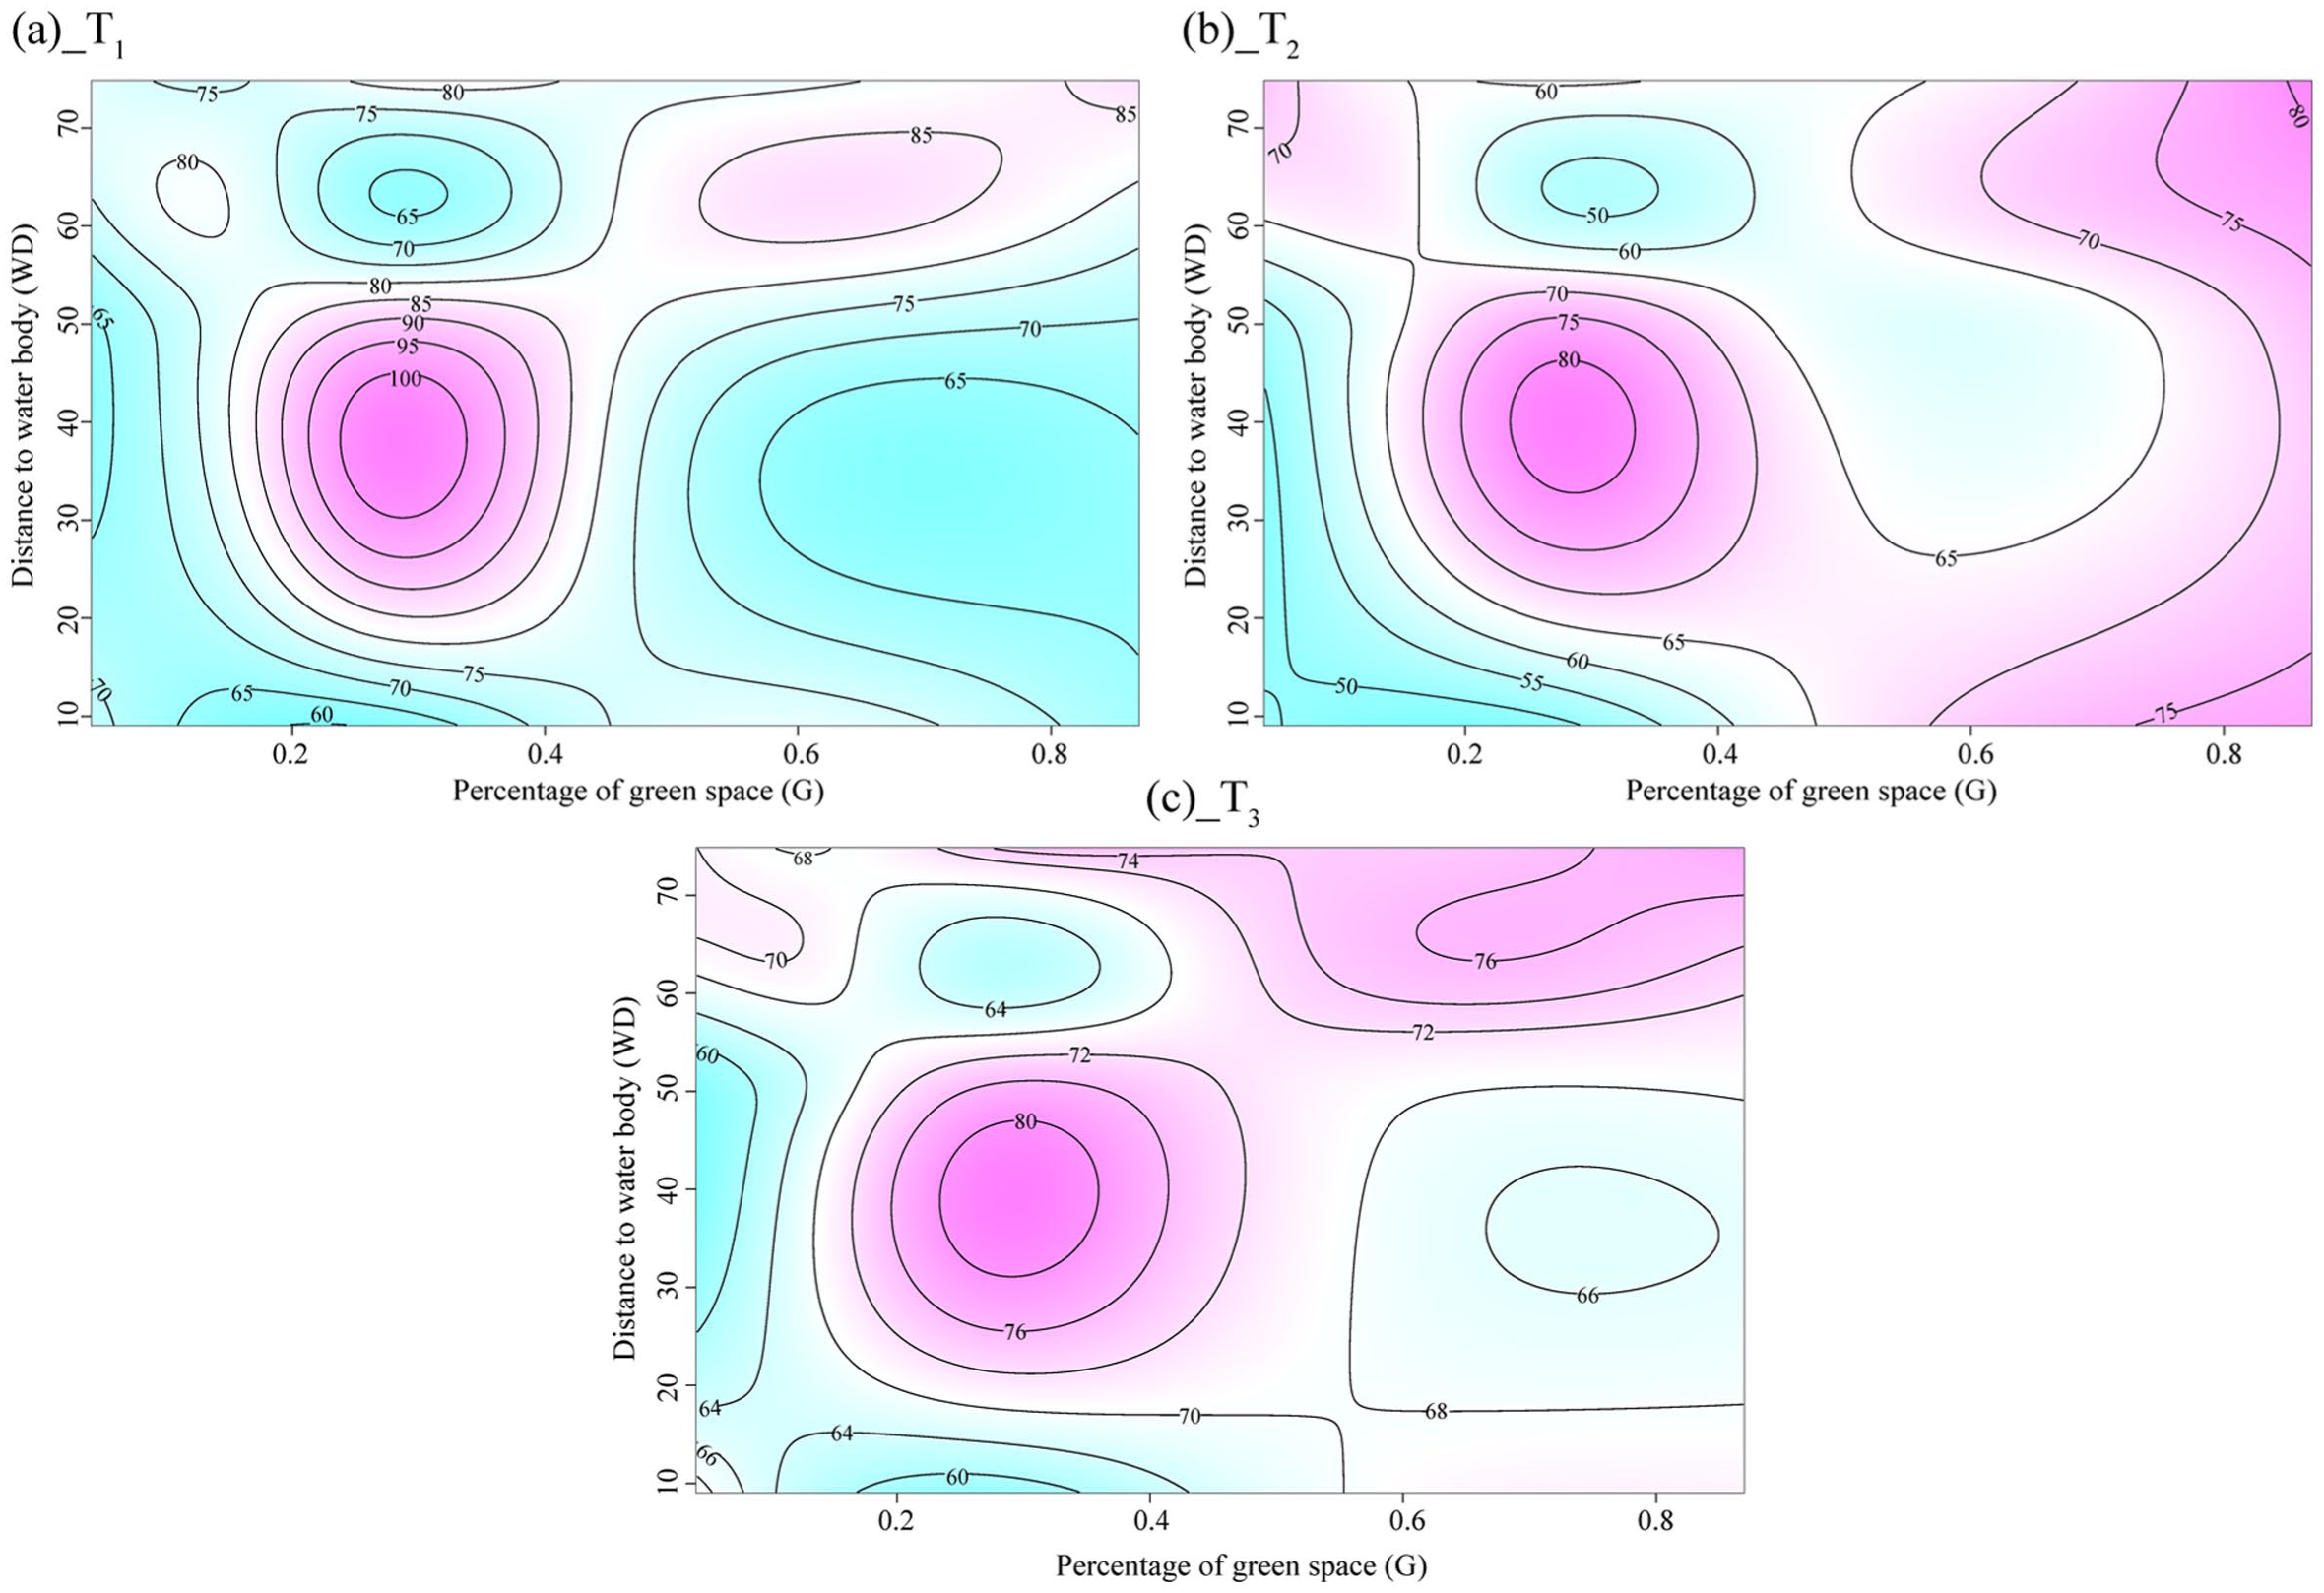
Estimations of synergistic effect of percentage of green space (G) and distance of water body (WD) on the relative humidity (Rh) in date of (a) T1 (20210705), (b) T2 (20200706) and (c) T3 (20220708) at scale of buffer 80 m.
Impact pathways analysis of UBGs on PET
As shown in Figure 7, the PET values calculated from MFs at 31 meteorological stations were 48.1 ± 3.8°C, 48.6 ± 3.8°C, and 50.2 ± 3.0°C (mean ± SD) on the three selected dates, respectively. These values are well above the 41°C threshold for extreme heat stress, representing thermal conditions that induce severe physiological discomfort.
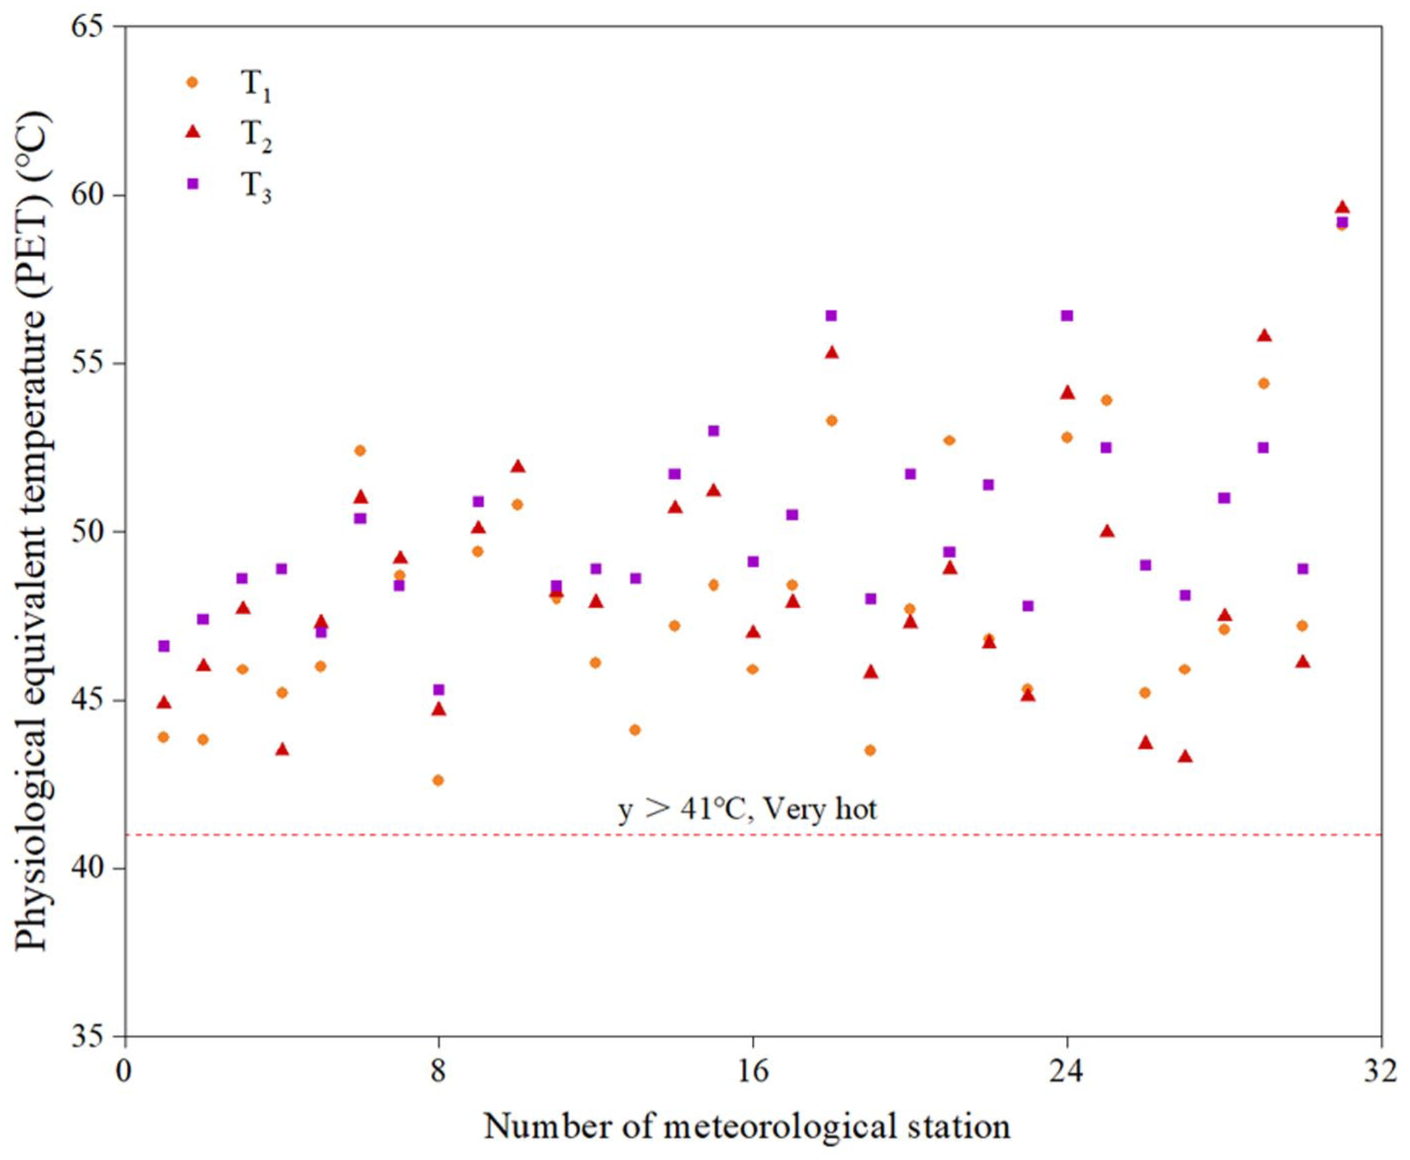
Distribution of physiological equivalent temperature (PET) in date of T1 (20210705), T2 (20200706) and T3 (20220708), PET higher than 41 ℃ was regarded as very hot.
SEM was then employed to analyze the impact pathways of UBGs on PET at two spatial scales: 80 m and 1500 m buffer sizes (Figures 8 and 9). Overall, the impact factors exerted stronger influence on MFs at smaller spatial scales, as evidenced by significantly higher path coefficients for the 80 m buffer compared to the 1500 m buffer. Ta, Rh and Ws exhibited consistent direct effects on PET, as demonstrated by stable path coefficients across different spatial scales and meteorological conditions (P < 0.001). In contrast, the impact factors of G, GD, W and WD influenced PET through both direct and indirect pathways mediated by MFs. Notably, at the 1500 m buffer scale, only W exerted a direct effect on Ta. In comparison, at the 80 m buffer scale, multiple factors, such as W and WD directly influenced Rh, thereby indirectly modulating PET variations. Furthermore, while G, GD, W, and WD exerted no direct effects on Ws, Ws itself maintained consistently high path coefficients across both spatial scales, underscoring its critical role in determining PET.
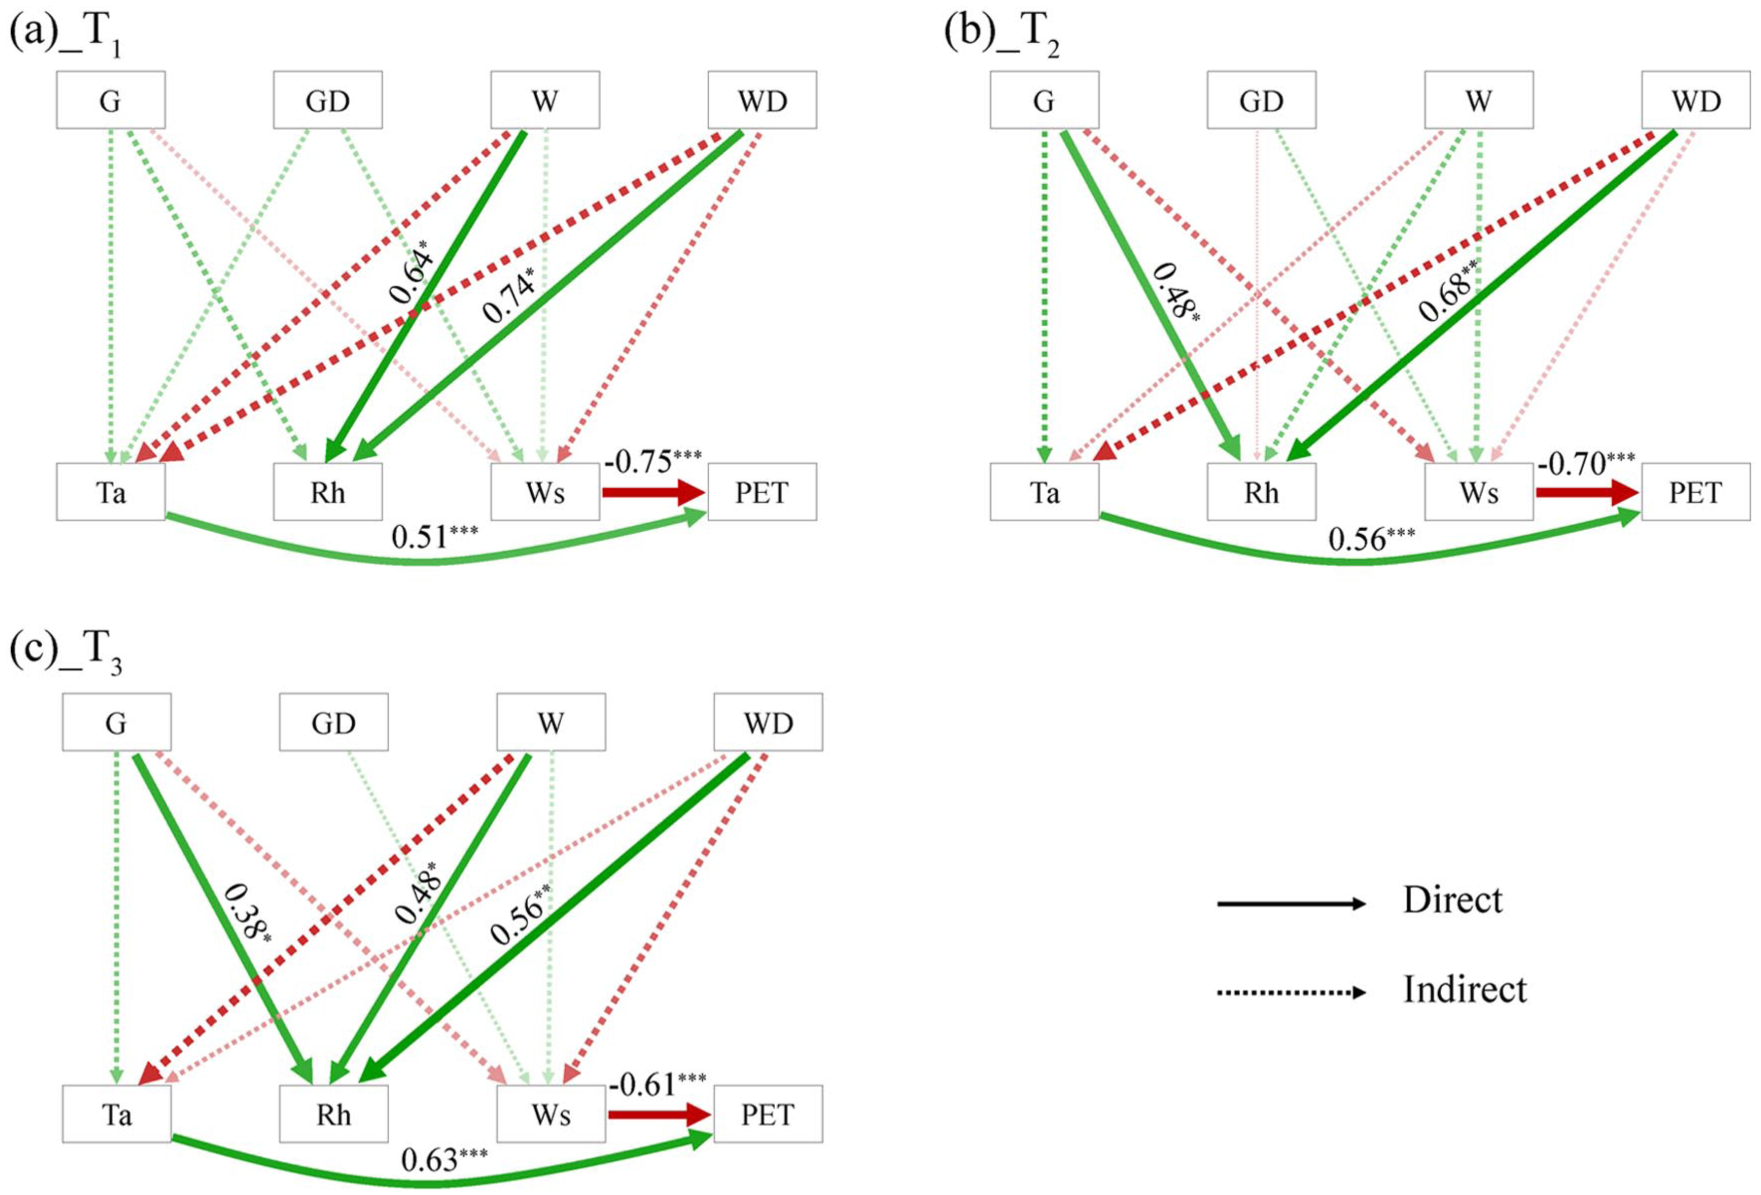
Impact pathways map of UBGs on PET at scale of buffer 80 m. The dotted and solid arrows indicate indirect and direct effects, and the green and red arrows show positive and negative correlations and the value in arrow is normalized path coefficient: (a) T1, (b) T2, and (c) T3.
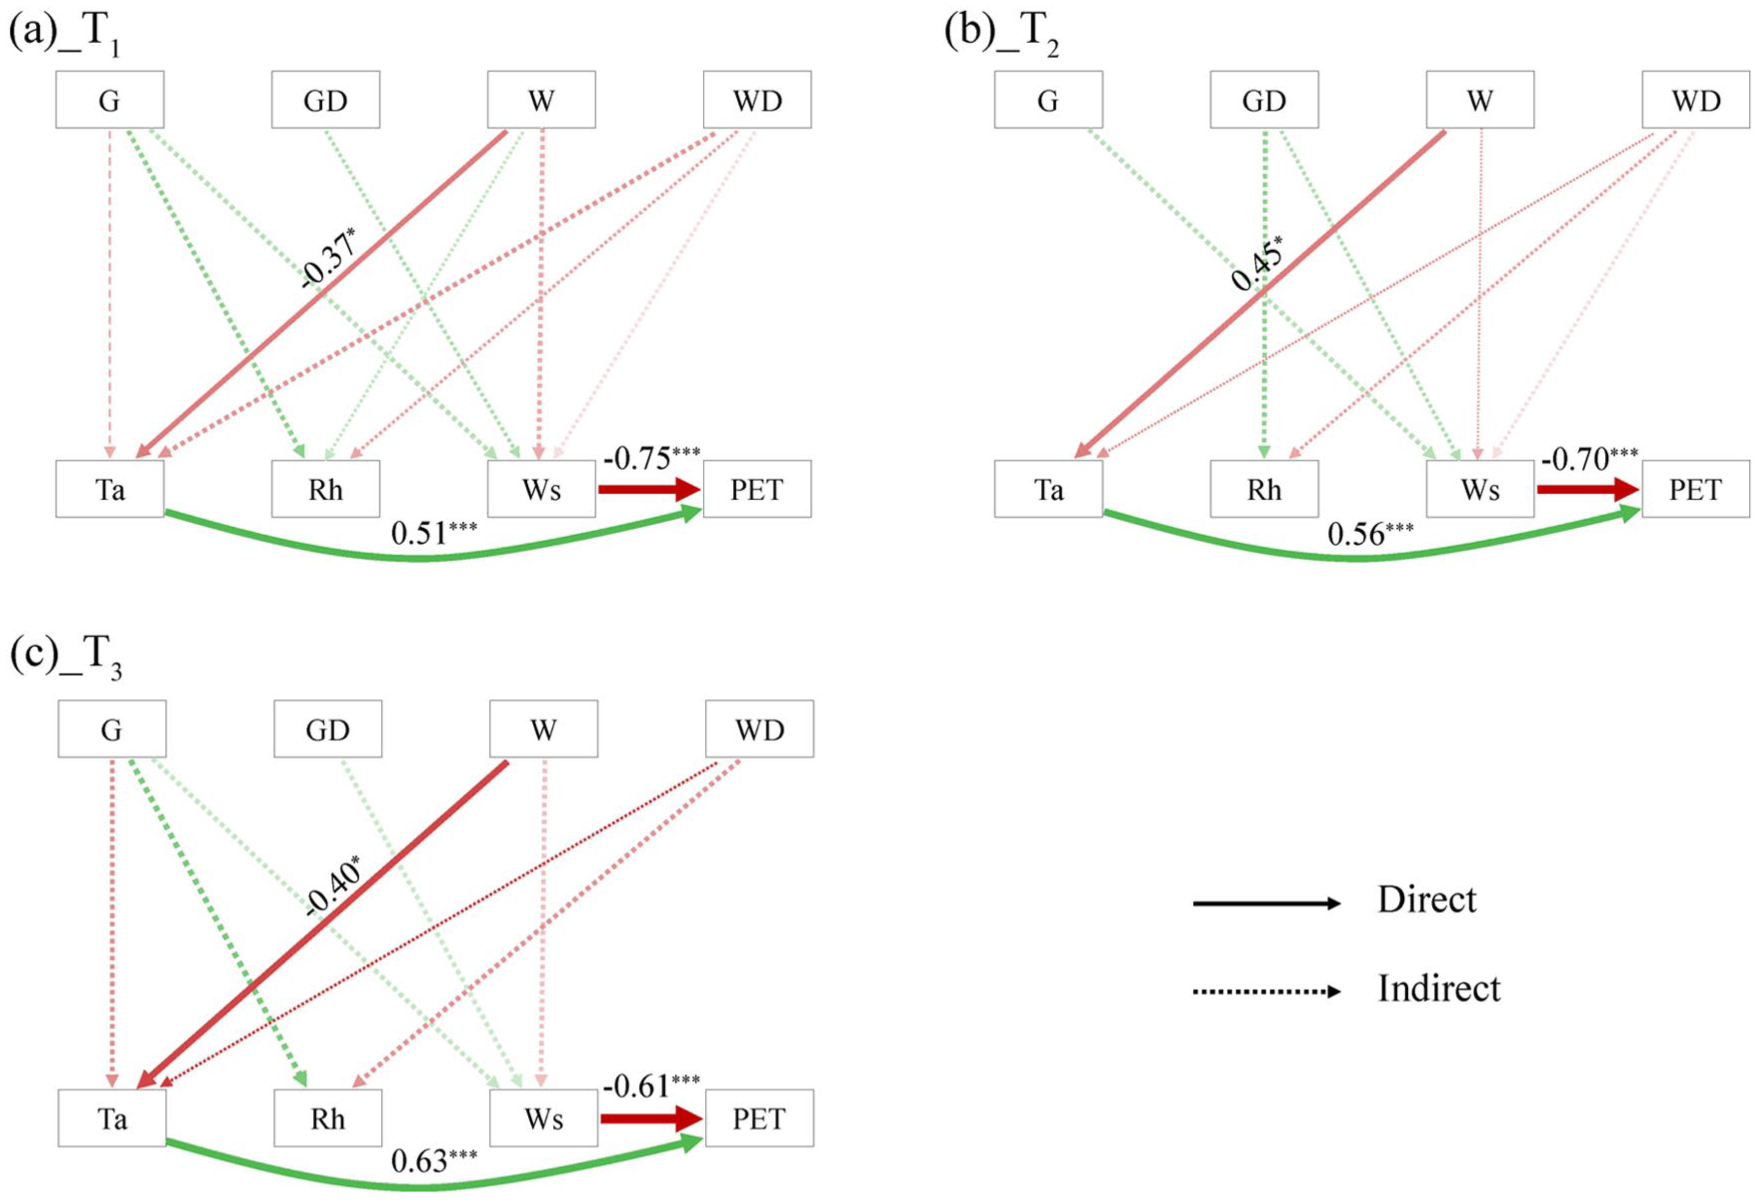
Impact pathways map of UBGs on PET at scale of buffer 1500 m. The dotted and solid arrows indicate indirect and direct effects, and the green and red arrows show positive and negative correlations and the value in arrow is normalized path coefficient: (a) T1, (b) T2, and (c) T3.
In summary, at the smaller 80 m buffer scale, although UBGs had more substantial impacts on Rh, the influence of Rh on PET was limited. Thus, UBGs primarily regulated PET through direct and indirect pathways involving Ta and Ws. In contrast, at the larger 1500 m buffer scale, UBGs influenced PET mainly by modifying Ta, with comparatively weaker contributions from Rh and Ws. The pathway coefficients from Ta, Rh, and Ws to PET, as well as the pathway coefficients for the UBG patterns-MFs variations-PET distributions were provided in Online Supplementary Tables 2 and 3.
Discussion
Synergistic effects of UBGs on MFs
The combination of blue and green spaces represents the most prevalent form of UBGs. While existing studies have largely focused on validating UBG synergies by comparing integrated configurations against standalone water bodies or green spaces, the humidifying effects of such systems remain inadequately investigated. This gap has resulted in insufficient evidence to inform optimal UBGs design strategies for thermal environment improvement (Yu et al., 2025). For example, both Zhou et al. (2023) and Geng et al. (2024) reported that the combined UBGs outperformed simple green space in land surface temperature (LST) reduction during summer time. However, the interactive mechanisms between the blue and green spaces within these integrated UBGs remain poorly understood.
Existing studies, along with our own findings, indicate that the synergistic effects of UBGs on Ta and Rh exhibited nonlinear characteristics (Wu et al., 2018). Our results further reveal that these synergistic cooling and humidifying effects depend on specific threshold ranges of landscape metrics. For example, when G value was around 0.015, increases in W did not significantly enhance the synergistic cooling effect. This suggests that simply increasing water body area does not guarantee enhanced cooling along the waterfront if green space coverage is insufficient. The G-WD interactions exhibited both synergistic effects and nonlinear influences on RH, with peak humidifying effects occurring when G value approached 0.3 and WD reached approximately 40 m. A higher percentage of green space, particularly dense trees, may hinder humidity diffusion. Therefore, appropriate vegetation planning around water bodies is crucial for achieving their synergistic humidifying effect (Gunawardena et al., 2017). Furthermore, Rh variations showed greater sensitivity to WD than Ta did to its corresponding factors, which can be attributed to the dominant role of evaporative humidification from water bodies (Lee and Jim, 2023). While Shi et al. (2020) and Fei et al. (2023) found that UBGs showed peak impacts on Ta variation within 7-12 m and at 6 m from waterfront areas, respectively, the different landscape pattern and background meteorological condition may be possible reasons for this (Li et al., 2021).
Moreover, we found that the correlations of Ta and Rh with their impact factors were scale-dependent. Specifically, Ta was primarily influenced by the distribution of UBGs at larger spatial scales, whereas Rh was mainly affected by adjacent UBGs, corresponding to the 1500 m and 80 m buffer scales in this study, respectively. Existing research has reported varying influence distances of UBGs on Ta, with effects observed up to 1 km (Cheung et al., 2021; Yu et al., 2020). In contrast, while the humidifying effects of UBGs have gained increasing attention, their effective spatial range remains poorly quantified. To our knowledge, only Zhao et al. (2023) have reported that UBGs influence Rh at distances of up to 300 m during summer. This disparity in spatial influence may be attributed to the dominant role of convection in heat transfer, which occurs at faster rates than water vapor diffusion, potentially explaining why the humidifying effects of UBGs are more localized than their cooling impacts (Gunawardena et al., 2017; Yang et al., 2024).
Impact pathways of UBGs on urban thermal comfort
The influence of UBGs on MFs, and the subsequent impact of MFs on urban thermal comfort, are well documented in the literature. However, the complete pathways through which UBGs affect thermal comfort via MFs remain insufficiently explored (Dzyuban et al., 2022; Li et al., 2023b). Furthermore, synergistic effects among UBGs components have been shown to variably influence MFs, thereby directly and indirectly shaping thermal comfort outcomes (Park et al., 2024). Consequently, an incomplete understanding of the full pathways from UBGs to thermal comfort may lead to counterproductive urban heat mitigation strategies (Chen et al., 2024b). For example, previous research has indicated that the cooling benefits of greenspaces can be partially offset by water bodies due to their nocturnal warming and humidifying effects during warm seasons (Hu and Li, 2020). Cruz et al. (2021) also observed a 0.16 °C increase of Ta near river edges, due to the nocturnal warming effect of water bodies. These findings highlight the necessity of elucidating the complete pathways through which UBGs influence urban thermal comfort (Park et al., 2024). Moreover, since urban thermal comfort is influenced by multiple MFs, UBGs can regulate thermal comfort through different dominant MFs under varying contexts (Dzyuban et al., 2022). For example, Yu et al. (2025) reported that in humid climate zones, the humidifying effect of green spaces contributed more significantly to reducing UTCI than in cold climates. In addition, unlike at night, daytime cooling benefits from green spaces can be partially offset by humidity-induced discomfort (Yang et al., 2024b). To our knowledge, the studies cited above are among the few that have explicitly examined the integrated impact pathways of UBGs on urban thermal environments, underscoring the need for further research in this area.
In this study, we established complete impact pathways, i.e., UBGs patterns-MFs variations-PET distributions to fully quantify effects of UBGs on urban thermal comfort. In summary, while the pathways coefficients between MFs and PET remain relatively stable across varying spatial scales and meteorological contexts, those linking UBGs to MFs showed significant sensitivity to various spatial scales. This spatial scale-dependent variability consequently propagates through the complete pathways of UBGs patterns-MFs variations-PET distributions. Specifically, differing from the influence of UBGs on Rh that operates at a relatively small scale, UBGs primarily affected the PET through direct Ta regulation at relatively larger spatial scales. This distinction highlights the critical need to identify the dominant impact pathways of the UBGs patterns-MFs variations-PET distributions across different scales when optimizing local thermal comfort. In addition, the different background meteorological conditions might also affect the impact pathways, which was less discussed and encouraged for further studies (Geng et al., 2024; Hami et al., 2019).
Implication and limitation
This study confirms the scale-dependent and nonlinear synergistic effects of UBGs on MFs, as well as their subsequent pathways influencing PET variations. Specifically, compared to Rh, Ta responds to UBGs at larger spatial scales. The nonlinear synergistic effects of UBGs on MFs indicated that increased UBGs did not necessarily enhance cooling or humidifying effects. For example, at moderate green coverage i.e., G value was around 0.015, increases in W did not significantly enhance the synergistic cooling effect. In addition, the G-WD interaction exhibited a peak humidifying effect when G approached 0.30 concurrently with WD around 40 m. These findings highlight the importance of establishing optimal thresholds for UBGs spatial patterns to enhance their microclimate regulation benefits. Specifically, when green space is insufficient, merely increasing the blue space area does not necessarily enhance their synergistic cooling effect. Conversely, excessively dense vegetation cover may also hinder the diffusion of the humidifying and cooling effects from UBGs. These findings are critical for informing actionable UBG planning aimed at improving thermal comfort. Furthermore, the scale-dependent relationships between UBGs and MFs propagate through the complete pathways of UBGs patterns-MFs variations-PET distributions. The analysis revealed a scale-dependent dominance in these pathways: at the 80 m buffer scale, UBGs significantly affected Rh, but its indirect effect on PET was limited and non-significant. In contrast, at the 1500 m scale, Ta acts as the primary mediator of UBGs effects on PET, as evidenced by its higher path coefficients. Consequently, effective UBGs design must account for these spatial variations in microclimate influences to optimize thermal comfort.
Several limitations of this study should be acknowledged. First, although emerging concepts such as Local Climate Zones (LCZs) and Urban Functional Zones (UFZs) have gained increasing attention in thermal environment research for characterizing intra-urban heterogeneity, the current analysis of 31 meteorological stations did not incorporate these frameworks. Future studies integrating LCZs or UFZs classifications could yield more robust conclusions by better accounting for intra-urban variability (Stewart et al., 2021). Second, while the synergistic effects and impact pathways of UBGs on MFs and PET were analyzed at 80 m and 1500 m buffer scales due to their stronger observed correlations, examining a wider range of scales may lead to different insights and is therefore recommended for future research. Third, while the empirical study is based on three typical sunny summer days in July 2021, it is limited by its short duration. Future studies are encouraged to incorporate more extensive and recent data to strengthen the conclusions.
Conclusions
Based on MFs data from 31 meteorological stations in Shanghai, China, this study employed GAM and SEM to analyze the synergistic effects of UBGs on MFs and their impact pathways on PET. The results indicate that Ta responds to UBGs at significantly larger spatial scales than Rh, which may be attributed to their differing convection rates in the atmosphere. The synergistic effects of UBGs on Ta and Rh exhibited nonlinear relationships. At moderate green coverage i.e., G value was around 0.015, increases in W did not significantly enhance the synergistic cooling effect. Separately, the peak humidifying effect of the G-WD interaction was observed when G approached 0.30 and WD was around 40 m. In addition, a key finding was that Rh variation showed great sensitivity to WD than Ta showed to its corresponding drivers. Moreover, the scale-dependent relationships between UBGs and MFs consequently shaped distinct pathways of UBGs patterns-MFs variations-PET distributions. At the 80 m buffer scale, UBGs significantly affected Rh, but its indirect effect on PET was limited and non-significant. While at the 1500 m scale, Ta modulation emerged as the dominant pathway, as evidenced by higher path coefficients. These findings advance our understanding of the synergistic effects and impact pathways through which UBGs influence the urban thermal environment, while providing actionable insights for climate-adaptive UBG planning.
Supplemental Material
sj-docx-1-tee-10.1177_2754124X251413112 – Supplemental material for Synergistic effects and impact pathways of urban blue-green space on local thermal environment: A case study in Shanghai
Supplemental material, sj-docx-1-tee-10.1177_2754124X251413112 for Synergistic effects and impact pathways of urban blue-green space on local thermal environment: A case study in Shanghai by Xiaolei Geng, Yuan Yuan and Chengwei Li in Transactions in Earth, Environment, and Sustainability
Footnotes
Consent for publication
All authors have reviewed and approved the final version of the manuscript and consent to its submission for publication.
Author contributions
Xiaolei Geng collected, analysed the data and wrote the manuscript. Yuan Yuan processed the data. Chengwei Li edited the manuscript and made constructive comments.
Funding
The authors disclosed receipt of the following financial support for the research, authorship, and/or publication of this article: This work was supported by the Jiangsu Provincial Double-Innovation Doctor Program (No. JSSCBS0629) and the Natural Science Foundation of the Jiangsu Higher Education Institutions of China (No. 25KJB170002).
Declaration of conflicting interests
The authors declared no potential conflicts of interest with respect to the research, authorship, and/or publication of this article.
Supplemental Material
Supplemental material for this article is available online.
Author biographies
References
Supplementary Material
Please find the following supplemental material available below.
For Open Access articles published under a Creative Commons License, all supplemental material carries the same license as the article it is associated with.
For non-Open Access articles published, all supplemental material carries a non-exclusive license, and permission requests for re-use of supplemental material or any part of supplemental material shall be sent directly to the copyright owner as specified in the copyright notice associated with the article.