
Abstract
Current data on Nigeria's economic inequality are available only on a limited national scale. The lack of detailed economic inequality data at Nigeria's lowest administrative levels obscures areas of high inequality within states and local government areas (LGAs). This knowledge gap significantly hampers stakeholders' efforts to eradicate poverty and reduce inequality, which aligns with the UN's Sustainable Development Goals. This study addresses the need to generate economic inequality metrics at local administrative levels. We utilised openly sourced nightlight and gridded population data, which were integrated into a Geographic Information System (GIS) to calculate per capita emissions values at the grid cell level and subsequently determine the Gini index of inequality for the 774 LGAs in Nigeria. The findings indicate that Nigeria falls within the moderate Gini category. However, the Gini index revealed that most areas in the southern region exhibit relatively low and moderate Gini values, indicative of high-performing characteristics. The northern regions were classified as areas with moderate to high Gini values. While this study represents the initial attempt to provide local inequality data for Nigeria and Africa, its findings illuminate areas of high economic inequality at the small administrative level.
Keywords
Introduction
Economic inequality has emerged as one of the defining challenges of the 21st century, with far-reaching implications for social stability, economic growth, and sustainable development. Globally, income and wealth disparities have widened both between and within countries, undermining poverty reduction efforts and contributing to political and social unrest (Wilkinson and Pickett, 2009; World Bank, 2022a). The United Nations (UN, 2015) has recognised the urgency of addressing these disparities through Sustainable Development Goal (SDG) 10, which explicitly calls for reducing inequality within and among countries (UNSDG, 2016). Nigeria, Africa’s most populous country and largest economy, presents a particularly stark example of this challenge. Despite sustained economic growth in the past two decades, poverty and inequality have persisted and, in some regions, deepened (National Bureau of Statistics [NBS], 2020). Regional disparities remain entrenched. Urban–rural divides, uneven infrastructure distribution, and disparities in education and health outcomes have reinforced spatial inequality patterns (Adeniran et al., 2022). Understanding and addressing these geographic dimensions of inequality are critical for inclusive development, conflict prevention, and targeted policymaking in Nigeria.
The analysis of economic inequality has traditionally relied on household surveys, censuses, and administrative data. Surveys such as the Living Standards Measurement Study (LSMS) and national Household Income and Expenditure Surveys (HIES) provide the micro-level data needed to calculate standard inequality indicators—Gini coefficients, Theil indices, or Palma ratios (Deaton, 1997; Jenkins, 2015). These approaches have been fundamental to advancing our understanding of poverty and inequality trends and remain the basis for most official statistics. However, these traditional methods face several well-documented limitations, especially in low- and middle-income contexts. First, household surveys are expensive and logistically complex, which constrains their frequency and spatial coverage. In Nigeria, for example, national surveys are typically conducted every five to ten years, limiting their usefulness for monitoring short-term dynamics. Second, they often suffer from sampling errors, underreporting of incomes or consumption, and inconsistencies between survey and national accounts data (Pinkovskiy and Sala-i-Martin, 2016). Third, their coarse spatial granularity obscures important intra-regional disparities, especially in rural and peri-urban areas (Ebener et al., 2021). These limitations make it difficult to capture the fine-scale geographic distribution of economic inequality, which is essential for targeted local interventions.
To address these gaps, researchers have increasingly turned to Earth Observation (EO) data as an alternative or complementary source of information on human welfare and economic activity. Satellite-derived datasets offer several advantages over conventional approaches: they are globally consistent, spatially continuous, regularly updated, and increasingly accessible at low or no cost (Jean et al., 2016). EO data have been used to proxy various dimensions of human development, including urbanisation, infrastructure access, population distribution, agricultural productivity, and poverty levels at fine spatial scales, even in data-sparse settings (Gibson and Olivia, 2010; Tatem et al., 2013). Among the most widely used EO indicators are nighttime lights (NTL), which capture the intensity of artificial illumination on the Earth’s surface. NTL data from the Defense Meteorological Satellite Program’s Operational Linescan System (DMSP-OLS) and the more recent Visible Infrared Imaging Radiometer Suite Day/Night Band (VIIRS-DNB) have been extensively validated as proxies for economic activity, electricity access, urbanisation, and GDP (Elvidge et al., 2017; Henderson et al., 2012). Their global coverage, temporal consistency, and close correlation with economic output make NTL data a powerful tool for socio-economic analysis, particularly where conventional economic data are scarce or unreliable.
Building on this potential, a growing body of research has sought to use NTL and other EO-derived metrics to estimate wealth and inequality across space. Several studies have demonstrated strong correlations between NTL intensity and subnational income distribution, suggesting that spatial patterns of inequality can be inferred from the uneven distribution of light emissions (Pinkovskiy and Sala-i-Martin, 2016; Shi et al., 2014). Recent work has gone further to combine satellite data, machine learning, and survey data to map poverty and wealth indices at high spatial resolution in low-income countries (Ebener et al., 2021; Jean et al., 2016). Such approaches have proven particularly valuable in contexts where ground data are sparse or outdated, allowing for more frequent and spatially disaggregated monitoring of socio-economic conditions. In Africa, EO-based methods have been applied to estimate subnational GDP, urban–rural income gaps, and electrification patterns (Min et al., 2013; Weidmann and Schutte, 2017). Yet despite Nigeria’s significance, few studies have applied these methods to systematically map economic inequality within the country, especially at the lowest administrative levels such as Local Government Areas (LGAs). These LGAs are the third tier of government and are equivalent to counties in most developed nations. Existing studies have generally focused on national or state-level aggregates, overlooking the fine-scale heterogeneity of inequality that is critical for local policy interventions. Moreover, most prior work has emphasised the relationship between NTL and average wealth or GDP levels, rather than explicitly estimating economic inequality distributions within subnational units.
These gaps highlight the need for new approaches to assess economic inequality at high spatial resolution in Nigeria. Mapping inequality at the lowest administrative units can provide critical insights into localised pockets of deprivation that are masked in coarser analyses. Such spatially detailed information can support more targeted allocation of resources, inform local development planning, and enhance the monitoring of progress toward SDG 10 at subnational levels. This study seeks to address the central research question: How can night-time light (NTL) data be leveraged to accurately map and analyse the spatial distribution of economic inequality in Nigeria at the lowest administrative unit level? Through the investigation of the extent to which NTL-derived metrics can serve as reliable proxies for economic activity and disparities, the study aims to develop a geospatial framework that uses satellite-derived nighttime light data to map economic inequality across Nigeria’s lowest administrative units. By combining EO data with spatial statistical analysis, it offers fine-grained and consistent estimates of inequality, addressing critical data gaps. This approach provides a novel and comprehensive view of economic disparities in Nigeria and demonstrates the potential of EO data to support evidence-based and equitable development policies in data-scarce settings.
Study area and data
Study area
This study examines economic disparity measures across Nigeria's local government areas (Figure 1). Nigeria comprises 36 states divided into six geographical regions comprising 774 local government areas (LGAs). The country is situated in West Africa, with borders extending between latitudes of 4° and 14°N and longitudes of 2° and 15°E, spanning 4047 km (2515 miles). It shares frontiers with Benin (773 km or 480 miles), Niger (1497 km or 930 miles), Chad (87 km or 54 miles), and Cameroon (1690 km or 1050 miles), including the separatist Ambazonia. Odezi et al. (2023) argue that Nigeria exhibits substantial differences, and despite being Africa's largest economy, Nigeria recorded the highest inequality rate among 152 countries in 2017, as indicated by the Oxfam Inequality Index.
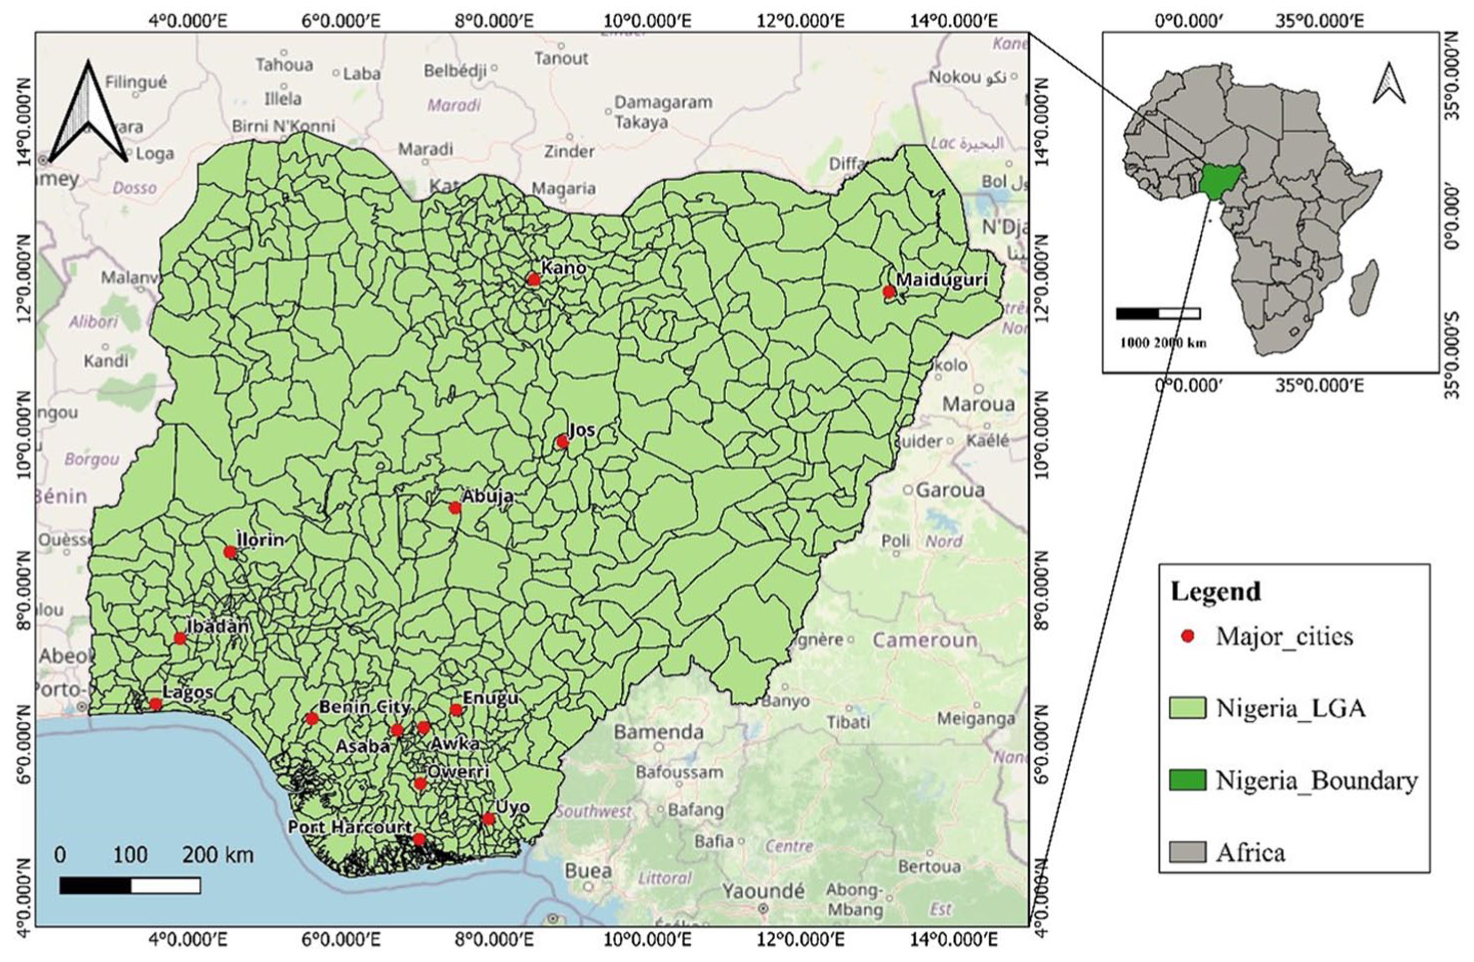
Study area map.
Nighttime light data
The SNPP-VIIRS nighttime light data were used as the primary source. The Visible Infrared Imaging Radiometer Suite (VIIRS) of the Suomi National Polar-orbiting Partnership features a Day-Night Band (DNB) sensor that provides global daily measurements of nocturnal visible and near-infrared (NIR) light, making it suitable for Earth system science and applications (Román et al., 2018). With global spatial coverage, the SNPP VIIRS has a spatial resolution of 15 arcseconds and daily temporal resolution.
Additional datasets
The supporting data used include the boundary data of all local government areas in Nigeria and the Global Human Settlement Layer (GHSL) - Global population surfaces dataset, which is a raster dataset that illustrates the spatial distribution of the residential population, expressed as the absolute number of persons in each cell. It has a spatial resolution of 100 m and comprises residential population estimates from 1975 to 2020 in 5-year intervals and predictions for 2025 and 2030 generated from the Gridded Population of the World v4.11 (Schiavina et al., 2023).
Methodology
This study employed a programmatic approach to computing satellite-based estimates of local economic inequality using the Generalised Estimating Equations (GEE) and Python programming languages. It validated these estimates against those obtained from extensive survey data covering large areas. The research methodology was based on previous research by Weidmann and Schutte (2017), who examined nocturnal light emissions as a metric for economic development at high resolution. Their study found that more highly lit places were also economically more viable. However, because the variance in illumination is heavily influenced by settlement patterns, densely inhabited areas generate more light at night. Using a population raster, Weidmann and Theunissen (2021) corrected for the effect of population on night-light illumination.
Data acquisition and processing
Data acquisition was performed on the GEE Cloud platform via a code editor using the JavaScript programming language. Within the cloud platform, data were filtered based on geometry to cover the study area. Zonal statistics were performed for each LGA using previously defined reducers for spatial and temporal statistics. VIIRS NTL and population data were acquired on the same scale and integrated to ensure coherence between the datasets. The output data, a combination of all datasets, were saved and loaded as a CSV file into the Jupyter Lab interactive platform.
Data analysis
The dataset was meticulously arranged to ensure readiness for analysis. The per capita emission values of evening lights at the local government area (LGA) level were calculated by dividing the nighttime lights (NTL) emissions by the population residing in the LGA. This enabled the calculation of the inequality estimates for each Local Government Area in Nigeria. Given a set of longitude and latitude coordinates, all cells within a specific LGA were retrieved, and an inequality index, the Gini coefficient, was calculated for each cell. The Gini coefficient, a widely recognised and used measure of economic inequality, was computed based on per capita NTL emissions. Following the findings of Weidmann and Schutte (2017), the log transformation of nighttime light values was performed before the computation of economic inequality estimations. The extended formula (Eqn. 1) for the Gini coefficient is used in this study. Given that n represents individuals and xi represents everyone's wealth or income, the Gini coefficient G can be calculated as follows:
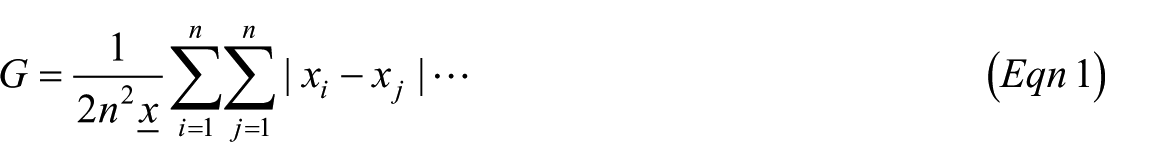
Where:
Gini coefficient
The Gini coefficient is a widely used statistical measure for assessing inequality within a distribution, particularly income or wealth. The local inequality values based on the Gini coefficient may have any value between 0 and 1 (or 0% to 100%). A coefficient of zero (0) suggests perfect equality, indicating that income or wealth is distributed uniformly across all individuals within the population, while a coefficient of one (1) represents perfect inequality, where a single individual holds the entirety of income or wealth while others receive none. This unidimensional measure, though simple, effectively summarises the dispersion of income within a population and is used globally as a benchmark for economic inequality (Deaton, 2013; Sen, 1997).
Results
Nighttime light variations on map
Figure 2 shows the spatial variation in mean nighttime light intensities across all local government areas in Nigeria for the months of January and December 2023. In both months, the spatial distribution of NTL intensities is relatively consistent, with major urban and commercial centers like Lagos in the southwest, Port Harcourt in the southern region, and Abuja and Kano in the northern region exhibiting the highest levels of illumination. The contrast between Nigeria’s southern and northern regions is clear. While the southern zones show significant lighting indicative of higher levels of development, electrification, and economic concentration, much of the northern region remains poorly illuminated.
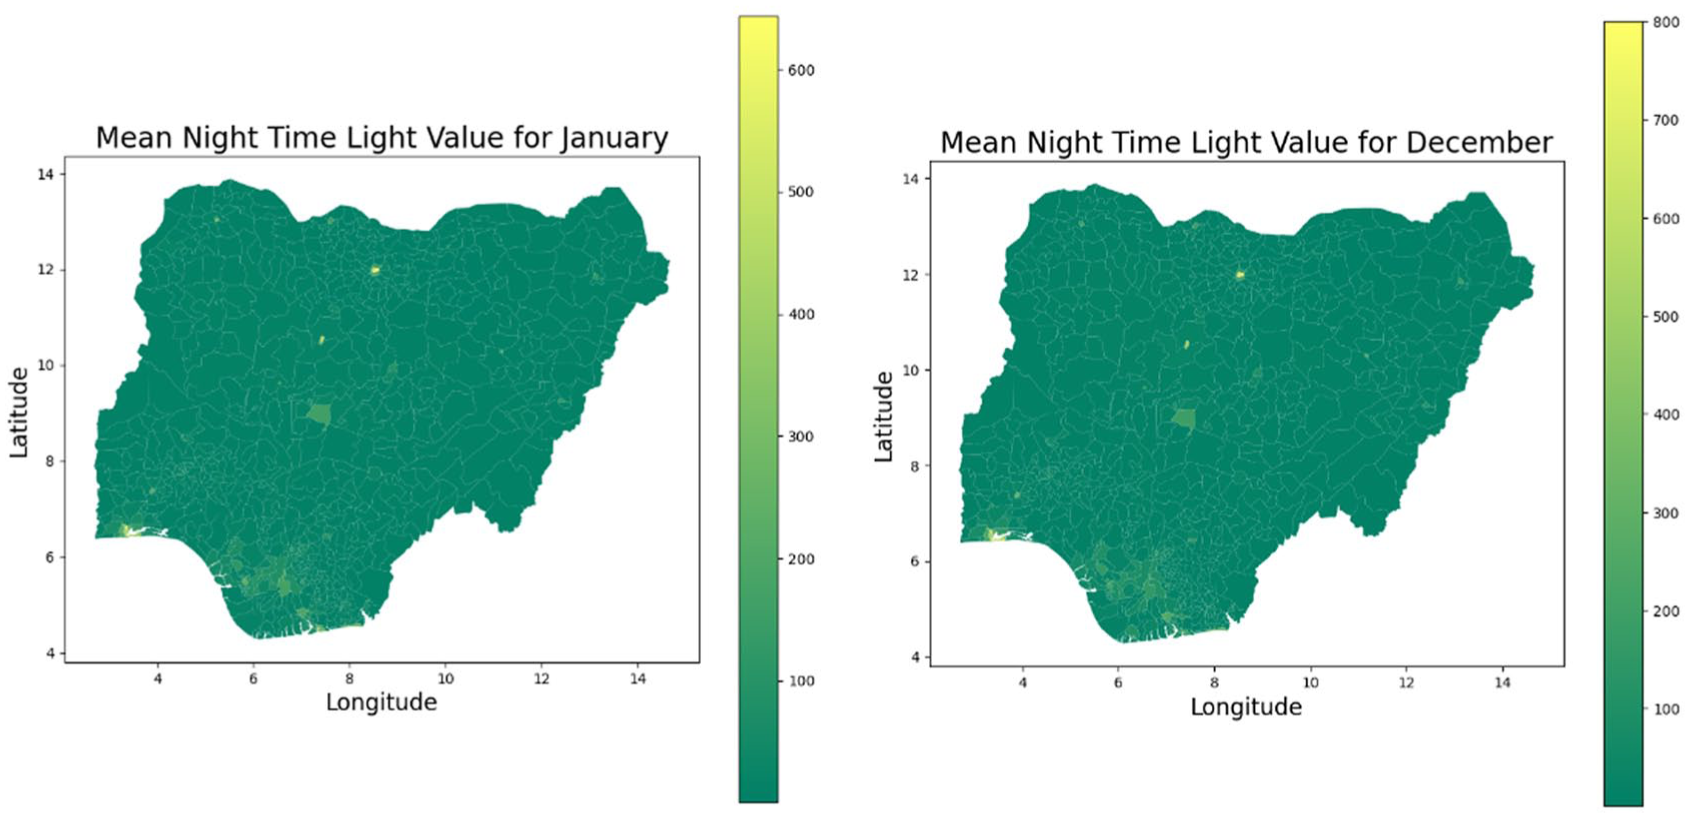
Nighttime light emissions in raster format for all LGAs in Nigeria.
Preliminary estimates of local inequality values (Gini) from Nighttime light data
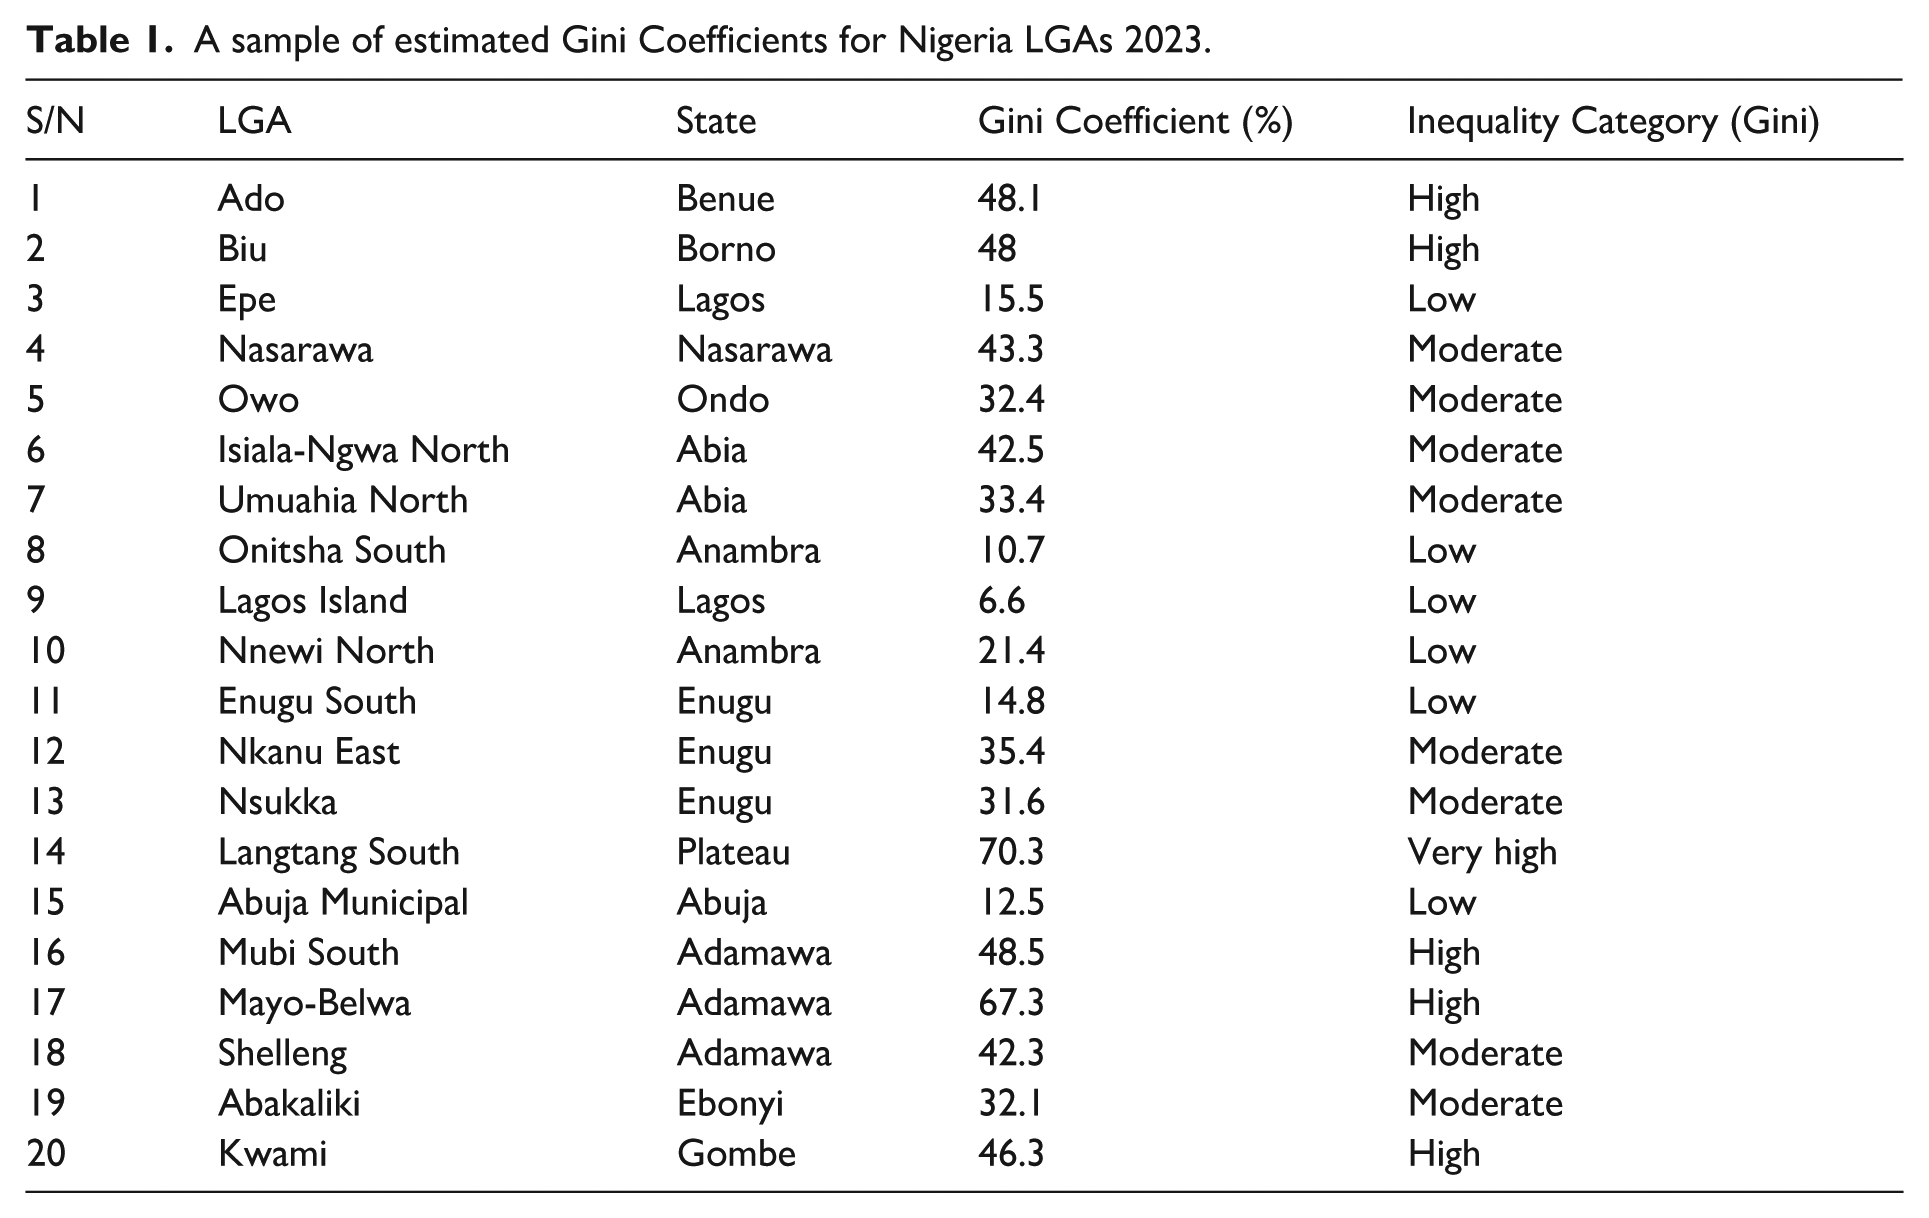
Table 1 presents a sample of estimated Gini coefficient values for selected Local Government Areas (LGAs) in Nigeria for the year 2023. This micro-level disaggregation enables a finer-grained understanding of inequality dynamics across Nigeria’s 774 LGAs. In alignment with the World Bank (2022) classification, values from 0%–30% are categorised as low inequality, 30.1%–45% as moderate inequality, 45.1%–60% as high inequality, and values from 60.1% above as very high inequality. As shown in Figure 3, the distribution of Gini values exhibits a pattern that approximates a normal distribution, centered around a mean of 33.56 with a standard deviation of 15.85.
A sample of estimated Gini Coefficients for Nigeria LGAs 2023.
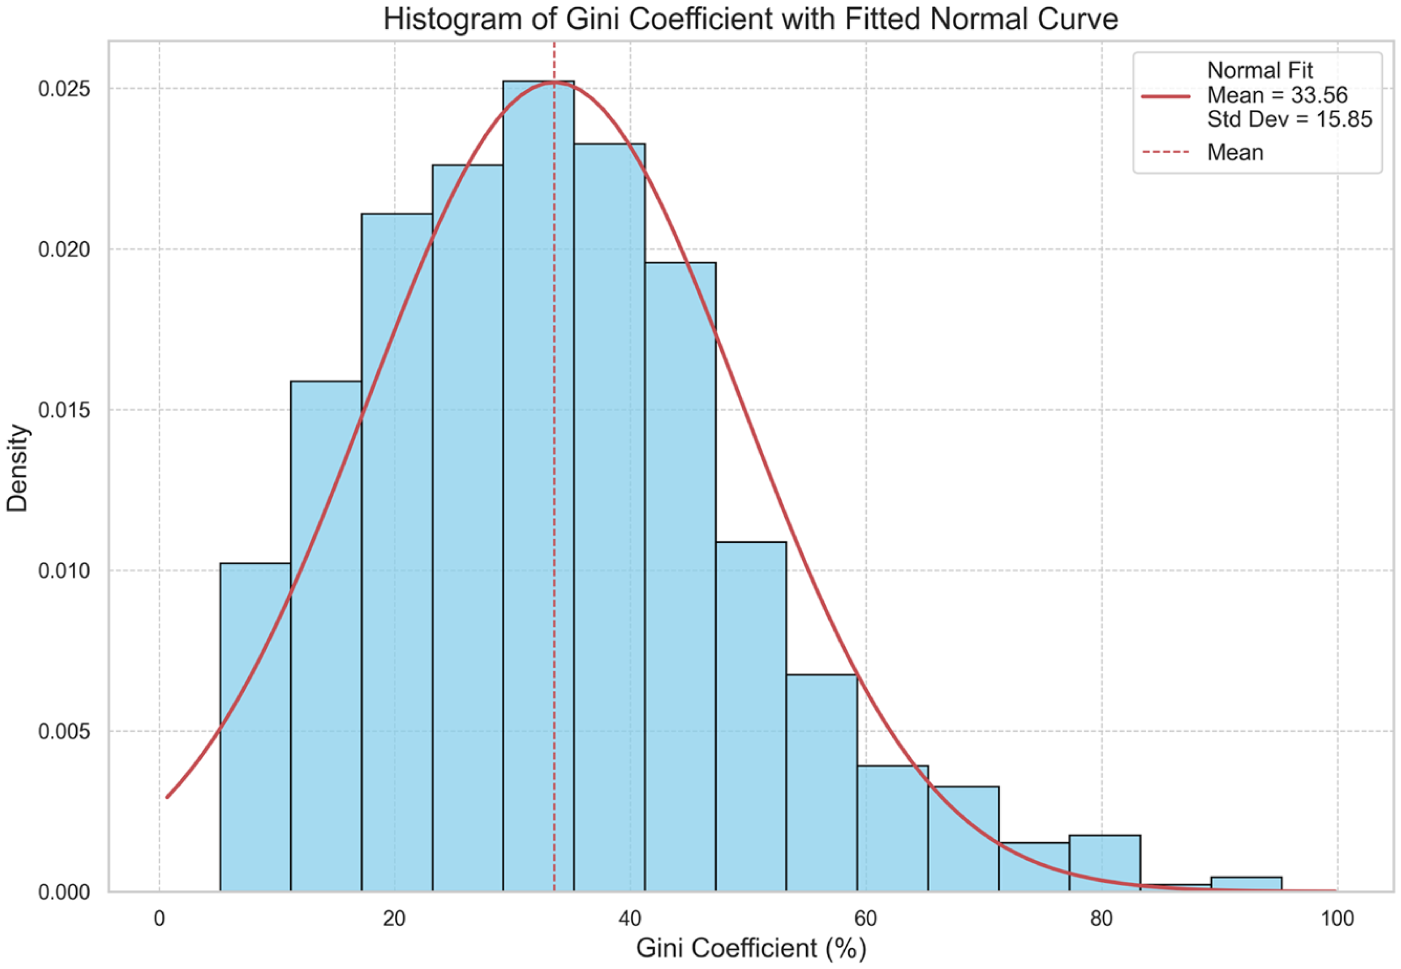
Histogram of Gini coefficients with fitted Normal Curve.
Classification of local inequality values (Gini)
Figure 4 (left panel) illustrates the classification of inequality values for all Local Government Areas (LGAs) in Nigeria based on the Gini index for 2023. The classification reveals that approximately 43.5% of LGAs exhibit low levels of income inequality, 35.7% demonstrate moderate inequality, 14.0% fall within the high inequality category, and 6.9% display very high inequality. Figure 4 (right panel) provides a detailed classification of income inequality across Nigeria’s Local Government Areas (LGAs) using the Gini index for the year 2023. The analysis reveals that more than 320 LGAs are classified within the low inequality category, while approximately 270 LGAs fall into the moderate inequality category. At the national level, Nigeria is positioned within the moderate Gini category, reflecting a mid-range level of income disparity when considered as a single economic unit.
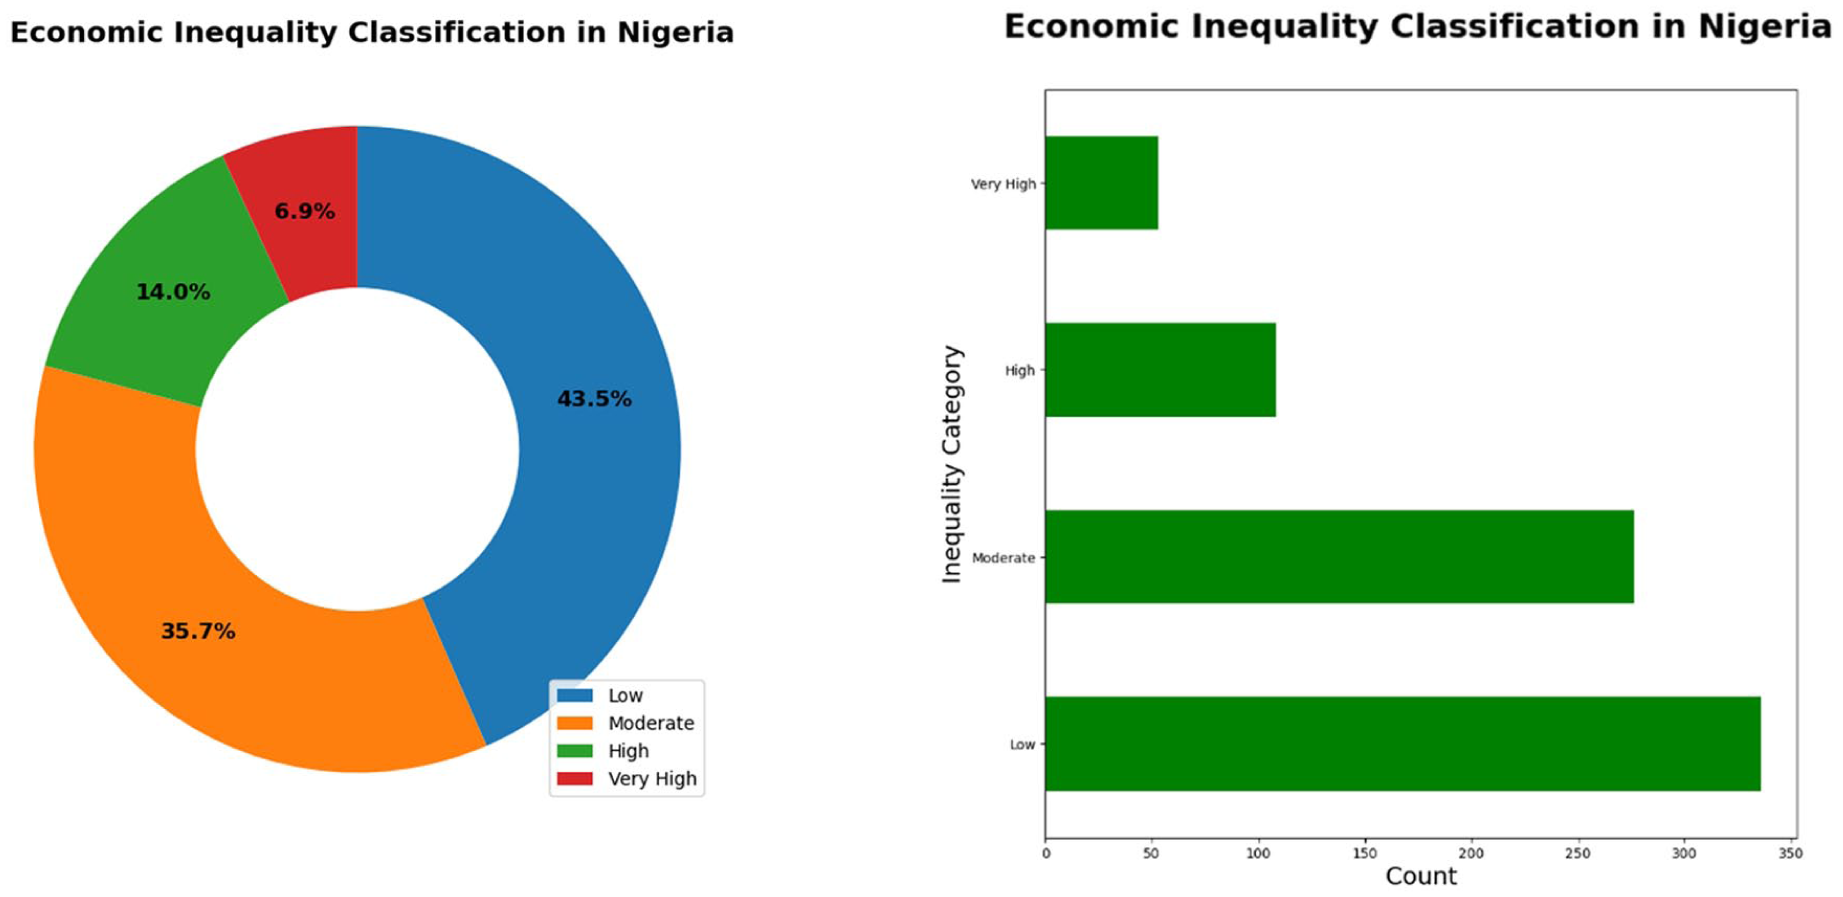
Classification of Economic Inequality in Nigeria for 2023.
Nigeria's local economic inequality maps
Figure 5 reveals a distinct regional pattern in the distribution of inequality. Southern Nigeria, encompassing the South-West, South-East, and South-South zones, is predominantly characterised by low to moderate Gini values, indicating relatively equitable income distribution in these regions.
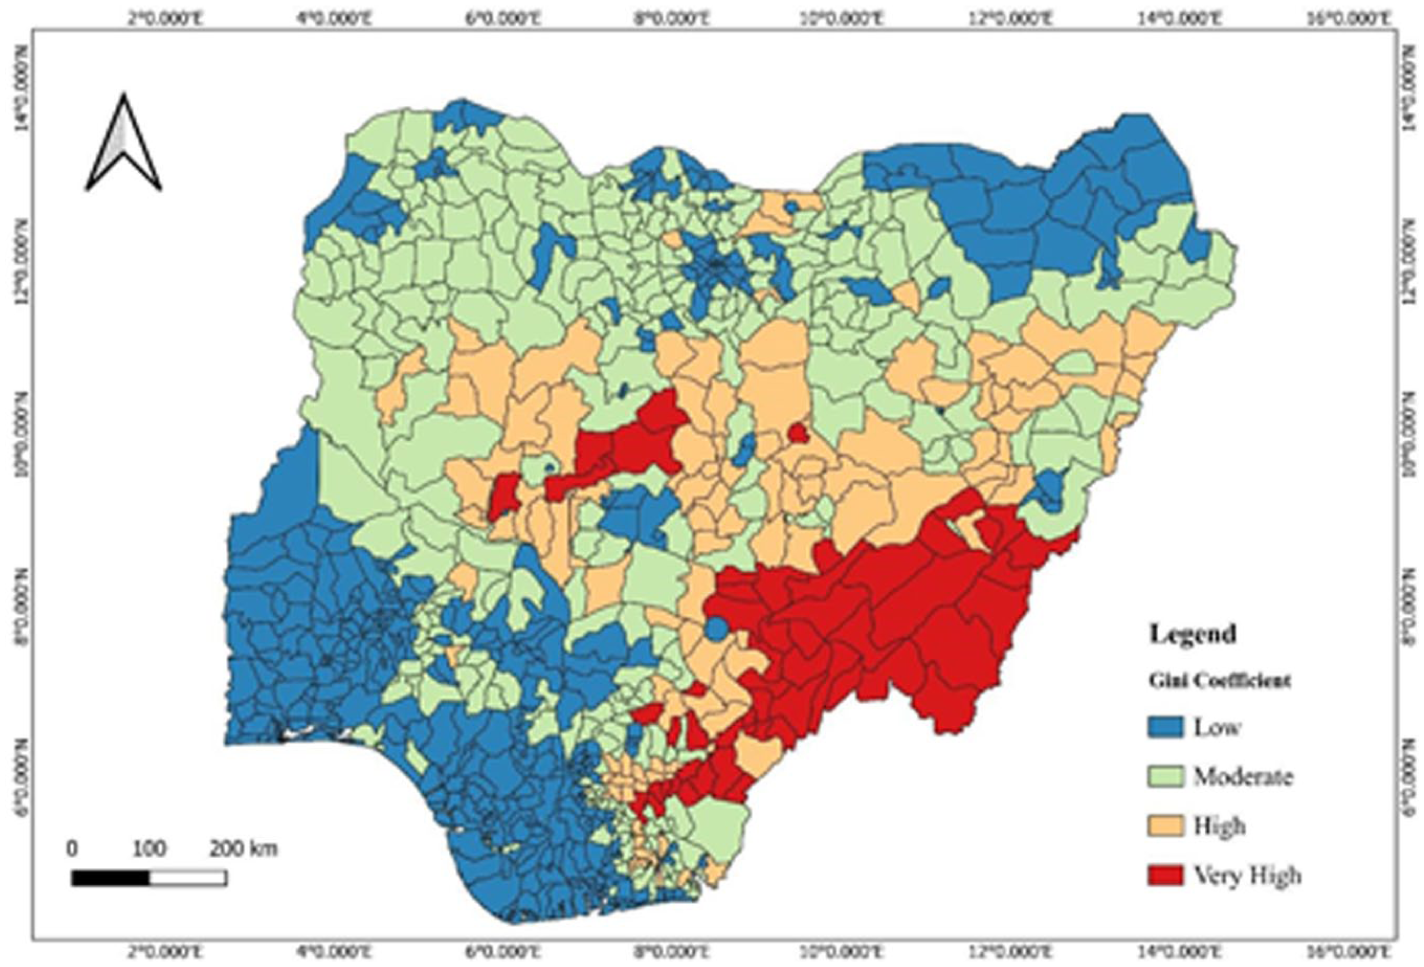
Economic inequality (Gini) map of Nigeria LGAs for 2023.
Figure 6 presents a spatial representation of income and wealth levels across Nigeria’s Local Government Areas (LGAs). The map reveals a pronounced south-north divide in income and wealth distribution. The southern regions of Nigeria comprising the South-East, South-West, and South-South zones are predominantly characterised by high to very high income and wealth levels.
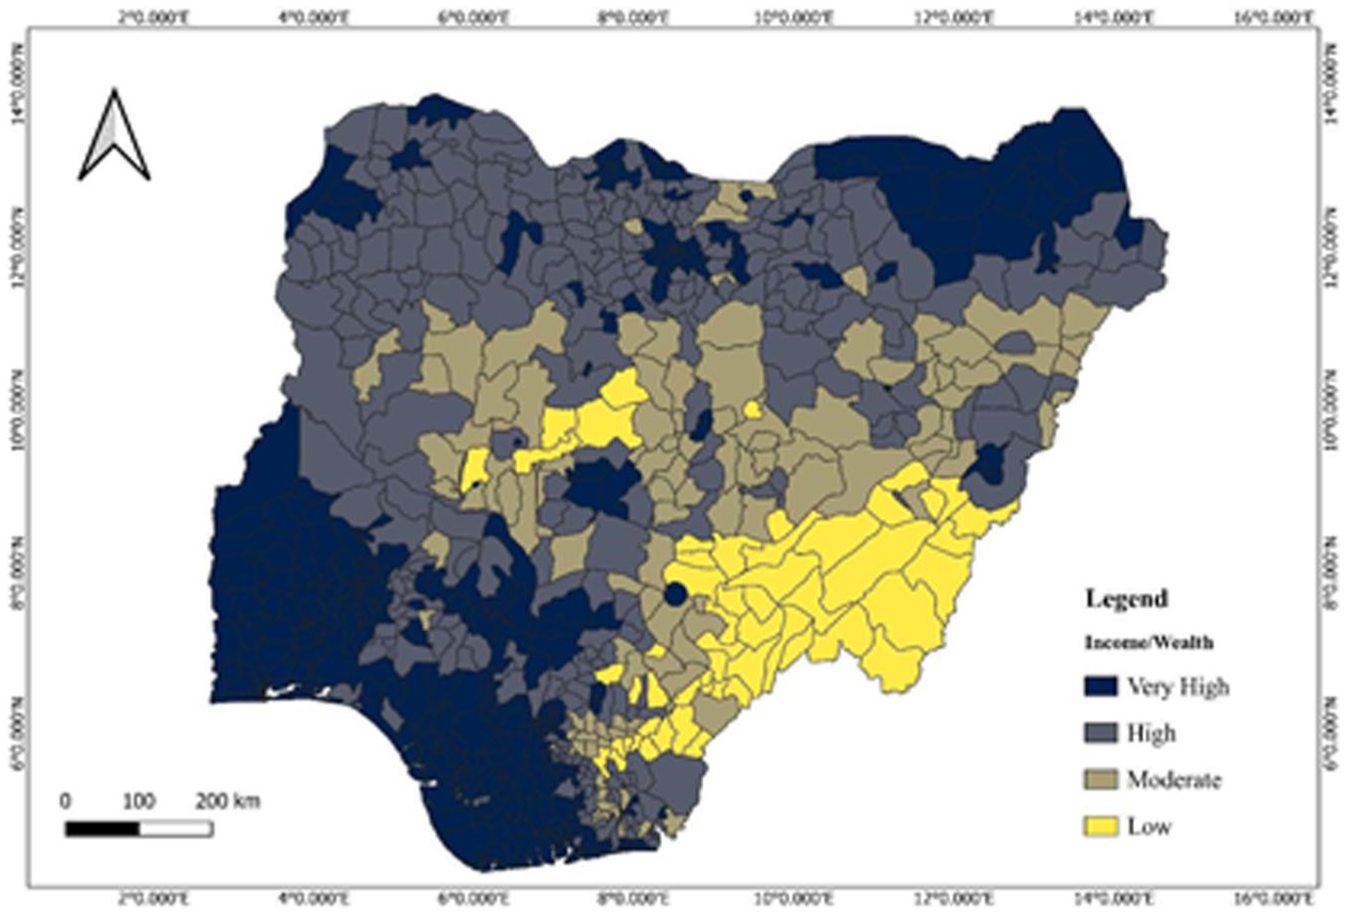
Economic inequality (income /wealth) map of Nigeria LGAs for 2023.
Discussion
The comparison between the two monthly nighttime variations in Figure 2 reveals a subtle but discernible increase in overall light intensity from January to December. In January, the highest NTL values are slightly above 600 digital number (DN) units, whereas in December, peak values exceed 750 DN units. This pattern suggests a seasonal dynamic, most likely linked to holiday-related activities in December. The festive season typically sees a surge in economic, social, and residential energy use, especially in urban centers. Additionally, environmental factors such as atmospheric dust (Harmattan) in January could marginally affect the satellite sensor’s ability to detect light. The near-normal distribution (Figure 3) also indicates heterogeneity in inequality levels, possibly driven by varying regional economic structures, urbanisation rates, social services access, and labour market conditions (Aigbokhan, 2000; Oyekale, 2018).
The distribution patterns in Figure 4 suggest a predominantly equitable income distribution across a significant portion of the country's sub-national units. However, the presence of LGAs with high and very high Gini indices is indicative of pronounced socio-economic disparities within specific regions. High Gini values are characteristically associated with economic environments where a disproportionate share of resources is concentrated in the hands of a minority, reflecting limited income redistribution mechanisms and heightened wealth stratification (Atkinson and Bourguignon, 2015; World Bank, 2022b). Such conditions often correlate with poor socio-economic outcomes, including restricted access to education, healthcare, and employment opportunities (Deininger and Squire, 1996; Milanovic, 2016). Conversely, LGAs with low Gini indices can be interpreted as zones of relatively equitable wealth distribution, often considered socio-economically stable and more inclusive. These areas may benefit from stronger institutional frameworks, more balanced economic participation, and improved service delivery systems, thereby enhancing developmental performance (United Nations Development Programme [UNDP], 2022). The observed disparities underscore the importance of targeted policy interventions aimed at mitigating regional inequality and promoting inclusive growth. The distribution also raises important questions regarding the underlying drivers of inequality across different LGAs. Investigating these dynamics can provide valuable insights for formulating context-specific policies that address inequality not only at the national or state level but also within localised settings. This is critical for achieving sustainable economic development and social cohesion at the sub-national level.
Figure 5 reveals the spatial distribution of economic inequality across the LGAs in Nigeria. Areas with low economic inequality, especially the South-Western states of Lagos, Ogun, and Oyo are known for higher levels of economic development, diversified economic activities, and better access to infrastructure and social services, which are likely to contribute to their more balanced income distribution (Ajakaiye and Fakiyesi, 2009; UNDP, 2022). Conversely, the northern and central parts of Nigeria, including significant portions of the North-East and North-Central zones, exhibit moderate to high levels of inequality, with clusters of very high Gini values notably concentrated in Taraba State and its neighbouring areas. This concentration of inequality in the central-eastern corridor highlights systemic socio-economic challenges, such as limited access to education and healthcare, underdeveloped infrastructure, and lower levels of economic diversification (Kanbur and Venables, 2005; NBS, 2020). In these areas, a relatively small segment of the population appears to control a disproportionately large share of available resources, resulting in substantial income disparities and associated developmental constraints. The observed spatial inequality underscores the urgency for region-specific policy responses. Taraba State, which shows several LGAs with very high Gini values, demands targeted socio-economic interventions to address the structural roots of inequality. Such measures could include investment in rural infrastructure, education, healthcare access, social protection programs, and economic empowerment schemes tailored to local contexts.
The spatial distribution of inequality based on income as shown in Figure 6 reveals some top performing regions. These regions are home to Nigeria’s major commercial hubs (e.g., Lagos, Port Harcourt, and Onitsha) and benefit from more robust infrastructure, industrial diversification, and foreign and domestic investment (Ajakaiye and Fakiyesi, 2009; World Bank, 2022b). The economic performance of these southern LGAs is also linked to higher educational attainment, urbanisation rates, and access to services, all of which support improved household incomes and asset accumulation (UNDP, 2022). In contrast, the northern regions, particularly across the North-East and North-West zones, are mostly classified within the moderate to low income and wealth categories. This spatial pattern reflects persistent underdevelopment and structural economic challenges in the northern states, including lower human capital indices, limited industrial activity, and weaker access to financial and health services (National Bureau of Statistics, 2020). Notably, several LGAs within Taraba, Plateau, Niger, and their adjacent areas fall within the lowest income and wealth brackets. This clustering of economic deprivation highlights the urgency of targeted development interventions in these regions.
To validate the analysis, due to the unavailability of consistent inequality data for Nigeria and the lack of inequality data for Nigerian Local Government Areas (LGAs), alternative estimates of aggregated economic inequality values for Nigeria were used. Regression analysis was performed on past inequality data (Gini) for Nigeria obtained from the National Bureau of Statistics (NBS) and the World Bank database for 2010, 2012, 2013, 2015, 2016, and 2018. Notably, Nigeria's Gini value is reported to be relatively constant from 2019 to 2022, although this is not supported by proper measurement. The calculated 2023 Gini coefficient for Nigeria using the regression model was compared with the mean of the estimated 2023 NTL Gini coefficients for all LGAs in Nigeria. The value obtained from the regression model was 34.8%, closely related to the NTL-estimated Gini value of 34.3%.
Conclusion
This study provides a spatially detailed assessment of economic inequality across Nigeria’s Local Government Areas (LGAs) by leveraging nighttime light (NTL) data as a proxy for local economic activity. The analysis revealed pronounced spatial heterogeneity in NTL intensity, which translated into preliminary LGA-level Gini estimates. Classification of these values highlighted clear clusters of high and low inequality, exposing marked regional disparities particularly between the more urbanised, illuminated southern LGAs and the less lit, rural northern regions. The resulting local economic inequality maps present the first nationwide, fine-scale depiction of subnational inequality, offering critical insights often masked in national statistics.
These findings underscore the potential of NTL-based approaches for monitoring spatial inequality where conventional socio-economic data is scarce. Such spatially explicit metrics can support targeted policy interventions, equitable resource allocation, and progress tracking toward the Sustainable Development Goals. However, limitations exist: NTL primarily captures formal and electrified economic activities, possibly underrepresenting informal and low-light rural economies, and the lack of ground-truth economic data constrains validation. Future work should integrate NTL with complementary datasets such as household surveys or mobile phone records to improve accuracy and conduct longitudinal analyses to track inequality dynamics over time. For example, Chi et al. (2021) provided estimates of micro-level wealth derived from various input data sources, including Facebook networking data and maps of telecommunication coverage. This resulted in more accurate wealth estimates that could be applied to the computation of local inequality. By revealing where inequalities are most acute, this work provides a foundation for more targeted and evidence-based development policies, while also opening new avenues for integrating remote sensing with socio-economic data to better monitor and address spatial inequality.
Footnotes
Acknowledgements
The authors acknowledge everyone whose earlier research contributed to completing this study. They also thank the peer reviewers of this manuscript, as well as the handling editor
Author Contributions
All authors listed on the submission made significant contributions to the study. Ikechukwu N. Maduakor, Christian C. Oluoma and Williams C. Nwachukwu designed the study and drafted the introduction of the manuscript. Victor O. Oha and Osita O. Stephen were responsible for data collection and analysis. Ugonna C. Nkwunonwo and Elochukwu C. Moka interpreted the data, conducted further analysis, and wrote the methodology and discussion sections of the draft manuscript. All authors contributed to the final version and approved it for publication. All authors agree to be accountable for all aspects of the work, ensuring that any questions regarding the accuracy or integrity of any part are appropriately investigated and resolved.
Funding
The authors received no financial support for the research, authorship, and/or publication of this article.
Declaration of conflicting interests
The authors declared no potential conflicts of interest with respect to the research, authorship, and/or publication of this article.