
Abstract
In the context of global warming, construction land expansion and large-scale population agglomeration have significantly increased regional extreme heat risk, which seriously threatens human health. Scientifically assessing extreme heat risk is the basis for developing regional heat adaptation and mitigation strategies. The current extreme heat risk assessment mainly includes two approaches: indicators-integrating assessment and exposure-response assessment. The former emphasizes comprehensively assessing multiple factors (e.g., heat stress, social sensitivity, and adaptability), while the latter establishes the direct correlation between climatic variables and health outcomes. In this review, we firstly summarized the measurement indicators as well as statistical periods and identified thresholds which were used to define extreme heat events in previous studies. Then, indicators-integrating and exposure-response approaches were reviewed and compared based on the theories and case studies of extreme heat risk assessment. According to the advantages and disadvantages of two approaches, we further proposed the prospects of regional extreme heat risk assessment, i.e. from individual factors to coupling paths, from excess risk to effectiveness of heat adaptation, and building an exposure-driver-response cascade framework.
Keywords
Introduction
Between 2003 and 2012 the average global temperature has increased by 0.78°C compared to that during 1850-1900 (IPCC, 2013). Since the middle of the last century, the frequency of heatwaves and intensity of urban heat island effect in the warm season have increased significantly (Kornhuber et al., 2024; Thompson et al., 2023). The number of heatwave days and the accumulated heat in some regions have increased to 5.98 days and 5.50 °C per decade, respectively, with increasing extreme heat stress (Perkins-Kirkpatrick and Lewis, 2020). Accompanied by changes in humidity and wind speed, the increase in air temperature or land surface temperature could seriously threaten human health (Raymond et al., 2020; Wang et al., 2024).
Multiple extreme heat disasters that pose a key threat to socio-economic development and human health have occurred in different countries and regions in the past two decades (Xi et al., 2024). In August 2003, heatwaves broke out in Western European countries, and the average temperature was about 3 °C higher than during 1961-1990 (Stott et al., 2004). In the summer of 2013, a large-extent extreme heat stress hit Eastern China, and the similarly hot summers were projected to be more frequent in the future (Sun et al., 2014). In June 2019, an extreme heat event broke out in France with a local maximum temperature of 45.9 °C, when the record high was breached (Schiermeier, 2019). Moreover, the urban heat island effect has gradually evolved and intensified in more and more regions, remarkably increasing the extreme heat risk (Wouters et al., 2017; Zhang et al., 2023). Especially in urban areas with high building proportion and population density, natural environment and socio-economic activities are closely related, and scientific assessment of extreme heat risk could help to develop effective adaptation and mitigation strategies.
Numerous approaches to quantifying extreme heat risk can be categorized into two main categories: integrating multi-indicators and quantifying exposure-response relationships. As a typical disaster, the risk elements of extreme heat events include anomalies of climate systems, exposures of social systems, coupling with ecosystems, etc. The indicators-integrating approach aimed to comprehensively assess potential factors (e.g., heat stress, social sensitivity, and adaptability) of the above-mentioned processes, while the exposure-response approach established the direct correlation between climatic variables and health outcomes (e.g., mortality and morbidity). Evidently, an indicators-integrating assessment approach might be easy to perform in more case studies, while the exposure-response approach demonstrated more realistic nonlinear relationships.
However, it has been found that some indicators, when integrated into various frameworks, might no longer be applicable in different regions. Furthermore, in the context that the spatiotemporal evolution and effectiveness of the adaptation to extreme heat are not clear, the exposure-response relationship cannot directly help to develop effective strategies for mitigating risk. Therefore, we aimed to summarize the current theories, methods, and case studies related to regional extreme heat risk assessment in this study and proposed research prospects for two approaches, i.e. the indicator-integrating assessment and the exposure-response assessment.
Definition of extreme heat
As a typical extreme event, a unified definition of extreme heat (event) is still lacking. However, it is mainly manifested that the temperature exceeds a certain threshold in a statistical sense, and the system is abnormally affected (Smith, 2011). Although different standards for defining extreme heat have been proposed in different countries, extreme heat events could be generally defined as the phenomenon of daily air temperature or land surface temperature exceeding a certain absolute or relative threshold (Ha et al., 2022). Therefore, identifying whether an extreme heat event occurs depends on the statistical indicators of measuring temperature and also on the threshold of temperature.
Three measurement indicators, i.e. daily maximum temperature, minimum temperature, and average temperature, are usually used to identify extreme heat (Dong et al., 2022; Estoque et al., 2020; Gasparrini et al., 2015). The statistical periods are generally summer (from June to August in the northern hemisphere and from December to February in the southern hemisphere) or warm season (May to September in the northern hemisphere and November to March in the southern hemisphere) (Perkins-Kirkpatrick and Lewis, 2020). Some studies have suggested that the daily average temperature is slightly better than the daily maximum or minimum temperature when assessing extreme heat risk. For example, Guo et al. (2011) used the above three measurement indicators to simulate the nonlinear relationship between temperature and mortality. The model based on daily average temperature had a lower Akaike information criterion and a better risk prediction effect. However, the daily maximum temperature and minimum temperature also have their advantages. The daily maximum temperature reflects the extreme thermal environment in which human bodies are exposed (Dong et al., 2024a), while the limit threshold of daily minimum temperature could be regarded as the standard for identifying extreme heat events at night.
The threshold of temperature directly affects the assessed intensity, frequency, duration, and negative effects of extreme heat events. When the threshold is set high, the heat-related risk might be underestimated; otherwise, it would be overestimated. The threshold of temperature for identifying extreme heat can be mainly divided into absolute threshold and relative threshold (Xu et al., 2016). The absolute threshold mainly considers the adaptive ability of human bodies for urban thermal environments. Due to the differences in thermal comfort of humans living in different climatic backgrounds for a long time, the absolute thresholds of different regions and groups are not completely the same (Vecellio et al., 2022). For example, high temperature could be defined as a daily maximum temperature exceeding 35°C in China, and heatwaves are generated if the high temperature lasts for more than three days. However, studies on the relationship between temperature and mortality revealed that the minimum mortality temperature (MMT) of 31 provincial capitals in the Chinese mainland have significant latitude zonality spatially (28.4 35 °C, 26.4 35 °C, 22.4 35 °C, 24.9 35 °C and 20.5 35 °C in Haikou, Chengdu, Wuhan, Beijing, and Harbin, respectively) (Luan et al., 2018).
The relative threshold emphasizes the relative possibility of extreme heat events occurring locally within a certain period and is commonly expressed by the quantile values of temperature series, such as 90%, 95%, 98%, or 99% (Raymond et al., 2020). In addition to directly selecting the summer or warm season during the study period, previous studies also compared the temperature on a calendar day with the quantile of the series in a certain window (e.g., 5 days, 15 days, or 25 days) during the base period. The World Meteorological Organization proposed that the base period was generally 1961-1990 (Zhang et al., 2005). Therefore, it is important to select the measurement indicators, and related threshold of temperature and base period according to the regional climatic backgrounds and human thermal comfort when assessing regional extreme heat risk.
Literature analysis on extreme heat risk assessment
We analyzed the literature published in the Web of Science Core Collection. The first topic was set as “extreme heat risk assessment”, a total of 589 published articles during 2015-2024 were selected (Figure 1). Among all publications on extreme heat risk assessment, about 39.56% of articles were related to indicator or index, and about 49.41% of articles dealt with the topic of health or death. Summarizing the expanded keywords performed by Bibliometric (https://bibliometric.com/), “mortality”, “health”, “vulnerability”, “exposure” and “adaptation” were frequently discussed or quantified in the assessment of extreme heat risk. In the following sections, we categorized the current research on extreme heat risk assessment into two approaches: the indicators-integrating approach and the exposure-response approach. Indicators-integrating assessments focus on multiple potential indices (e.g., vulnerability and adaptation), while exposure-response assessment establishes the direct relationships between temperature and health outcomes (e.g., mortality).
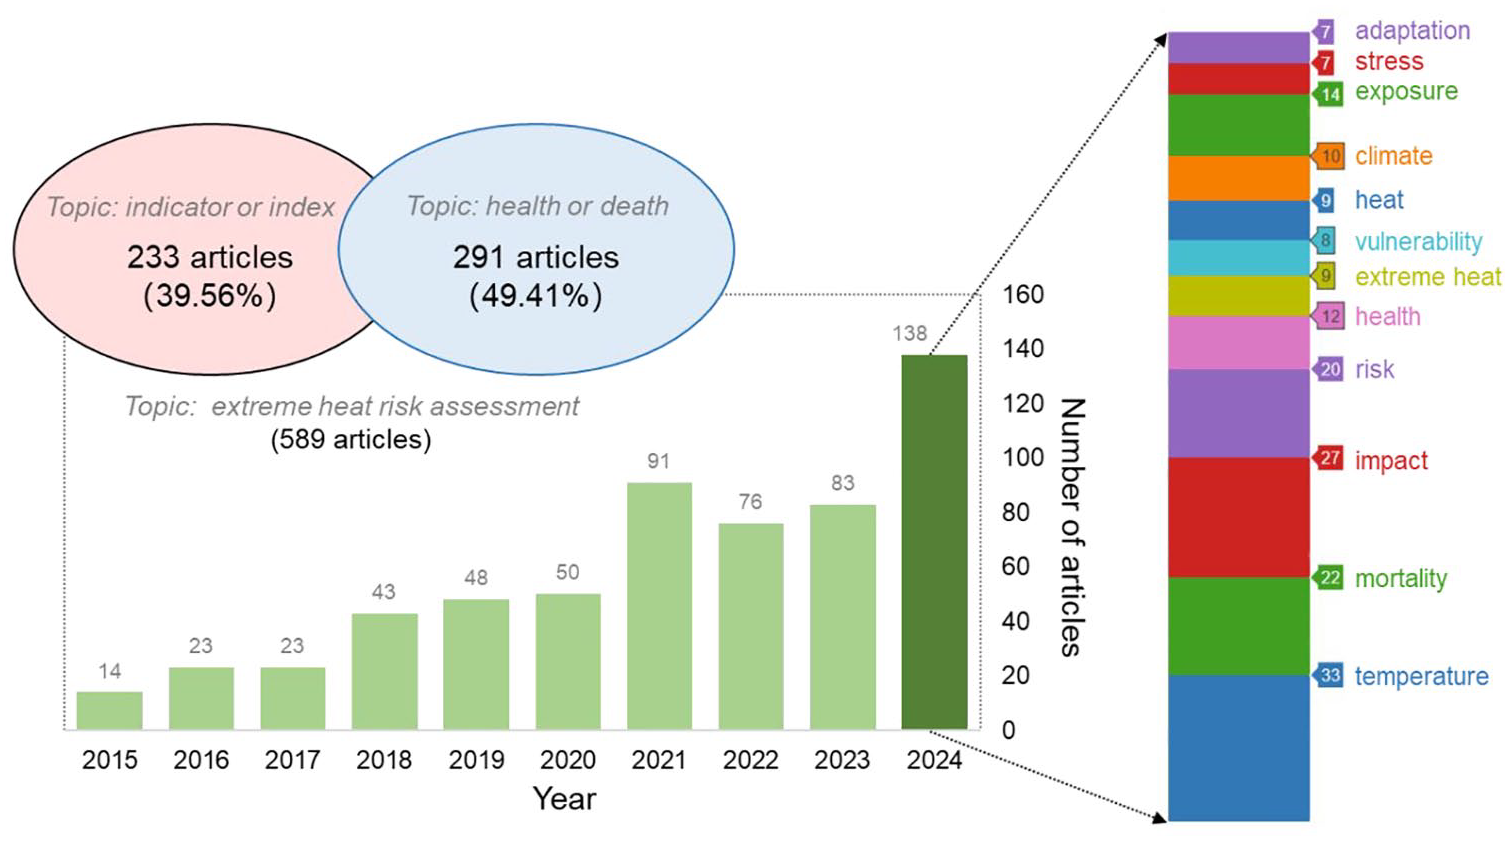
Number of articles on extreme heat risk assessment published in the Web of Science Core Collection.
Indicators-integrating approach
With the frequent occurrence of extreme heat events, the quantitative assessments on temperature anomalies and the potential damages to socio-economic systems have gradually attracted attention, especially after the severe heatwaves in Chicago in 1995 and the large-scale heatwaves in Europe in 2003. Based on the vital elements and processes related to extreme heat events, individual indicators from multiple dimensions for assessing regional extreme heat risk were proposed in previous studies (Dong et al., 2024b). Heat risk patterns based on heat stress, vulnerable groups, and economic factors, were widely mapped (Aubrecht and Özceylan, 2013). For example, Jones et al. (2015) defined the number of person-days above 35 °C (average number of days with extreme heat multiplied by the number of exposed people) as the population exposure to extreme heat at the grid scale. Due to the heterogeneity of social-ecological elements and processes in different regions, the cognitions of the evolution of extreme heat risk are quite different in various studies.
The indicators-integrating approach is generally proceeded by a systematic framework or data synthesis algorithms to integrate the spatial-temporal variables. The essence of this approach is assessing key factors in the prevention, occurrence and mitigation of extreme heat risk, aiming to determine which indicators dominate the extreme heat risk and where the high-risk areas are located. The Fifth Assessment Report of The Intergovernmental Panel on Climate Change proposed that climate-related risks were driven by the climate system and socio-economic processes. Risk assessment could consider three core parts (i.e., hazard, vulnerability and exposure). In detail, “Hazard” emphasizes climate-related natural events and their trends or impacts. “Exposure” refers to the presence of people, resources and ecosystems that are negatively affected by hazards, while “vulnerability” focuses on the sensitivity and adaptivity of the above-mentioned affected elements (Oppenheimer et al., 2014). Following the framework of hazard, vulnerability and exposure, previous studies have not only analyzed the characteristics and influencing factors of a single dimension (Yang et al., 2019), but also applied or expanded a comprehensive framework to analyze extreme heat risk (Dong et al., 2020).
Assessing heat hazard, also called heat stress when considering social response, aims to reveal the inherent characteristics of the regional thermal environment. The near-surface air temperature observed by meteorological stations and the land surface temperature with high spatial resolution are the most commonly used as the characteristic indicators. Furthermore, meteorological variables such as humidity, wind speed, and average radiant temperature could also work together with air temperature to reduce or increase the heat stress on human bodies (Vanos et al., 2023). Global research revealed that when the temperature was lower than the optimal human body temperature of 37 °C, increasing the relative humidity could also raise the likelihood of exceeding the deadly threshold (Mora et al. 2017). The increase in deadly heat risk dominated by changes in humidity is particularly significant in the equatorial region. Therefore, comprehensive indicators or thermodynamic variables that could effectively integrate different environmental factors and represent human thermal comfort have been proposed, such as the wet-bulb temperature reflecting the hot and humid conditions (Im et al., 2017; Speizer et al., 2022), the universal thermal climate index combining the multi-node physiological model and temperature-adaptive clothing insulation model (Di Napoli et al., 2018), and the humidity index measuring apparent temperature (Ho et al., 2017). In addition to directly using the actual values of such factors to characterize the heterogeneity, the frequency, intensity, and cumulative heat were often calculated to assess the long-term effects of extreme heat events. Perkins-Kirkpatrick and Lewis (2020) revealed that the trend of global average heatwave intensity from 1950 to 2000 did not change significantly, while the cumulative heat showed a distinct upward trend.
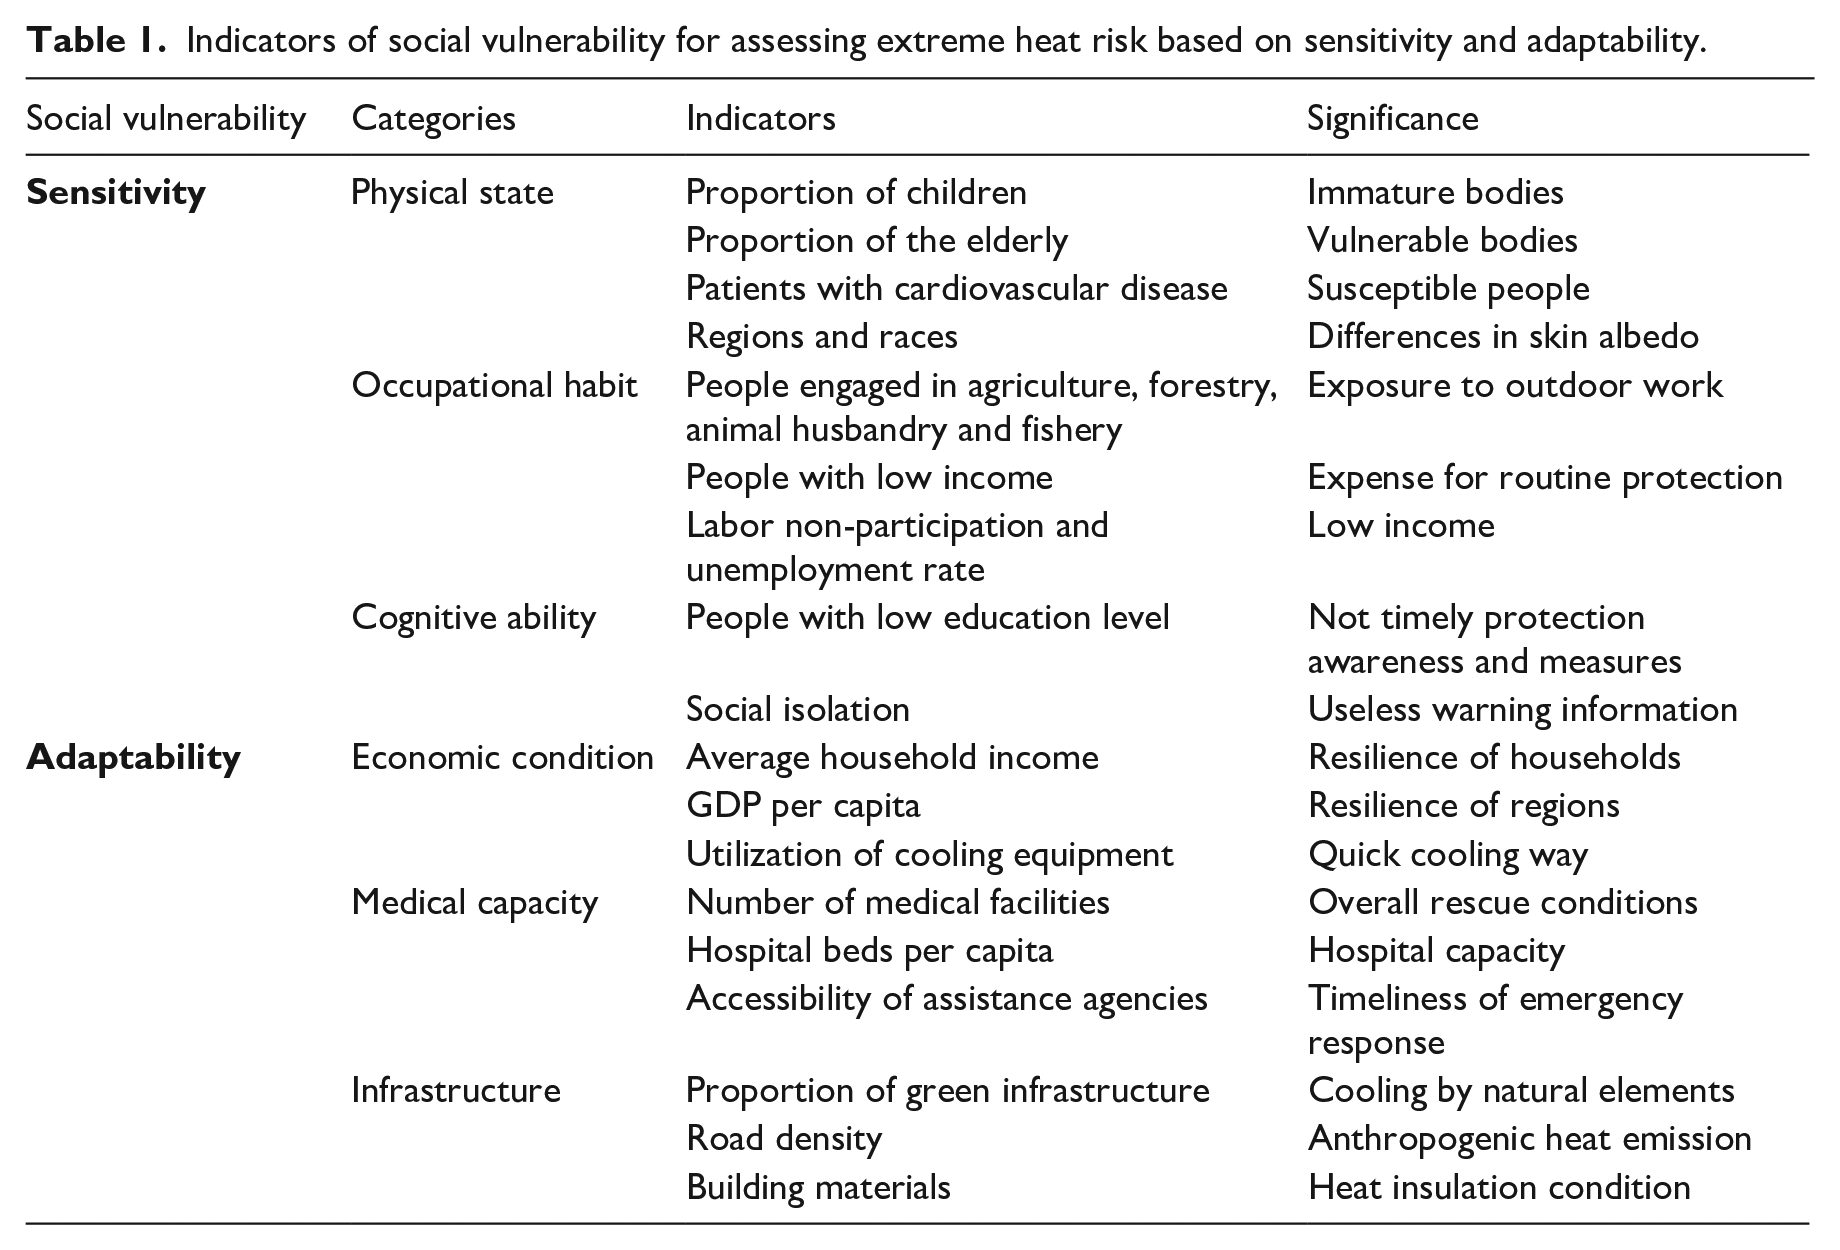
Social vulnerability characterizes the propensity or predisposition of socio-economic elements that are damaged or destroyed by the extreme thermal environment, mainly including sensitivity and adaptability (Table 1). Sensitivity generally involves people who are more susceptible to extreme heat and is mostly related to people's physical state, cognitive ability, and occupational habits (Alahmad et al., 2020; Gronlund, 2014). For example, children and the elderly are more sensitive to heat stress due to physiological differences in age (Yao et al., 2024; Zhang et al., 2019). People engaged in agriculture, forestry, animal husbandry, and fishery mainly work in outdoor areas, so they have a higher probability of being exposed to heat hazards (Slesinski et al., 2025). Likewise, indicators such as the proportion of population with a low education level, rate of labor non-participation or unemployment, and household income were commonly used to characterize social sensitivity related to extreme heat risk (Ho et al., 2018; Kim et al., 2020). On the other hand, adaptability refers to the ability to respond effectively before, during, and after heat hazards (Callahan and Mankin, 2022; Sampson et al., 2013). In previous studies, GDP per capita was often used to characterize regional economic development. The number of medical facilities or their accessibility could reflect the rescue capabilities to extreme events, and the utilization of cooling equipment showed whether people could relieve the discomfort caused by heat stress in time. In addition, the proportion of impervious surfaces and green infrastructure, road density and sky view factor can indirectly affect the aggravation or reduction of heat stress induced by urban development. However, limited by the low spatial and temporal resolution of socio-economic data, vulnerability and exposure assessment are difficult to match with high-resolution climatic factors, and some studies used alternatives such as the human settlement index to represent affected socio-economic processes (Hu et al., 2017).
Indicators of social vulnerability for assessing extreme heat risk based on sensitivity and adaptability.
Data normalization and indicators integration are the main steps to integrate different dimensions to accurately quantify regional extreme heat risk (Hua et al., 2021). Min-max normalization and Z-Score normalization are widely used to eliminate factor dimensions and scale the ranges to ensure that different types of variables are comparable. Moreover, considering that thresholds existed in the nonlinear relationship between heat stress and outcomes, Estoque et al. (2020) introduced the MMT to optimize the data standardization of heat health risk based on the “hazard-vulnerability-exposure” framework in 139 cities of the Philippines. The application of MMT could solve the problem of risk overestimation in areas with suitable temperatures that may be caused by traditional standardized methods based on overall temperature distribution. In addition, setting equal weight, expert scoring, principal component analysis, and other methods of weight assignment are mainly applied to determine the different effects of multi-indicators (Conlon et al., 2020; Song et al., 2020), and then the principle of addition or multiplication is used to construct a comprehensive heat risk index (Aubrecht and Özceylan, 2013). The above-mentioned methods could be considered as individually integrating various indicators (that are independent of each other) at different dimensions. However, whether the potential relationships or coupled interactions exist among the multiple indicators or different dimensions remains unclear.
Exposure-response approach
The indicators-integrating approach essentially combines the different climatic and social factors contributing to the heat risk but lack the consideration of the eventual outcome due to the heat risk. Death or health registration or monitoring systems provide a possible data basis for connecting extreme heat with health outcomes (Yao et al., 2025). The relative risk (RR) or odds ratio (OR) was generally computed in previous studies to assess the effect of temperature on the decrease or increase of the deadly risk, which represented the intensity of the relationship between the exposure (temperature) and its response (death) (Bhaskaran et al., 2013; Shang et al., 2024). The distinction from the indicators-integrating approach is that exposure refers to the exposed hazard factor but not the groups exposed to extreme heat. The higher the absolute value of RR or OR is, the stronger the relationship between the temperature and risk is. Furthermore, the attributable fraction or attributable mortality could further characterize the excess deaths caused by extreme heat events (Voorhees et al., 2011; Wang et al., 2020).
The exposure-response approach relies on the long-term statistics of deaths caused by various diseases or in different age groups. The essence of such an approach is assessing the causal relationship involving the occurrence and outcome, aiming to identify the direct effect of extreme heat and which kind of groups are susceptible (Lüthi et al., 2023). According to the complex feedback of human bodies to the thermal environment, the effect of exposure factors on response variables has been proven to be a non-linear correlation with time lag (Runkle et al., 2020). The distributed lag non-linear model has been widely used to assess the non-linear relationship between temperature and deadly risk under single and cumulative lag conditions (Armstrong, 2006). Involving the confounding factors (e.g., relative humidity, PM2.5 concentration and ozone concentration) and eliminating the effect of holidays, seasonal or long-term trends, Poisson regression or logistic regression are generally introduced as the link function (Gasparrinia et al., 2010). The distributed lag non-linear model adds the dimension of lag to the traditional exposure-response relationship through a cross-basis function, thus quantifying the three-dimensional distribution characteristics among the effect variables (deadly risk), independent variables (temperature), and lags (day) (Sim et al., 2020; Vicedo-Cabrera et al., 2019). Taking MMT as the reference temperature, the cumulative risk greater than MMT or extreme heat thresholds (e.g., 92.5%, 95%, or 97.5%) is considered as the heat effect or extreme heat effect (Guo et al., 2017).
A non-linear correlation between temperature and RR of various diseases has been proved at different scales. Although the correlation curves showed significant differences in the shape of “U”, “W” and “V”, the temperature and RR were generally correlated in the shape of “J” when the ambient temperature exceeded the MMT (Aboubakri et al., 2020; Gu et al., 2020). The U-shape curve between average temperature and RR in Tianjin, China, revealed that significant heat effect usually occurred within 0-3 days (Guo et al., 2011). Similarly, local and regional analysis from 66 communities in China showed the U-shape or W-shape curve between temperature and RR, but the RR appeared to have exponential growth as the thermal environment intensified in Northern and Eastern China (Ma et al., 2015). Furthermore, the attributable fraction of extreme heat (>97.5th temperature threshold) in some regions was obviously higher than that of moderate heat (Gasparrini et al., 2015). In addition, when comparing the spatial differences, the overall cold and heat effects in rural counties were higher than those in urban areas, and the heat effects were prominently reflected in the elderly and people with respiratory disease (Hu et al., 2019).
In addition to establishing the relationship between temperature and deadly risk directly, indicators such as the proportion of different land use types, economic factors, and demographic structure can further be used to interpret the RR or OR relationships. For example, there was a positive or negative relationship between different types of land use and OR in London. The average OR for forests, pastures and arable land was 0.986, and the average OR for port areas and airports was 1.149 (Murage et al., 2020). Districts in the Middle East with high greenness had a lower heat-mortality risk (Luque-García et al., 2024). Fitting the OR above the different percentage thresholds of influencing factors revealed that the labor non-participation rate, senior density, and road density had the highest relations in Greater Vancouver (Krstic et al., 2017). However, another similar study in Greater Vancouver showed that it was hard to correlate the density of the elderly and persons living alone to the deadly risk (Ho et al., 2017). Overall, the various exposure-response relationships show the different contributions of influencing factors to extreme heat risk at local scales, thus leading to the fact that key parameters could not be suitable across regions simultaneously.
Research prospects on extreme heat risk assessment
Indicators-integrating approach: From individual significant factors to coupling paths
The indicators-integrating approach mainly includes the assessment of a single indicator and the overlay of multiple indicators. However, the effectiveness of selecting the evaluation indicators through prior knowledge is still questionable, and a traditional method might bring great uncertainties when seeking solutions for mitigating heat risk (Yao et al., 2024). For instance, the use of cooling equipment such as air conditioners or fans has been regarded as a supporting heat adaption strategy. However, the correlation between the increase in air conditioning prevalence and the reduction of heat-related risk was weak and insignificant in the United States (Bobb et al., 2014). Likewise, increasing air conditioning prevalence did not significantly reduce heat-related mortality in Japan (Ng et al., 2016). Therefore, better cognizing whether and to what extent social vulnerability, urban morphology, and population migration are really associated with extreme heat risk could help to establish more localized and differentiated indicator systems of extreme heat risk assessment (Shang et al., 2024).
Furthermore, the traditional approach to integrating multiple indicators usually neglects the direct or indirect effect paths among different indicators. Especially for the complex response processes of socio-economic systems, the structural equation model or mediating effect model can be applied to effectively promote the systematic assessment of extreme heat risk based on indicators-paths but not indicators-integrating. As a possible example, higher social isolation might be apparent in communities with a larger proportion of the elderly. The relative isolation from information and inconvenience of movement lead to lower access to medical facilities, causing higher scores of social vulnerabilities when assessing the extreme heat risk (yellow paths shown in Figure 2).
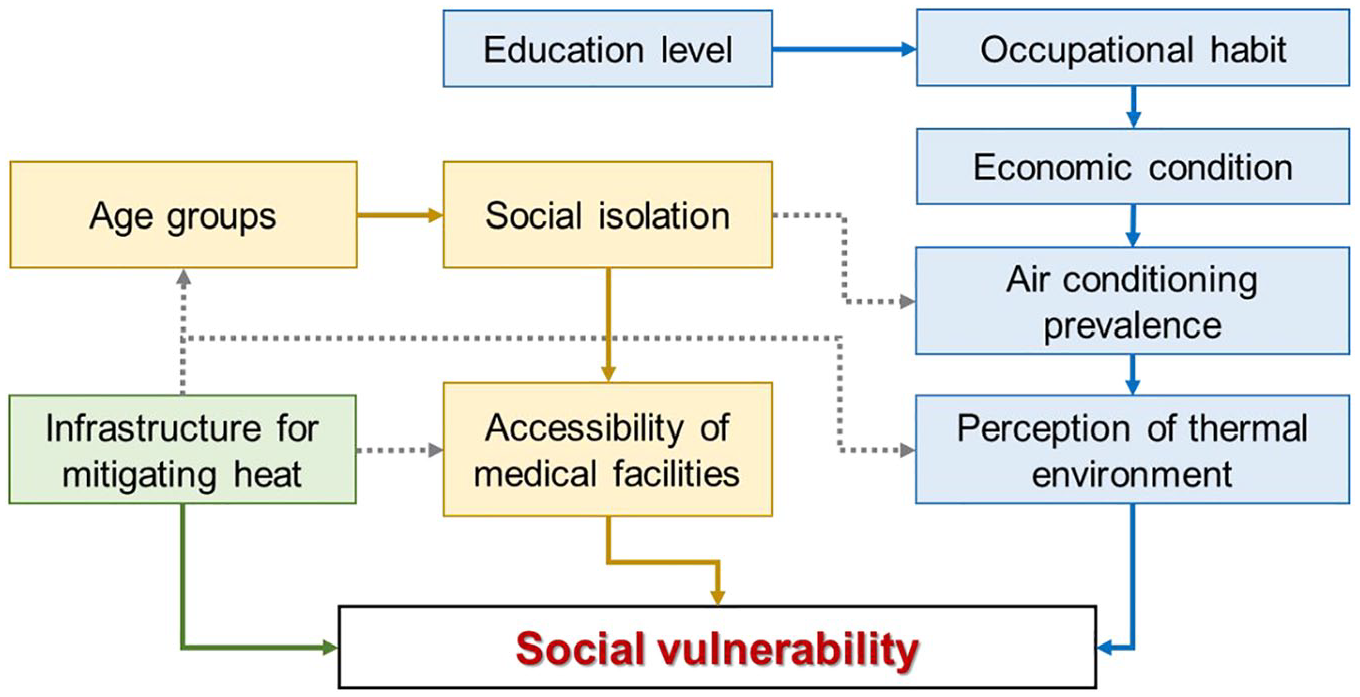
Effect paths of multiple indicators to social vulnerability (Three main paths are shown in blue, yellow and green lines, and other potential paths are represented as dotted lines).
Exposure-response approach: From excess risk to effectiveness of heat adaptation
The non-linear lag correlation between temperature and mortality based on historical monitoring data reflects that when the ambient temperature exceeds MMT, relative risk increases with the temperature. However, according to the analysis, with long-term spans, heat-related excess mortality or deaths show a decreasing trend in some countries and regions. For example, except for southern California, the excess number of deaths attributable to increased temperature declined during 1987-2005 in the United States. Likewise, the number of excess heat-related deaths decreased for each age group during 1972-2010 in Japan (Ng et al., 2016). Some studies have suggested that the above-mentioned downward trend might be attributed to the increase in human bodies’ or society’s adaptability to the thermal environment (Chung et al., 2018; Navas-Martín et al., 2024); that is, the adaptability could offset the negative effects of extreme heat (Vicedo-Cabrera et al., 2018).
However, quantitative analysis of the effectiveness and drivers of heat adaptation is still lacking (Gosling et al., 2017). Due to larger MMT in higher ambient temperatures, the offsets might be dominated by the enhanced adaptability of human bodies to extreme heat (Figure 3). Or supported by social development, several shelters from the extreme heat are planned to mitigate the increased heat stress (Figure 3). In addition, the increase of heat-related excess mortality with global warming under different future scenarios has been proved in previous studies (Gasparrini et al., 2017; Gu et al., 2020; Huber et al., 2020). Therefore, further research is needed to determine how to incorporate the enhancement of adaptability into future predictions of extreme thermal risk.
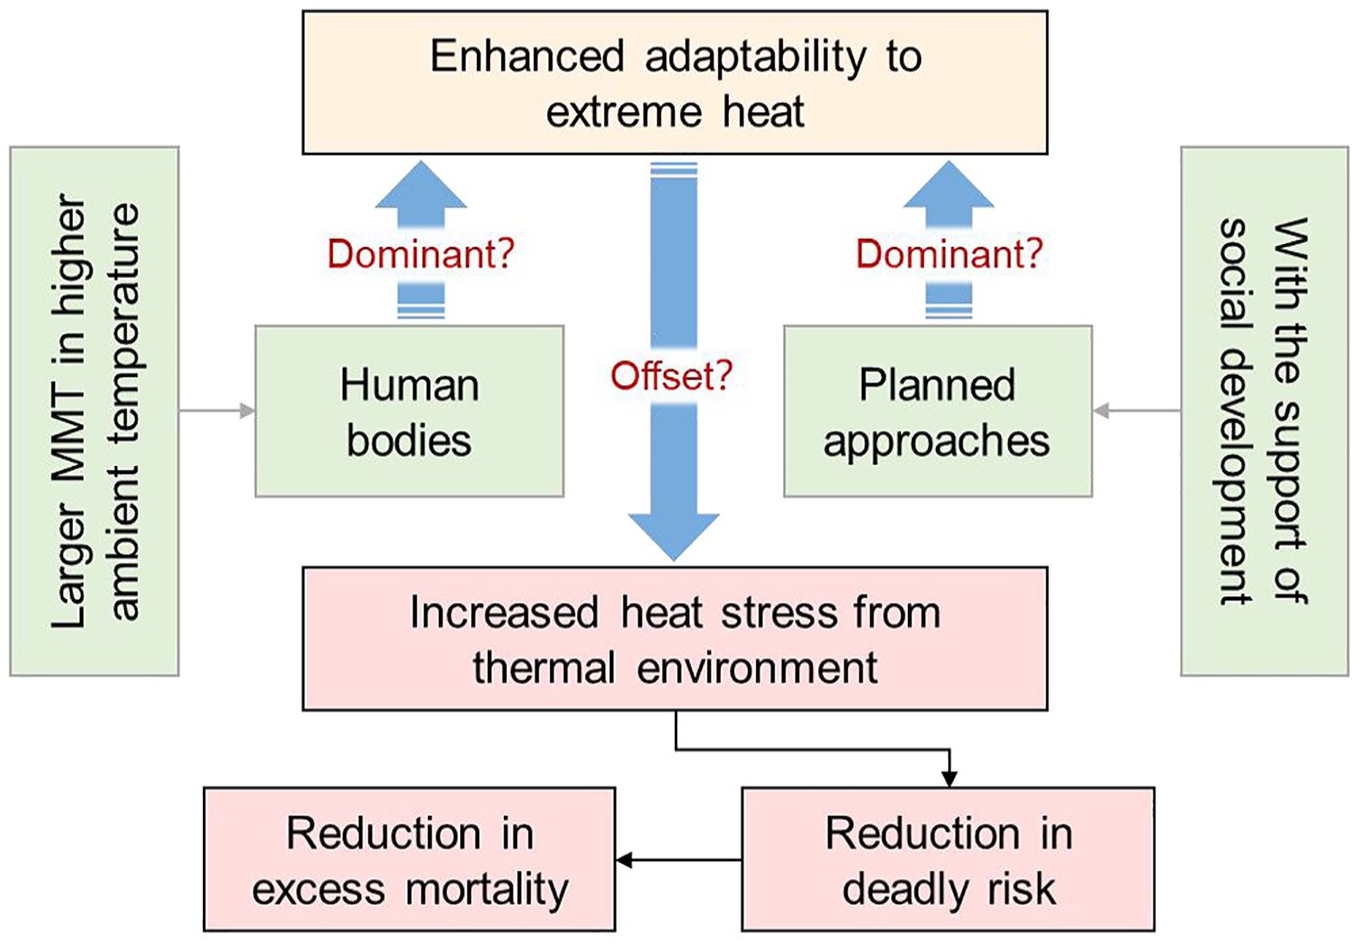
Effectiveness and potential drivers of adaptability to extreme heat.
Comprehensive assessment: Exposure-Driver-Response cascade framework
Meta-analysis was generally applied to obtain regional cumulative effect by considering the local exposure-response relationships. However, there is a lack of attention to the driving mechanism of multi-elements and multi-processes in the generation of exposure-response relationships (Gronlund, 2014; Zander et al., 2019). Because the exposure-response approach reflects the deadly relations directly, the potential regional heat risk related to various social-ecological elements and processes is likely to be neglected or underestimated (Oka et al., 2024; Zha et al., 2024). For example, although Hu et al. (2019) showed that the overall heat effect (derived from the exposure-response relationship) in rural counties was higher than in urban areas, this did not mean that urban areas were not key areas that need to be guarded against extreme heat risk. Based on the indicators-integrating assessment, risk with extreme heat and population agglomeration in urban areas are generally found, so it is also necessary to develop mitigating strategies in urban areas.
We proposed a cascade framework of “extreme heat exposure – social-ecological driver – health outcome response” that should be further established in the future (Figure 4). According to the processes of extreme heat risk, anomalies of the climate system are expressed by the temperature (exposure of risk), leading to the occurrence of extreme heat events (basics of heat stress indicators). And social-ecological processes (like vulnerability indicators) would respond to the events, which can even cause damage or deaths (response to risk). Particularly, social-ecological drivers and health outcome response should be more targeted for different diseases (e.g., heatstroke and cardiovascular disease), socio-economic costs (e.g., decline in labor efficiency and loss of the supply chains), and various vulnerable groups (e.g., the elderly and outdoor workers). Therefore, establishing comprehensive assessments based on the cascading framework considering both the direct and potential risks of extreme heat could further promote the systematic practice of mitigation and adaptation.
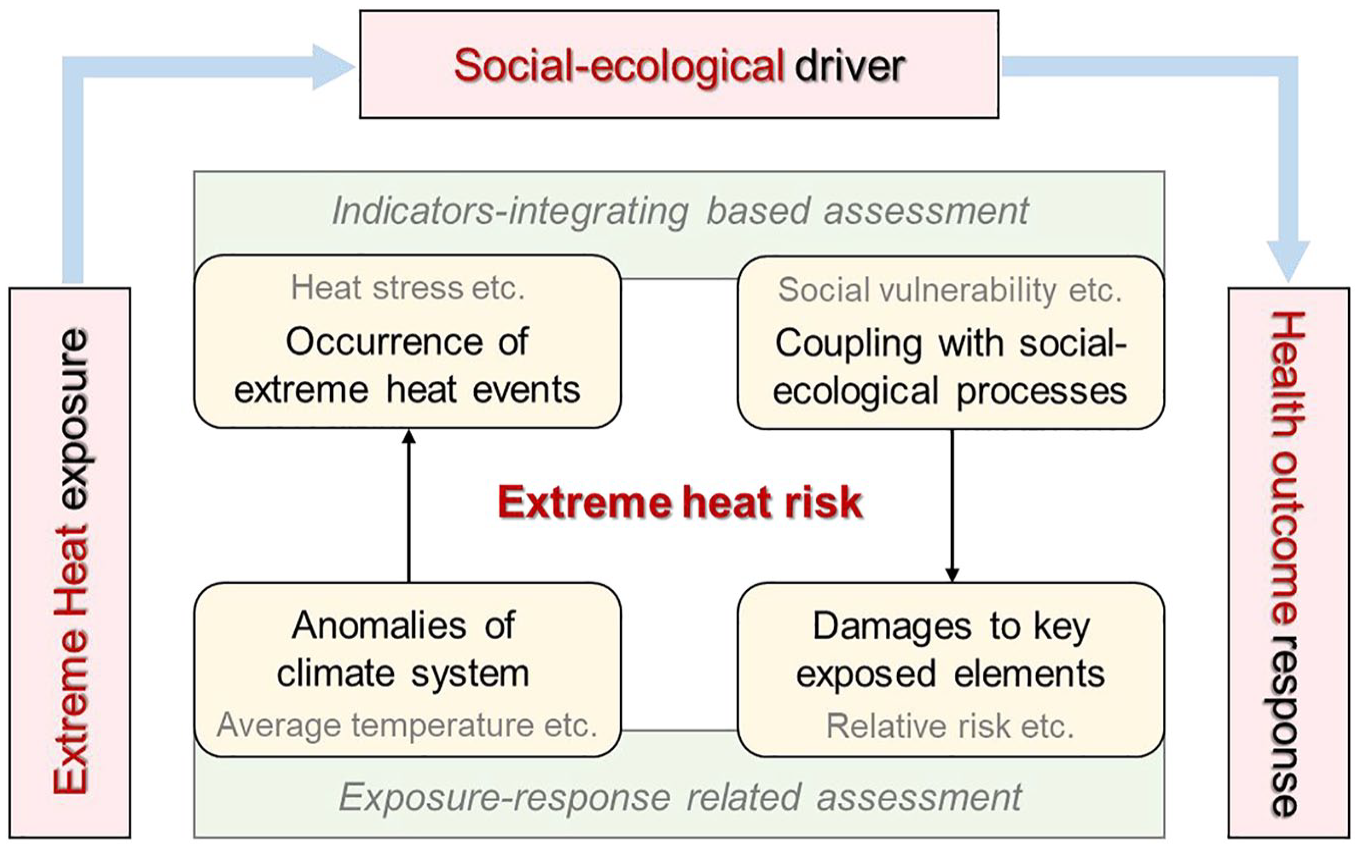
Exposure-Driver-Response cascade framework of extreme heat risk.
Footnotes
Declaration of conflicting interests
The author(s) declared no potential conflicts of interest with respect to the research, authorship, and/or publication of this article.
Funding
The author(s) disclosed receipt of the following financial support for the research, authorship, and/or publication of this article: This research was financially supported by the National Natural Science Foundation of China (42401108).