
Abstract
The karst regions in southwest China are integral to maintaining regional ecological security. However, escalating human activities in these areas have intensified soil erosion and landscape fragmentation. Clarifying the role of landscape patterns in karst regions as drivers of soil erosion processes is essential for providing crucial support in mitigating regional soil erosion. By utilizing unmanned aerial vehicle detection, this study examined the soil erosion characteristics, driving factors, and interaction effects in peak-cluster depression landscapes. The investigation was conducted at multiple scales, including peak-cluster depression, grid, and patch levels, under the combined ecology–agriculture, ecology–economy and near–nature landscape utilization types. Furthermore, an optimal landscape pattern for alleviating soil erosion was identified. The research findings indicate that the proportions of mild and moderate erosion were higher in the ecology-agriculture landscape utilization type compared to the other two landscapes. In the ecology-economy type, slight soil erosion predominated. Increasing vegetation cover led to a decrease in soil erosion risk in the near-nature landscape utilization type. The interaction effects among factors contributed to an enhanced explanatory power for soil erosion. Particularly, the synergistic effect between vegetation coverage and land use exhibited the most significant influence on soil erosion. The mosaic distribution pattern of soil erosion sources and sinks, as well as the distribution pattern of fragmented source and aggregated sink distribution pattern, effectively mitigated soil loss, leading to reduced soil erosion rates.
Introduction
The karst region constitutes a significant component of the Earth’s surface system, accounting for around 12% of global land area, and is characterized by active karst processes and interconnected surface ecosystems (Febles-Gonzalez et al., 2012; Wang et al., 2020). The southwestern karst region of China hosts the world’s most typical tropical–subtropical karst landforms, serving as a characteristic ecologically fragile area and an ecological barrier functional zone. This region plays a crucial role in climate regulation, water resource protection, and biodiversity preservation (Green et al., 2019). The predominant ecological issue in karst regions is rocky desertification, a form of land degradation exclusive to subtropical fragile karst environments that is primarily caused by soil erosion (Wang, 2002; Yan and Cai, 2015). The process of rocky desertification further exacerbates severe soil erosion and continuous deterioration of the ecological environment in karst regions. Additionally, increasing human disturbances have led to the fragmentation of karst landscapes from large and interconnected patches to smaller irregularly shaped patches, resulting in rapid changes in karst landscapes (Lu et al., 2021; Zhang et al., 2000). Landscape refers to the spatial entity resulting from the interaction and embedding of different units, which exhibit visual characteristics (Xiao et al., 2003). Different interactions between land use and cover produce diverse and complex patches and matrices, collectively termed landscape patterns (Wu, 2007). Ecological processes are influenced by scale limitations and exhibit certain functions. The mechanisms underlying the interaction between pattern and process vary at different scales, and factors affecting landscape dynamics are scale dependent. Small-scale observations and simulations provide better controllability, while large-scale studies effectively identify multiple influencing factors and mechanisms (Fu et al., 2010). Investigating soil erosion processes and landscape patterns at different scales can reveal key influencing factors and interactions. Given the significant impact of landscape change and human disturbances on soil erosion rates and severity, simulating soil erosion response to landscape changes at different scales is vital (Wang et al., 2019).
Soil erosion poses a dual challenge: causing soil degradation and decreased land productivity and constraining the sustainable socio-economic development of affected regions (Borrelli et al., 2017; Shi et al., 2018). Current research on soil erosion has predominantly revolved around monitoring and modeling methodologies. Common methods used for soil erosion monitoring include slope plot runoff analysis (Peng and Wang, 2012), isotope tracing techniques (Calitri et al., 2020), and remote sensing technologies (Ghosh et al., 2023). Modeling and simulation approaches are favored due to their cost-effectiveness, simplicity, and broad applicability. Among these approaches, the revised universal soil loss equation (RUSLE) model has been demonstrated to have a strong adaptability to simulate soil erosion in karst regions and has gained widespread recognition. The relationship between landscape patterns and soil erosion processes is significant. Landscape patterns mainly affect the processes of evapotranspiration, interception, surface runoff, and their spatiotemporal variations through land use, vegetation patterns, and their changes, which in turn affect the processes of water yield and soil erosion. Soil erosion, on the other hand, affects the vegetation patterns by redistributing and aggregating water and soil resources, which further drives the spatial heterogeneity dynamics of landscape patterns (Fu et al., 2010; Wilcox et al., 2003). In the comprehensive study and management of karst areas at multiple spatial scales, the patterns, processes, driving forces, effects, and integrated management exhibit significant spatial scale characteristics (Chen et al., 2020). Studies on soil and water processes and landscape patterns have been conducted across multiple scales, such as the watershed scale (Palliyaguru et al., 2023; Rao et al., 2023), slope scale (Liu et al., 2013; Ludwig et al., 2005), and patch scale (Tang et al., 2017). Large-scale studies reveal the spatial distribution of soil erosion and contribute to the prediction of future trends. Meanwhile, there are internal variations within regions, and fine-scale soil erosion modeling can capture interregional differences more effectively, enabling the formulation of appropriate ecological governance measures tailored to specific conditions. Geographic detectors are instrumental in detecting the spatial differentiations of geographical elements within a region and their influencing factors. Operating at the grid scale, they can analyze the main factors and mechanisms influencing soil erosion (Gao et al., 2022). Therefore, investigating the driving factors of karst soil erosion and their pattern responses at different scales serves as a valuable reference for understanding the scale effects of the coupled processes of water and soil loss and landscape patterns in karst regions. This research is crucial for effectively regulating the multi-scale patterns, processes, and services of karst ecosystems.
Human intervention in the environment has accelerated changes in landscape patterns, particularly in the karst regions of Southwest China, leading to fragmented landscapes and exerting varying degrees of impact on the structure, function, and ecological processes of regional landscapes (Gao and Cai, 2010; Wang et al., 2019). Soil erosion is a major factor contributing to the aggravation of rocky desertification in karst regions. The spatial configuration of landscape elements, particularly the connectivity and spatial distribution of runoff and sediment sources and sinks, significantly influences soil erosion (Gao et al., 2013). Soil erosion sources refer to areas such as exposed ground between patches of vegetation that generate runoff and sediment, while sinks intercept and impede material flow, reducing runoff and sediment production (Ludwig et al., 2002; Mayor et al., 2008). By combining the functional classification of soil erosion sources and sinks with landscape analysis, it is possible to elucidate the differences in the internal patterns of these erosion elements. The spatial pattern of the land surface cover significantly affects the collection of runoff and sediment carrying capacity, disrupting the continuity of soil erosion processes and exerting a significant impact (Fu, 2014; Xu et al., 2006). The peak-cluster depression is one of the most typical karst landforms with severe rocky desertification, characterized by a grim soil erosion situation and a significant human–environment contradiction. The high-intensity agricultural activities and significant population pressure in this area result in a high overlap between rocky desertification and poverty, making it a classic ecologically fragile area (Wang et al., 2016). Spatially, peak-cluster depressions often correspond to natural villages or production groups, forming a unique composite peak-cluster depression and rural settlement landscape that comprehensively reflects the regional natural and socio-economic conditions (Li et al., 2018). The soil loss in rural settlements in the southwestern karst region is intricately linked to the natural environment, as well as the spatial structure, production activities, lifestyle choices, and development (Zhang et al., 2010). Land use patterns serve multiple functions based on the comprehensive interaction among various elements within the land system and the underlying land use structure. These functions primarily encompass ecological, production, and livelihood functions (Liu et al., 2017; Pérez-Soba et al., 2008). The integration of natural and artificial landscapes in space establishes a national land space with distinct purposes for living, production, and ecology, embodying the multifunctionality of the landscape (Liu and Fu, 2019). Understanding land use functions and landscape multifunctionality effectively mitigates interregional land use conflicts, highlights the importance and sensitivity of ecosystem services. By simultaneously considering ecological and economic benefits, regulating the patterns, processes, and services of karst ecosystems can promote harmonious development between humans and nature in karst regions.
Analyzing landscape patterns and studying the dynamics of human-environment interactions in multi-scale are crucial for optimizing ecosystem management and achieving sustainable development. In this study, a framework of ecological–production–livelihood functions and landscape multifunctionality was adopted to classify the study area. Starting from the peak-cluster depression and rural settlement, the areas were categorized into three distinct categories: ecology–agriculture, ecology–economy, and near–nature. Using high-precision Unmanned Aerial Vehicle (UAV) data and satellite remote-sensing data, the soil erosion characteristics and differences of different landscape utilization types at the scale of peak-cluster depressions were analyzed. Subsequently, a geographical detector was employed at the grid scale to identify the driving factors of soil erosion with different landscape utilization types. Based on the results obtained at the peak-cluster depression and the grid scale, we examined the pattern response of soil erosion at the patch scale using source-sink theory and landscape indices. The aim of this study is to investigate the interaction mechanisms between landscape pattern and soil erosion at different scales in karst regions, and to identify the driving factors of soil erosion. This study provides valuable insights for managing rocky desertification, assessing ecosystem services, and promoting sustainable development in delicate karst ecosystems.
Materials and methods
Study area
In this study, we focused on Puding County, located in the central part of Guizhou Province, China (Figure 1). Puding County has a subtropical monsoon humid climate. The rainfall is concentrated in June and July, and the overall climate remains moderate throughout the year. This region contains strong karst landforms, which are characterized by typical peak-cluster landscapes and severe rocky desertification. The extensive distribution of carbonate rocks, fragmented landforms, dense population, and unsustainable land use in this region has led to a low disaster resistance and high environmental sensitivity, resulting in severe rocky desertification and significant ecological vulnerability, which greatly constrains regional sustainable development (Xiong and Chi, 2015; Zaied et al., 2021). Soil erosion is prevalent in this area due to the uneven distribution of water resources and the high land cultivation rate (Lu et al., 2019). The county has a relatively low level of exposed rock surfaces, and the heavily rocky desertified areas are primarily situated in the central and southern regions. The northeastern and western regions have a lower proportion of exposed rocks and are mostly classified as no rock desertification, potential rock desertification, and mild rock desertification areas. Traditional agriculture, consisting of a dispersed and family-oriented farming system, is dominant in Puding County. In terms of the county’s economic structure, the primary, secondary, and tertiary industries accounted for 17.2, 27.0, and 55.8%, respectively, in 2019 (Puding County Statistical Report on National Economic and Social Development in 2019, Puding County Statistics Bureau, 2019). The primary sector refers to agriculture, forestry,animal husbandry, and fisheries, while the secondary sector encompasses mining, manufacturing, electricity, heat, gas and water production and supply, as well as construction. The tertiary sector represents the service industry. In recent years, the local government has strengthened agricultural infrastructure development to effectively alleviate poverty and promote rural revitalization. Economic crops such as Chinese chives and tea have been vigorously cultivated, taking advantage of the local ecological environment and promoting the scale of ecotourism, which has significantly improved the standard of living of the local residents.
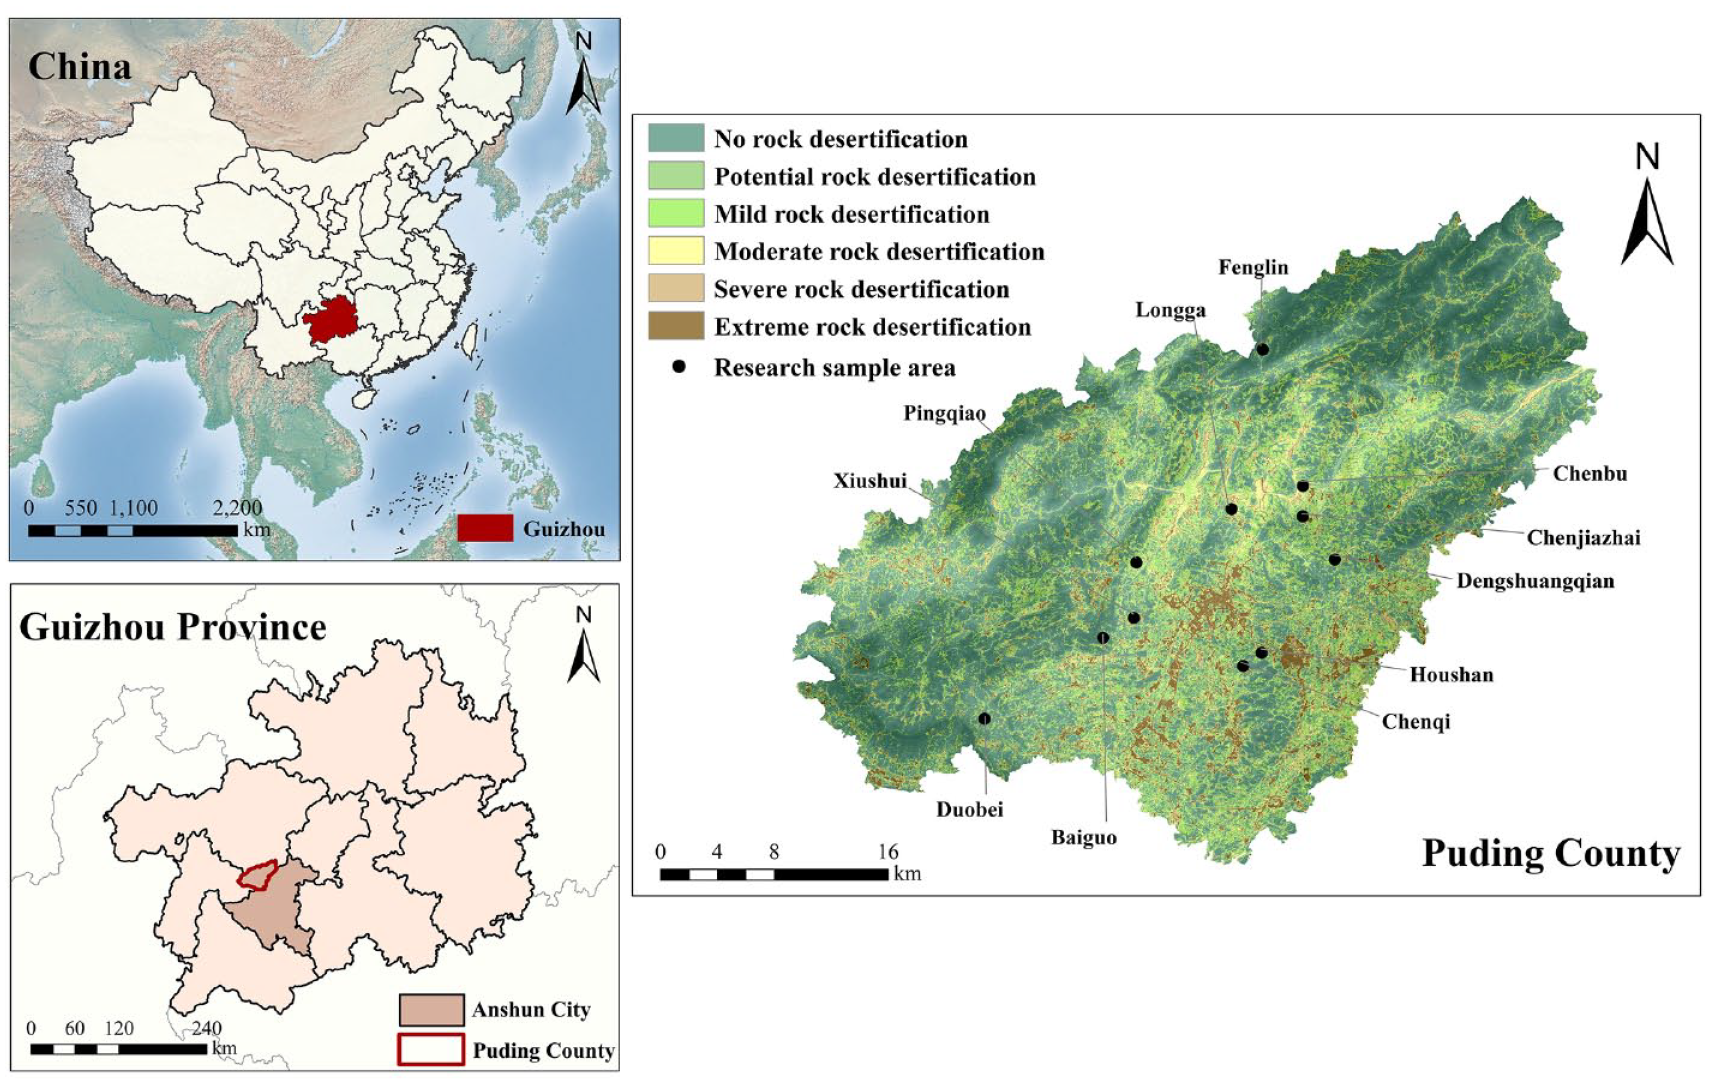
Spatial distribution of peak-cluster depression and rural settlement landscapes in the study area.
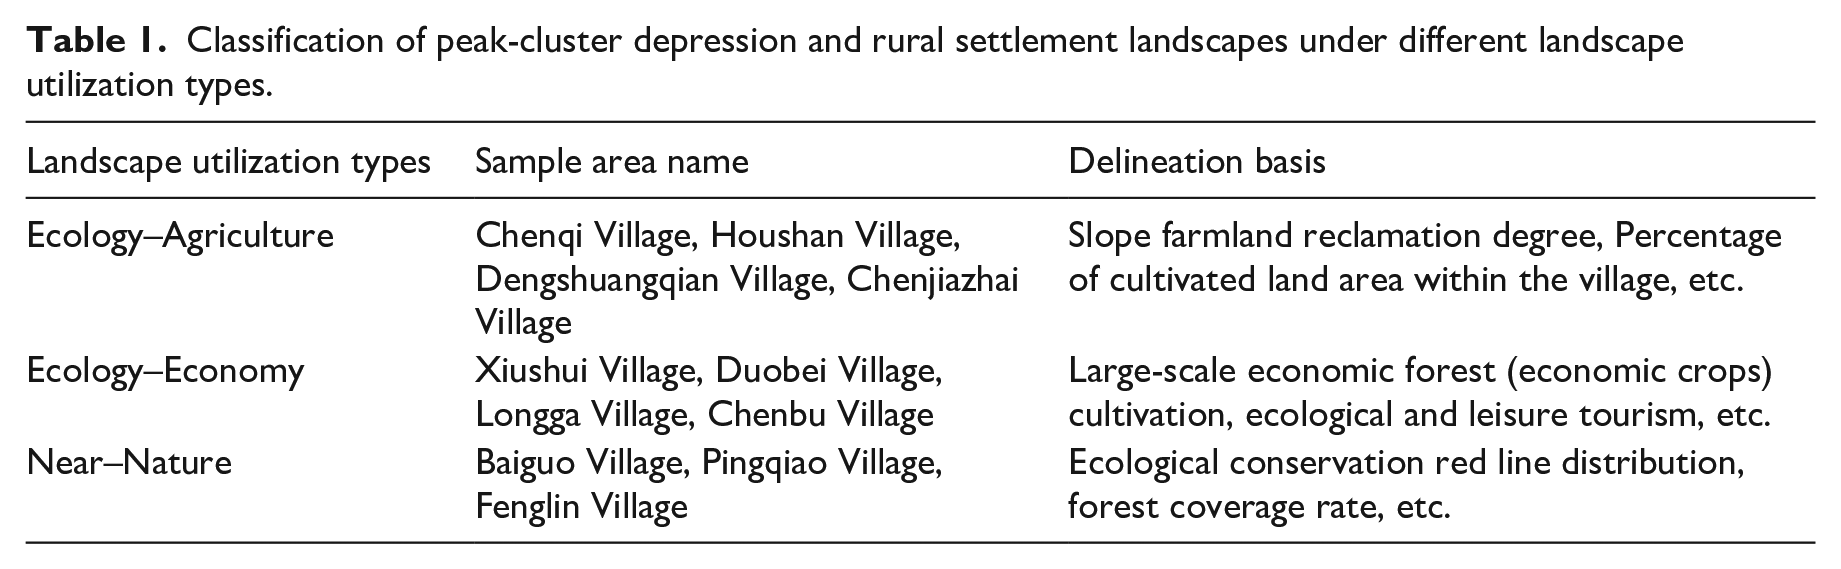
To explore the soil erosion and landscape patterns under diverse land use patterns in karst regions, in this study, we specifically focused on Puding County. Eleven complex peak-cluster depression and rural settlement landscapes were selected and demarcated based on factors such as ecological policy measures, land use conditions, and primary economic development types (Table 1). Drone imagery was employed for data acquisition in these sample areas, facilitating the subsequent analyses. Among these 11 selected complex landscapes, Fenglin Village and Duobei Village were found to exhibit the coexistence of both karst and non-karst areas, while the remaining nine areas were confined solely within karst regions. The visual disparities of these complex landscapes were primarily manifested as variations in the underlying surface types and features, particularly with respect to the land use types and vegetation cover. The classification of different landscape types was determined through the ecological-production-livelihood framework, which considered previous research on peak-cluster depression and rural settlement landscapes (Li et al., 2014; Lu et al., 2019), government reports, relevant publications, and on-site investigations. To differentiate the focus on economic sustainable development versus ecological protection and restoration, data on the primary types of economic development, extent of slope cultivation, forest cover, spatial distribution of population, and future evolution patterns of settlements were integrated and analyzed. Based on this information, appropriate delineations were made. Based on the data collection and field investigations, in this study, we classified these complex peak-cluster depression and rural settlement landscapes into three distinct categories: ecology–agriculture, ecology–economy, and near–nature. The ecology–agriculture category evinced a propensity towards traditional agricultural practices, whereas the ecology–economy category emphasized large-scale agriculture and cultivation of economically significant crops. The near–nature category is mostly located within the ecological redlines or undergoing desertification control, and large areas of forests are distributed in the region. Compared to agricultural cultivation, they place more emphasis on protecting and restoring the natural ecological environment.
Classification of peak-cluster depression and rural settlement landscapes under different landscape utilization types.
Data sources
In this study, we utilized UAV and satellite remote-sensing data. A DJI Phantom 4 Pro Multispectral UAV (Shenzhen Dajiang Innovation Technology Co., Ltd.) with a color sensor for visible light imaging and five monochromatic sensors for multispectral imaging was used. The flight planning was conducted using the DJI GS PRO software, with an 80% forward overlap, 60% side overlap, and a flight altitude of 120 m to meet the requirements for subsequent data processing. The weather conditions were carefully considered, ensuring clear skies and minimal wind for optimal UAV performance. The collected UAV data were processed using the Pix4D Mapper software (Pix4D S.A.) to generate digital surface models (DSM), digital orthophoto maps (DOM), and digital terrain models (DTM). This approach facilitated the identification of the land use types, including cultivated land, garden plots, forest, grassland, construction land, water areas, and other land use types within the study area. The soil data, including spatial distribution maps and attribute data, were obtained from the Harmonized World Soil Database (HWSD) with a 30-meter resolution (http://westdc.westgis.ac.cn/). Given that the study area encompassed relatively small variations in the soil properties within each specific land cover category, this resolution adequately met the research requirements. The daily precipitation data from 2019 to 2021 were obtained from observational records of the Puding Station, which is affiliated with the Chinese Academy of Sciences. These data were utilized for the calculation of the rainfall erosivity factor in the RUSLE model. The normalized difference vegetation index (NDVI) was calculated using near-infrared and red-light wavebands derived from both UAV (with a resolution of 1 m) and Sentinel-2 data (with a resolution of 10 m) (https://scihub.copernicus.eu/). Finally, the rocky desertification data for Puding County were derived from Sentinel-2 data (https://scihub.copernicus.eu/) through remote sensing inversion.
Methodological framework
This study follows the framework of landscape pattern-process-scale analysis, focusing on multi-scale analysis at the scale of peak-cluster depression, patch, and grid. It aims to explore the correlation between the soil erosion simulation and landscape pattern in karst regions, with specific emphasis on near–nature, ecology-agriculture, and ecology-economy landscape utilization types. By integrating UAV detection, land use, meteorology, soil, vegetation cover, topography, and rocky desertification data, the RUSLE model is employed to simulate soil erosion across different landscapes at the scale of peak-cluster depression and rural settlements. The geographic detector was used to identify the effects of the influencing factors and their interactions on soil erosion at the grid scale. The landscape pattern characteristics within the sources, sinks, and erosion level zones were further analyzed using the location-weighted landscape index (LWLI) and Fragstats software (Oregon State University).
RUSLE model
The RUSLE model is widely used for soil erosion modeling due to its ability to overcome the limitations of field observations and to facilitate multi-scale simulation studies (Daniel and Joel, 1995; Wang et al., 2013). The primary calculation formula is as follows:

where
The unique conditions in the karst regions, characterized by special rocky desertification phenomena and complex topography, can lead to deviations when directly applying the RUSLE model (Shang and Xu, 2017). Through artificial rainfall simulation experiments, Dai et al. (2017) discovered a significant negative correlation R (−0.076) between surface soil erosion and rock outcrop rate. Thus, following the approach that Gao and Wang (2019) used in their study on soil erosion in the Sancha River karst region of Guizhou, in this study, we employed the RUSLE model with a correction factor
Correction coefficient for different degrees of rocky desertification.
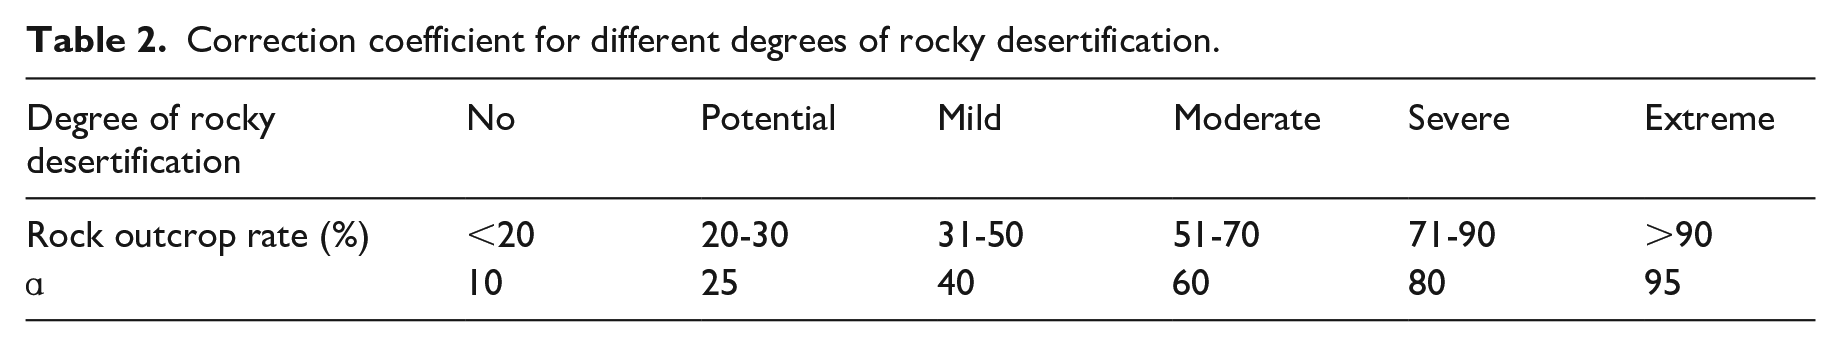

In this study, the study area was classified into karst and non-karst regions based on whether the lithology was carbonate rock. Equation (2) was utilized to simulate the soil erosion in the karst regions, whereas Equation (1) was employed to simulate the soil erosion in the non-karst areas.
Geographical detector
The geographical detector (Wang and Xu, 2017) is a method that examines spatial heterogeneity and identifies the influencing factors by detecting variations and quantifying the spatial differences using the q value. Furthermore, both quantitative and qualitative data are analyzed, and the detector comprises four modules: factor detector, risk detector, interaction detector, and eco-detector. In this study, we employed a geographical detector to investigate the drivers and risks of soil erosion in karst areas with different landscape utilization types. The factor, risk, and interaction detectors were utilized. In this study, four factors including vegetation cover, elevation, slope, and land use were selected as the influencing factors. The natural breakpoint method was employed to classify and grade these factors. Raster data were extracted into points using the fishnet tool in ArcGIS. The factor detector assesses the explanatory powers of the independent variables on the spatial heterogeneity of the dependent variable, which is measured by the q value. The formulas are as follows:
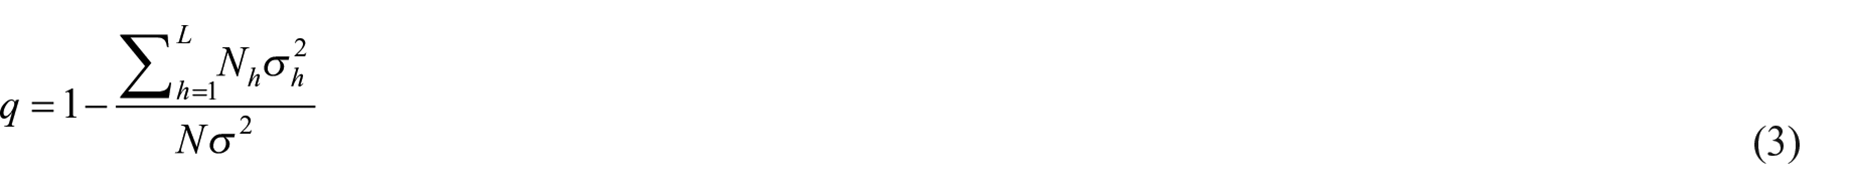
The specific parameters have been described by Wang et al. (2010). The
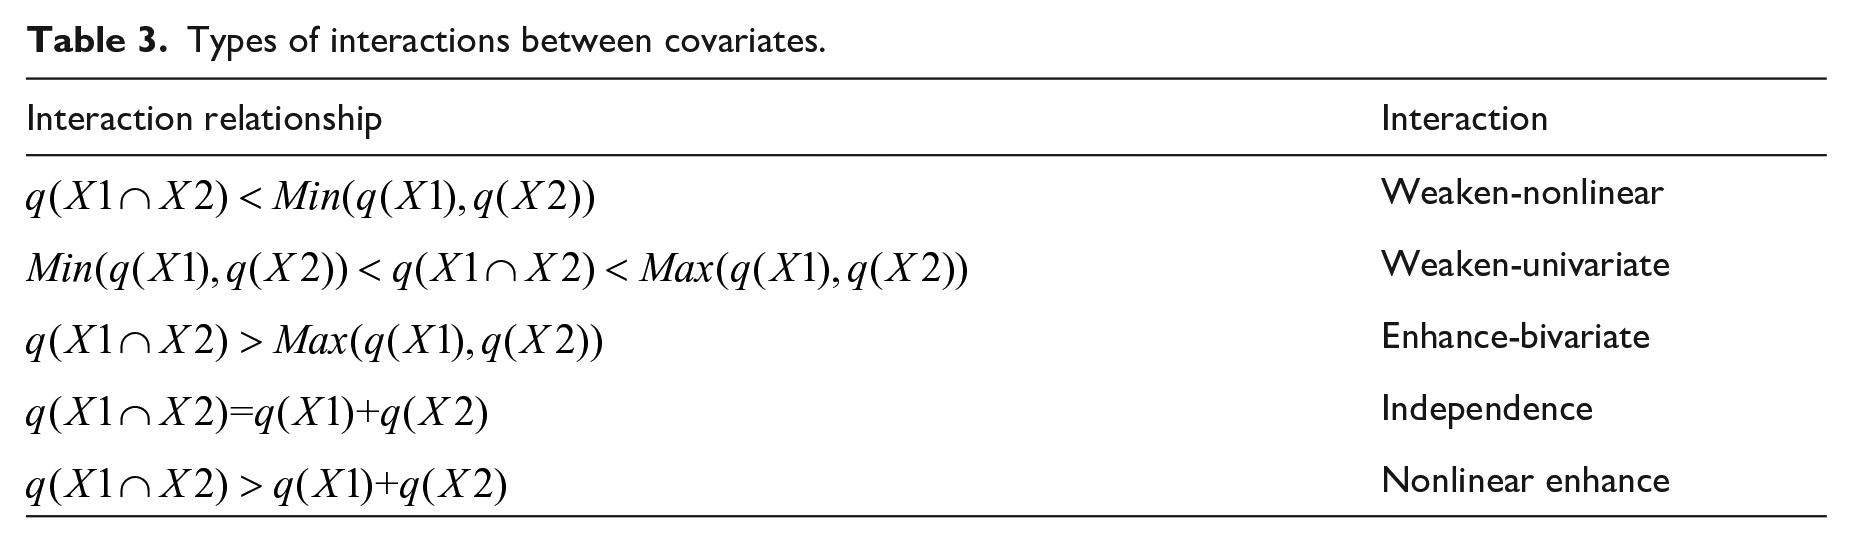
The risk detector utilizes a t-test to assess the significance of the mean differences between two sub-regions with respect to the attributes. The interaction detector, a key feature of the geospatial detector, allows for the exploration of the interaction effects among multiple factors. By comparing the q-values obtained from single-factor and two-factor analyses, it becomes possible to determine the direction and nature of the interaction between two factors. Table 3 provides criteria for classifying different types of interaction effects.
Types of interactions between covariates.
Location-weighted landscape index
The relationship between landscape patterns and ecological processes is reciprocal, with patterns forming the foundation for process development and processes driving pattern evolution. Source landscapes facilitate process development, while sink landscapes impede or slow down process occurrence (Chen et al., 2006). Identifying sources and sinks in soil erosion processes can effectively explore the spatial impacts on soil loss, especially on slopes (Chen et al., 2015). Additionally, the factors influencing regional soil erosion, including the relative distance, relative elevation, and slope, exhibit specific spatial distribution characteristics. In this study, the relative distance and relative elevation represent the distance and elevation relative to the low areas of depressions. The location-weighted landscape index (LWLI) effectively describes the relationship between landscape patterns and soil erosion. A larger LWLI value indicates a greater contribution from “source” landscapes to soil erosion, leading to more severe erosion and higher soil erosion risk. When the LWLI value is greater than 0, it indicates that “source” landscapes within the area contribute more to soil erosion in depressions than “sink” landscapes, resulting in higher soil erosion risk. Conversely, when the LWLI value is less than 0, it suggests that “sink” landscapes contribute more to soil erosion in depressions than “source” landscapes, leading to lower soil erosion risk.
Different land use types exhibit different “source-sink” risk attributes in terms of soil erosion. In soil erosion risk research, landscape units based on land use are considered as the mosaic units, and the spatial distribution pattern of land use within the region can affect runoff and sediment loss (Wang et al., 2017). For defining “source” and “sink” landscape types, land use types with strong human interference, such as cultivated and construction land, are considered as “source” due to their extensive external input of materials and energy. On the other hand, many natural landscape types, such as forest, shrubland, and grassland, have less external interference and require significant water and nutrient absorption from the soil. They have certain capacity for intercepting surface water and nutrients loss and act as “sink” (Chen et al., 2003). Additionally, according to the results of geographic detectors, the synergistic effect between vegetation cover and land use is the primary explanatory factor for soil erosion in most sample areas, indicating the impact of variations in vegetation cover and land use on soil erosion. Therefore, in this study, we determined the soil erosion source and sink areas based on land use and classified the forest and grassland in the research area into low vegetation cover and medium–high vegetation cover categories based on the degree of vegetation cover. We identified the cultivated land, construction land, other land, low vegetation-covered grassland, and low vegetation-covered forest as sources and the medium–high vegetation-covered grassland, medium–high vegetation-covered forest, and garden plots as sinks. The formulas for calculating the LWLI are as follows:
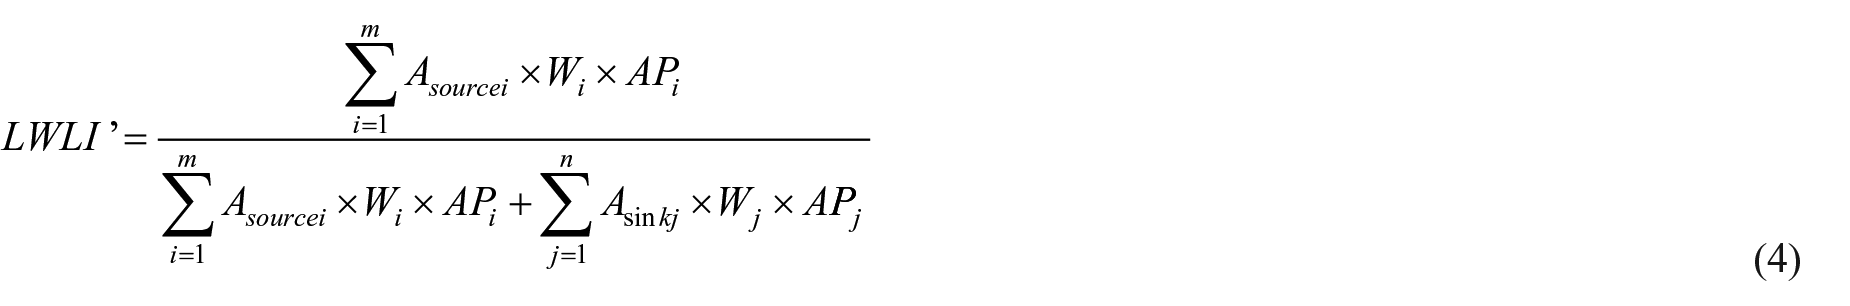

The specific parameters have been described by Sun et al. (2012). In this study, the weights for the source and sink landscapes were determined based on previous research (Wang et al., 2017). The weight values assigned to the different landscape types are 0.3, 0.4, 0.6 0.7, 0.5, 0.6, 0.8, and 0.8 for cultivated land, construction land, other land, low vegetation-covered grassland, low vegetation-covered forest, medium-high vegetation-covered grassland, medium-high vegetation-covered forest, and garden plot, respectively. The relative distance was calculated using the Euclidean distance method, and Matlab was used to analyze the various landscape utilization types to obtain the LWLI.
Landscape index based on Fragstats software
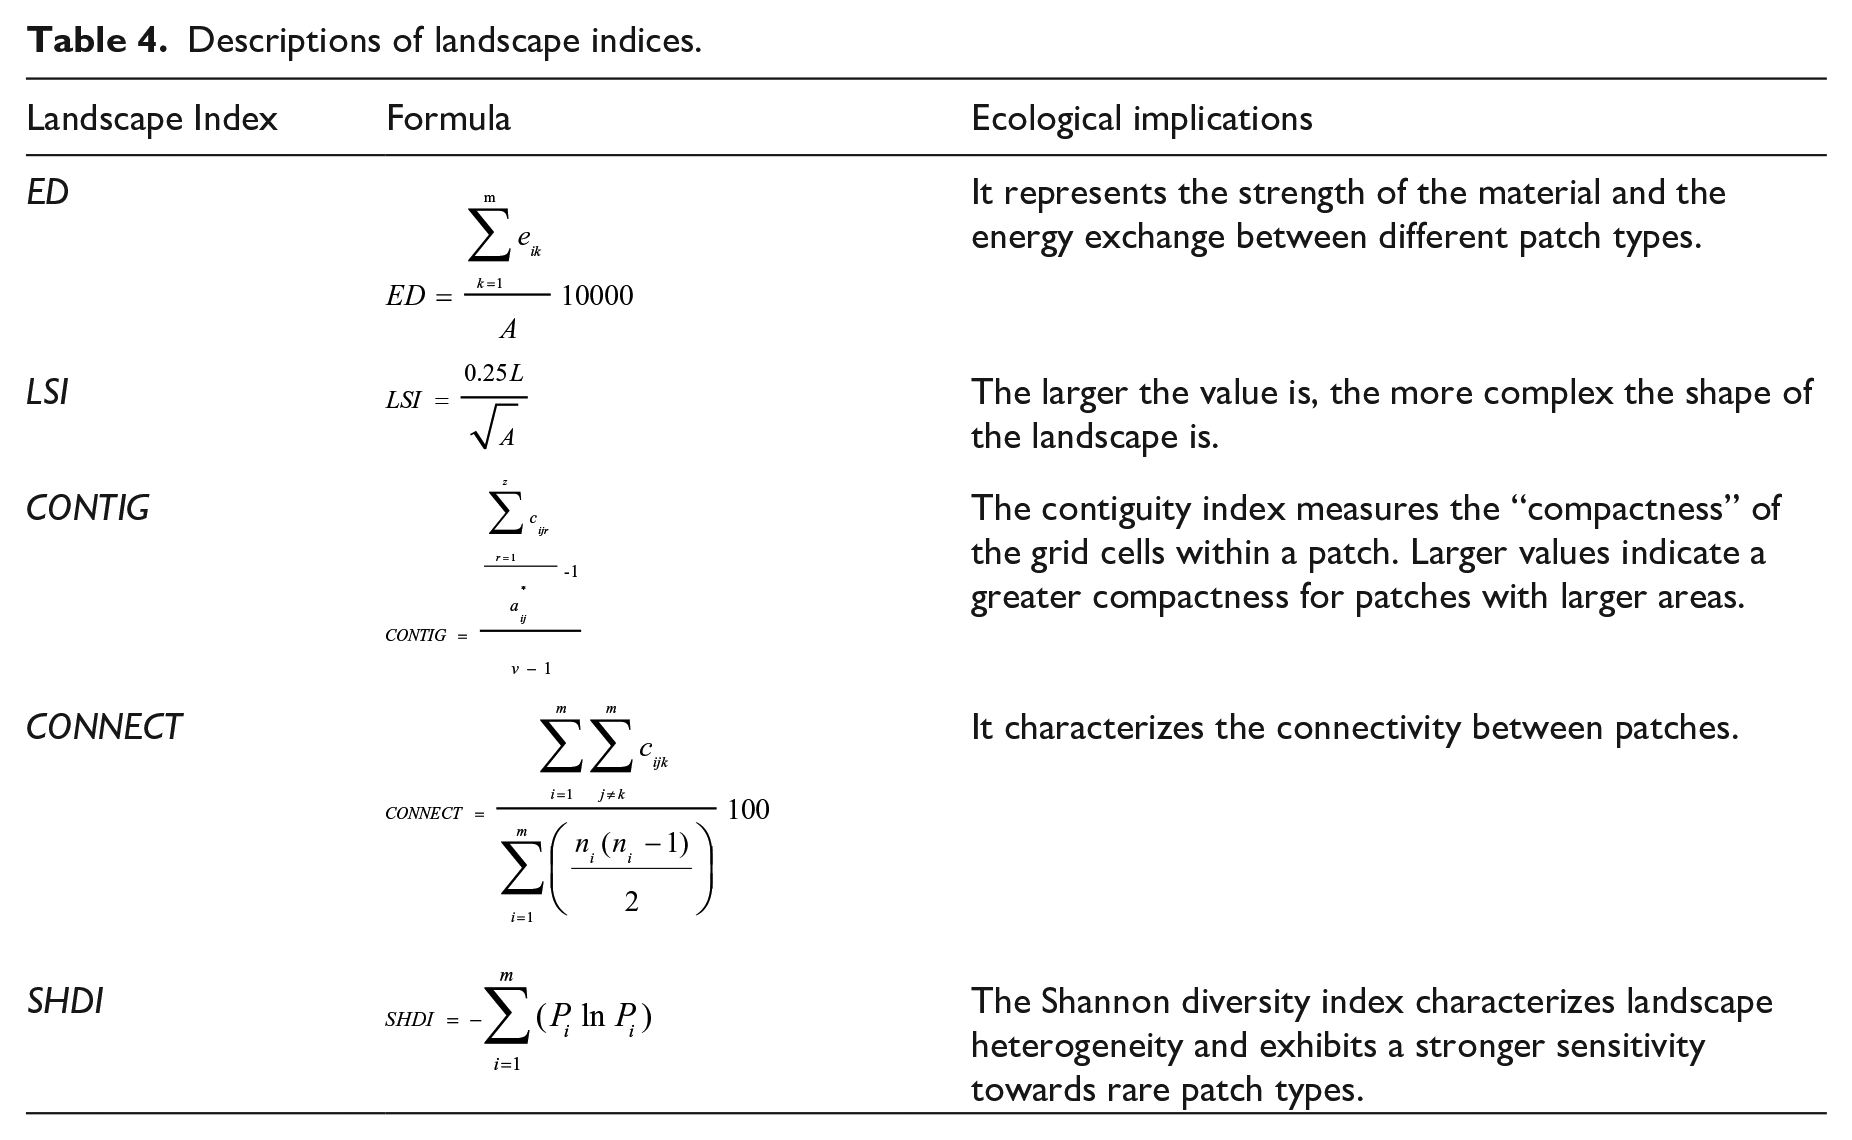
Landscape indices are quantitative measures that condense the essential information about landscape patterns. They provide valuable insights into the composition, spatial arrangement, and certain aspects of the landscape structure, enabling analysis of the heterogeneity and functionality of the landscape (Su and Fu, 2012). In this study, the Fragstats 4.2 software was utilized to quantitatively calculate the various landscape indices. Specifically, the indices commonly used in soil erosion research, including the edge density (ED), landscape shape index (LSI), contiguity index (CONTIG), connectivity index (CONNECT), and Shannon diversity index (SHDI), were selected for analysis (Table 4) (Liu et al., 2011).
Descriptions of landscape indices.
Results
Soil erosion simulation and classification across different landscape utilization types at the scale of peak-cluster depressions
Based on the analysis of imagery of different landscape utilization types, basic data processing was conducted to analyze the soil erosion using the RUSLE model. The results revealed that there were significant variations in the soil erosion moduli of the peak-clustered depression and rural settlement landscapes, with an uneven distribution of low and high values. Across the various landscape types, in this study, the average soil erosion modulus ranged from 11.42 to 61.43 t·hm−2·a−1 (Table 5). These findings are consistent with the results obtained by Qian et al. (2018) by using geomorphological-hydrological analysis in karst depression regions (average erosion modulus of 24.73 t·hm−2·a−1) and those obtained by Zeng (2008) by employing GIS and the RUSLE model to analyze the soil erosion in the Karst Hongfeng Lake Basin (average soil erosion modulus of 40.24 t·hm−2·a−1).
The soil erosion values in the peak-cluster depression and rural settlement landscape sample areas.
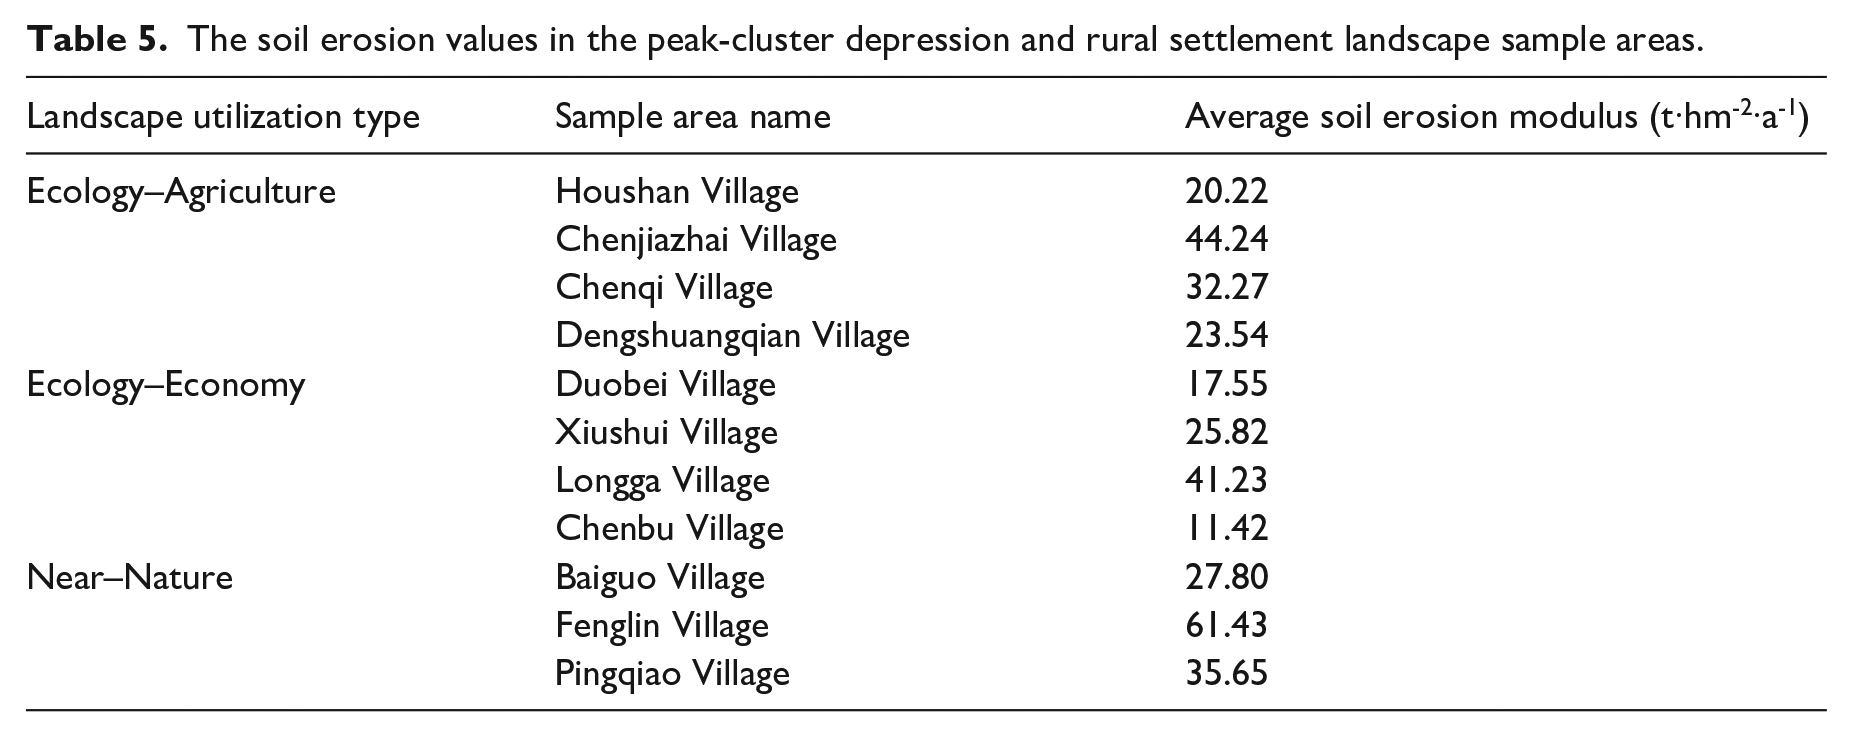
The areas with higher average soil erosion modulus values were characterized by extensive grasslands or unused land on hilltops, with a fragmented land use distribution. For instance, in Fenglin Village, the annual average soil erosion modulus was 61.43 t·hm−2·a−1, which was attributed to the steep slopes and longer slope lengths. Similarly, Chenjiazhai Village had an annual average soil erosion modulus of 44.24 t·hm−2·a−1 due to the prevalence of extensive grasslands and other land types on hilltops, resulting in strong soil erosion. In contrast, the ecology–economy landscape utilization type had a relatively low average soil erosion modulus. Duobei (17.55 t·hm−2·a−1) and Chenbu (11.42 t·hm−2·a−1) contained extensive economic forests on slopes and implemented effective soil and water conservation measures. The distribution of the slope terraces helped mitigate soil erosion.
According to the “Techniques standard for comprehensive control of soil erosion and water loss in karst region” (SL 461-2009), formulated by the Department of Soil and Water Conservation of the Ministry of Water Resources of the People’s Republic of China (2009), the erosion modulus in karst region can be used to classify soil erosion into six levels: slight (<50 t·km−2·a−1), mild (50–300 t·km−2·a−1), moderate (300–1500 t·km−2·a−1), severe (1500–3000 t·km-2·a-1), very severe (3000–6000 t·km-2·a-1), and extremely severe (>6000 t·km−2·a−1). The overall extent of the soil erosion in the peak-cluster depression and rural settlement landscape sample areas was relatively low, with a significant proportion of the area experiencing slight and mild soil erosion. Some areas exhibit severe soil erosion, primarily in the downslope areas of hilltop grassland or other land, which was strongly influenced by the land use distribution and slope gradient in the upslope areas. This result is consistent with the findings of Li (2016) in the Houzhai River Basin, Puding County, where it was concluded that a large portion of the land experienced slight and mild soil erosion.
Regarding the ecology–agriculture landscape utilization type, there was a higher proportion of moderate to mild soil erosion compared to the other two types (Figure 2). The Houshan sample area exhibited fragmented hillside landscapes and widespread sloping farmlands, resulting in more severe soil erosion, with severe and greater soil erosion accounting for 22.61%. However, the terraced cultivated land effectively mitigated soil erosion on slopes. Regarding the ecology–economy landscape utilization type, slight soil erosion prevailed. The Duobei and Chenbu sample areas exhibited favorable overall soil erosion conditions, with slight soil erosion accounting for 63.56% and 54.68%, respectively. These areas cultivated economic crops on slopes and implemented effective soil and water conservation measures to reduce erosion. Regarding the near–nature landscape utilization type, the Baiguo and Pingqiao sample areas exhibited relatively low levels of overall soil erosion. However, the Fenglin sample area exhibited a high proportion of severe, very severe, and extreme soil erosion due to the presence of grasslands or sparse shrubs on hilltops and substantially exposed bedrock, which exacerbated erosion. Despite the higher distribution of forests in the near–nature type, the vegetation density remained relatively low. Hence, it is crucial to implement site-specific measures to enhance the vegetation density and to consider the land use and vegetation coverage patterns on hilltops to optimize future desertification control efforts.
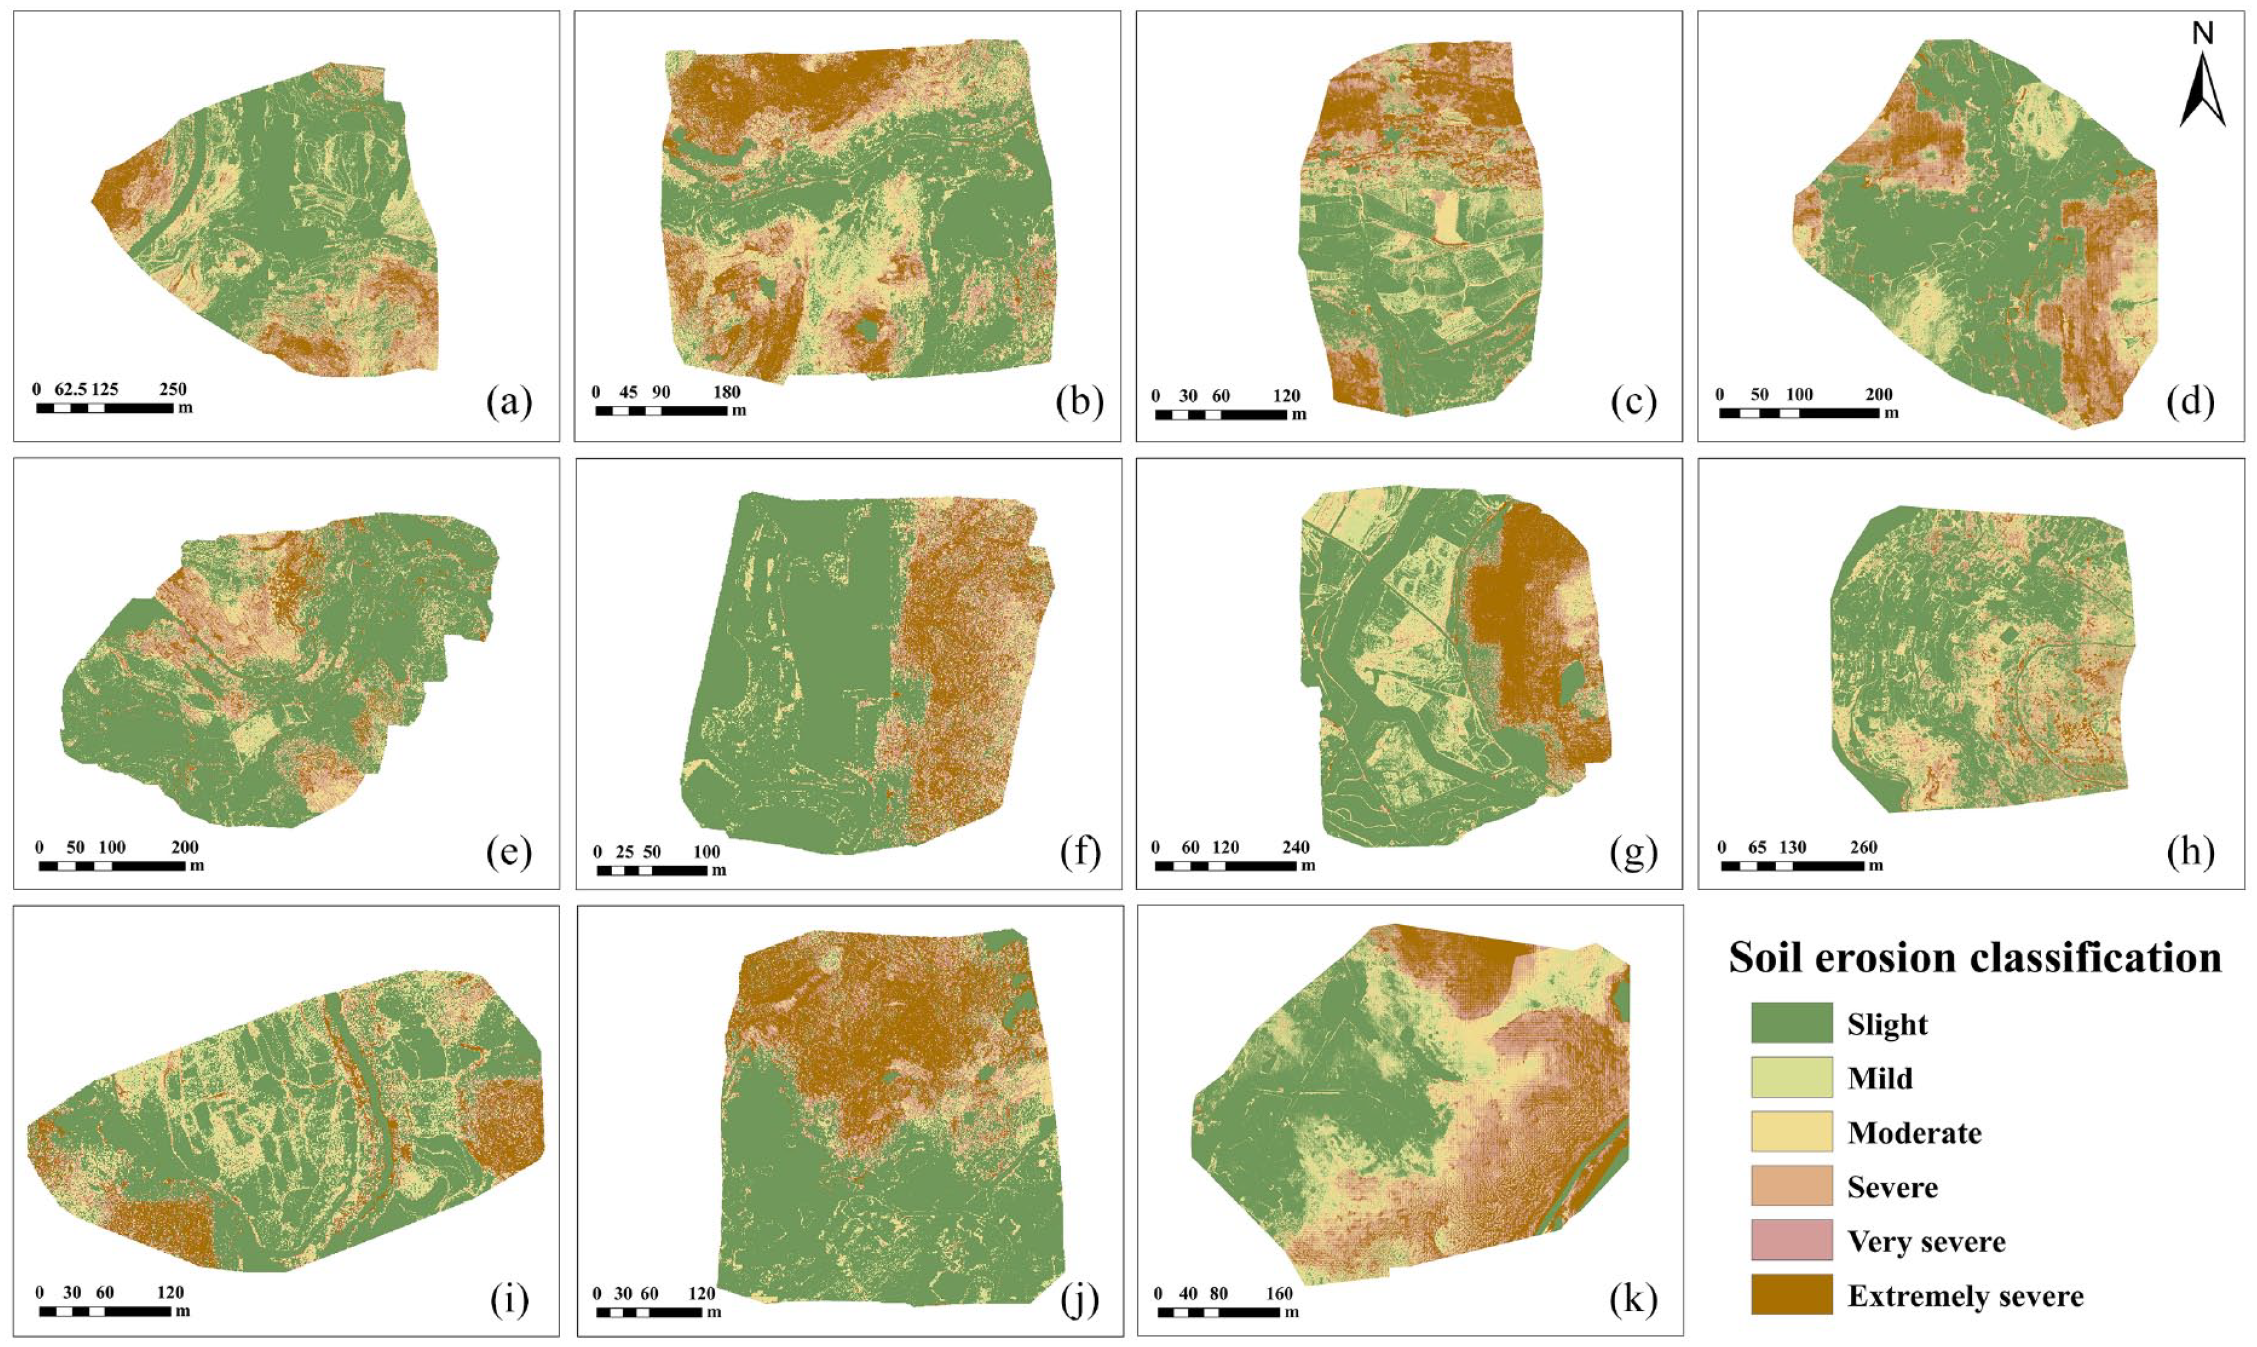
Spatial distribution of soil erosion classification in peak-cluster depression and rural settlement landscape sample areas.
Quantitative attribution and risk analysis of soil erosion at the grid scale
By utilizing the factor detector and interaction detector in the geographic detector, the primary driving factors of soil erosion in the different landscape utilization types and their interactions were analyzed. The findings of this study indicate that elevation within the ecology-agriculture landscape utilization type is a significant driving factor for soil erosion. For the Houshan sample area, land use (0.123) was identified as the primary driver of soil erosion (Figure 3). This observation is believed to be related to the extensive grassland distribution and fragmented landscape on hilltops. For the ecology–economy landscape utilization type, elevation was the dominant factor affecting soil erosion in the Xiushui and Longga sample areas. However, in Duobei and Chenbu, where large-scale economic crops were grown on slopes, vegetation cover emerged as the primary driving factor. For the near–nature landscape utilization type, the dominant factors varied with location. In the Baiguo sample area, the order of the factors was as follows: vegetation cover (0.116) > slope (0.089) > elevation (0.080) > land use (0.067). In Fenglin Village, vegetation cover (0.244) was the primary factor, followed by elevation (0.174), with a stronger impact due to higher elevations. In Pingqiao, the order was as follows: land use (0.279) > elevation (0.251) > vegetation cover (0.204) > slope (0.203). The occurrence of exposed bedrock on slopes worsened the soil erosion in Pingqiao, along with fragmented land use patterns.
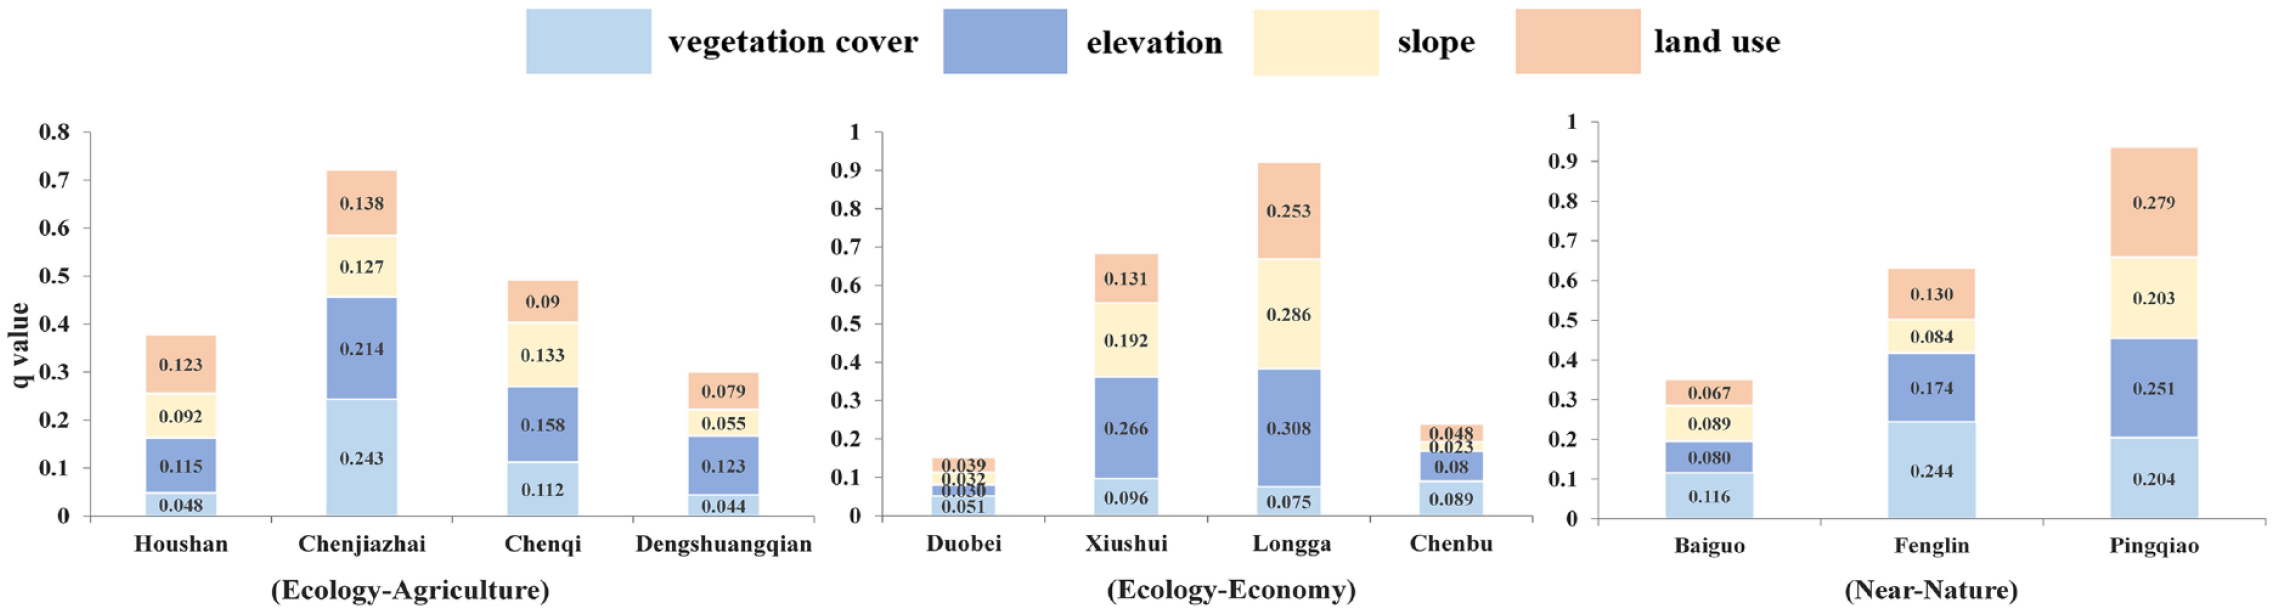
The q values of the influencing factors in the peak-cluster depression and rural settlement landscape sample areas.
In this study, we analyzed the pairwise interaction effects among the influencing factors and found that they enhanced the explanatory power in all of the landscape types. Two types of enhancements were observed: nonlinear enhancement and bivariate enhancement. Among various landscape utilization types, the synergistic effect of vegetation coverage and land use ranked as the primary explanatory factor for most sample areas. This phenomenon indicated variations in the soil erosion rates between different land use types with varying vegetation covers or similar land use types with different vegetation cover. Comparative analysis revealed that the combination of vegetation cover and a specific factor constituted the dominant interaction pattern in most sites. This highlights the significant role of vegetation in controlling soil loss, which is consistent with the results of Xiong et al. (2012) in karst rocky desertification areas.
The risk detector can identify high-risk areas of soil erosion by detecting the spatial distribution characteristics and considering the various influencing factors. In this study, the vegetation cover, elevation, and slope in the different landscape utilization patterns were categorized into nine groups using the natural break method, representing low to high values. In the ecology–agriculture landscape utilization type, the Houshan, Chenqi, and Dengshuangqian sample areas exhibited a high soil erosion risk in areas with vegetation cover values of 0.3–0.5. Further analysis revealed that these areas were mainly located at the intersections of different landscape patches in these three areas. In the ecology–economy landscape utilization type, the Xiushui and Longga sample areas exhibited a turning point in the relationship between vegetation cover and soil erosion (Figure 4). In the near–nature landscape utilization type, the risk of soil erosion decreased with increasing vegetation cover. The Baiguo, Dengshuangqian, and Xiushui areas exhibited a threshold value for slope and soil erosion. Above this threshold, the soil erosion decreased as the vegetation cover increased, while below this threshold, the soil erosion increased with increasing vegetation cover. The critical slope ranges were 32–39° in Baiguo, 28–33° in Dengshuangqian, and 26–30° in Xiushui. Comprehensive analysis revealed that within these slope ranges, cultivated land and other land were present, and the steep slopes aggravated the soil erosion. When the slope exceeded this range, an increase in vegetation cover effectively stabilized the soil, reducing erosion.
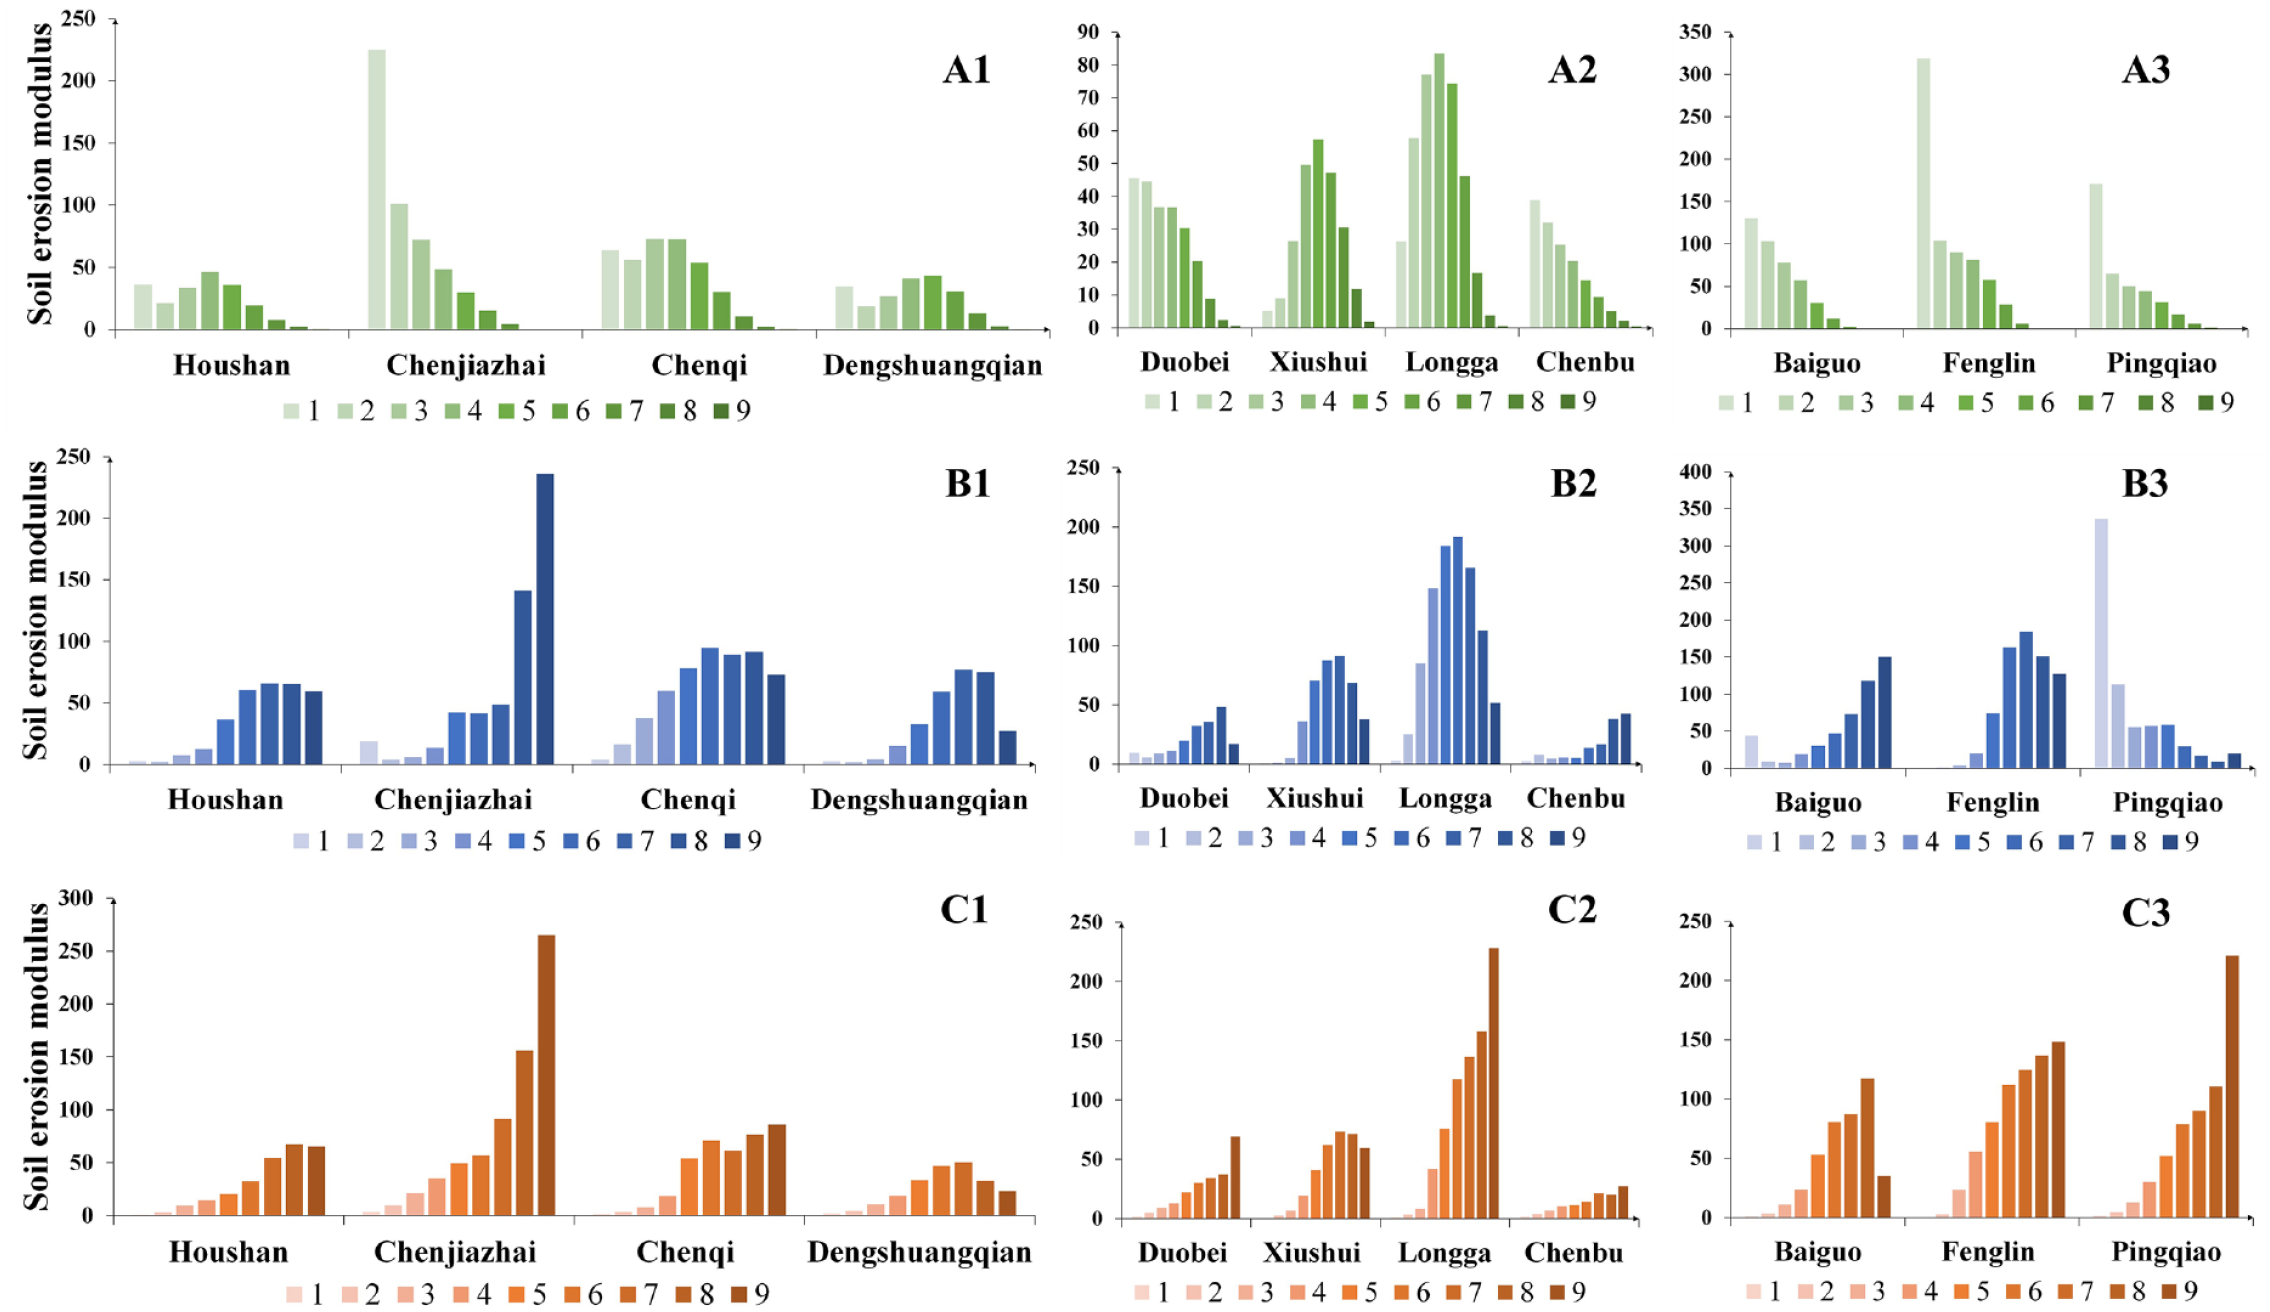
Risk trends of factors influencing soil erosion for each landscape utilization type.
Soil erosion analysis using location-weighted landscape index and Fragstats landscape index at the patch scale
Analyzing the relationship between landscape spatial patterns and soil erosion is crucial for regional soil loss assessment and subsequent ecological management. The findings show that except for Duobei and Xiushui in the ecology–economy landscape utilization type, the source areas of the soil erosion were generally larger than the sink areas in the other landscape utilization types, indicating an overall pattern that was unfavorable for mitigating soil erosion. Moreover, we integrated topographic factors such as elevation and slope to analyze the landscape pattern of soil erosion. The LWLI effectively characterizes the soil erosion status by considering the land use, relative elevation, relative distance, and slope. Among the sample areas in the ecology–agriculture landscape utilization type, Chenjiazhai exhibited the highest LWLI value (0.53) among the four areas, while all of the sample areas in the near–nature landscape utilization type had LWLI values of greater than 0.4, and Fenglin had the highest value (0.45) (Figure 5a).
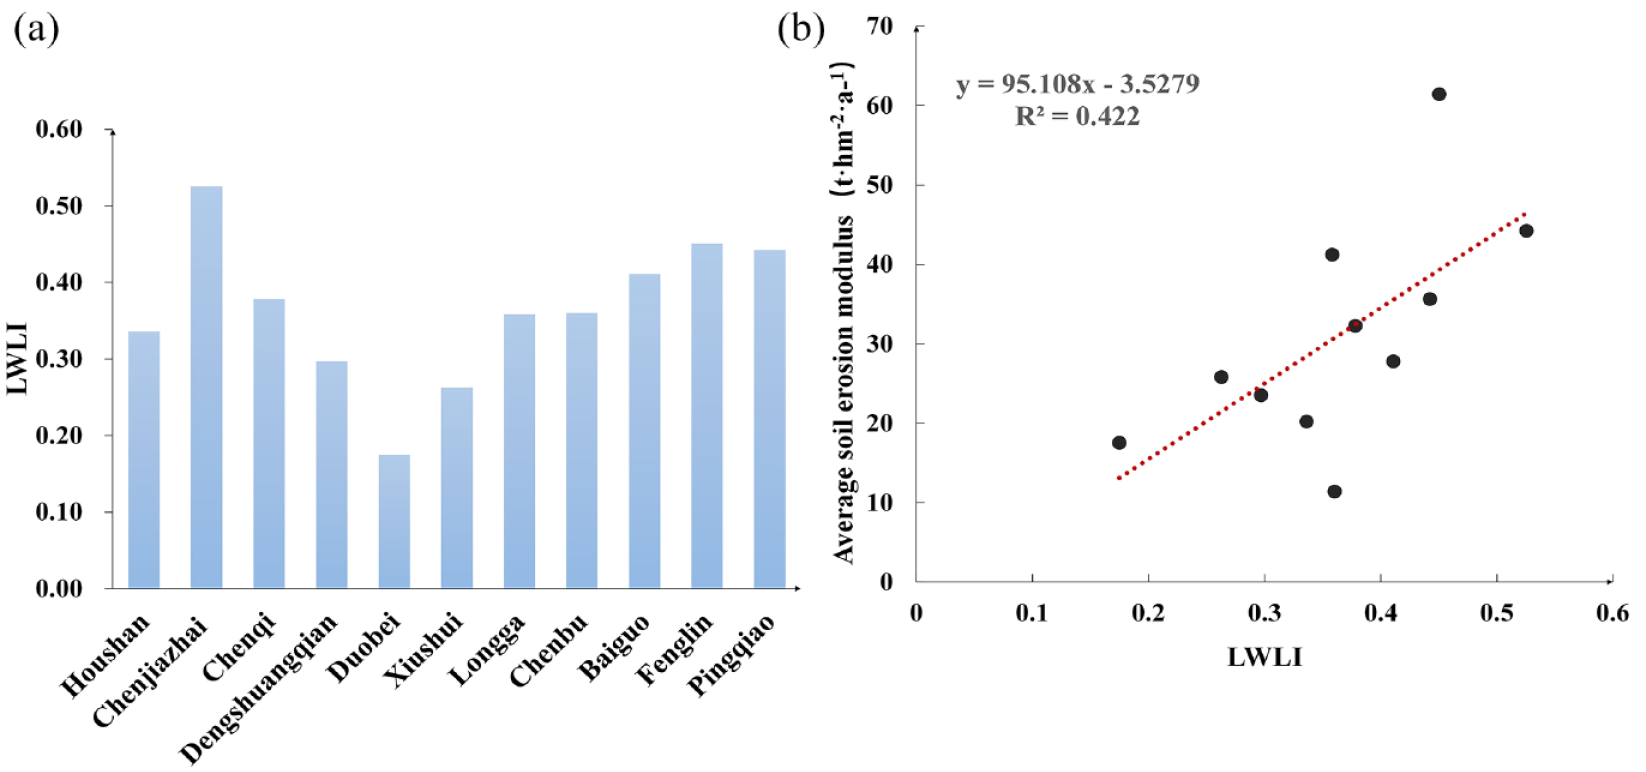
LWLI in each landscape sample area. (a) Trend of LWLI. (b) Correlation between LWLI and average soil erosion modulus.
By incorporating slope analysis, the relative height, relative distance, and distribution pattern of the source-sink landscapes, it was observed that when situated at the top or upper part of slopes, landscapes with strong erosional source functions, often lead to severe soil erosion. Conversely, when located at the lower part of slopes, landscapes with strong sink functions effectively retained the soil eroded from uphill areas. In subsequent research and ecological restoration, strategic regional landscape planning and optimization of the source-sink landscape pattern are necessary to mitigate soil loss. Within the ecology–economy landscape utilization type, the LWLI values of the various sample areas were relatively low, indicating a weak promoting effect of the soil erosion source landscapes on the corresponding erosion and an overall low soil erosion risk. Notably, the Duobei site had the lowest LWLI index (0.17). Spatially, the source and sink landscapes in Duobei were intertwined, with the sink landscapes mainly bordering the source landscape distribution, effectively intercepting and retaining the soil eroded from the uphill areas. Additionally, the diverse composition of the sink landscape in Duobei, including terraced gardens distributed along the slopes, mitigated the impact of the slope on soil erosion. Correlation analysis between the landscape load ratio index and the average soil erosion in the study area revealed that there was a certain correlation (R2 = 0.422, P < 0.01), indicating the effectiveness of the regional landscape load ratio index in assessing the soil erosion conditions (Figure 5b). Moreover, a positive correlation existed between soil erosion and LWLI, with higher LWLI values indicating increased average soil erosion, suggesting that the distribution pattern of the source-sink landscapes influences the soil erosion intensity.
In the study, Fragstats-based metrics including the ED, SHDI, CONTIG, CONNECT, and LSI were selected to comprehensively analyze the internal landscape pattern of the soil erosion sources and sinks. The ED values of the source landscapes were generally higher than those of the sink landscapes in the study area. Fragmented source landscapes and aggregated sink landscapes indicated a lower risk of soil erosion. Specifically, Houshan and Dengshuangqian exhibited high levels of fragmentation in the source landscapes and low ED values in the sink landscapes (Figure 6). The results revealed that the distribution of the fragmented sources and aggregated sinks contributed to a reduction in soil erosion. The SHDI reflects the landscape heterogeneity, with higher values indicating greater diversity of land use types and increased landscape fragmentation. In most of the sample areas, the SHDI values of the source landscapes were higher than those of the sink landscapes, indicating higher levels of fragmentation in the source patches, which is consistent with the observed trend of the ED values. The source landscapes with higher patch contiguity and better landscape connectivity contributed to the increase in soil erosion. Further analysis revealed that greater patch contiguity and connectivity between soil erosion sources and sinks led to a higher average soil erosion modulus. Moreover, a distribution pattern with highly connected sinks and dispersed sources effectively mitigated soil loss. Regarding the soil erosion sources and sinks, the higher LSI values in the source landscapes and lower values in the sink landscapes indicate a lower risk of soil erosion. When the source and sink areas had high LSI values, their corresponding average soil erosion moduli were also high, and vice versa. These results are consistent with Luo et al.’s (2021) findings, that is, a positive correlation between the landscape shape index changes and soil erosion in small watersheds. At the individual site level, when the LSI value of the soil erosion sink was lower than that of the soil erosion source, the soil erosion tended to be weaker.
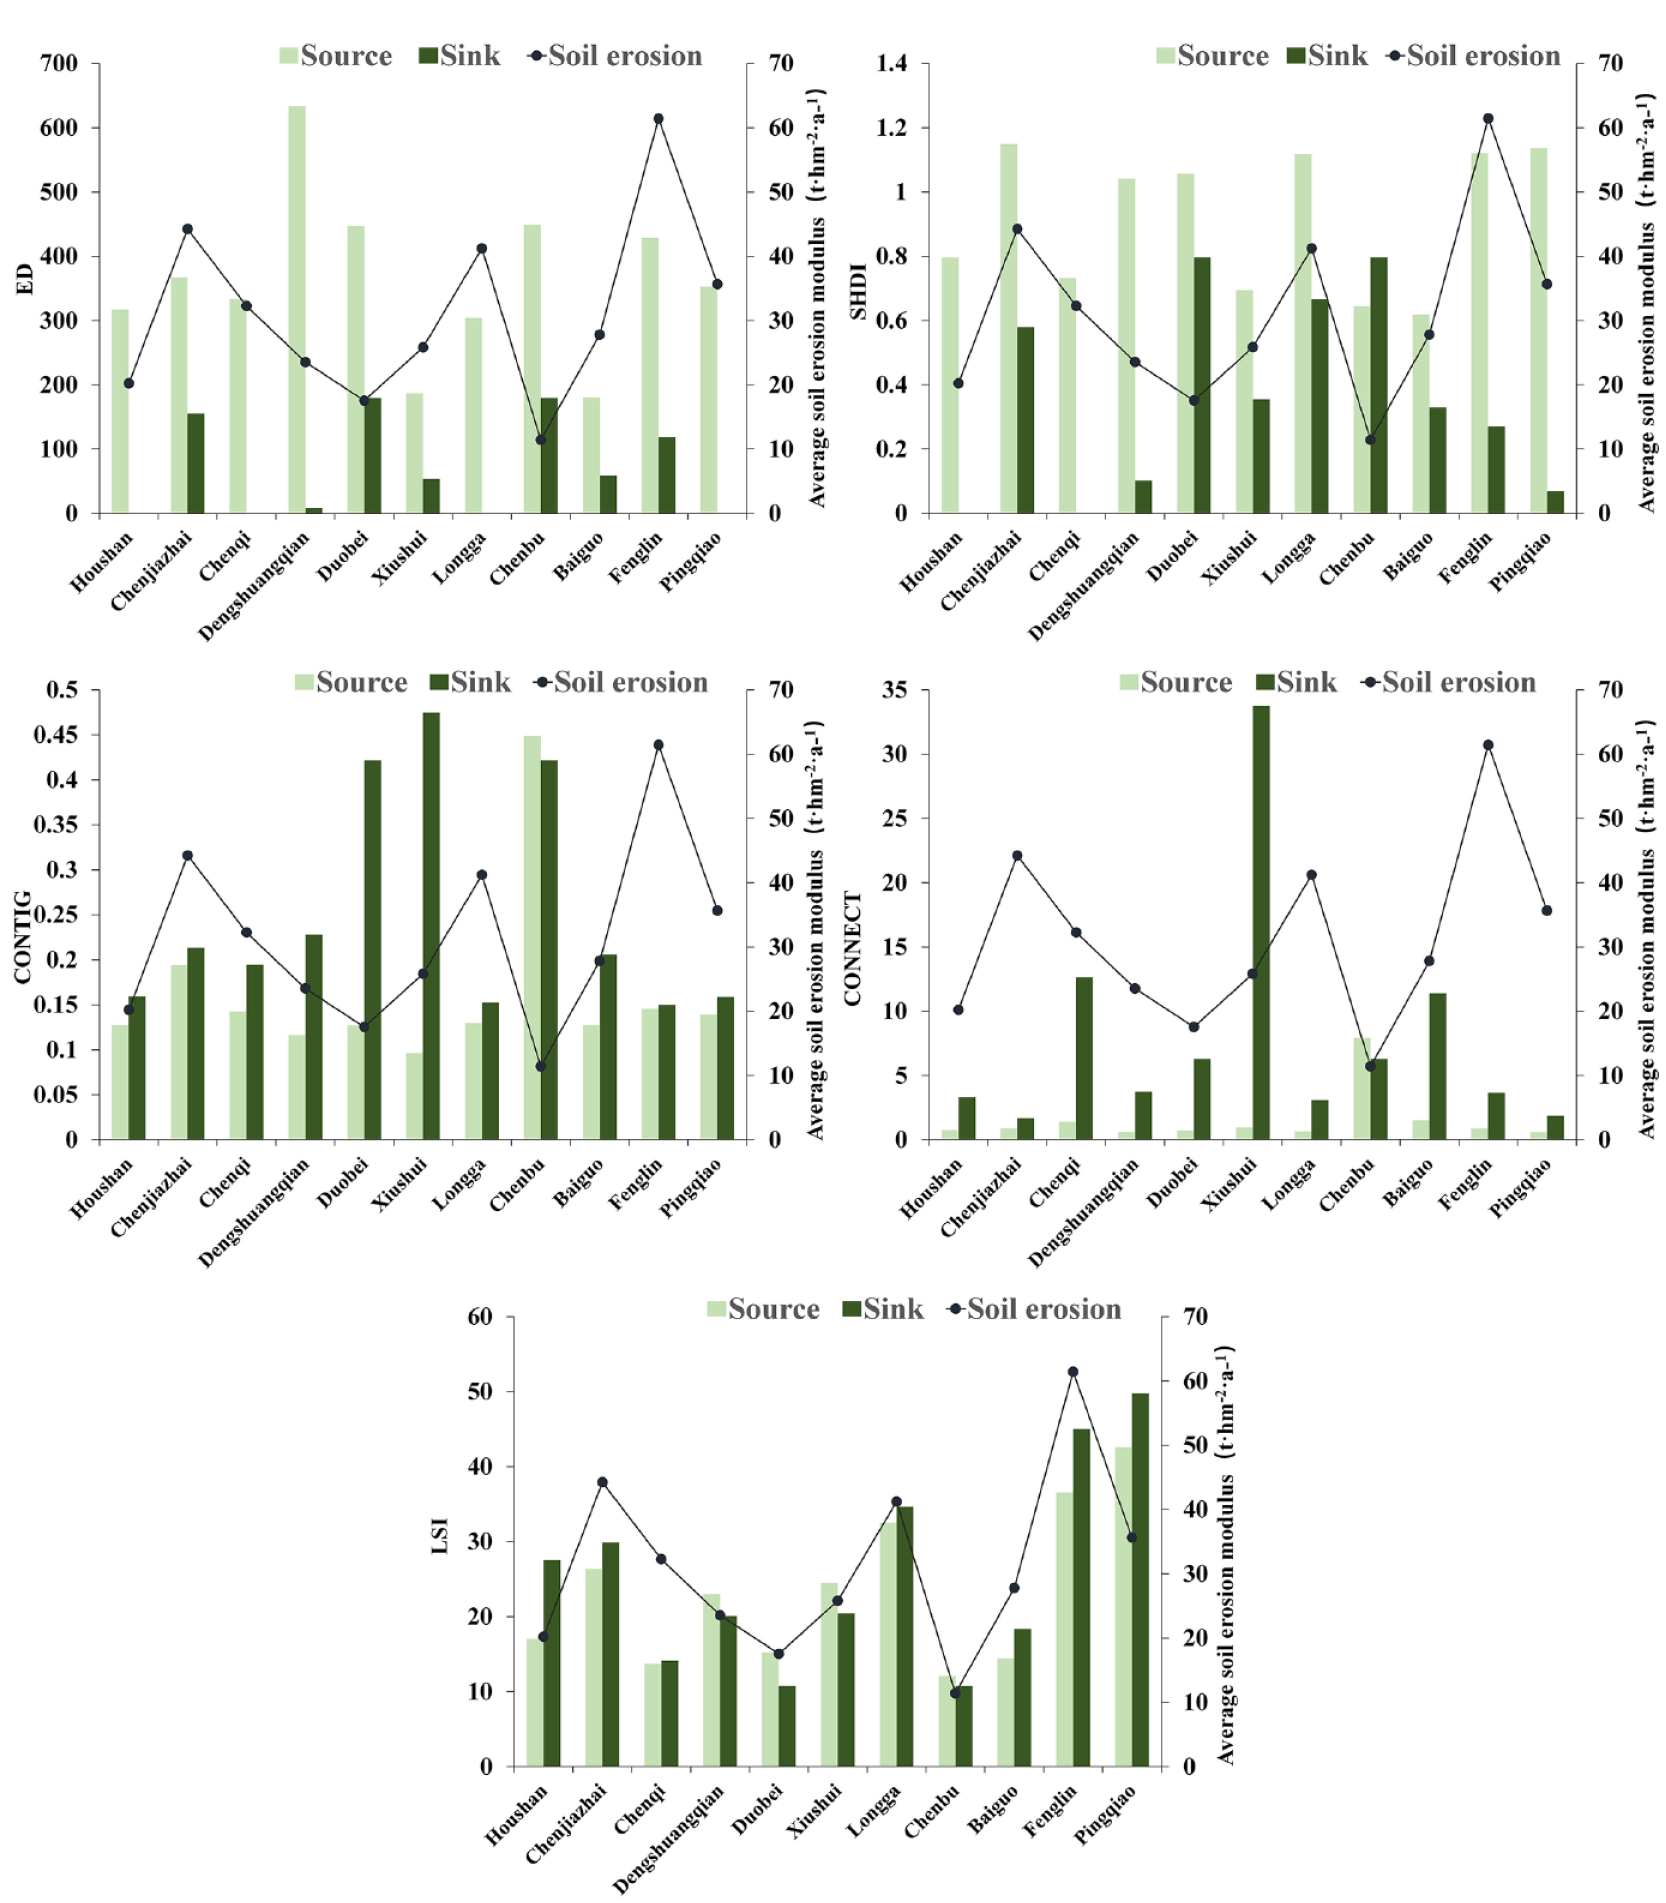
Characteristics of soil erosion source-sink landscape index in the landscape sample areas.
We studied the relationships between the soil erosion intensity and landscape indices across the different landscape utilization types with varying levels of soil erosion (Figure 7). Our findings indicate that landscape fragmentation was greater in the slight soil erosion zone, as evidenced by higher values of ED and SHDI compared to other erosion levels. On the other hand, moderate and severe erosion zones showed lower landscape fragmentation and better patch integrity, which aligns with the overall lower degree of soil erosion in the study area. The CONTIG index, representing patch compactness, did not exhibit significant differences across different soil erosion levels. However, connectivity analysis revealed that connectivity between patches was higher in extremely severe erosion zones, followed by slight erosion zones, while it was lower in mild and moderate zones, as indicated by CONNECT values. Additionally, the LSI indicated that mild and moderate erosion zones experienced a higher level of disturbance on patches, making them more susceptible to human activities. Comparatively, the Chenjiazhai sample demonstrated better patch compactness and connectivity overall. However, the landscape was fragmented and significantly impacted by human activity, resulting in a higher average soil erosion degree. These findings highlight the comprehensive influence of multiple factors on the impact of patch-scale landscape patterns on soil erosion.
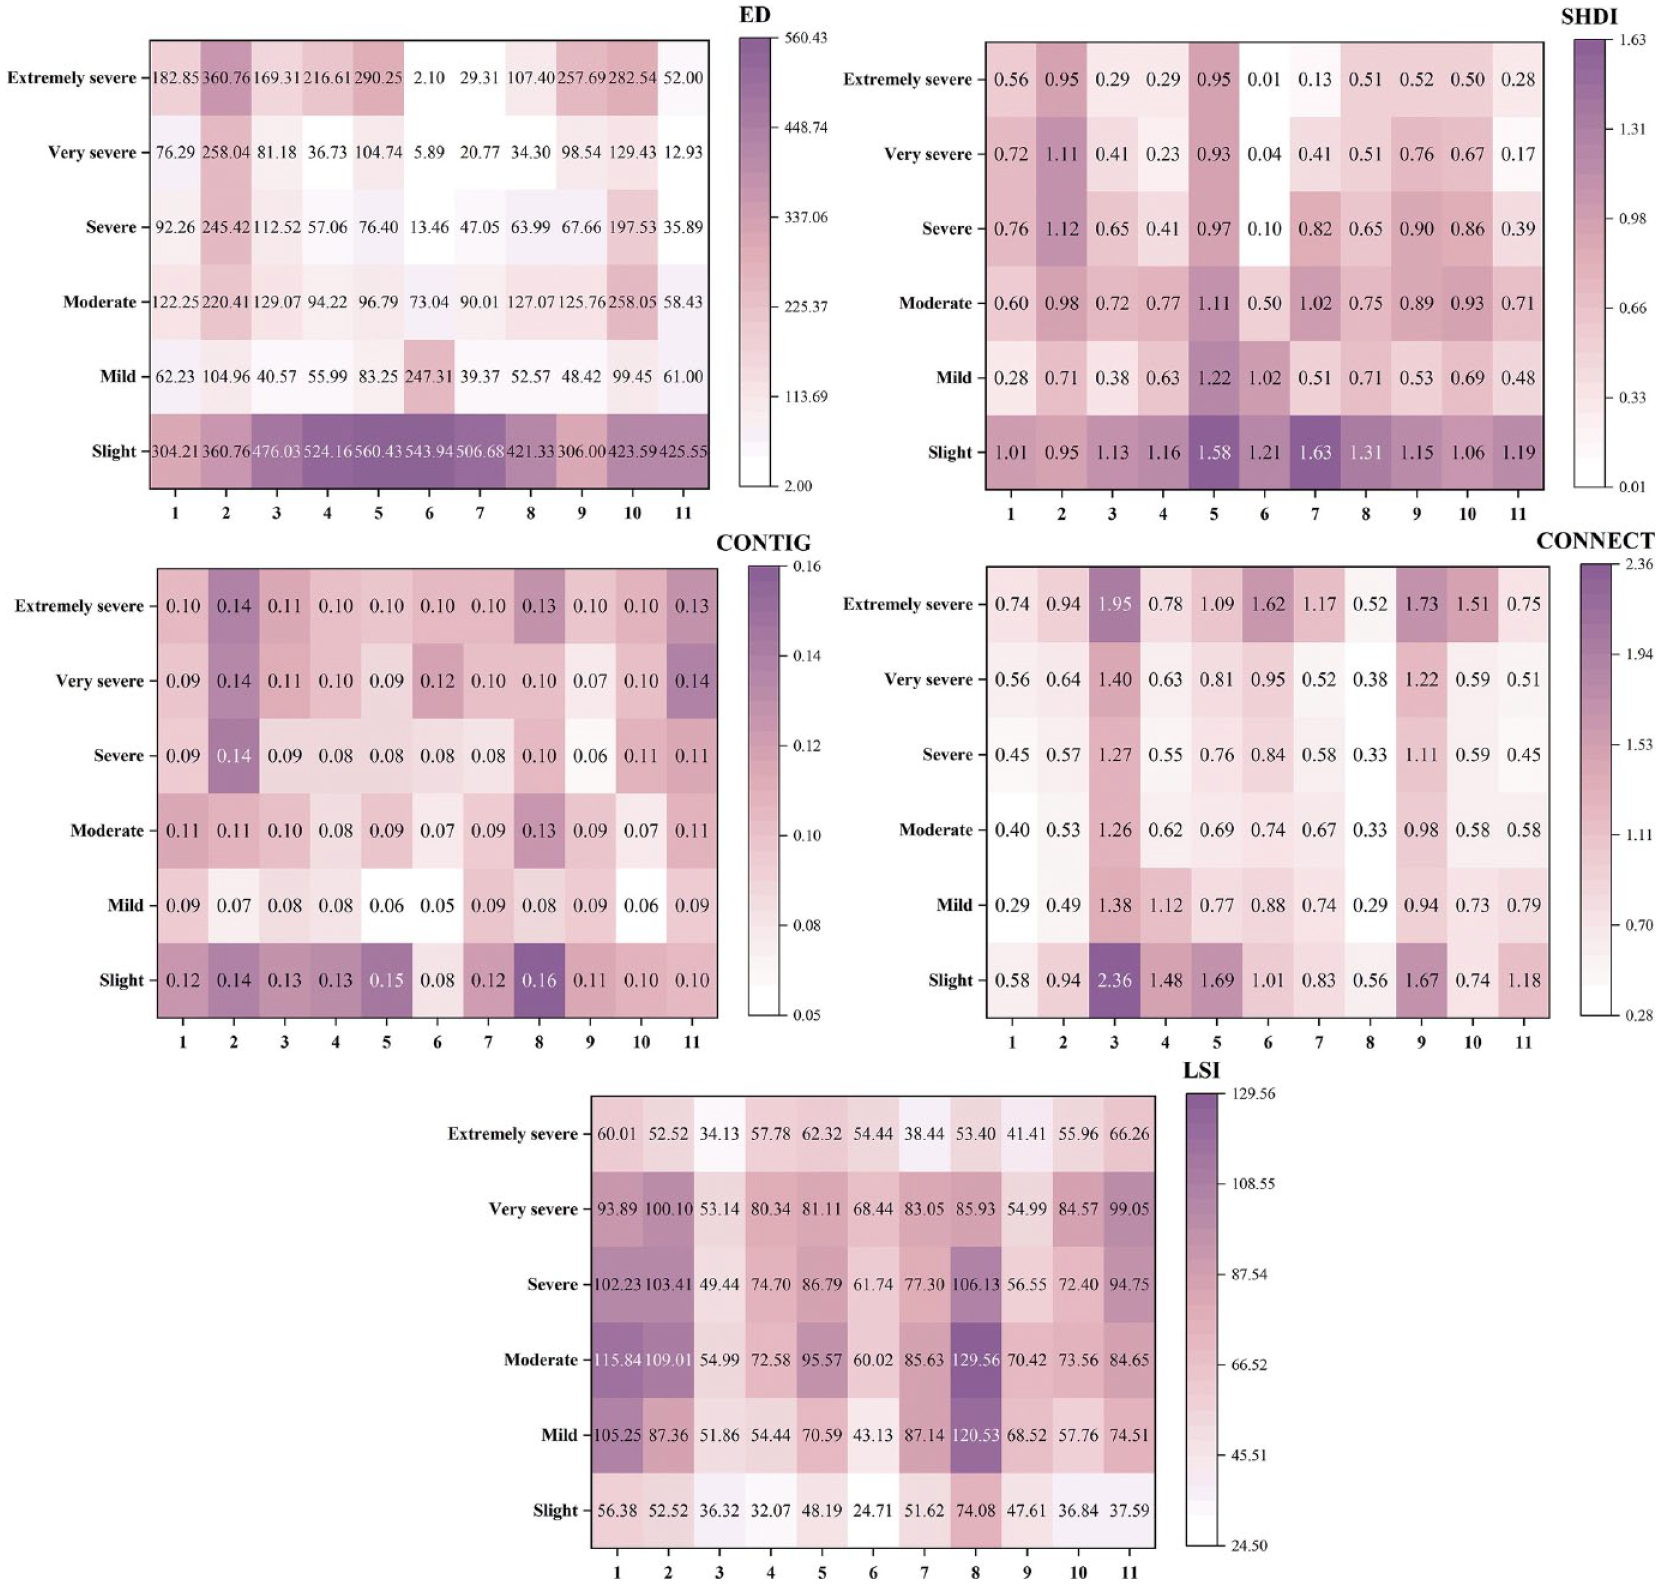
Landscape index of different soil erosion grades at landscape sample areas.
Discussion
Assessing soil erosion and its driving factors at the scale of peak-cluster depression and rural settlement landscape using UAV data
Soil conservation plays a pivotal role in terrestrial ecosystems by providing essential ecosystem regulation services (Fu et al., 2012) and by addressing the global environmental challenges associated with soil erosion (Borrelli et al., 2017). The peak-cluster depression and rural settlement landscapes are anchored at the scale of the peak-cluster depressions and effectively combine natural and human elements. They are situated in a typical ecologically vulnerable area with severe soil erosion and intense human-land conflicts. Therefore, considering the peak-cluster depression and rural settlement landscape as the fundamental research unit, in this study, we captured the fine-scale characteristics of karst soil erosion and effectively assessed the impacts of different land use practices on karst soil erosion. This method provides a comprehensive understanding of the soil erosion dynamics in karst regions, offering valuable insights for designing sustainable land management strategies.
In recent years, rapid advancements in UAV technology, coupled with the integration of professional high-definition cameras, have greatly enhanced its applicability in various research disciplines. UAV technology has been successfully employed in soil erosion monitoring studies, and Sebastian et al. (2012) were among the pioneers in utilizing UAVs to create high-precision DTMs and orthoimages to achieve superior monitoring outcomes. Furthermore, Alexiou et al. (2023) demonstrated the utility of high-resolution UAV imagery in measuring sediment deposition in a typical Mediterranean watershed. The high level of detail and spatial resolution offered by UAV imagery enable the identification and characterization of fine-scale landscape features related to soil erosion, leading to more accurate assessments of the soil erosion distribution and patterns compared to traditional methods such as satellite imagery and ground-based surveys. Consequently, we utilized UAV data to facilitate the precise assessment of small-scale soil erosion and its primary driving factors, thus bridging the gap in the fine-scale simulation capabilities that traditional satellite remote sensing monitoring techniques lack in karst regions.
Identifying the interaction mechanisms between landscape pattern and soil erosion at multi-scales in karst regions
Human activities have significantly altered landscape patterns, leading to spatial and temporal variations in soil erosion. The impacts of different land use practices on soil erosion vary due to factors such as soil properties (Wei et al., 2018) and vegetation cover (Vijith et al., 2018). Optimizing the spatial arrangement of landscapes can reduce sediment output and intercept soil loss (Boer and Puigdefábregas, 2005). This study investigates the driving forces of landscape patterns on soil erosion by subdividing landscape utilization types into ecology–agriculture, ecology–economy, and near–nature categories, and applying multi-scales landscape analysis.
Scale refers to the representation of geographic phenomena and processes in terms of time and space. Investigating the relationship between soil erosion and landscape patterns at different scales is beneficial for a comprehensive understanding of the driving mechanisms behind soil erosion. At the peak-cluster depression scale, this study examines soil erosion characteristics and differences across landscape utilization types to explore the impacts of development models on regional soil and water loss. Results show that sustainable ecology–economy and near-nature types are more effective at reducing soil erosion than traditional agricultural landscapes. At the grid scale, intrinsic mechanisms and driving factors of soil erosion were analyzed, demonstrating the synergistic effects of vegetation coverage and land use in explaining soil erosion. Moving to the patch scale, an assessment of landscape structure distribution reveals complex interactions between soil erosion and landscape structures, leading to identification of effective patterns for reducing soil erosion.
Identifying and characterizing the mutual mechanisms between soil erosion and landscape patterns under different landscape utilization types enables the implementation of targeted conservation and management strategies. In the subsequent ecological restoration, it is imperative to prioritize the distribution patterns of land use and vegetation to mitigate the fragmentation of soil erosion sources. The adoption of terracing and vegetative buffers in ecology–agriculture areas can help mitigate soil erosion. In ecology–economy areas, the combination of green infrastructure and the planting of cash crops on terraces can reduce surface runoff and erosion. Protecting and restoring natural ecosystems can enhance soil erosion sinks, preserve ecological integrity, and mitigate soil erosion risks.
Limitations and prospects
A simulation analysis was conducted to examine the landscape pattern of small-scale soil erosion in karst regions, focusing on identifying the driving factors and pattern responses at both the grid and patch scales. However, extreme values were observed in certain locations during the process of selecting the sample areas due to geographical variations and disparities in the spatial layout. The analysis showed a moderate correlation between soil erosion and LWLI (R2 = 0.422), which may be attributed to neglecting the influence of patch positions, water and wind processes during soil erosion source-sink selection. To ensure more representative results, future studies should consider increasing the number of sample areas consider wind and water processes, and relative patch positions during soil erosion source-sink selection, in order to compare and analyze the findings with existing conclusions. While exploring the internal landscape pattern of soil erosion sources and sinks, it is important to acknowledge the limited attention devoted to identifying the landscape pattern between sources and sinks. Subsequent studies could incorporate landscape pattern indices that integrate the soil erosion process, such as the directional leakage index (DLI) for directional permeability, and could analyze their correlation with the soil erosion modulus based on RUSLE analysis. This would enhance our understanding of the effects of soil erosion changes on the landscape pattern between sources and sinks.
Conclusions
The karst region in southwestern China serves as a crucial ecological security barrier in the southwest. In this study, we focused on 11 small-scale landscapes comprised of peak-cluster depressions and rural settlements landscapes, which were categorized into three types: ecology–agriculture, ecology–economy, and near–nature. By utilizing high-precision UVA data and integrating a modified RUSLE model, geographic detector, and landscape indices, the driving factors and pattern responses of soil erosion were analyzed. The key findings of this study are listed below.
The soil erosion modulus significantly varied across the different sample areas of the peak-cluster depression and rural settlement landscapes, with an uneven distribution. Landscapes with extensive grasslands or unused land at the top of slopes, such as dense forests, had higher average soil erosion modulus values. The synergistic effects of vegetation cover and land use significantly contributed to explaining soil erosion. The ecology-agriculture landscape utilization type had a higher proportion of mild to moderate soil erosion, while the ecology-economy landscape utilization type was predominantly characterized by slight soil erosion. Most sample areas exhibited a positive correlation between slope angle and soil erosion risk, and the inflection points generally occurred between 25° and 35°. Increasing vegetation cover led to a decrease in soil erosion risk in the near-nature landscape utilization type.
Additionally, the optimal landscape pattern for reducing soil erosion was identified. The findings revealed that a mosaic distribution pattern of soil erosion sources and sinks effectively mitigates soil erosion. A fragmented source and aggregated sink distribution pattern contribute to erosion reduction. Overall, the ecology–economy landscape type has lower erosion levels and a more balanced landscape pattern. The ecology–agriculture landscape utilization type exhibits more severe soil erosion and is characterized by fragmented patches and high landscape heterogeneity. Subsequent efforts should focus on strengthening ecological management of the ecology–agriculture landscape type. The planting of trees on hilltops can help reduce erosion on slopes. Therefore, it is necessary to further alleviate the extensive distribution of grasslands and other land in the upland areas of peak-cluster depression landscapes.
Footnotes
Declaration of conflicting interests
The author(s) declared no potential conflicts of interest with respect to the research, authorship, and/or publication of this article.
Funding
The author(s) disclosed receipt of the following financial support for the research, authorship, and/or publication of this article: This work was supported by the National Natural Science Foundation of China [grant number 42071288]; the Programme of Kezhen-Bingwei Excellent Young Scientists of the Institute of Geographic Sciences and Natural Resources Research, Chinese Academy of Sciences [grant number 2020RC002].