
Abstract
Pandemics have profound global health impacts, significantly reshaping social interactions and behaviors, including heightened awareness and anxiety, reduced mobility, and implementing policies like lockdowns and social distancing during outbreaks. Meanwhile, effective social and behavioral responses can be rapidly deployed to mitigate pandemics. Understanding the spatiotemporal disparities of social-behavioral dynamics and their short- and long-term interactions with pandemic progression is crucial for designing effective responses. However, deciphering these dynamics and their complex interactions remains challenging. This research leverages social media data, mobility metrics captured by smartphones, and web-harvested policy evaluations to develop a comprehensive framework for quantifying social-behavioral dynamics during pandemics across geographic and temporal dimensions. Using COVID-19 as a case study, the research focuses on the ten most populous U.S. cities during 2020–2021. The objectives are: (1) to analyze diverse geospatial big data to construct indexes that capture social-behavioral dynamics, (2) to uncover geographic and temporal disparities in these dynamics among the ten cities, and (3) to examine the relationships and lag effects between social-behavioral changes and health outcomes throughout the two years. This work underscores the potential of multi-sourced big data and advanced computing methods to inform public health decision-making and enhance preparedness for future pandemics.
Introduction
Pandemics like COVID-19 have caused profound global health crises, altering the way people live, work, and interact. Figure 1 illustrates the effects of COVID-19 and its variants on health and social-behavioral dynamics and highlights potential interventions that can help contain their spreads. Beyond the immediate health threats posed by the virus, pandemic outbreaks could trigger significant social-behavioral dynamics and responses (red lines in Figure 1), including increased public awareness and anxiety, reduced mobility, the implementation of policies such as lockdowns and social distancing, and the development and distribution of vaccines (Lin et al., 2024a). These dynamics not only reflect societal and governmental responses to pandemics but also play a pivotal role in shaping the spread of infectious diseases and the effectiveness of mitigation strategies.
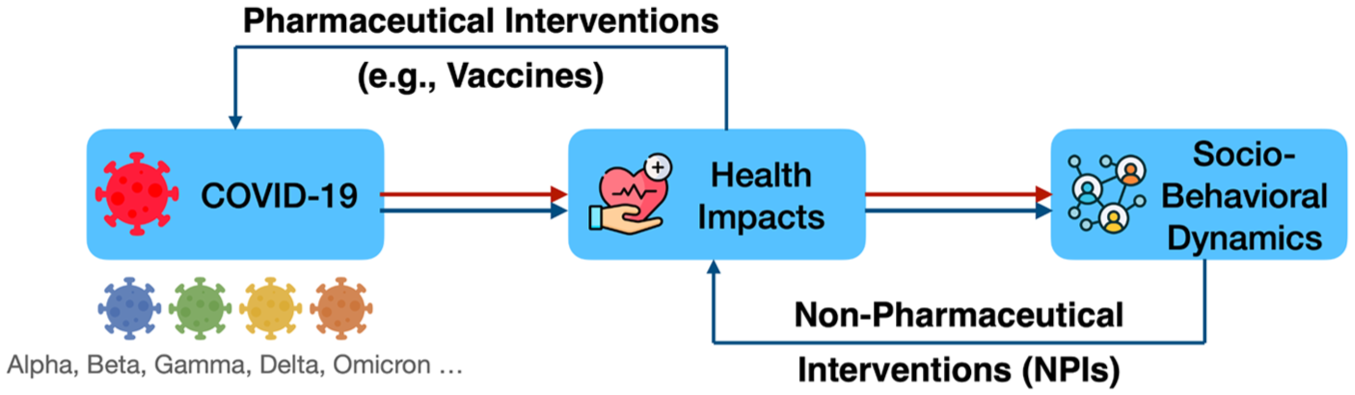
Roles of pharmaceutical and non-pharmaceutical interventions in human-pandemic interactions.
At the core of these responses are two primary approaches to containing pandemics: pharmaceutical interventions (PIs) and non-pharmaceutical interventions (NPIs) (blue lines in Figure 1). PIs, such as vaccines, are effective in reducing infection rates and preventing severe outcomes directly. However, the development of new vaccines requires considerable time and resources, leaving populations vulnerable during the early stages of outbreaks when vaccines are not available. For example, the first COVID-19 vaccine was introduced in December 2020, nine months after the pandemic was officially declared. Meanwhile, vaccine effectiveness can diminish as the virus evolves into new variants. COVID-19 variants, e.g., Omicron, have emerged throughout the pandemic, some of which have demonstrated the ability to partially evade the immunity conferred by vaccines or previous infections (Rubin, 2021). In contrast, NPIs, which are closely linked to social-behavioral dynamics, are often deployed rapidly in response to pandemics. These measures, including social distancing, travel restrictions, and lockdowns, rely heavily on public awareness, emotional responses, and compliance with policies, serving as critical tools to curb the spread of disease during early stages of a pandemic.
However, measuring social-behavioral dynamics presents substantial challenges. In this paper, we use ‘social-behavioral dynamics’ as an umbrella term to describe social dynamics and behavioral patterns, as well as their interactions, including risk awareness, sentiment, mobility, and related governmental responses and policies that can be inferred from geospatial data sources. Traditional data sources often fail to capture the complexity and variability of human behaviors across space and time during health crises. The rise of geospatial big data offers new opportunities to overcome these challenges (Lin et al., 2024b; Qiang et al., 2023; Zou et al., 2023). Social media platforms, for example, provide a unique lens through which public awareness, emotions, and concerns can be observed during crises. Similarly, mobility data captured by portable devices like smartphones enables the analysis of changes in human movement patterns, such as increased time spent at home and decreased time spent at public spaces during lockdowns or virus outbreaks. Additionally, crowdsourced policy data from governmental websites can provide insights into the strictness and enforcement of pandemic-related policies in different regions. These diverse geospatial datasets offer a comprehensive picture of how social-behavioral dynamics evolve during pandemics. Such insights can be crucial for monitoring societal responses to health crises and estimating the effectiveness of NPI-related social-behavioral changes in controlling pandemic spread.
This study explores the potential of geospatial big data in measuring social-behavioral dynamics during pandemics through the case study of COVID-19. Focusing on the ten most populous U.S. cities, the objectives of this research are three-fold: (1) to develop a framework that integrates social media data, human mobility metrics, and policy evaluations to compute indicators reflecting social-behavioral dynamics; (2) to reveal the geographical and temporal disparities in social-behavioral dynamics across the ten U.S. cities; and (3) to examine the evolving relationship between social-behavioral dynamics and health impacts throughout different pandemic phases in the ten cities.
This article is organized as follows. The next section reviews existing literature that examines social changes, human behaviors, and their interactions with pandemic spread. The following sections describe the data sources and methodologies used to quantify social-behavioral dynamics and their associations with COVID-19 health impacts. These are followed by a section presenting the key findings, highlighting the geographical and temporal disparities in social-behavioral dynamics across the top ten cities and their relationship with COVID-19 infection rates. The next section discusses the implications of these findings and limitations. The final section concludes the study by summarizing its contributions and proposing directions for future research.
Background
Measuring social-behavioral dynamics with geospatial big data
The COVID-19 pandemic has highlighted the growing role of geospatial big data in understanding and quantifying societal changes and human behaviors during health crises. Geospatial big data, derived from sources such as mobile devices, social media, sensor networks, and websites, have enabled tracking social and behavioral dynamics with unprecedented temporal and spatial granularity (Zou et al., 2024). These datasets offer real-time insights into mobility patterns, sentiment, awareness, and local policy changes, all of which are critical in responding to global crises like pandemics.
Human mobility is a key focus during pandemics that are transmitted through contact, and researchers have used location-based services to monitor shifts in movement during past events. Such data can not only inform pandemic spreads and policy decisions but also highlight regional disparities in compliance with mobility restrictions policies. Human mobility behaviors can be estimated using origin-destination flows from public transit systems, activity patterns inferred from mobile operator signals, and mobility indexes derived from mobile phone applications such as location-based social media (Hu et al., 2021; Wang and Taylor, 2018). Google’s Community Mobility Reports were widely used datasets, capturing travel trends and visitations across categories such as retail, workplaces, parks, and residential areas. Using the Google mobility data, a study finds that increases in social distancing beliefs observed on social media, along with rising COVID-19 cases, precipitation, and temperature, are associated with reductions in human mobility (Porcher and Renault, 2021). Apple mobility data, which quantify human movement frequencies by travel modes, were also frequently employed in previous COVID-19 studies. Lin et al., 2024a integrated Apple mobility data with social media data to examine the interplay among human mobility, COVID-19 awareness, public sentiment, intervention policies, and their combined effects on COVID-19 spread across various pandemic phases at the state level in the contiguous United States. In addition, the data company SafeGraph offers high-resolution datasets that provide detailed insights into human mobility. It includes visit counts, visitor origin-destination, points of interest (POIs) attributes (e.g., location, category, and brand affiliations), and temporal variations such as daily or weekly updates. The dataset covers a wide range of establishments, such as retail stores, restaurants, healthcare facilities, and other public venues (Li et al., 2024). Using millions of anonymized mobile phone visits from SafeGraph, previous work computed and aggregated daily and weekly origin-destination population flows at the census tract, county, and state levels (Kang et al., 2020). Other sources, such as Baidu Maps in China (Yangtianzhen and Ying, 2024), Twitter/X’s geotagged data (Huang et al., 2020; Jiang et al., 2021; Osorio-Arjona and García-Palomares, 2019), Facebook (Bonaccorsi et al., 2020), and mobile device location data (Lee et al., 2020; Pan et al., 2020), were also leveraged to assess intra-city and inter-city mobility. For instance, Lee et al. (2020) and Pan et al. (2020) used an integrated dataset of real-time mobile device locations from 100 million devices across the United States to evaluate changes in human mobility. Their findings show that both government orders and local outbreak severity significantly influenced the strength of social distancing behaviors.
Public risk perceptions, such as attention, mood, and anxiety during different stages of the pandemic, play important roles in shaping human behaviors. Social media platforms like Twitter/X facilitate the analysis of public awareness and sentiment during crises. Studies have leveraged natural language processing (NLP) techniques to analyze textual data to understand real-time public awareness and sentiment for crisis communication (Zou et al., 2018). For instance, researchers extracted keywords and hashtags related to the coronavirus to gauge public understanding of health risks and their responses to governmental measures (Lin et al., 2022). Additionally, public awareness indexes were often derived from Google search trends or survey-based Likert scales (Jun et al., 2021; Peng et al., 2022).
Measuring location-based policies can help understand the spatial-temporal dynamics of policy effectiveness, assess disparities in implementation and adherence, and design more equitable interventions. The Oxford COVID-19 Government Response Tracker (OxCGRT) is a popular data source for assessing and comparing COVID-19-related policies across space and time (Hale et al., 2021). OxCGRT provides systematic information on policy stringency and implementation across different geographies, e.g., countries, regions, and states. The Stringency Index quantifies the strictness of stay-at-home COVID-19 policies by incorporating nine key indicators: school closures, workplace closures, restrictions on public events, limitations on gathering size, public transport closures, stay-at-home requirements, restrictions on internal movement, restrictions on international travel, and public information campaigns. These indicators enable detailed temporal and spatial analyses of policy responses at national and subnational levels (Bouzouina et al., 2022; Wu and Shimizu, 2022). Additional policy data sources, including government and news websites, were also utilized to calculate composite policy indexes, policy implementation dates, and effective areas (Chang et al., 2021; Poppe and Maskileyson, 2022).
Interplay between social-behavioral dynamics and COVID-19 spread
The COVID-19 pandemic has triggered a growing interest in investigating the complex interplay among social behaviors, governmental policies, and the spread of the virus. Policies, such as lockdowns, travel restrictions, and mask mandates, significantly influenced human mobility and behaviors, which in turn affected the trajectory of the pandemic. Geospatial data have been instrumental in uncovering these interactions. Specifically, research using geospatial data revealed that early implementation of stringent policies was associated with better control of COVID-19 spread (Agyapon-Ntra and McSharry, 2023; Brauner et al., 2021). However, the effectiveness of these policies varied geographically. In Europe, stay-at-home policies showed limited success in reducing mobility compared to the United States, where initial compliance was higher (Kallidoni et al., 2022; Li et al., 2021). Within the U.S., socioeconomically disadvantaged areas exhibited less pronounced mobility changes, underscoring the need for community-based interventions (Chang et al., 2021).
The relationship among policy implementation, mobility changes, and COVID-19 cases varied significantly across different phases of the pandemic. For example, a strong positive correlation between mobility and infection rates was found during the early outbreak phase in 2020, but their association diminished during later waves in the United States (Gottumukkala et al., 2021). This suggests that the public’s adherence to mobility restrictions waned over time, influenced by pandemic fatigue and evolving perceptions of risk. Studies also highlighted time-lagged effects, where reductions in mobility led to decreased infections 2–7 weeks later (Badr et al., 2020; Gottumukkala et al., 2021; Vega-Villalobos et al., 2022). This delay emphasizes the importance of proactive policy measures to prevent surges in infections.
Public sentiment and awareness also shaped the dynamics of governmental responses and pandemic outcomes. Heightened public awareness, often reflected in increased search activity for COVID-19-related information, was generally associated with lower future transmission rates (Jung et al., 2021). Sentiment analysis revealed that fear, anxiety, and sadness were more pronounced during the initial outbreak, driving higher compliance with safety measures, while rising anger, loneliness, and impatience later led to decreased adherence (Guo et al., 2024). As the pandemic progressed, public sentiment became more polarized, potentially affecting the effectiveness of governmental interventions (Yeung et al., 2020).
Bidirectional relationships between social and governmental responses were evident in previous investigations. Government policies influenced public behaviors, but public reactions, in turn, shaped policy decisions. For instance, India’s early strict COVID-19 measures were initially praised, but criticism over inadequate testing and delayed social support grew. In response to public sentiment and low case numbers, restrictions were eased, allowing mass gatherings. However, a severe second wave in 2021 led to backlash, forcing the government to reassess its approach (Thiagarajan, 2021). Despite the importance of these interactions, research on their bidirectional nature remains limited, with most studies focusing on one-directional effects.
The findings from previous investigations underscore the need for adaptive and context-sensitive policymaking. Regional variations in policy effectiveness imply the importance of localized strategies that account for socioeconomic disparities and cultural differences. Additionally, integrating public sentiment and awareness data into policy frameworks can enhance their responsiveness and effectiveness. More research leveraging geospatial big data to deepen our understanding of these complex dynamics and improve preparedness for future pandemics is needed.
Data collection and processing
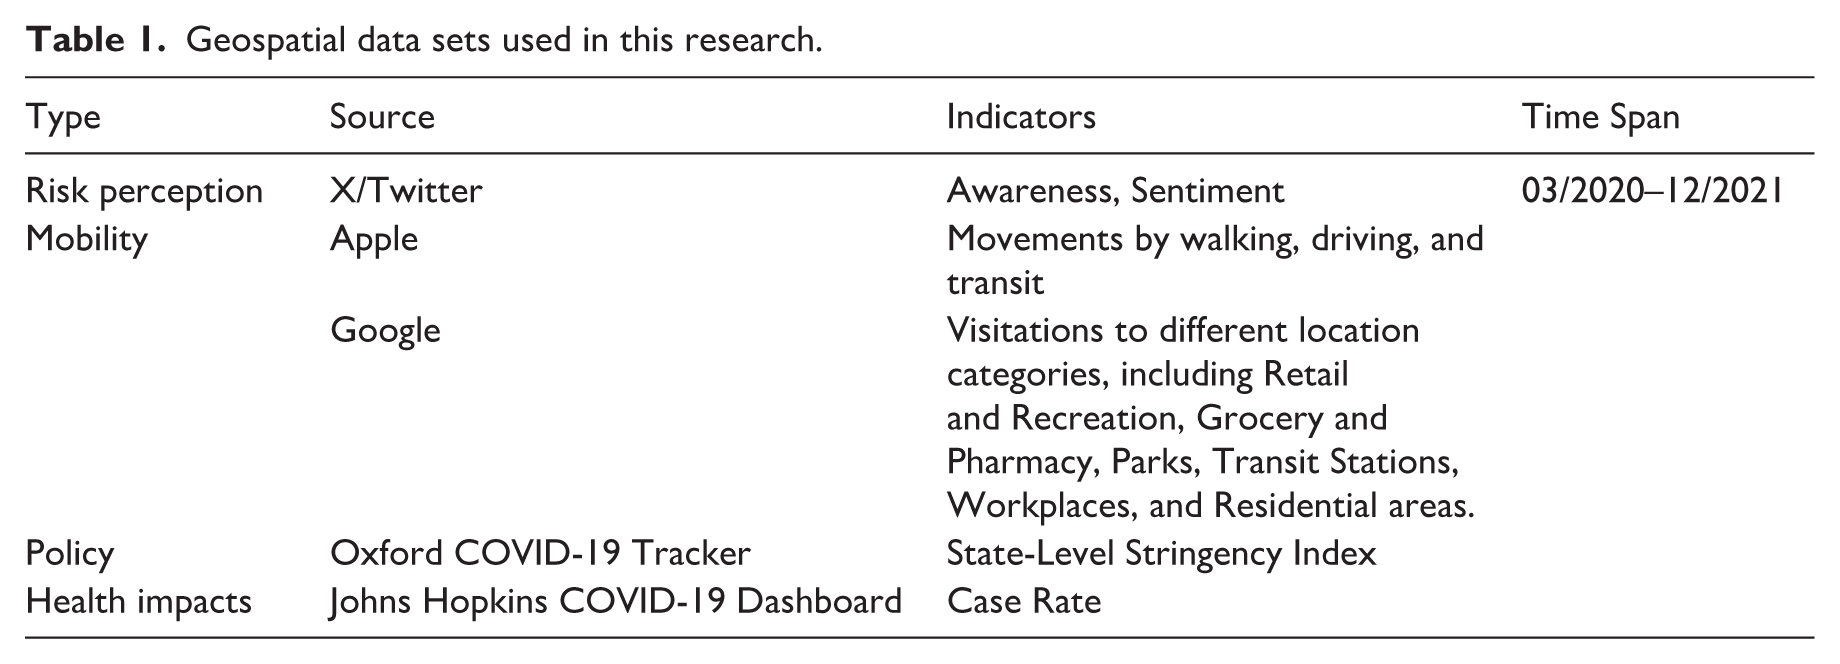
This study leverages five geospatial datasets, including social media data from X/Twitter, mobility data from Apple and Google, policy evaluations from Oxford’s Stringency indexes (Hale et al., 2021), and COVID-19 health impacts from the Johns Hopkins University COVID-19 Dashboard (Dong et al., 2020) (Table 1).
Geospatial data sets used in this research.
We selected the period 03/2020–12/2021 for analysis because complete data are available for this timeframe. Figure 2 illustrates the workflow for data collection, processing, and analysis. This study focuses on the ten most populous cities in the U.S., including New York City (Bronx, Kings, New York, Queens, and Richmond counties) in New York (NY), Chicago (Cook county) in Illinois (IL), Philadelphia (Philadelphia county) in Pennsylvania (PA), Houston (Harris county), San Antonio (Bexar county), and Dallas (Dallas county) in Texas (TX), Phoenix (Maricopa county) in Arizona (AZ), and Los Angeles (Los Angeles County), San Diego (San Diego County), and San Jose (Santa Clara County) in California (CA). These cities were selected to ensure representation from different regions of the United States. We used city-county definitions rather than metropolitan boundaries because both the mobility datasets and the official COVID-19 case reports are available at the county level. Aligning the social media-derived risk perception indexes with county-level epidemiological and mobility data ensures consistent spatial units and allows accurate cross-city comparisons. Two key analyses were conducted: a disparities analysis and a lagged correlation analysis. The following subsections provide detailed descriptions of the data sources, processing procedures, and analysis methods.
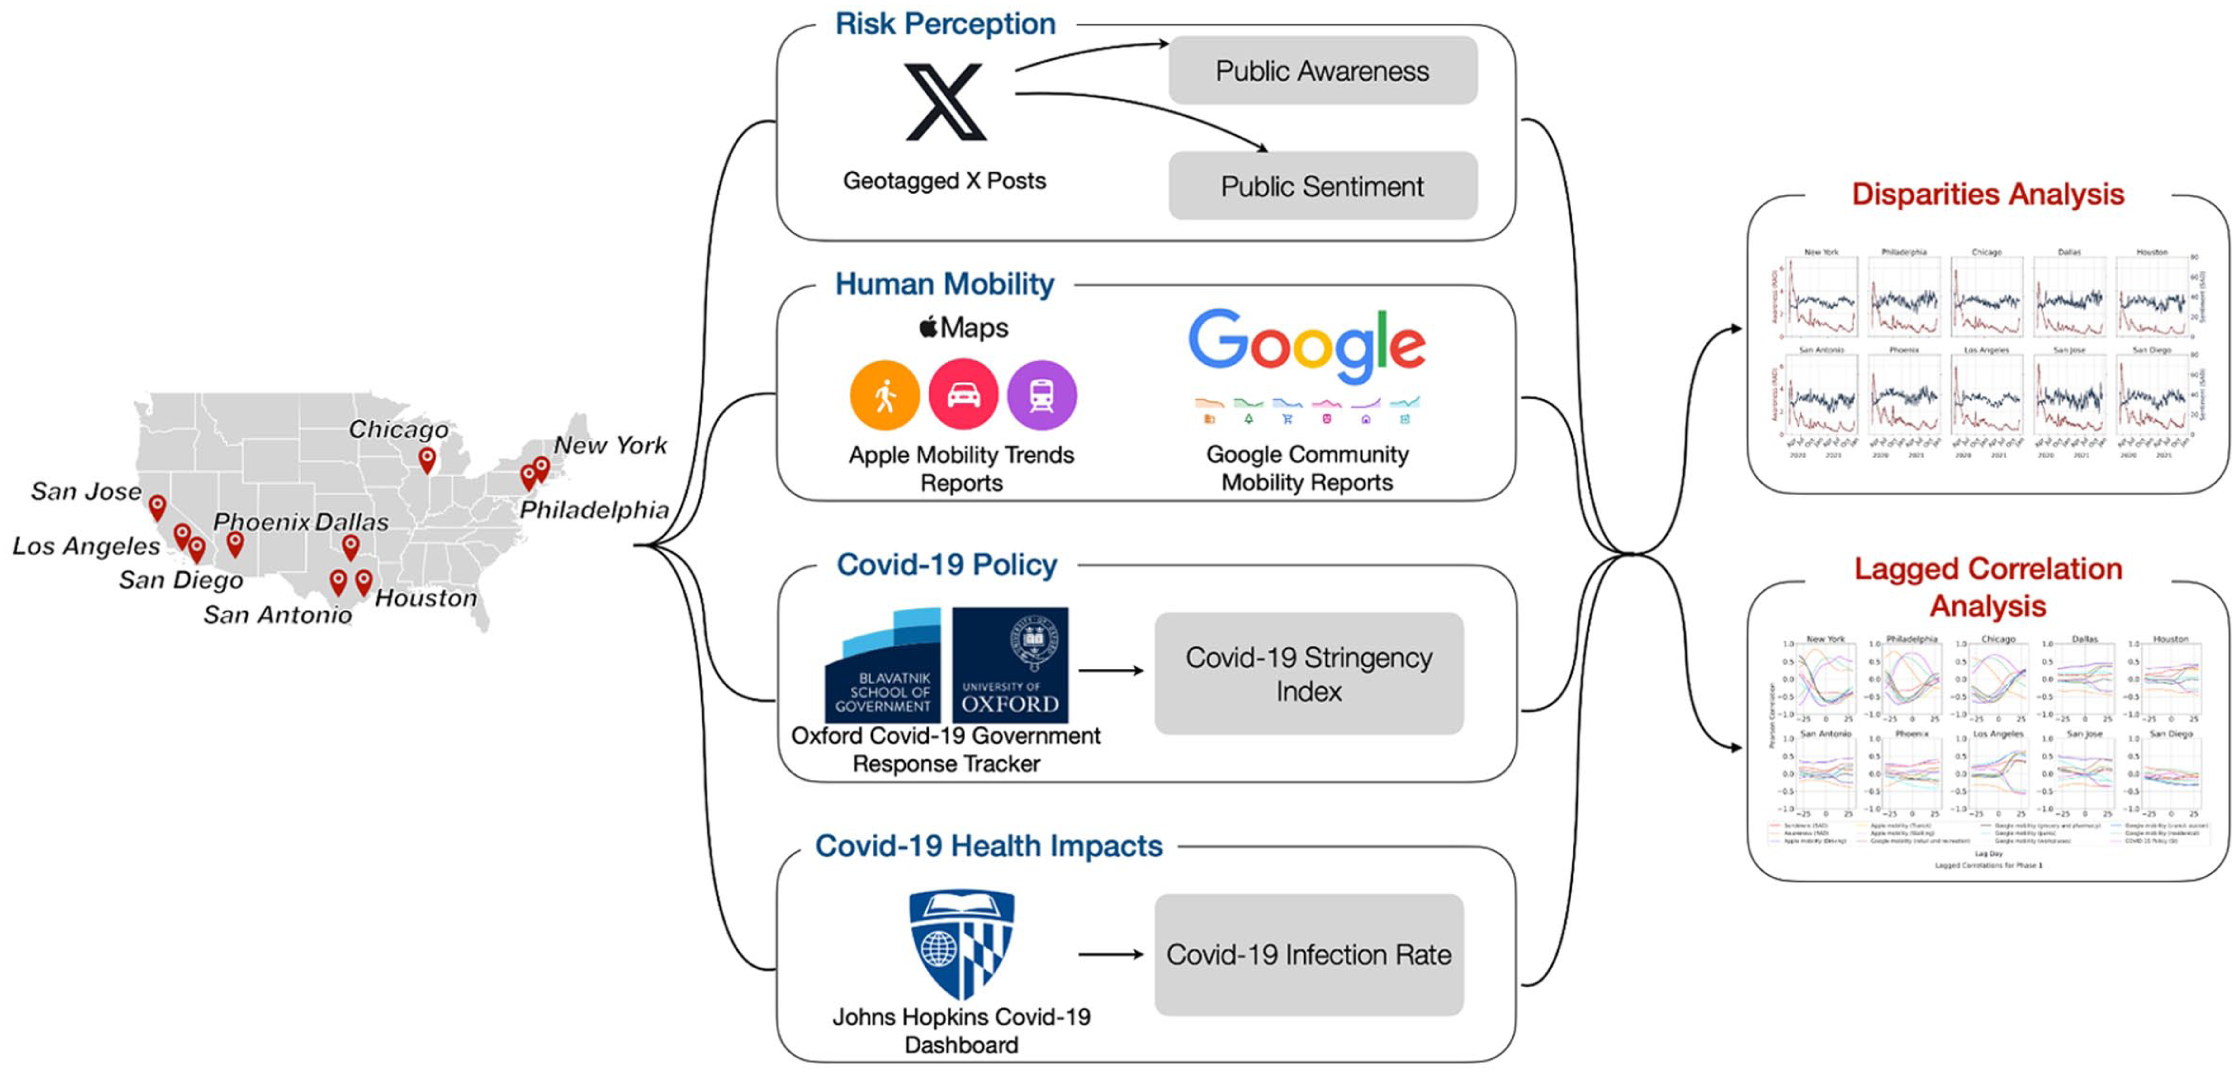
Study area and the workflow of data collection, processing, and analysis.
Social media data
Social media data were collected from X/Twitter to design two indexes for quantifying COVID-19 risk perceptions: awareness and sentiment. To ensure demographically unbiased estimates of public awareness and sentiment toward COVID-19, a framework for mining social media data and correcting demographic biases was implemented (Figure 3). First, all geotagged posts (tweets) from the U.S. during 2020 and 2021 were retrieved using the X/Twitter Academic Application Programming Interface (API). Non-human-generated tweets and posts from organizational accounts irrelevant to public perceptions were filtered out following methods detailed in a previous investigation (Lin et al., 2024c). This process yielded a total of 89,098,364 (21.17%) geotagged tweets in the ten selected cities from 420,795,408 geotagged messages in the United States.
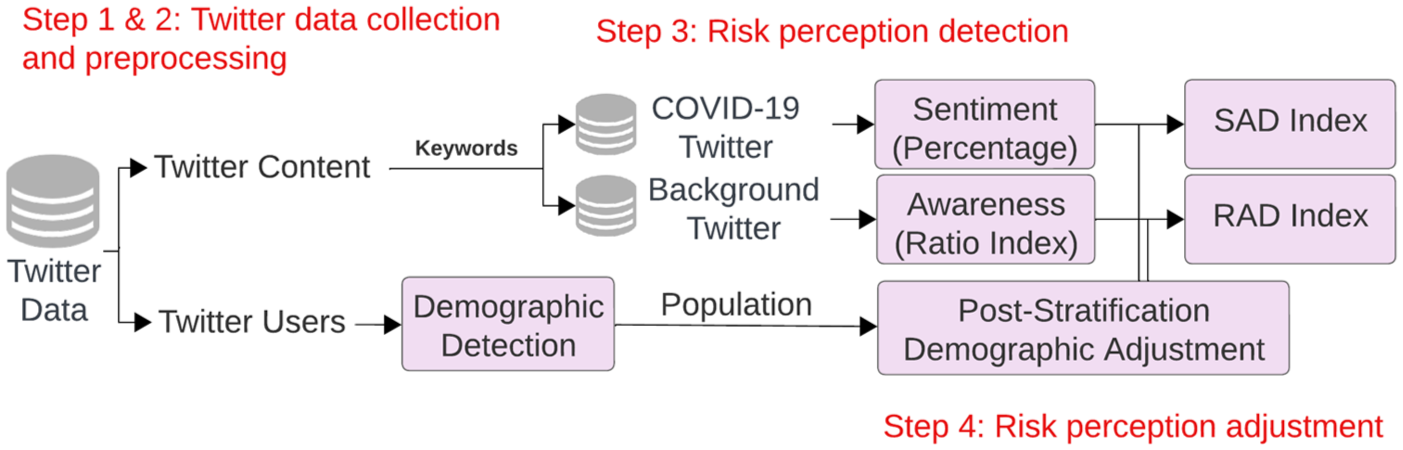
The workflow for calculating awareness and sentiment using social media data.
Second, a list of COVID-19-related keywords was compiled based on prior studies (Alqurashi et al., 2020; Banda et al., 2021; Lin et al., 2022). Keywords included are “COVID,” “virus,” “2019-nCoV,” “SARS-CoV-2,” “coronavirus,” “N95,” “social distancing,” “lockdown,” “quarantine,” “pandemic,” “epidemic,” “pneumonia,” and “confirmed cases.” Using these keywords, 1,165,834 tweets (1.31% of the total) posted by 203,224 distinct users were identified as COVID-19-related. Table 2 lists the numbers of COVID-19-related and all geotagged tweets by city.
Numbers of COVID-19-related and all geotagged tweets by city.
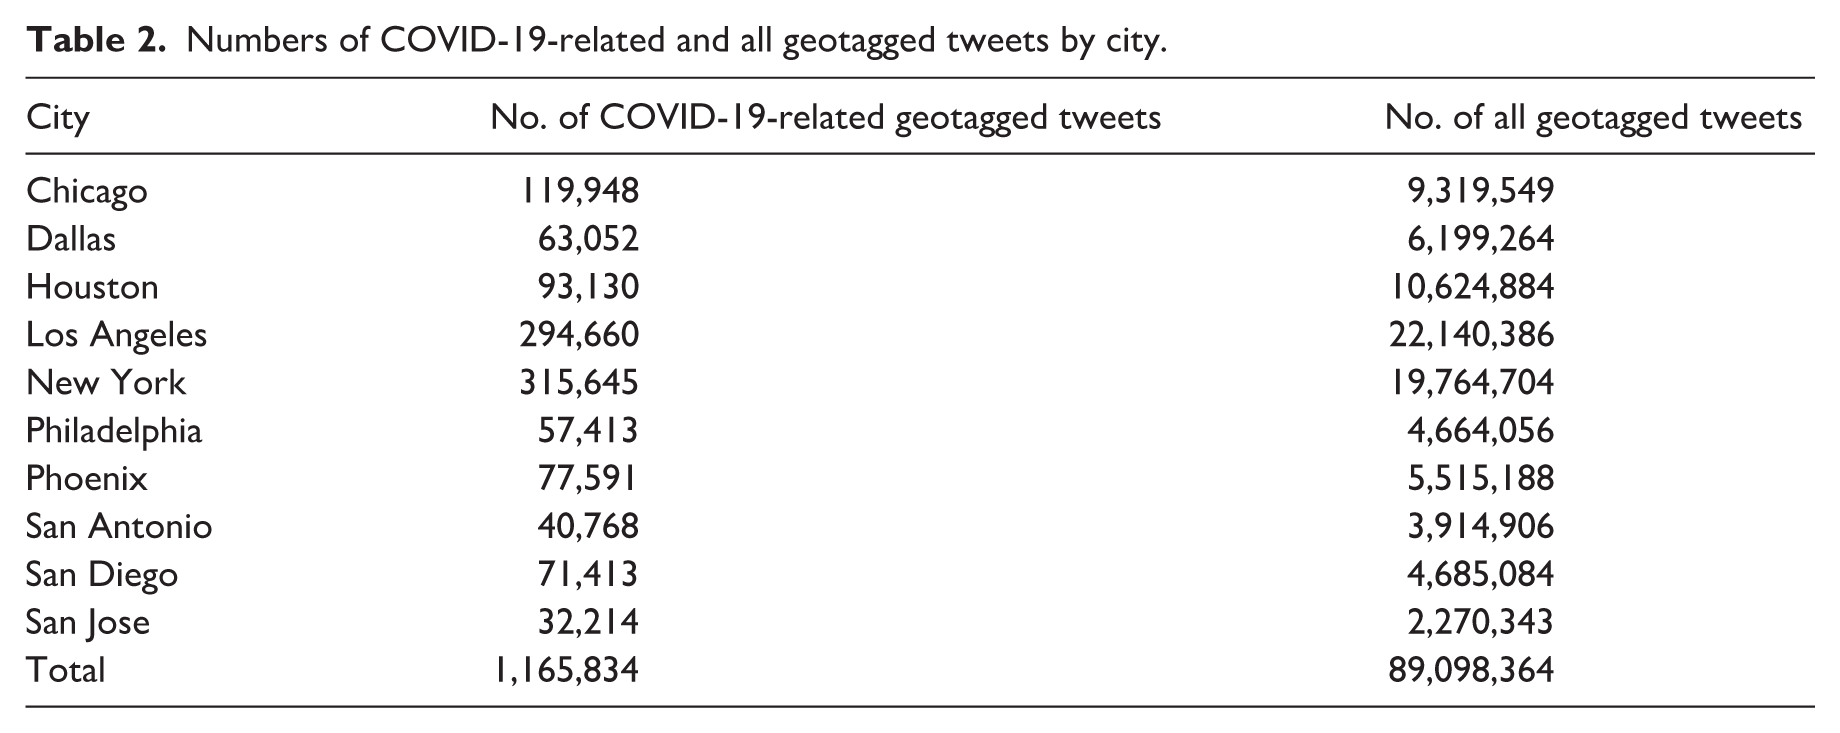
Third, two indexes were calculated to measure risk perceptions. Public awareness was represented by the Ratio index, defined as the percentage of users posting about COVID-19 among all users posting on X (Lin et al., 2022). Public sentiment was assessed by estimating the percentage of users expressing overall negative emotions toward COVID-19 (Lin et al., 2024c). Sentiment was derived from the text content of COVID19-related tweets using the VADER sentiment analysis tool (Hutto and Gilbert, 2014), which assigns each tweet a sentiment score ranging from −1 (most negative) to +1 (most positive). We employed the most recent version of VADER, updated in April 2022, to better capture contemporary expressions of sentiment in online communication. For each user, we first computed the average sentiment score across all COVID-19-related tweets posted within a given period (e.g., week, month, or year). We then discretized users’ continuous sentiment scores into three categories: Negative: −1 to −0.05, Neutral: −0.05 to 0.05, and Positive: 0.05 to 1.
Finally, demographic biases in user representation were corrected using the post-stratification method (Lin et al., 2024c) to compute two adjusted indexes: the Sentiments Adjusted by Demographics (SAD) index and the Ratio Adjusted by Demographics (RAD) index. The SAD index represents the demographically unbiased proportion of users expressing negative emotions toward COVID-19, while the RAD index quantifies the adjusted proportion of users tweeting about COVID-19. User demographics, including age and gender, were identified using the M3 (multimodal, multilingual, and multi-attribute) model (Wang et al., 2019), which classifies age into three groups (⩽18, 19–29, 30–39, or ⩾40 years) and labels gender into two categories (male or female). The M3 model is an open-source demographic inference framework that integrates information from multiple sources, including profile images, usernames, screen names, and biography text, to infer user age and gender. The model architecture combines two key components: (1) a DenseNet-based convolutional neural network for feature extraction from profile images, and (2) a two-stack bidirectional character-level Long Short-Term Memory (LSTM) for processing text fields such as usernames and biographies. By fusing visual and textual information, M3 captures richer demographic cues than models relying on a single data modality. The model was trained on a large and diverse set of datasets, including Twitter accounts with self-reported demographics (e.g., “mother of two,” “turning 24 today”), organization accounts, IMDB and Wikipedia face images, and a crowdsourced multilingual dataset in 32 languages. M3 achieved an accuracy of 0.81 for gender recognition and 0.42 for age recognition in English tweet datasets, outperforming other existing models (Morgan-Lopez et al., 2017; Vashisth and Meehan, 2020). Although 0.42 in age detection may appear modest, age prediction from social media profiles is known to be considerably challenging due to limited cues. Both indexes can be computed at various spatial and temporal scales. To reduce short-term fluctuations and capture more stable trends, a 7-day moving average was applied to both the RAD and SAD indexes.
Mobility data
This study utilized city-level daily Apple and Google mobility data during 2020 and 2021. Apple mobility data capture human movements across different travel modes, including driving, walking, and public transit. These data track changes in mobility volume at multiple administrative levels, such as global, country, state, and county scales (https://covid19.apple.com/mobility). The dataset is derived from the direction requests of Apple Maps users. It reports relative mobility volumes compared to a baseline established on January 13, 2020, which represents the volume of direction requests received per country, region, or city in the pre-pandemic phase. For example, a value of 120 indicated a 20% increase in routing requests compared with the baseline on January 13, 2020. Although the dataset is limited to Apple Maps users, Apple holds a significant market share in the U.S., with millions of active users. This large sample size provides a robust resource for monitoring spatiotemporal changes in human mobility during major events like COVID-19 (Nagy et al., 2023). Apple Mobility data are available from January 13, 2020, to April 14, 2022. Data for March 12, 2021, is missing from the database. We obtained the data set before its discontinuation, and the available mobility records were sufficient for the timeframe of this study.
Google mobility data were released as part of Google’s Community Mobility Reports (https://www.google.com/covid19/mobility/) during the COVID-19 pandemic. They provide insights into changes in population visitation trends across various location categories. These categories include retail and recreation, grocery and pharmacy, parks, transit stations, workplaces, and residential areas (Li et al., 2024). Google mobility indexes are derived by comparing percentage changes relative to a baseline, a normal visitation value for that day of the week. The baseline data for each day of a week were the median values from Jan 3 to Feb 6, 2020. These datasets highlight the extent to which mobility behaviors were altered in response to the pandemic and government interventions. Google mobility data have been widely used in research to evaluate the effectiveness of NPIs (e.g., lockdowns and social distancing measures), analyze shifts in human activities, and explore correlations between mobility changes and the spread of COVID-19. Google mobility data are available for the period from February 15, 2020, to October 14, 2022.
Both Apple and Google human mobility daily data were processed using a 7-day moving average (including three days before and three days after each date) to reduce short-term fluctuations and provide a representation of overall mobility trends.
Policy data
The Oxford COVID-19 Government Response Tracker (OxCGRT) uses the scorecard method and offers a systematic estimation of the stringency of COVID-19 policies implemented by various countries and regions from January 22, 2020, to November 16, 2022. Hale et al. (2021) compiled a comprehensive set of COVID-19 policies and assigned scores to each policy, with higher scores indicating more stringent measures. These policies were categorized into 24 indicators based on their thematic focus, including eight containment and closure policies indicators (school closures, workplace closures, cancellation of public events, restrictions on gatherings, public transport closure, stay-at-home orders, internal movement restrictions, and international travel controls), four economic policies indicators (income support, debt/contract relief, fiscal measures, and international support), eight health system policies indicators (public information campaigns, testing policy, contact tracing, emergency investment in healthcare, investment in vaccines, mask mandates, vaccination policy, and protection of elderly people), and four vaccination policies indicators (vaccine prioritization, vaccine eligibility/availability, vaccine financial support, and mandatory vaccination). Each policy is coded using an ordinal scale (0–3 or 0–4) representing increasing levels of strictness. For example, for School closures, 0 = No measures, 1 = Recommended closing, 2 = Required closing for some levels, and 3 = Required closing for all levels. The overall stringency score is calculated as a weighted average of these indicators, normalized to a 0–100 scale.
The Stringency Index selected in this investigation quantifies the strictness of stay-at-home COVID-19 policies by incorporating nine indicators, namely school closures, workplace closures, restrictions on public events, limitations on gathering size, public transport closures, stay-at-home requirements, restrictions on internal movement, restrictions on international travel, and public information campaigns. The Stringency Index scale ranges from 0 to 100, with higher values indicating more stringent measures. For this study, we collected daily Stringency Index data at the state level in the U.S. during 2020–2021, as city-level policy evaluations are unavailable.
Health impacts data
To evaluate the health impacts of COVID-19, we used the daily case rate as a quantitative metric, representing the number of confirmed cases per 100,000 individuals in the population each day. The daily confirmed cases were derived from the cumulative case counts reported in the U.S. during 2020 and 2021, obtained from the publicly available database maintained by the Center for Systems Science and Engineering (CSSE) at Johns Hopkins University (Dong et al., 2020). Population data were sourced from the United States Census, and estimates were based on data as of April 1, 2020. The resulting daily case rate ranged from 0 to 105, with higher values indicating a more pronounced impact on public health attributed to COVID-19.
Analysis methods
The analysis methods combine exploratory visualization, phase-specific segmentation, and lagged correlation modeling. The first analysis focuses on disparities across cities by visualizing the temporal trends of key indicators, including public awareness, sentiment, mobility by travel mode and location category, policy responses, and health impacts in the ten selected cities. By examining these temporal patterns, the analysis identifies peaks and troughs in each indicator in each city and investigates potential reasons behind these variations, such as significant policy changes, local outbreaks, or societal events. Cross-city differences in these temporal trends are also explored.
The second analysis examines the interplay between social-behavioral indicators and COVID-19 case rates in each city to uncover whether changes in public awareness, sentiment, mobility, and policies influence or respond to infection trends. We included lagged effects in the analysis to identify potential delayed relationships. It helps explain whether social-behavioral changes contribute to future pandemic control or spread, and whether worsening pandemic conditions drive shifts in behavior and governmental actions. We divided the two-year period (2020–2021) into two or three city-specific phases based on local outbreak patterns, considering that the pandemic unfolded differently in each city. For each city and phase, lagged Pearson correlations were computed between COVID-19 infection rates and each social-behavioral indicator to identify the dynamic relationships.
The sign and direction of the lagged Pearson correlations help indicate how social-behavioral dynamics and infection trends influence one another over time. For example, a negative lagged correlation between policy stringency at time t-n and COVID-19 case rates at time t suggests that stricter policies in earlier days were followed by lower infection rates, reflecting a potential preventive or mitigating effect of governmental interventions. Conversely, a positive lagged correlation between mobility at time t-m and COVID-19 cases at time t implies that increased mobility several days earlier may have contributed to higher transmission levels later. In the opposite direction, a positive correlation at positive lags (where cases lead behavior) may indicate that rising infections triggered behavioral responses, such as reduced mobility or increased public awareness. By examining these patterns for each city and pandemic phase, the lagged correlation analysis helps uncover whether social-behavioral indicators tend to precede, follow, or co-evolve with infection trends, offering insights into the temporal interplay between public behaviors, policy actions, and disease spreads in different cities.
Results
Disparities in risk perceptions
Figure 4 illustrates the temporal trends of public awareness (RAD index, red lines) and public sentiment (SAD index, blue lines) derived from X data across the ten cities during the 2-year period. The darker lines and labeled time points represent weekly trends, while the lighter lines depict daily patterns. Public awareness generally showed a sharp peak during the onset of the pandemic in the week of March 16, 2020, coinciding with the implementation of shutdowns in many U.S. states. This peak was followed by a gradual decline with 2–4 smaller peaks later in 2020–2021. City-specific dynamics reveal notable variations. New York City exhibited the highest initial levels of awareness (6.64%), likely due to its early status as a COVID-19 epicenter. This was followed by California cities, including San Jose (6.22%), San Diego (6.20%), and Los Angeles (5.99%). In contrast, Texas cities displayed lower initial levels of awareness, ranging from 3.93% to 4.77%. Additional peaks in public awareness were observed in late June to early July 2020, November to December 2020, August 2021, and late 2021. These peaks may have been triggered by local outbreaks of infections, school reopening, or changes in public policies.
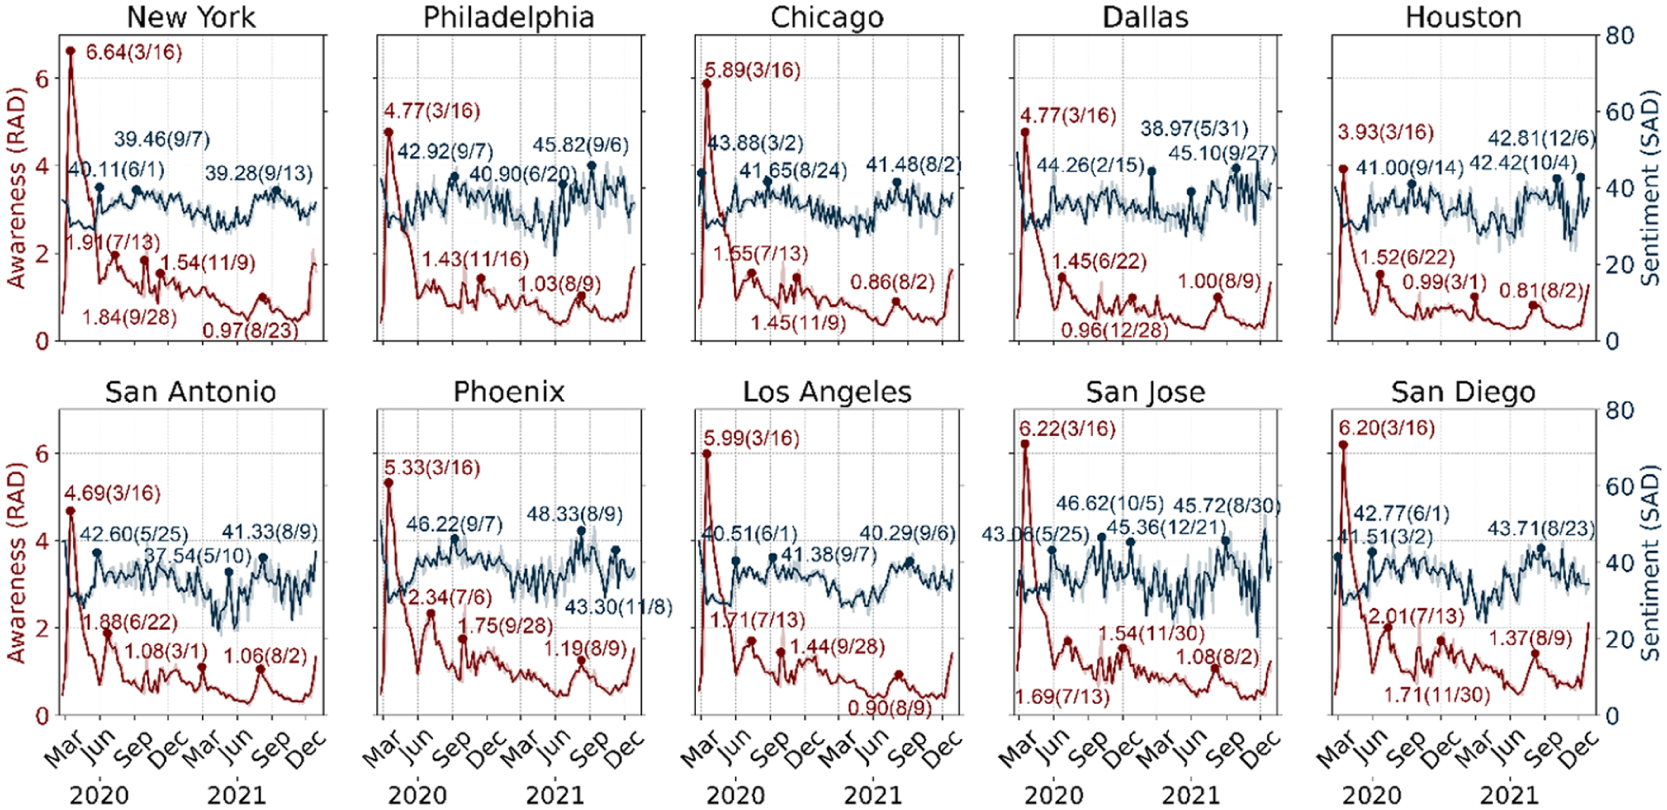
X/Twitter data-derived temporal trends of awareness and sentiment in the ten U.S. cities during 2020–2021.
Public sentiment, measured by negative emotions, showed a similar initial spike in most cities and fluctuated throughout the two years, with the weekly SAD index ranging from 20.56% to 48.33%. In general, less negative public emotions were observed in January – June 2021 in most of the ten cities. On the contrary, some notable periods when more X users expressing negative sentiments toward COVID-19 were found in 5/25–6/1 2020, 8/25–9/14 2020, and 08/09–09/13 2021. The highest weekly SAD value was recorded in Phoenix in the week of 8/9 2021 (48.33%), while the lowest value was found in San Jose in the week of 11/21 2021 (20.56%).
Disparities in human mobility
Figure 5 illustrates the daily temporal trends of human mobility by travel mode across the ten cities during 2020–2021, based on Apple mobility data. Mobility in all cities shows a sharp decline for all modes at the beginning of the pandemic in March – June 2020. Generally, walking and driving mobilities were less affected and recovered faster than public transit mobility, especially in 2021. In New York City, Philadelphia, Chicago, and San Diego, where residents heavily rely on transit systems, the use of public transit suppressed the baseline since July 2021. In contrast, public transit usage remained consistently below pre-pandemic levels across all other cities. A significant increase in walking mobility was observed in all ten cities, especially in Chicago, Dallas, and San Antonio. Driving mobility remained close to pre-pandemic conditions in 2020 and grew to higher than pre-pandemic status in 2021 in all cities. Additionally, cities in Texas experienced a sudden decline in mobility in February 2021, possibly due to the impacts of Winter Storm Uri, which severely disrupted transportation and power systems across the state. This storm, the costliest natural disaster in Texas history, paralyzed infrastructure and significantly restricted movement during that period.
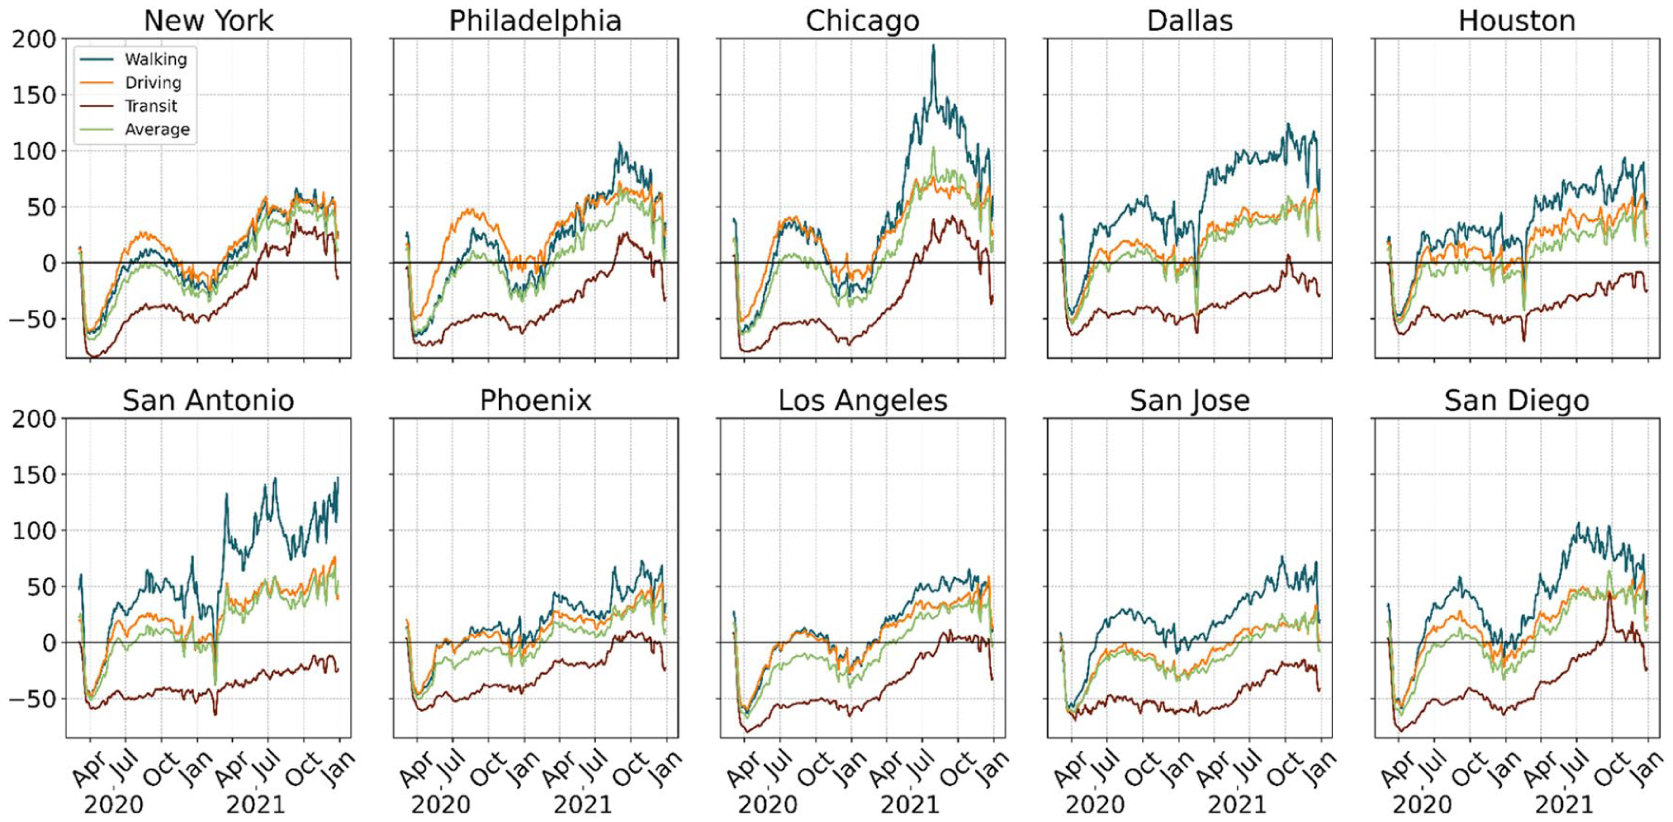
Apple data-derived temporal trends of human mobility by travel mode across the ten U.S. cities during 2020–2021.
Figure 6 illustrates Google data-derived daily mobility patterns across the ten cities during 2020–2021. Sharp reductions in workplace, transit station, and retail/recreation visitations occurred in early 2020. Simultaneously, residential mobility increased significantly as people shifted toward staying at home and working/schooling from home. Visitations to parks displayed a unique trend and surged and surpassed pre-pandemic values during the initial outbreak of COVID-19 and warmer months in 2020 and 2021. This is because parks became popular alternatives for outdoor or social activities during restrictions. This phenomenon was most significant in Chicago and New York. By late 2021, mobility in retail/recreation, workplaces, and grocery/pharmacy began to recover, while transit station mobility remained consistently below pre-pandemic levels in most cities. City-specific trends reveal important differences. New York City and Chicago experienced the steepest and most prolonged reductions in workplace and transit station mobility. California cities (Los Angeles, San Diego, and San Jose) demonstrated similar reductions across most categories, particularly workplaces and transit stations. In contrast, Texas cities (Houston, Dallas, and San Antonio) displayed smaller declines and quicker recoveries, especially in retail/recreation and workplace mobility.
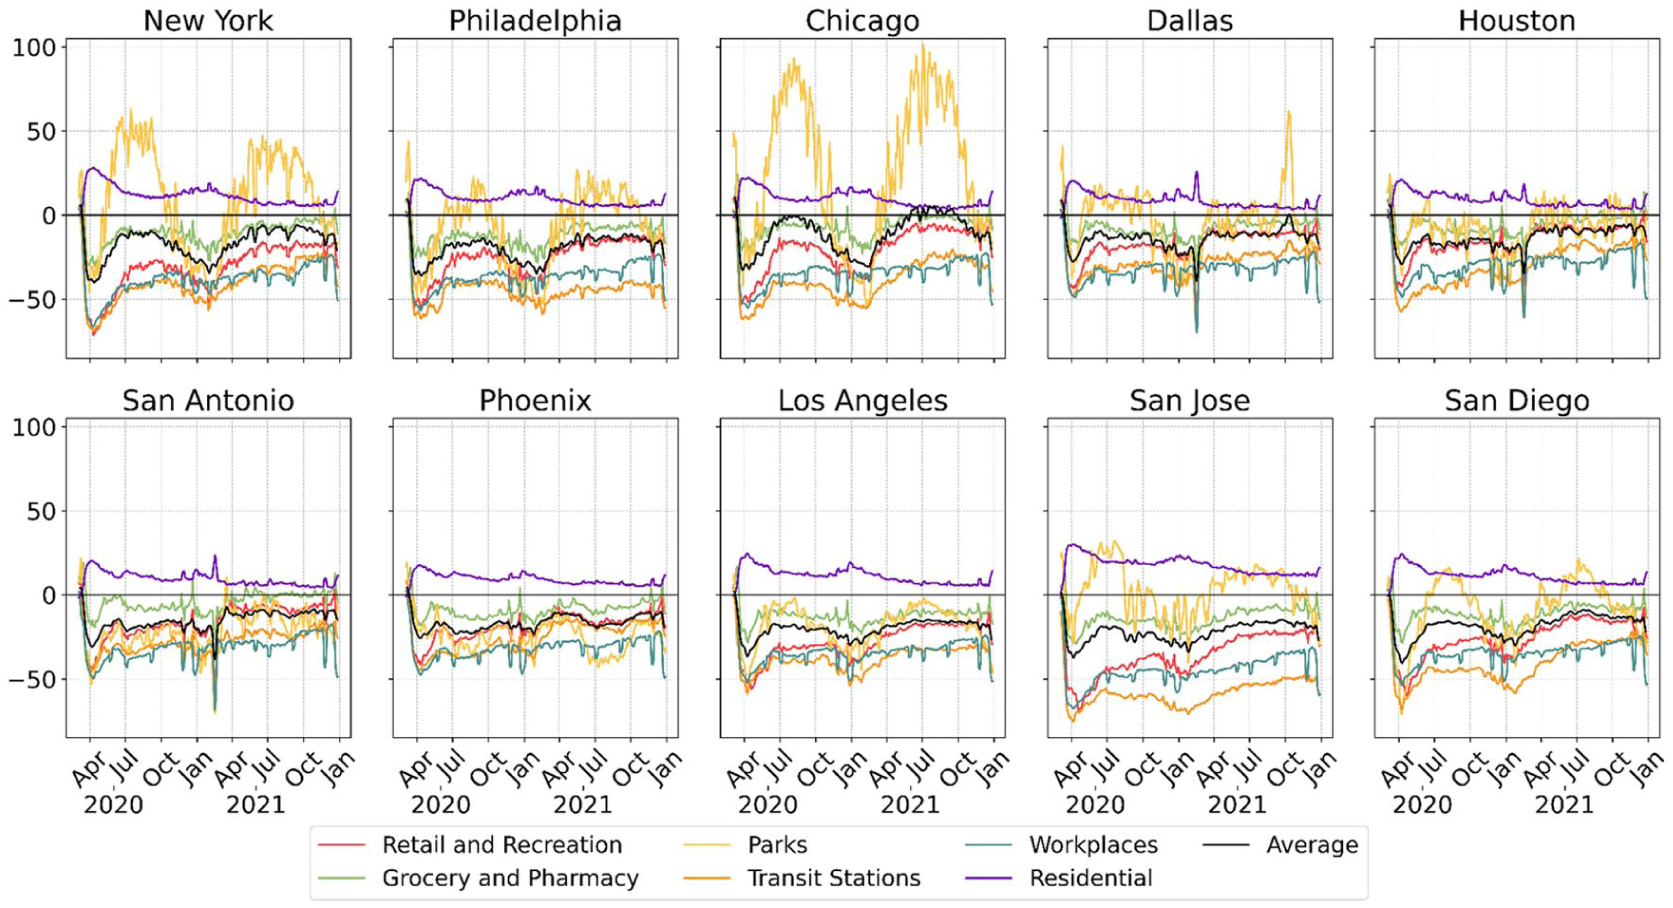
Google data-derived temporal trends of human mobility by location categories across the ten cities during 2020–2021.
The human movement patterns captured by Apple and Google mobility data show both similarities and differences in how human activities were affected during the pandemic. Both datasets highlight sharp declines in mobility across most categories during the early months of 2020, reflecting the immediate impact of lockdowns and restrictions. Mobility related to workplaces, transit stations, and retail/recreation was significantly reduced, while residential mobility increased as people shifted to staying at home. Walking and driving mobility, captured by Apple data, and categories like grocery/pharmacy and parks, captured by Google data, generally recovered faster compared to public transit usage or visitations to other place types. One notable difference between the two mobility datasets is their patterns in public transit usage. Apple mobility data show a recovery in public transit usage in 2021 across six cities, whereas Google mobility data suggest that public transit usage remained below pre-pandemic levels in all ten cities. This may stem from differences in the baseline calculations used in the two datasets and the commuting behavioral disparities of the respective users.
Disparities in COVID-19 policies
Figure 7 presents the temporal trends of the COVID-19 policy stringency index across ten selected U.S. cities from February 2020 to February 2021. A sharp increase in policy stringency was observed across all cities in March 2020, corresponding to the initial outbreak of the pandemic. Following this peak, variations in the restrictions were observed across states. New York maintained high stringency levels throughout the pandemic, particularly in 2020. Similarly, California cities (Los Angeles, San Diego, and San Jose) consistently upheld higher stringency levels compared to Texas cities (Houston, Dallas, and San Antonio). In the first half of 2021, COVID-19 policies remained stricter in California cities and Chicago, Illinois. By mid-2021, most cities showed a gradual decline in stringency as restrictions were eased in response to improved conditions or vaccination rollouts. In contrast, policy stringency in Phoenix, Arizona, was comparatively more relaxed at the beginning of the pandemic and since April 2021.
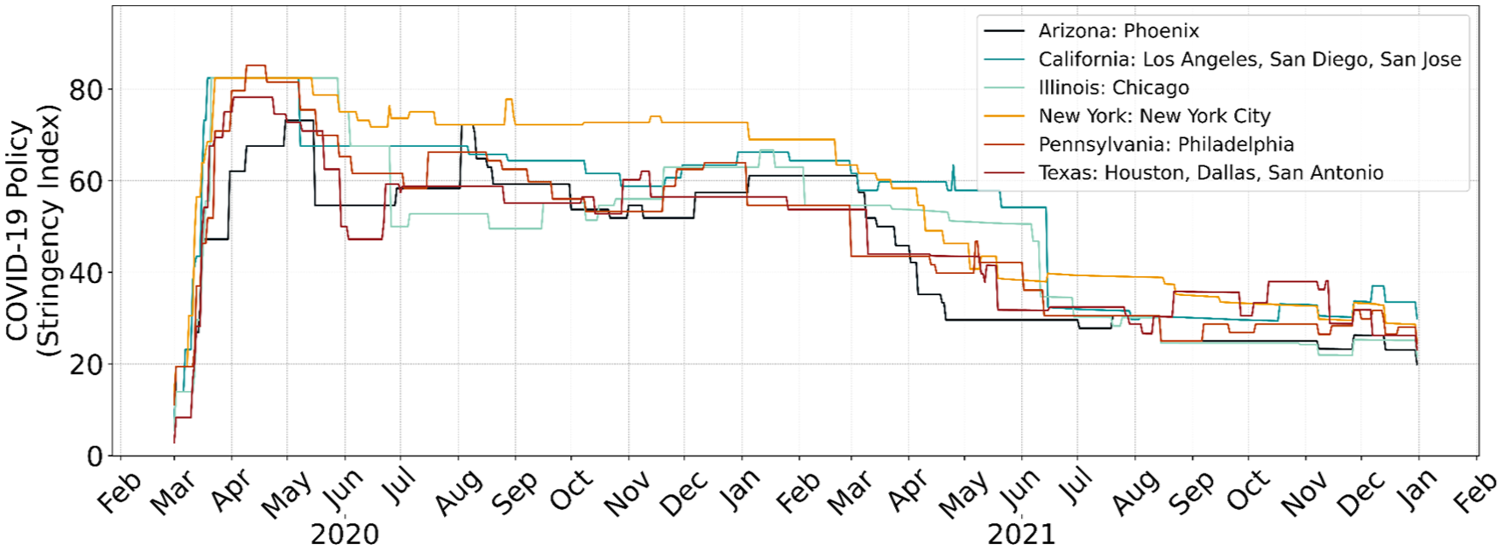
Temporal trends of COVID-19 stringency indexes in the ten U.S. cities during 2020–2021.
Disparities in health impacts
Figure 8 illustrates the temporal trends of COVID-19 case rates (infections per million population) across the selected cities during 2020–2021. Each panel represents a city, with light red lines indicating daily case rates and dark red lines showing 7-day average rates. The pandemic phases for each city are defined based on outbreak patterns. Most cities exhibit three distinct phases. For example, New York City’s first phase (March – July 2020) corresponds to the initial outbreak, characterized by a rapid surge followed by a sharp decline in infections. The second phase (August 2020 – June 2021) reflects a resurgence in cases, with fluctuating rates, while the final phase (June – November 2021) captures the increase associated with new variants. Chicago and Philadelphia show similar patterns, with three clearly defined phases. Texas cities (Houston, Dallas, and San Antonio) display a consistent pattern of three outbreaks of comparable size across the two-year period. In contrast, cities like Los Angeles, San Jose, and Phoenix experienced relatively less health impacts during the initial outbreak but significantly higher infection rates during the second phase (late 2020 to early 2021). These cities transitioned to a third phase with gradually rising case rates. San Diego displays only two distinct phases: the first phase (March 2020 – May 2021) captures the initial wave and sustained outbreaks, while the second phase (June 2021 onward) highlights a gradual decline followed by a resurgence. These phase divisions provide a valuable framework for analyzing the dynamic interactions between COVID-19 case rates, public policies, and social-behavioral changes over time.
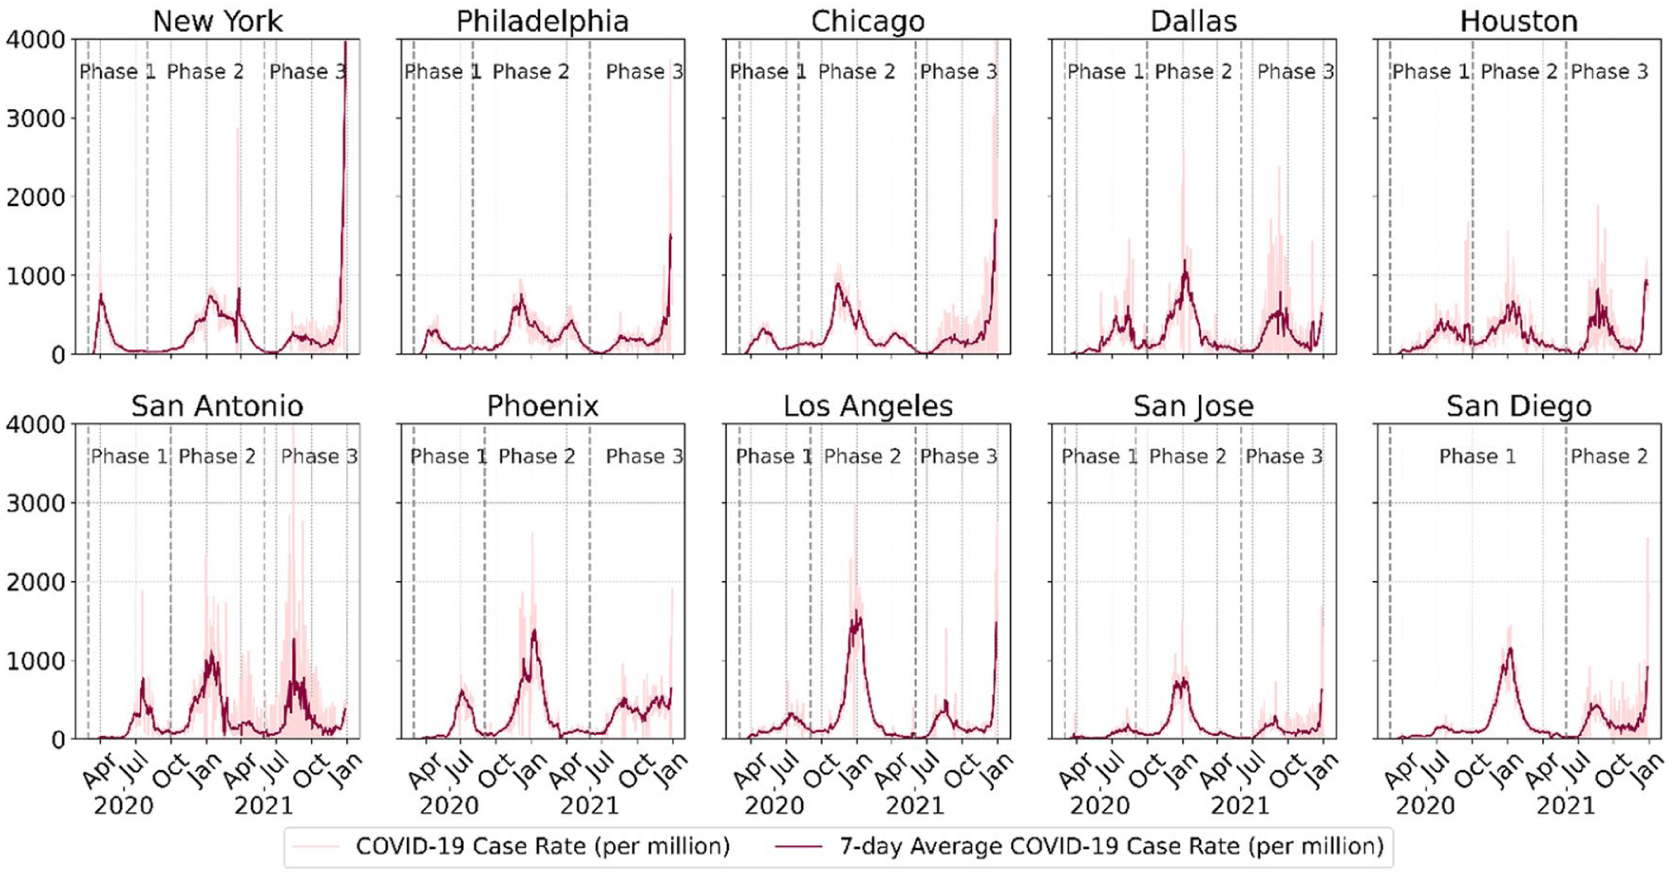
Temporal trends of COVID-19 cases in the ten cities during 2020–2021.
Effects of social-behavioral dynamics on COVID-19
This section elaborates on the results of the lagged Pearson correlations between various indicators, including daily sentiment (SAD), awareness (RAD), mobility, and policy stringency, and COVID-19 case rates across the ten cities during each pandemic phase. Figure 9 displays the lagged correlations in Phase 1 (the first outbreak). Each subfigure represents a city and shows correlations over a lag period of −25 to +25 days. Positive lags indicate that changes in case rates precede changes in the indicators, and negative lags suggest the opposite.
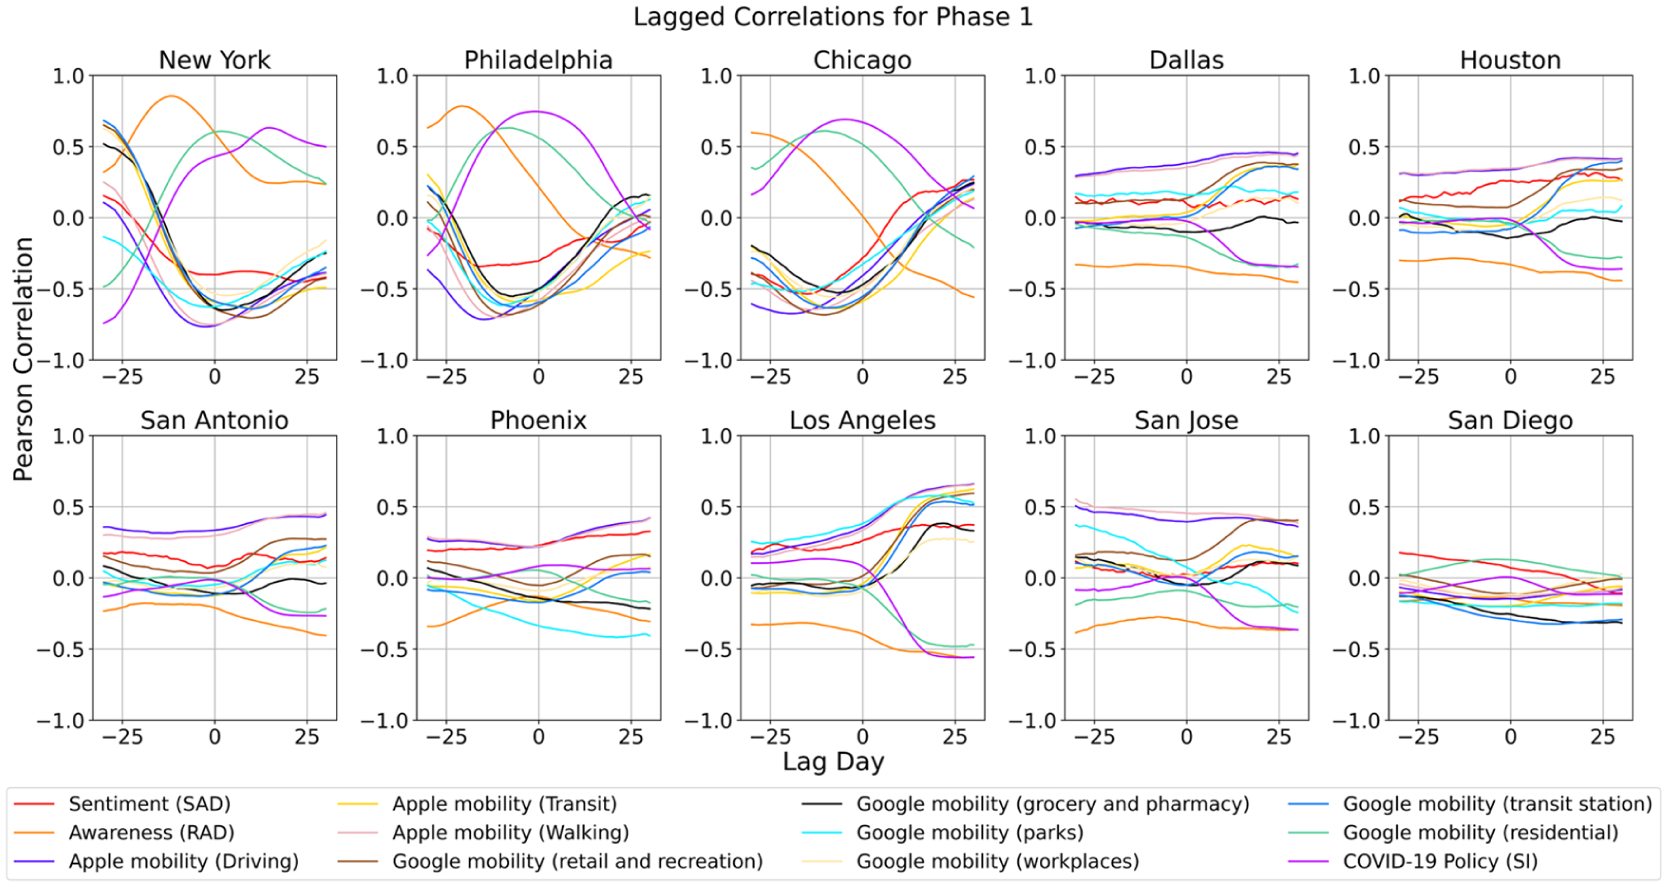
Lagged correlations between social-behavioral indicators and COVID-19 case rates in the ten U.S. cities in Phase 1.
In Phase 1, three distinct types of cities can be identified based on the detected relationships: Reactive Response Cities (New York, Philadelphia, Chicago), Proactive Response Cities (Dallas, Houston, San Antonio, Los Angeles, San Jose), and Weak-Correlation Cities (Phoenix, San Diego). In Reactive Response Cities, COVID-19 health impacts were positively correlated with previous public awareness, current or future policy measures, and previous or current residential mobility. Case rates were also negatively correlated with previous visits to all locations except residential areas, as well as mobility across all travel modes. This indicates that changes in public awareness typically occurred before subsequent increases or decreases in COVID-19 case rates. This observation aligns with previous work showing that public awareness can effectively predict early-stage COVID-19 outbreaks across multiple countries and regions (Lin et al., 2022). Meanwhile, as COVID-19 case rates rose, government policies became stricter, and people spent more time at home, and the opposite pattern was observed when case rates declined. This type of response is likely influenced by several factors, including an earlier outbreak of infections, high population density, and greater reliance on public transportation in those cities. These factors contributed to delayed social-behavioral responses, where significant changes in mobility, policy, and public awareness occurred as a reaction to rising case rates rather than as a proactive measure.
In Proactive Response Cities, public awareness, policy stringency, and time spent at home were negatively associated with future infection rates. Conversely, proportions of users expressing negative emotions, visitations to all locations except residential areas and grocery/pharmacy, and mobilities across all travel modes were positively correlated with future case rates. These relationships were more significant in Los Angeles. This suggests that COVID-19 case rates in these cities were sensitive to proactive social-behavioral changes. In other words, timely NPIs, such as heightened public awareness, stricter policies, and reduced outdoor activities, effectively helped contain the COVID-19 spread. This pattern may be linked to a later COVID-19 outbreak in these cities in Phase 1. The delayed emergence of infections allowed residents and governments to take proactive measures in advance, implementing preventive interventions rather than reacting to a rapidly worsening situation.
Figure 10 illustrates the city-level lagged Pearson correlations between social-behavioral indicators and COVID-19 case rates across nine cities during Phase 2. Compared to Phase 1, the correlations in Phase 2 are generally weaker but follow similar patterns. COVID-19 infections were positively associated with policy stringency, residential mobility, public awareness, and negative emotions on social media. Conversely, visitations to non-residential locations and commuting across all travel modes were negatively correlated with case rates. Among all variables, policy stringency exhibited the strongest positive correlation with case rates in most cities, except for Philadelphia. This suggests that as infection rates surged during the second outbreak, state governments responded by implementing stricter policies. Similarly, as infection rates began to decline, these restrictions gradually eased.
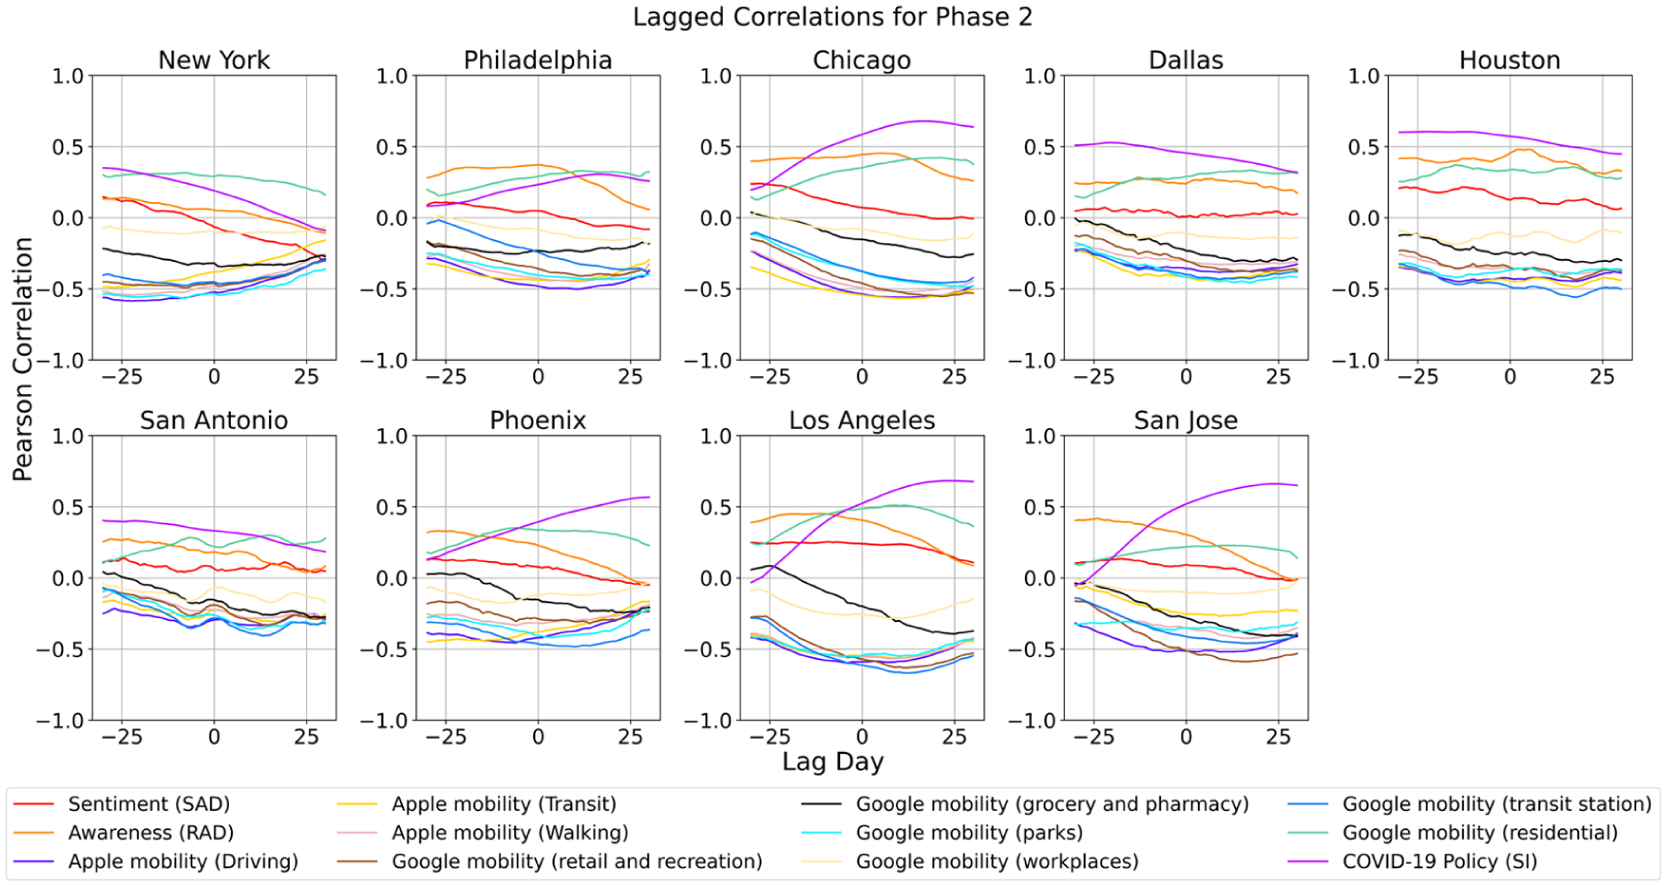
Lagged correlations between social-behavioral indicators and COVID-19 case rates in the nine U.S. cities in Phase 2.
Figure 11 illustrates lagged Pearson correlations during Phase 3 in nine cities and Phase 2 in San Diego. Overall, the relationships between mobility, policy, and public sentiment, and COVID-19 case rates weakened. It suggests that behavioral dynamics during Phase 3 were influenced by broader factors such as vaccine rollouts, public fatigue, and reduced adherence to government restrictions. Most mobility metrics remain positively correlated with COVID-19 case rates across most cities, particularly for walking, driving, and transit, indicating that more active geospatial movements would create more social interactions, thus increasing COVID-19 spread in all cities. However, these correlations are generally weaker compared to Phases 1 and 2, indicating that the direct influence of mobility on case rates diminished over time. Awareness (RAD) index exhibited significant, positive correlations with case rates during Phase 3 in all cities, especially in Philadelphia, Houston, Los Angeles, and San Diego. The Sentiment (SAD) index showed minimal correlations during Phase 3, reflecting reduced emotional responsiveness to changes in case rates. Policy stringency shows consistently negative correlations across most cities, indicating that stricter measures were implemented when case rates increased, and loose policies were in place when case rates decreased. The weakening correlations suggest that social-behavioral responses were less influential during this phase, likely due to widespread public fatigue and increasing reliance on vaccination efforts rather than restrictions on mobility and social interactions. It also indicates that pandemic-related public sentiment and risk awareness were mainly affected by factors other than COVID-19 case rates, such as economic impacts and school reopenings.
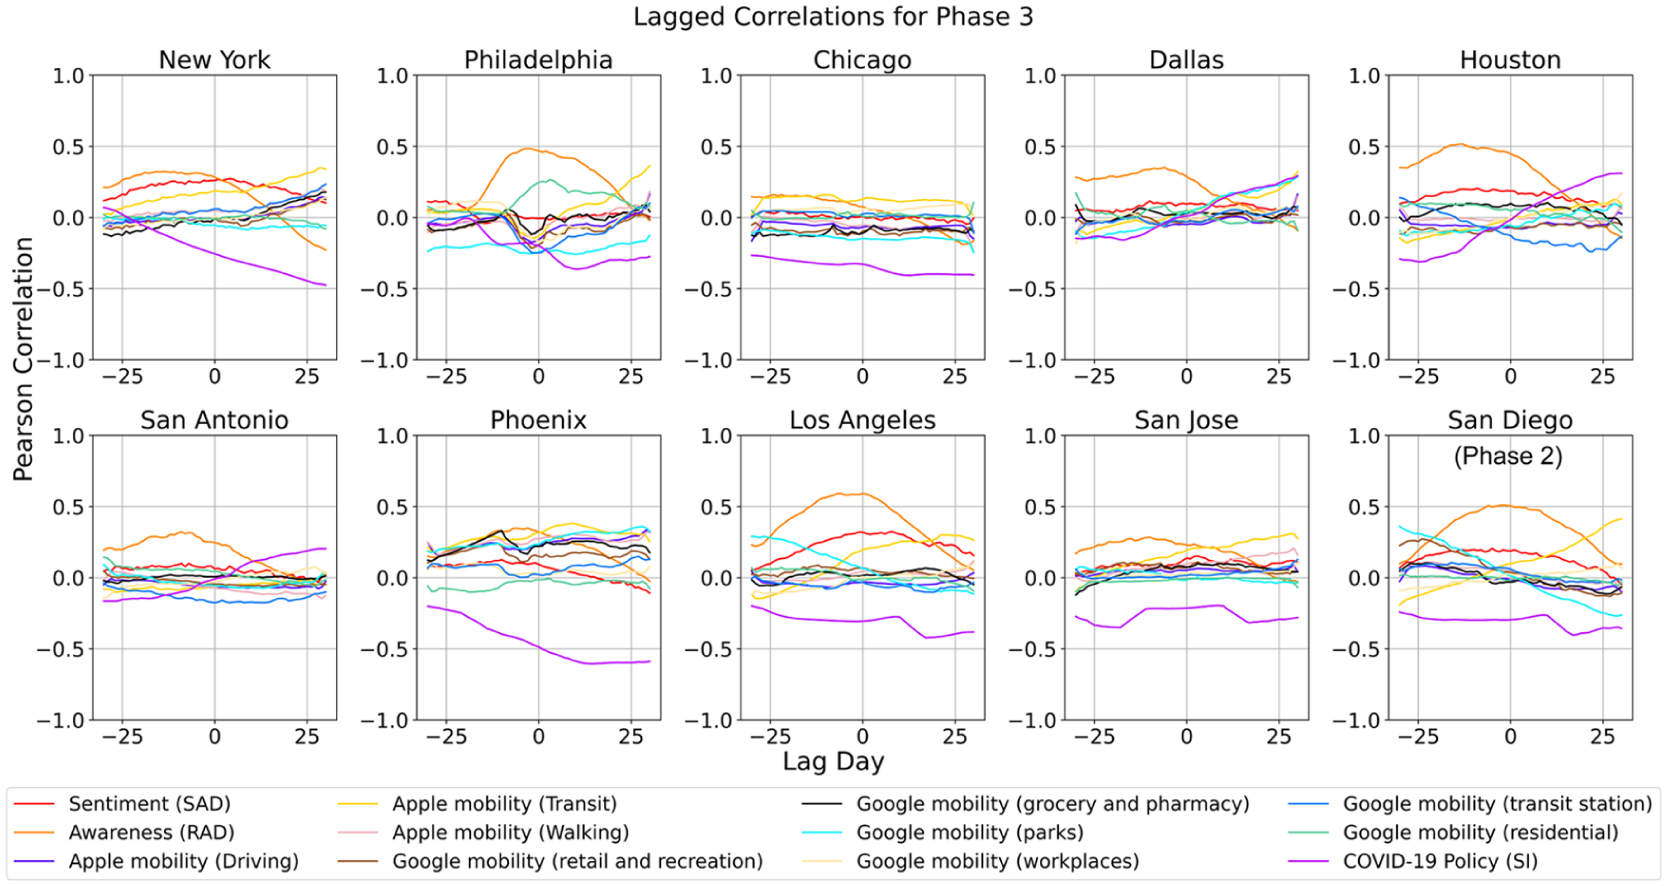
Lagged correlations between social-behavioral indicators and COVID-19 case rates in the nine U.S. cities in Phase 3 and San Diego in Phase 2.
The results across all three phases demonstrate that the effectiveness of social-behavioral dynamics in shaping COVID-19 transmission varied substantially across the ten cities and evolved over time. During Phase 1, cities experiencing early, severe outbreaks (e.g., New York, Philadelphia, Chicago) exhibited largely reactive patterns, where public awareness, mobility reductions, and policy responses followed increases in case rates. In contrast, cities with later outbreaks (e.g., Dallas, Houston, Los Angeles, San Jose) showed more proactive patterns, where increases in awareness, stronger policies, and reduced mobility were associated with lower future case rates, suggesting that timely behavioral and policy interventions were effective in mitigating spread. These differences highlight the potential impacts of outbreak timing, demographic structure, and urban form in shaping responsiveness. By Phase 2 and Phase 3, the impact of social-behavioral indicators weakened across most cities, reflecting a shift in public and governmental responses as communities adapted to prolonged pandemic conditions, relying more on vaccination and less on mobility restrictions or emotional responses online. Overall, awareness and mobility signals were most predictive in the early stages, while policy stringency remained consistently associated with case trends across phases. These findings suggest that early, coordinated behavioral and policy actions are most effective, and their influence diminishes as the pandemic progresses and adaptive behaviors become normalized.
Discussion
Key findings and implications
This study examines the spatiotemporal disparities in social-behavioral dynamics and their interactions with COVID-19 case rates in the ten most populous U.S. cities during 2020–2021. By integrating social media data, human mobility metrics, and policy stringency indexes, this study provides a comprehensive assessment of how public awareness, emotional responses, mobility, and government policies evolved over different phases of the pandemic and how these factors influenced or responded to COVID-19 transmission.
One of the primary findings is the existence of distinct city-level response patterns in the initial pandemic outbreak, which can be broadly categorized into three types: Reactive Response Cities, Proactive Response Cities, and Weak-Correlation Cities. In Reactive Response Cities, increases in COVID-19 case rates triggered stricter policies and extended time spent at home, suggesting a reactionary approach where behavioral changes and policy interventions followed infection surges. The correlation patterns indicate that policy measures were largely reactive, reinforcing the idea that governmental responses in these cities were driven by public health crises rather than proactive pandemic control. Conversely, Proactive Response Cities exhibited an inverse relationship, where increased public awareness, policy strictness, and reduced mobility preceded declines in COVID-19 case rates. This suggests that NPIs in these cities played a preventive role, helping to contain transmission before infections reached critical levels. These findings highlight the importance of timely public health messaging and proactive mobility restrictions in controlling pandemic spread when vaccinations are unavailable.
The study also reveals phase-dependent changes in social-pandemic interactions. During Phase 1 (early pandemic outbreak), strong correlations emerged between policy stringency, awareness, mobility restrictions, and infection rates, reflecting strict lockdown measures and widespread behavioral shifts in response to the sudden health crisis. In Phase 2 (mid-pandemic), these correlations weakened slightly, suggesting a gradual adaptation to pandemic conditions, with mobility patterns and policy measures fluctuating in response to evolving case rates. By Phase 3 (late 2021), the relationships between social behaviors and infection rates were considerably weaker, likely due to vaccination rollouts, pandemic fatigue, and declining policy enforcement. The diminishing correlations suggest that, by late 2021, individual choices and external factors (e.g., vaccines, natural immunity) became more influential than government mandates in shaping public behavior.
These findings have significant implications for pandemic preparedness and response strategies. First, the effectiveness of proactive policies in controlling future case rates highlights the importance of early public health messaging and timely NPIs in mitigating pandemic impacts in the initial outbreak phase. Governments could prioritize data-driven decision-making by continuously monitoring public awareness, sentiment, mobility trends, and compliance levels to adjust policies dynamically. Second, the observed city-level disparities emphasize the need for localized interventions rather than one-size-fits-all approaches. Cities with high population density and reliance on public transportation (e.g., New York, Chicago) may require more stringent early interventions, whereas less dense cities may benefit from targeted risk communication and voluntary compliance measures. Lastly, as seen in Phase 3, the decline in policy effectiveness suggests that pandemic control efforts should integrate vaccination strategies with behavioral interventions, ensuring that reliance on NPIs is gradually reduced while maintaining effective disease containment.
Limitations and future research directions
While this study offers valuable insights into the dynamics of COVID-19 spread and social-behavioral responses, several limitations exist and require further investigations. First, the reliance on geospatial big data introduces potential biases in representation. Mobility data from Google and Apple predominantly reflect smartphone users, which may not capture the behaviors of populations without access to such technology. Similarly, sentiment and awareness indexes derived from social media platforms like X/Twitter may overrepresent individuals active online, limiting the generalizability of findings to the broader population.
Second, the temporal and spatial resolution of the data may influence the strength of observed correlations. The lagged Pearson correlation analysis assumes uniformity in the relationship between indicators and case rates across all cities and phases, potentially oversimplifying complex temporal and geographic dynamics. Future studies could benefit from more sophisticated modeling approaches, such as dynamic time warping or machine learning techniques, to capture non-linear, context-specific, and temporally evolving relationships between indicators and pandemic outcomes.
Another limitation lies in the reactive nature of policy stringency measures. While this study captures the relationship between policy interventions and case rates, it does not account for the time it takes for policies to influence public behavior and subsequent case trends. Additionally, the COVID-19 policy index aggregates multiple measures, which may obscure the specific effects of individual policies, such as mask mandates or business closures. Disaggregating policy measures and exploring their individual impacts on social-behavioral dynamics and case rates could provide more actionable insights for policymakers.
The study also does not fully account for external factors that may influence correlations, such as vaccination rates, the emergence of new variants, or healthcare capacity. These factors likely played a significant role during the pandemic, especially in Phase 3, where the weakening correlations between mobility, sentiment, and case rates suggest a shift in the drivers of pandemic dynamics. Collecting and incorporating additional datasets, such as vaccination coverage, variant prevalence, and hospitalizations, could enhance the robustness of future analyses and provide a more comprehensive understanding of pandemic drivers. Concurrently, future research should examine the interdependencies among dynamic indicators, including the co-evolution of awareness, sentiment, mobility, policies, and related factors, as well as their potential lagged or bidirectional relationships. Such analysis would enable a more integrated understanding of social-behavioral dynamics and support the development of more comprehensive modeling frameworks. Recent work has begun to explore these interactions at broader geospatial scales, such as state-level analyses in the United States (Lin et al., 2024a).
Lastly, expanding the scope of analysis beyond the ten U.S. cities could provide a more comprehensive or even global perspective on the interplay between social behavior, policy measures, and pandemic dynamics. Cross-country comparisons could identify cultural, economic, and policy factors that influence the effectiveness of interventions, offering valuable lessons for future pandemics. Additionally, investigating long-term behavioral changes post-pandemic could shed light on how societal norms and mobility patterns evolve in response to prolonged crises.
Conclusion
This study integrates multi-source geospatial big data, including social media, smartphone-based mobility, policy evaluations, and crowdsourced infection data, to delineate the long-term (two-year) social-behavioral dynamics and health impacts during the COVID-19 pandemic. A framework and a set of indexes were developed to monitor public responses, identify regional disparities, and assess the effectiveness of policy interventions. Using this framework, we computed the public awareness, sentiment, mobility, policy, and health impacts from 2020 to 2021 across ten major U.S. cities. The trends and disparities in social-behavioral dynamics among the ten cities were explored. We also examined the lagged correlations between social-behavioral dynamics and COVID-19 health impacts across different pandemic phases throughout the two years.
The findings of this study emphasize the crucial role of social-behavioral dynamics in shaping pandemic trajectories and highlight the need for timely, adaptive, and context-sensitive public health strategies. The observed regional variability in the correlation between mobility, sentiment, policy, and case rates underscores the importance of tailored interventions that account for local conditions. Densely populated cities with higher reliance on public transit exhibited stronger links between mobility and infection rates, necessitating mobility-focused measures, while cities with weaker correlations may benefit more from targeted public communication strategies. Moreover, the findings stress the importance of early intervention. Heightened public awareness, restrictions, and reduced mobility preceded infection surges were more effective in curbing COVID-19 transmission than reactive responses. This highlights the necessity of real-time monitoring of public behaviors, sentiment trends, and mobility patterns to facilitate data-driven decision-making. Additionally, the diminishing effectiveness of mobility restrictions and NPIs over time points to the need for complementary long-term strategies beyond traditional restrictions. While lockdowns and social distancing were vital in the early pandemic stages, their efficacy declined as public fatigue increased and vaccination efforts expanded. Therefore, future pandemic responses should integrate NPIs with broader resilience measures, including vaccination campaigns, targeted risk communication, and economic support policies, to ensure sustained public compliance and minimize long-term societal disruptions. These insights lay the foundation for future research and policymaking, emphasizing the need for integrated data-driven approaches to enhance pandemic preparedness and public health resilience.
While this study offers valuable insights, several limitations must be acknowledged, including the inherent biases within geospatial big data, the limited study area sizes, the challenges in inferring causality through lagged correlation analyses, and the lack of accounting for vaccination effects. Future research could prioritize (1) mitigating the biases within geospatial big data to enhance their representativeness in quantifying social-behavioral dynamics, (2) employing causal inference techniques, such as time-series modeling and structural equation modeling, to help disentangle the direct and indirect effects of behavioral dynamics on pandemic outcomes, (3) including additional factors, e.g., vaccination coverage, in modeling the pandemic spread, and (4) including more cities and countries to uncover the similarities and differences in the interactions between social behavioral dynamics and pandemic health impacts. Despite the limitations, this study demonstrates the value of geospatial big data in understanding and managing pandemics. The insights gained provide a foundation for improving public health responses in future crises, emphasizing the need for adaptive strategies that integrate behavioral, policy, and epidemiological data to effectively mitigate the impacts of infectious disease outbreaks.
Footnotes
Funding
This study is based on work supported by three grants, including (1) the 2020 Data Resource Develop Program Award from the Texas A&M Institute of Data Science (TAMIDS), (2) Collaborative Research: HNDS-I: Cyberinfrastructure for Human Dynamics and Resilience Research from the U.S. National Science Foundation (Award No.: 2318206), and (3) the 2022 Prairie View A&M University (PVAMU) and Texas A&M University Joint Panther Research and Innovation for Scholarly Excellence (PRISE) Research Grant. Any opinions, findings, and conclusions or recommendations expressed in this material are those of the authors and do not necessarily reflect the views of the funding agencies.
Declaration of conflicting interests
The authors declared no potential conflicts of interest with respect to the research, authorship, and/or publication of this article.