
Abstract
Against the backdrop of increasingly prevalent global urban shrinkage, shrinking cities face challenges such as population loss, fiscal pressure, and imbalanced public service provision. The spatial configuration of living service facilities directly impacts residents’ well-being, but these microscale spatial mechanisms within shrinking cities remain underexplored. This study investigates Hegang, a typical shrinking city in Northeast China, using POI data, census data, and road networks. Through kernel density analysis, location quotients, network analysis, and bivariate spatial autocorrelation, the distribution, supply-demand matching, and accessibility of living service facilities at the subdistrict level were evaluated. Results show that 75% of Hegang’s subdistricts experienced population loss between 2010 and 2020, creating a “central growth, peripheral shrinkage” pattern. Shrinking subdistricts exhibit a “high density-low accessibility” paradox. Location quotient analysis reveals oversupply in shrinking subdistricts and undersupply in growing subdistricts. Bivariate spatial autocorrelation analysis indicates a negative correlation between accessibility and population density for most facilities, with 29.4% of subdistricts facing a supply-demand imbalance. This study reveals significant mismatches between facility configuration and resident needs in shrinking cities, providing a theoretical basis and practical guidance for “smart shrinkage” planning, helping to optimize resource allocation and enhance urban livability and sustainable development capacity.
Introduction
Public service facilities are fundamental guarantees for the normal functioning of urban areas and residents’ quality of life (Li et al., 2021), with their rational configuration directly related to people’s welfare and social equity. In recent years, under the influence of multiple factors such as globalization, industrial restructuring, and demographic changes, urban shrinkage has become increasingly common (Liu and Liu, 2022; Reis et al., 2016), emerging as an important topic in international urban research (Martinez-Fernandez et al., 2012). Shrinking cities typically experience population loss (Sun et al., 2024), declining economic vitality (Wiechmann and Pallagst, 2012), and increased local fiscal pressure (Wang et al., 2020), posing severe challenges to the planning, construction, operation, and maintenance of public service facilities (Li et al., 2024; Sousa and Pinho, 2015; Wang and Xu, 2025). Living service facilities, as a subset of public service facilities meeting residents’ basic daily needs, encompass various aspects including commercial, medical, educational, cultural, and leisure services. Their spatial distribution, equity, and accessibility directly affect residents’ sense of gain, happiness, and security, serving as important benchmarks for measuring urban livability (Zhan et al., 2018).
Existing research on urban shrinkage initially focused on measurement (Cao et al., 2024; Meng and Long, 2022), influencing factors analysis (Gao et al., 2021; Zhang et al., 2024), and macro-effect assessment (Lauf et al., 2016; Rieniets, 2009), with relatively insufficient exploration of internal spatial structure evolution and microscopic mechanisms. In recent years, some studies have begun to examine the impact of urban shrinkage on the internal built environment and resident welfare (Hu et al., 2023; Jiang and Sun, 2024; Ma et al., 2022), but conclusions remain inconsistent. One perspective suggests that economic recession and fiscal difficulties resulting from shrinkage weaken public service provision capabilities, causing facility aging, service quality decline, and spatial mismatches, ultimately reducing residents’ life satisfaction and potentially triggering a vicious cycle (Fol, 2012; Liu and Sun, 2023; Wang and Xu, 2025). Another perspective argues that population reduction may alleviate pressure on existing facilities, increase per capita resource occupation, improve issues such as traffic congestion, and thereby enhance resident experience to some extent (Fu et al., 2022; Haase et al., 2014). However, these discussions mostly remain at the macro-level empirical analysis or logical reasoning, lacking fine-grained empirical validation of the spatial configuration of multiple living service facilities closely related to residents’ lives within shrinking cities.
Research on the spatial configuration of living service facilities has theoretically evolved from location theory, pursuing optimal efficiency (Celik Turkoglu and Erol Genevois, 2020; DeVerteuil, 2000), to spatial interaction theory, emphasizing fairness and justice (Hosseini et al., 2022; Jian et al., 2020). Accessibility, as a core concept, is widely used to evaluate the convenience of residents’ access to services. Methodologically, with the application of GIS technology and big data (especially POI data), spatial analysis methods such as kernel density analysis and network analysis have become increasingly mature, providing more refined tools for research (Rong et al., 2020; Zhang et al., 2023a, 2023b). Nevertheless, existing research still has some limitations: first, in terms of research objects, many focus on single types of public service facilities (such as medical, sports, cultural), with insufficient attention to living service facilities that meet residents’ comprehensive daily needs. Second, regarding research areas, many concentrate on rapidly urbanizing regions, with relatively scarce research on facility configuration issues in shrinking cities as a special territorial type.
Hegang City, as a typical resource-depleted shrinking city in Northeast China (Long and Zhang, 2021; Wang et al., 2022), provides a representative case for studying the configuration characteristics and challenges of living service facilities under shrinkage conditions due to its background of continuous population outflow and economic structure transformation. Different areas within the city show variations during the shrinkage process, with some areas experiencing severe population loss while others potentially attracting population inflow due to factors such as housing prices. This process of population spatial restructuring may have significant contradictions with the relatively lagging facility layout adjustments. Therefore, in-depth exploration of the spatial distribution pattern, resource allocation equity, and accessibility of living service facilities in Hegang City, revealing their spatial coupling relationship with population shrinkage/growth within the city, has important theoretical and practical significance for understanding the operational mechanisms of shrinking cities, optimizing resource allocation, and enhancing governance capabilities. This study aims to systematically evaluate the current configuration of living service facilities at the subdistrict level in Hegang City through the comprehensive application of multi-source data integration and spatial analysis methods, identifying existing problems and challenges, to provide a scientific basis and decision-making reference for “smart shrinkage” and sustainable development of shrinking cities.
Study area, data, and methods
Study area
Hegang City is located in the northeast of Heilongjiang Province and is a typical shrinking city caused by resource depletion. It is currently transforming from a national energy industrial city to an “industrial transformation demonstration city and an ecological, harmonious, livable city.” The city administers two border counties (Suibin and Luobei) and six municipal districts (Dongshan, Xing’an Road, Xiangyang, Gongnong, Nanshan, and Xingshan), covering an area of 14,700 square kilometers. As of November 1, 2020, the city had a total population of 891,000, a decrease of 167,394 people (15.81%) compared to the 1,059,000 recorded in the sixth national census in 2010, with an average annual growth rate of −1.71%. Against the backdrop of urban shrinkage, the supply-demand contradictions of living service facilities in Hegang City have become increasingly prominent. In China’s administrative hierarchy, subdistrict is the fundamental unit of urban governance and community management, with clear administrative functions and service provision responsibilities. Therefore, this paper uses subdistricts as the minimum scale for research, with the research scope being the municipal districts of Hegang City, selecting 32 subdistricts in the municipal districts as the research area (Figure 1). The research area has a total population of 498,000, accounting for 56% of Hegang City’s total population, with a relatively high population concentration and more complete living service facilities. Due to missing data for four subdistricts (Gongrencun, Lingbei, Hedong Road, and Junde Road), the kernel density analysis and network analysis in this study selected the remaining 28 subdistricts as the research area.
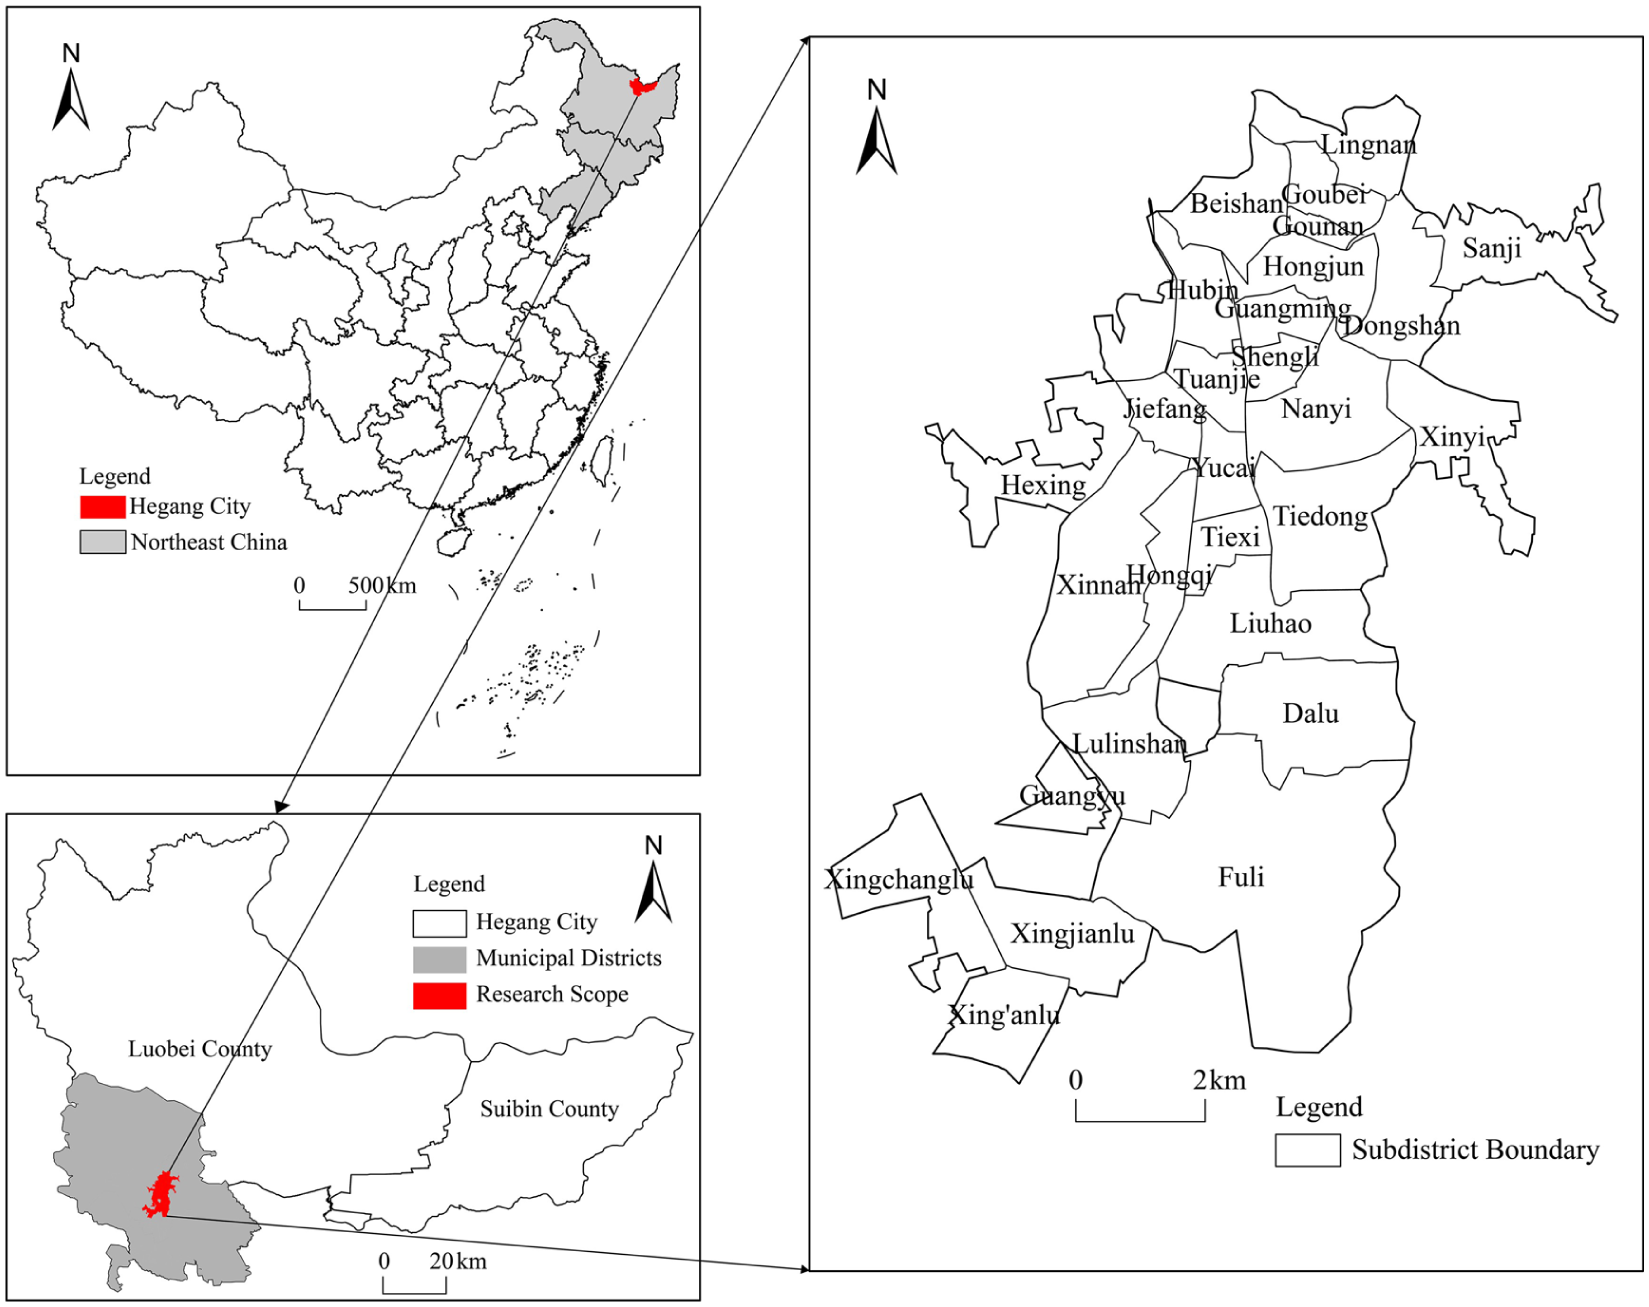
Location map of the study area.
Data
Population data
The population data for 2010 and 2020 in this paper were selected from the sixth and seventh “China Population Census Data by Township, Town, and Subdistrict”, with subdistrict-level resident population figures used as the basis for determining shrinkage.
Living service facilities POI data
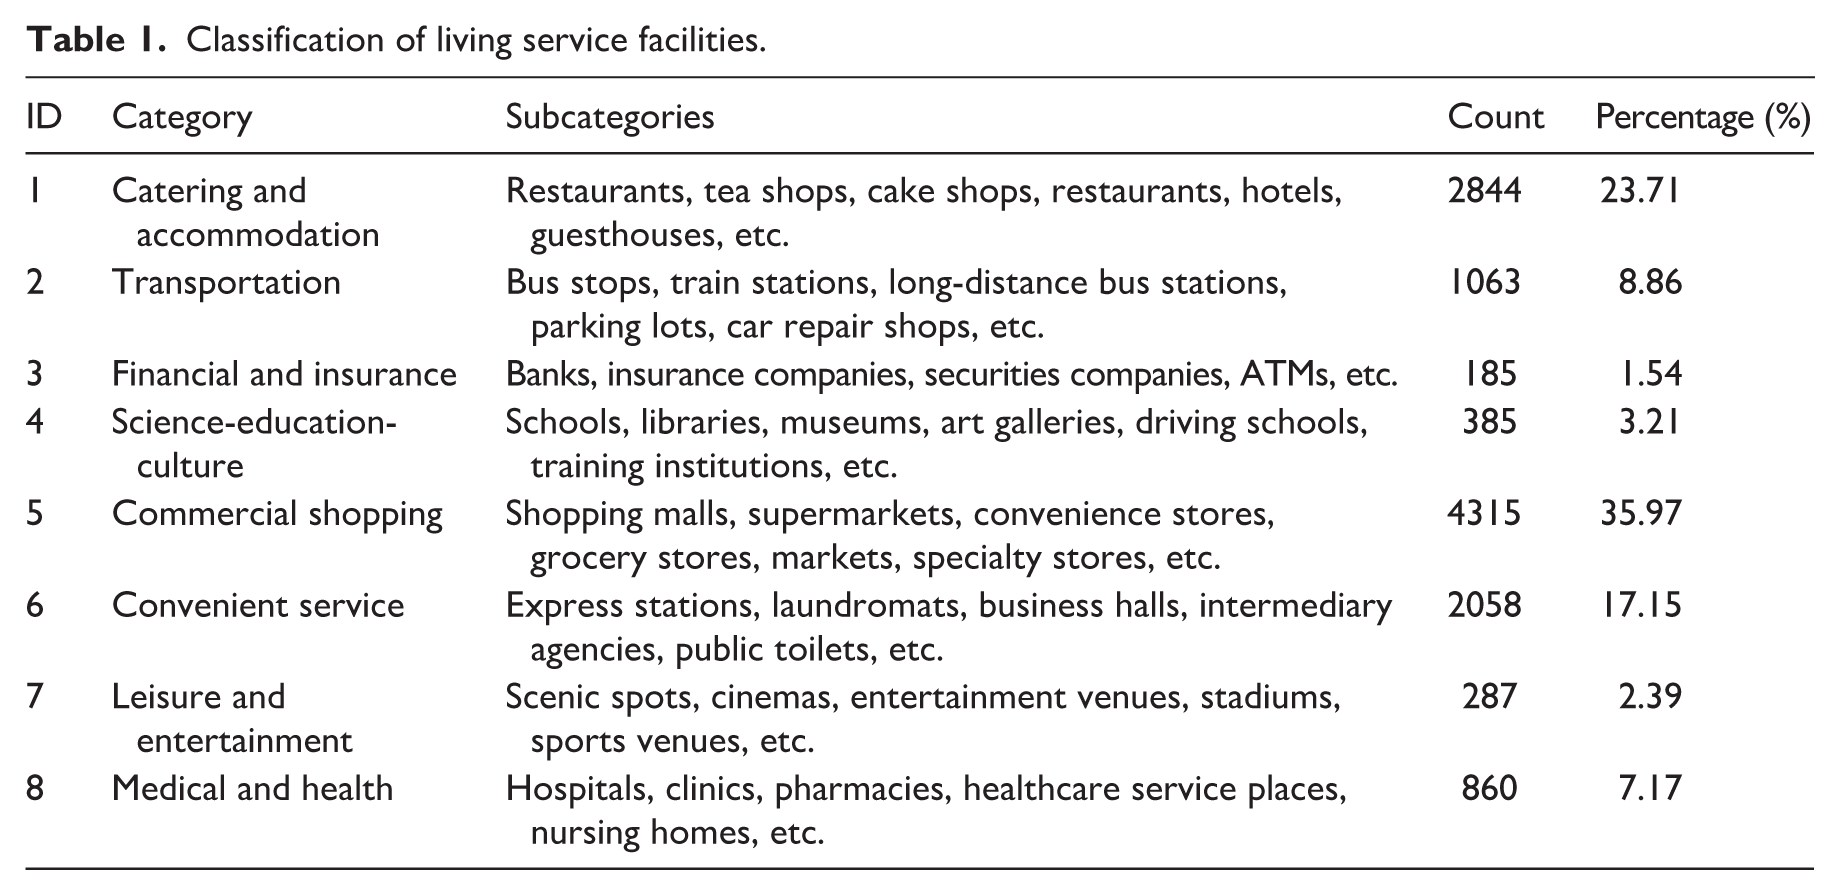
The Points of Interest (POI) data for public service facilities used in this paper were obtained from the Amap open platform, acquiring POI data for public service facilities in Hegang City as of November 2024. The data attributes include name, type, address, latitude, and longitude, etc. Based on research experience and combined with actual conditions, the cleaned, deduplicated, and filtered public facility POI data were recategorized into eight types related to residents’ lives: medical and health, science-education-culture, commercial shopping, leisure and entertainment, transportation, convenient service, catering and accommodation, and finance and insurance (Table 1).
Classification of living service facilities.
Residential community data
The 2024 residential community data were sourced from the Anjuke website (https://hegang.anjuke.com/). The original data included community addresses, geographic coordinates, affiliated business districts, the total number of households, and other information. Based on research needs, invalid information was removed, retaining fields such as community name and geographic coordinates. Considering the incompleteness of the crawled data, this paper supplemented the data with commercial residential POIs from the public facility POI data. After organization and consolidation, the residential community data totaled 438 entries.
Road network data
The 2024 road network data were sourced from OpenSubdistrictMap (OSM), an open-source map database covering road networks, public service facilities, rivers, buildings, and various other geographic features. These can be downloaded from websites such as the OSM official website, Planet OSM, and Geofabrik based on different needs and scenarios. This paper chose to freely download the latest road network data for Heilongjiang Province from the Geofabrik website (https://download.geofabrik.de/asia/china.html), clipping the downloaded road network data using the administrative boundaries of the research area and preprocessing it. 1. Filtering: Urban road networks were extracted by attributes in ArcGIS 10.8, filtering out roads irrelevant to walking, such as motorways, trunk, and trunk links. 2. Topological processing: First, all road networks were merged. Second, intersecting lines were broken using advanced editing; finally, topological rules such as “must not have dangling points,” “must not have pseudo nodes,” and “must not overlap” were set in the newly created feature dataset to perform topological error checking and correction on the road network. 3. Building network dataset: A foot_speed field was added, with the speed attribute set to 80m/min, and a network dataset was constructed, selecting WGS_1984_UTM_Zone_52N as the projection coordinate system based on the latitude and longitude range of the research area.
Methods
Urban shrinkage identification
With population change as the most significant indicator of urban shrinkage, this study follows existing identification methods and calculation processes (Tong et al., 2022), using the change in resident population as a basis for identifying urban shrinkage. The calculation formula is as follows:

where
Kernel density analysis
Kernel density analysis is a spatial statistical method that converts discrete, abstract point data into intuitive continuous density surfaces to analyze the degree of spatial clustering of data (Shi et al., 2020). This paper mainly uses the kernel density analysis tool in ArcGIS to reveal the spatial clustering characteristics of POI data points of various living service facilities. Higher kernel density values indicate higher degrees of clustering. The specific calculation formula is as follows:
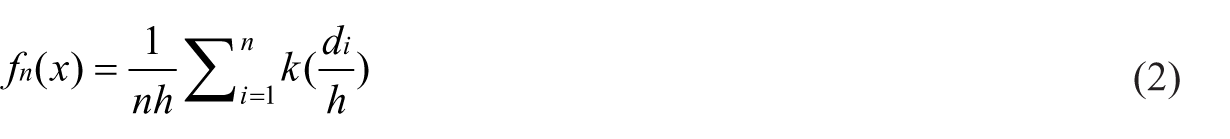
where f(x) is the kernel density function at point x; h is the distance decay threshold from point x to the center point; n is the sample size; di is the distance between the estimated point x and the sample observation point xi; K is the spatial weight constant.
Service pressure and location quotient calculation
To evaluate the service pressure status of living service facilities in each subdistrict under the background of urban shrinkage, this study introduces the location quotient index as a core measurement tool. This study applies it to facility service pressure assessment, reflecting the relative balance between facility supply and population demand by comparing the per capita facility level within a subdistrict to the average level within the research area. The location quotient calculation formula is as follows:
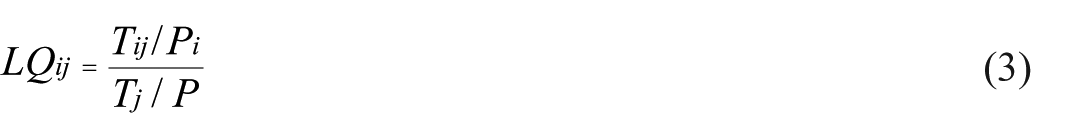
where
Facility accessibility measurement
Network analysis is a method for conducting spatial analysis based on real road networks to measure the accessibility of target facilities. This paper creates an OD cost matrix in the network analysis module, loading residential communities as starting points and various public service facilities as destination points, calculating the cost time for residents to travel from communities to individual public service facilities within a certain travel threshold (minutes) based on the urban transportation network (Vale, 2020). The total time from each community to public service facility points is summarized, and the average time obtained by dividing the total time by the number of facility points is used as the standard for judging the accessibility of public service facilities, with shorter times indicating better accessibility of residential communities. To facilitate analysis, the spatial join tool is used to connect each community to its subdistrict, and the average time from subdistricts to public service facility points is calculated to conduct discussions at the subdistrict level. In this study, the travel threshold is set to 15 minutes based on several considerations. First, this aligns with Hegang City’s planning objectives: according to the “Hegang City Spatial Master Plan (2021–2035),” the city will focus on optimizing the layout of the central urban area and actively promoting the construction of “15-minute” community life circles, a concept widely adopted in China’s urban planning policy. Second, given that this study focuses on revealing overall facility mismatch patterns under urban shrinkage rather than microscale variations, a unified 15-minute threshold enables systematic comparative analysis across different facility types and subdistrict types, facilitating the identification of macro-level spatial restructuring characteristics and supply-demand imbalances.
Bivariate spatial autocorrelation analysis
Bivariate spatial autocorrelation, compared to traditional spatial autocorrelation, describes the spatial correlation between different types of elements and is divided into bivariate global spatial autocorrelation and bivariate local spatial autocorrelation (Qiao and Huang, 2022). Among them, bivariate global autocorrelation is generally represented by Moran’s scatter plot. This study inversely processes and normalizes the accessibility of various living service facilities and population density, connects them to the subdistrict vector layer, and inputs them as the first and second variables into the Geoda software. After setting the distance spatial weight of the variables, spatial correlation analysis is conducted. The calculation formula is as follows:
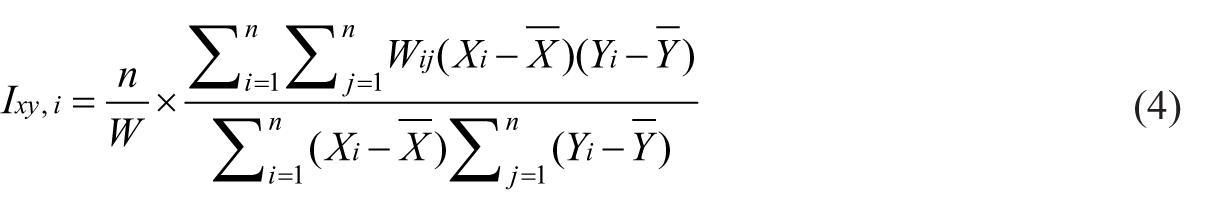
To further analyze the correlation between variables across subdistricts and to compensate for the lack of description of internal differences within subdistricts in global spatial autocorrelation, this study combines the LISA cluster map obtained from bivariate local spatial autocorrelation analysis to perform differential refinement analysis. The calculation formula for bivariate local spatial autocorrelation is as follows:
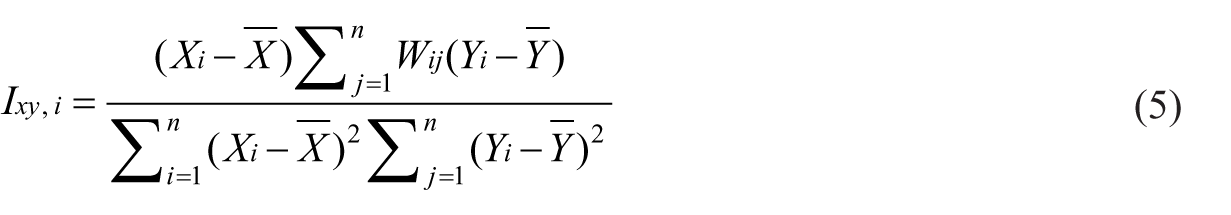
where Ixy represents the global Moran’s I for facility accessibility and population density, with a value range of [-1,1]. When Ixy> 0, it indicates a positive correlation between the two variables, with stronger positive correlation as it approaches 1; when Ixy< 0, it indicates a negative correlation between the two variables, with stronger negative correlation as it approaches −1; when Ixy= 0, it indicates no correlation between the two variables. Ixy,i is the local Moran’s I (LISA) obtained from bivariate local spatial autocorrelation analysis, used to represent the spatial clustering pattern of facility accessibility and population density. When Ixy,i> 0, the LISA map shows “high-high” or “low-low” clustering types; when Ixy,i< 0, it shows “high-low” or “low-high” clustering types. n is the number of subdistricts; Wij is a spatial weight matrix established based on distance; W is the sum of all elements in the spatial weight matrix, i.e.,
Results
Spatial characteristics of urban shrinkage
Based on population census data from 2010 to 2020, according to formula (1), calculations were made on the population shrinkage situation in 28 subdistricts within the municipal districts of Hegang City, and visualization of the shrinkage status was achieved using ArcGIS 10.8 software (Figure 2). The results show that population shrinkage in the municipal districts of Hegang City is relatively widespread. Among the 28 subdistricts involved in the study, as many as 21 subdistricts (75%) experienced negative population growth during this period and were identified as shrinking subdistricts; only eight subdistricts (25%) showed population growth, classified as growing subdistricts. There were seven subdistricts each with population change rates between −20% to 0 and −40% to −20%, accounting for two-thirds of the total; another subdistrict had a decline between 40% and 60%, and as many as six subdistricts had declines exceeding 60%, indicating severe population loss in some areas. From a spatial perspective, growing subdistricts generally show a scattered distribution, but there is a clear concentrated distribution in the central part of the municipal districts (such as in some subdistricts of Xiangyang District and Gongnong District); shrinking subdistricts are widely distributed throughout the entire research area, especially in the northern region (such as in some subdistricts of Xing’an District and Xingshan District), showing significant contiguous clustering characteristics. This spatial pattern reflects the uneven development within the city—even in a generally shrinking city, there may be areas of population growth or relative stability internally, forming differentiated population dynamics between the center and periphery, and between different sectors.
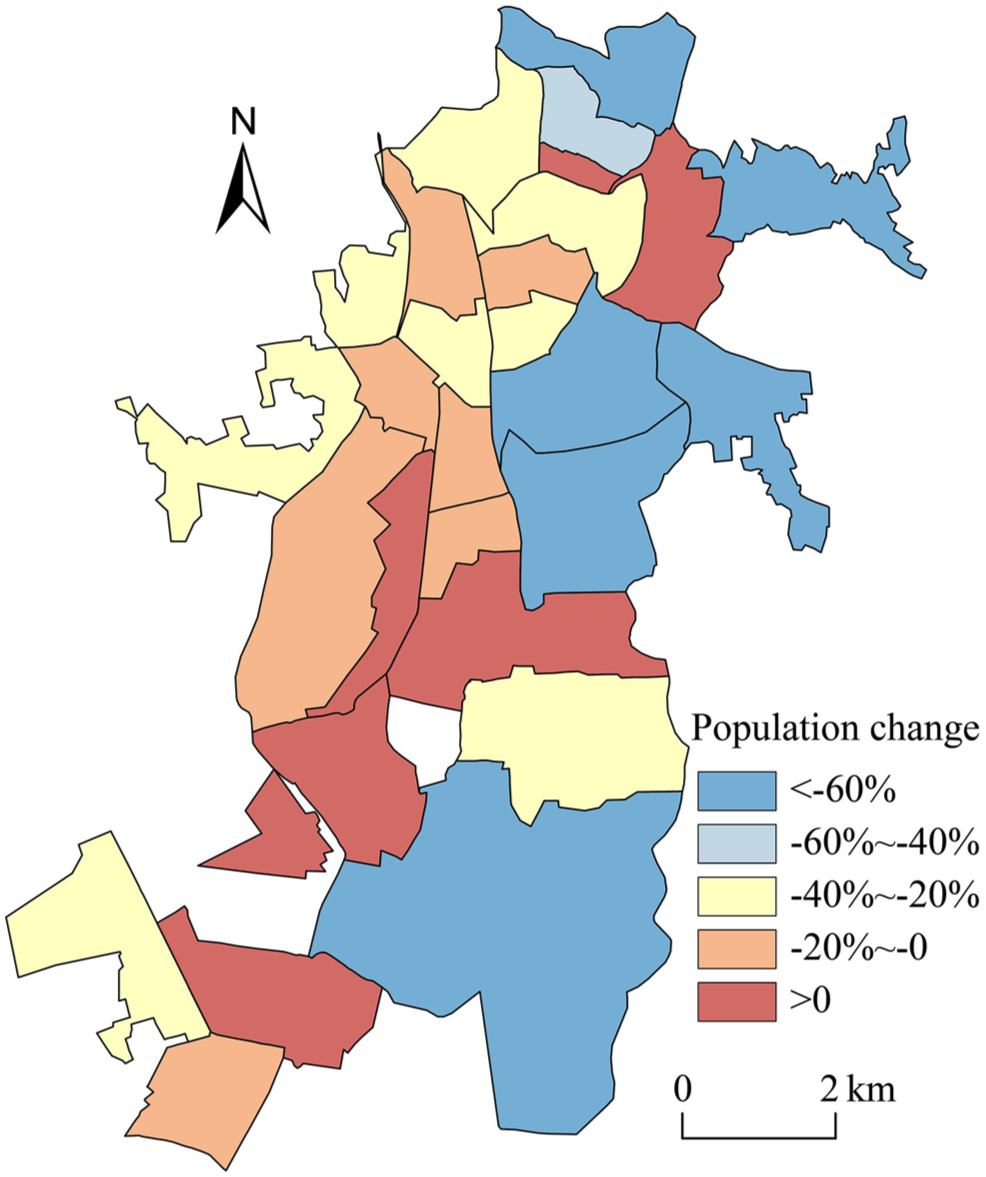
Subdistrict population change rate.
Spatial distribution characteristics of basic living service facilities
Using the kernel density tool, the spatial distribution characteristics of various living service facilities in the research area were analyzed. As shown in Figure 3, overall, the distribution of various facilities exhibits a “core-periphery” structural characteristic. Highly concentrated core areas of facilities are mainly located in traditional central subdistricts in the central part of the city, such as Jiefang Subdistrict, Tuanjie, Yucai Subdistrict, etc., which are typically commercially prosperous and historically established areas. Relatively speaking, subdistricts located in the peripheral areas of Dongshan District, Nanshan District, Xing’an District, and Xingshan District have sparsely distributed facility points and generally low kernel density values, forming the peripheral areas of facility distribution.
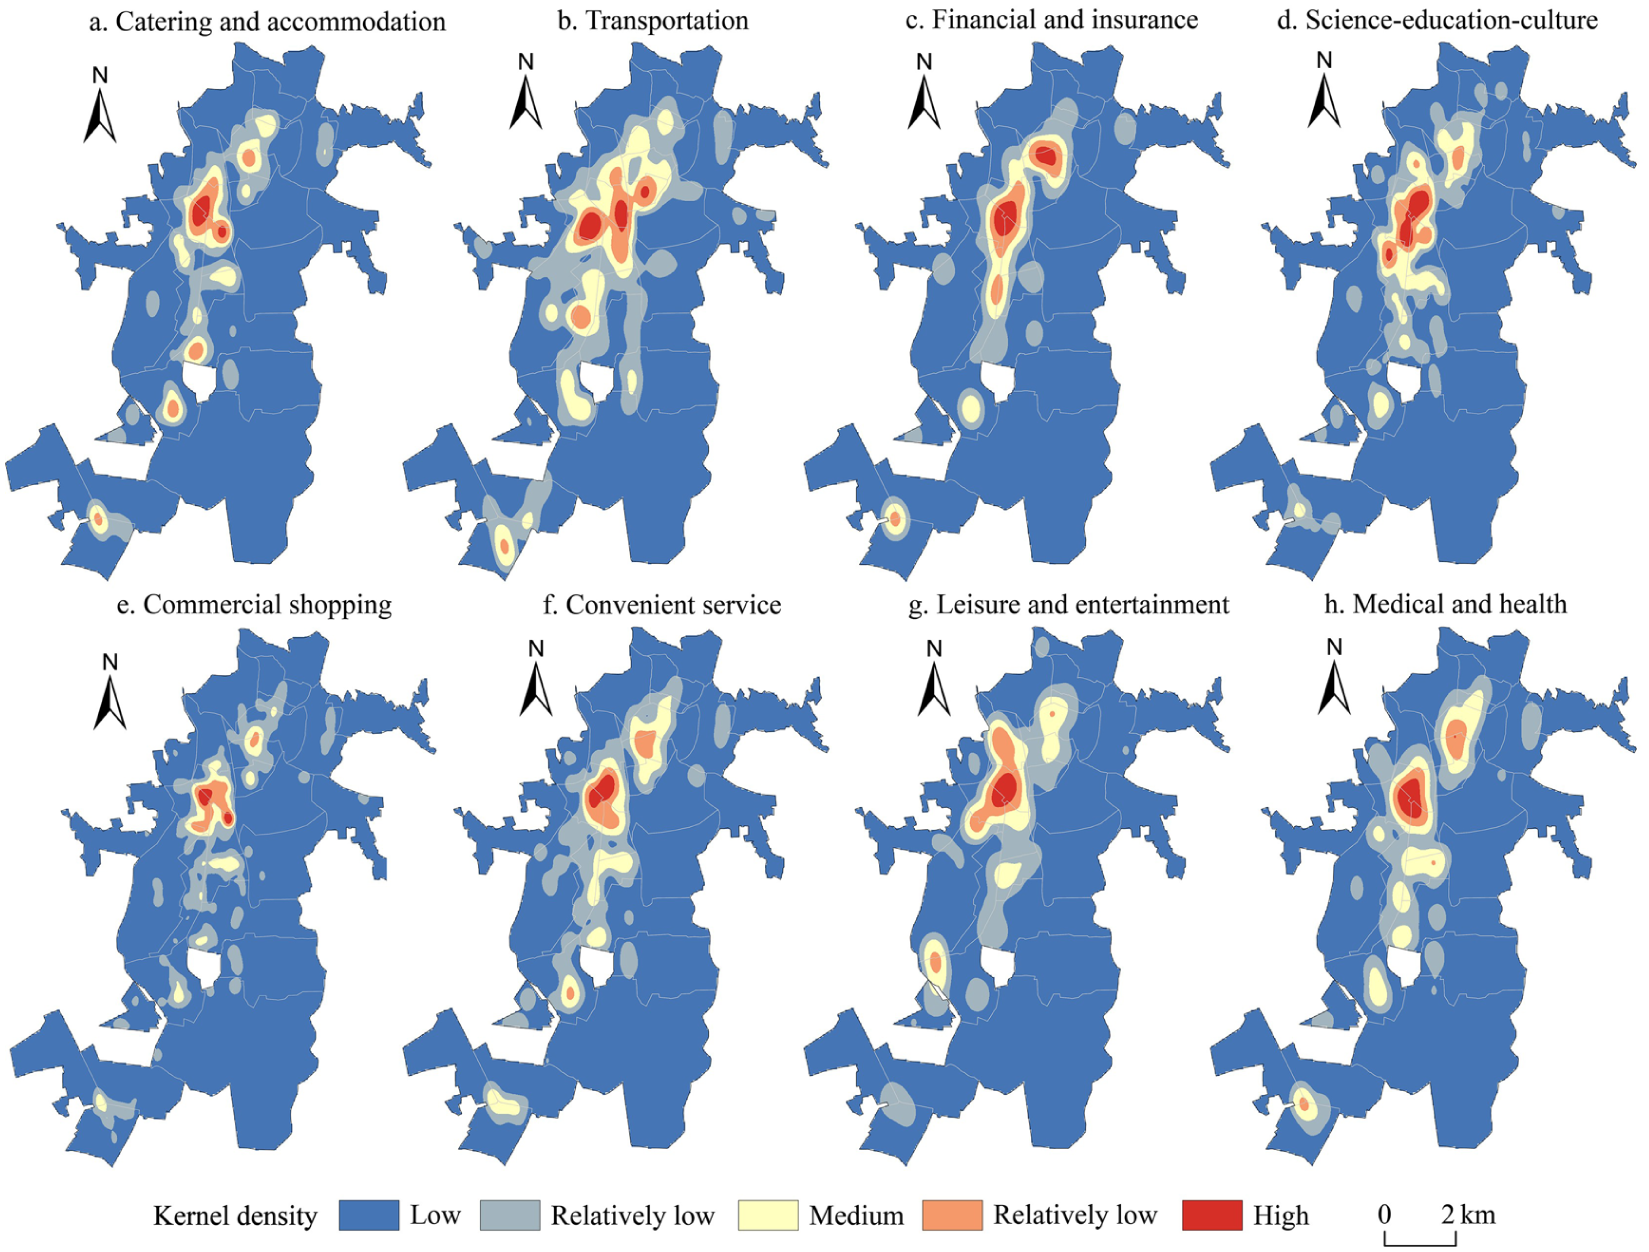
Kernel density distribution of various facilities. (a) Catering and accommodation. (b) Transportation. (c) Finance and insurance. (d) Science-education-culture. (e) Commercial shopping. (f) Convenient service. (g) Leisure and entertainment. (h) Medical and health.
Specifically, looking at different types of facilities: Catering and accommodation facilities exhibit a “one main core with multiple secondary cores” distribution characteristic, with high-value concentration areas distributed in Jiefang, Tuanjie, Yucai Subdistrict, and small-scale concentrations in other subdistricts such as Guangming and Lulinshan Subdistrict. Transportation facilities show a “three cores + contiguous” large-scale concentration in the northwest, with small-scale concentrations in Hongqi and Xing’an Road Subdistrict. Overall, transportation facilities have a relatively low concentration degree but the widest radiation range. Finance and insurance facilities have the highest spatial concentration, with high-density concentration areas located at the intersection of Gongnong District and Xiangyang District’s core subdistricts and extending north and south, while other subdistricts generally have fewer finance and insurance facilities. Science-education-culture facilities show multi-center concentration in the city center, with small, high-value areas appearing in subdistricts like Xinnan Subdistrict. Commercial shopping facilities have the lowest concentration degree, with high concentration areas still appearing in the city center and medium concentration areas sporadically distributed without forming contiguous areas. Convenient service facilities form high-value concentration areas in Tuanjie and Jiefang Subdistrict, and a relatively high concentration area in Guangming Subdistrict, with spatial distribution patterns similar to catering and accommodation facilities. Leisure and entertainment facilities are relatively few and concentrated in the central city area, with small-scale extensions towards Hubin Subdistrict and Xinnan Subdistrict, and small-scale concentrations appearing in the northern part of Lulinshan Subdistrict. Medical and health facilities, besides showing “single-core” high kernel density values in Jiefang, Tuanjie, and Yucai Subdistrict, also exhibit “multi-core” medium kernel density concentrations in areas such as Tiexi and Liuhao Subdistrict.
In summary, the spatial distribution of living service facilities in the research area shows significant spatial clustering and regional differentiation characteristics. Notably, areas with higher facility density are often economically developed old city district subdistricts with significant population shrinkage, while other shrinking subdistricts and population growth subdistricts generally have lower facility density, with facilities particularly insufficient in the peripheral subdistricts of the research area.
Facility resource allocation equity analysis based on location quotient
To assess the equity of facility resource allocation among different subdistricts, the location quotient index was introduced for calculation, and the natural breaks method was used to divide the location quotient levels of various subdistricts into five grades, thereby examining the fairness of resource allocation of various living service facilities based on location quotient grades.
From a spatial pattern perspective (Figure 4), the location quotient values generally exhibit a “center high, periphery low” core-periphery layered structure. High location quotient areas are concentrated in central-city areas such as Tuanjie and Jiefang Subdistrict, indicating that these subdistricts have per capita facility ownership higher than the city average. Low-value areas are widely distributed in peripheral urban areas such as Xingjian Road, Fuli, Dalu, and Sanjie Subdistrict, where per capita facility allocation is relatively insufficient. Looking at different facility types, finance and insurance facilities have the lowest location quotient, showing the most significant spatial imbalance in their allocation; transportation facilities and leisure and entertainment facilities have relatively high location quotients, with relatively balanced allocation; while catering and accommodation, medical and health, science-education-culture, commercial shopping, convenient service, and other facilities closely related to residents’ daily lives all have overall location quotients less than 1, indicating a general relative insufficiency in per capita allocation of these basic facilities throughout the research area. This unbalanced state of facility allocation not only reflects the unfairness of resource distribution in the urban shrinkage process but also reveals the lag in urban functional space restructuring, i.e., facility layout has not been able to respond promptly to spatial changes in population, leading to reduced resource allocation efficiency.
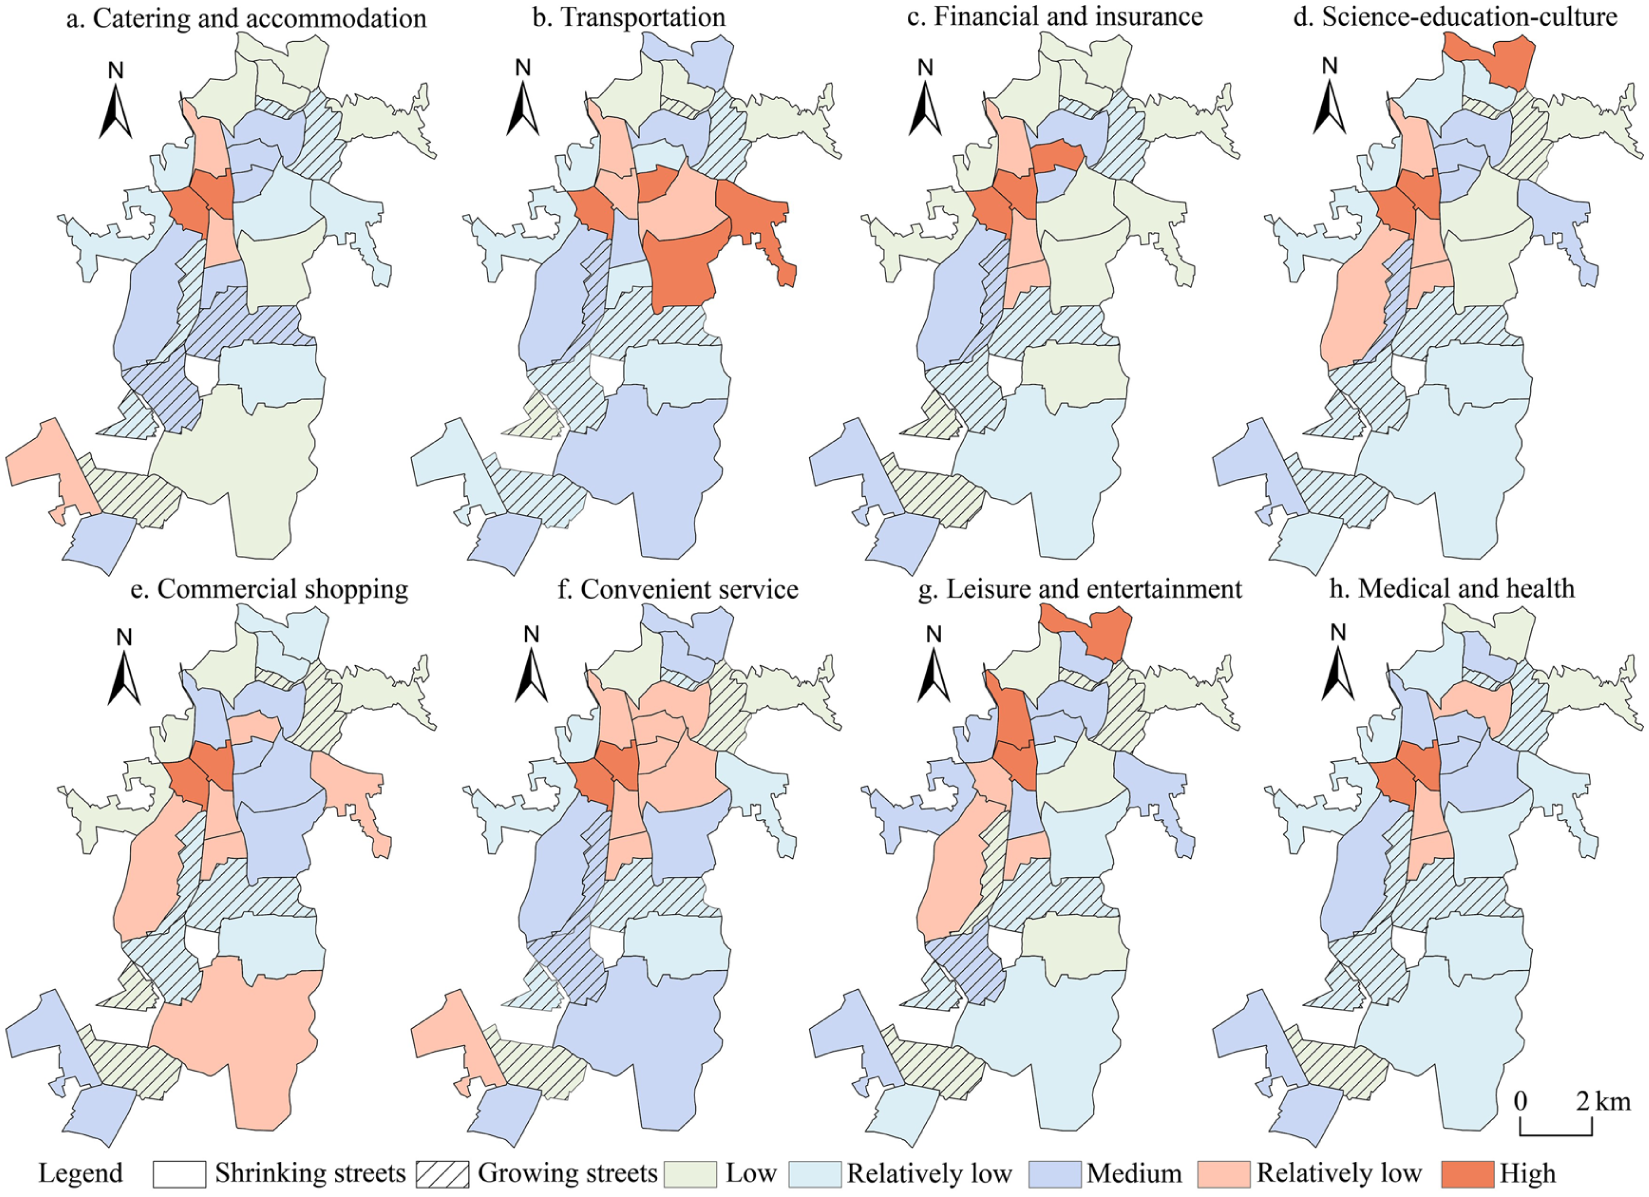
Location quotient level of facilities. (a) Catering and accommodation. (b) Transportation. (c) Financial and insurance. (d) Science-education-culture. (e) Commercial shopping. (f) Convenient service. (g) Leisure and entertainment. (h) Medical and health.
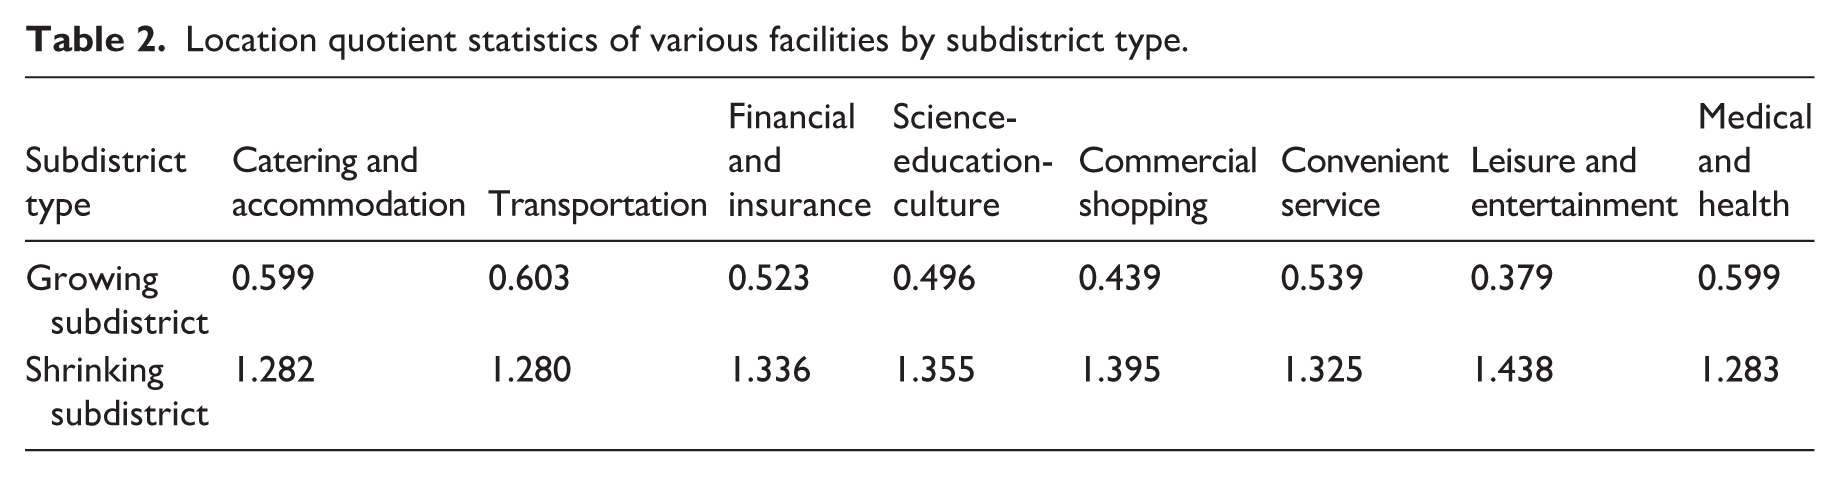
From the perspective of differentiation between growth and shrinkage (Table 2), there exists a serious imbalance in the spatial allocation of living service facility resources within the two types of subdistricts. Among them, the location quotient levels of various facilities in growing subdistricts are all lower than those in shrinking subdistricts, indicating a serious shortage of facility resources; while shrinking subdistricts all have location quotients greater than 1, indicating that their facility allocation is higher than the average level in the area, showing a condition where supply exceeds demand. This unbalanced state not only reflects the fairness imbalance of resource allocation in the urban shrinkage process but also reveals the lag in urban functional space restructuring, i.e., facility layout adjustments have not been able to keep pace with population changes, leading to reduced resource allocation efficiency.
Location quotient statistics of various facilities by subdistrict type.
Facility accessibility analysis based on network analysis
Using the network analysis method, with a 15-minute walking time threshold, the average accessibility time from residential points to various living service facilities in each subdistrict was measured (Table 3). The results show that there are differences in accessibility among different types of facilities, with commercial shopping facilities having the highest accessibility (shortest average time) and finance and insurance facilities having the lowest accessibility (longest average time). However, overall, except for finance and insurance, the average subdistrict accessibility times for the other seven types of facilities are mostly concentrated in the 8~9 minute range, with relatively small absolute differences. Nevertheless, by comparing the accessibility of different types of subdistricts, it was found that the accessibility of living service facilities in growing subdistricts is generally better than in shrinking subdistricts.
Accessibility of each facilities.
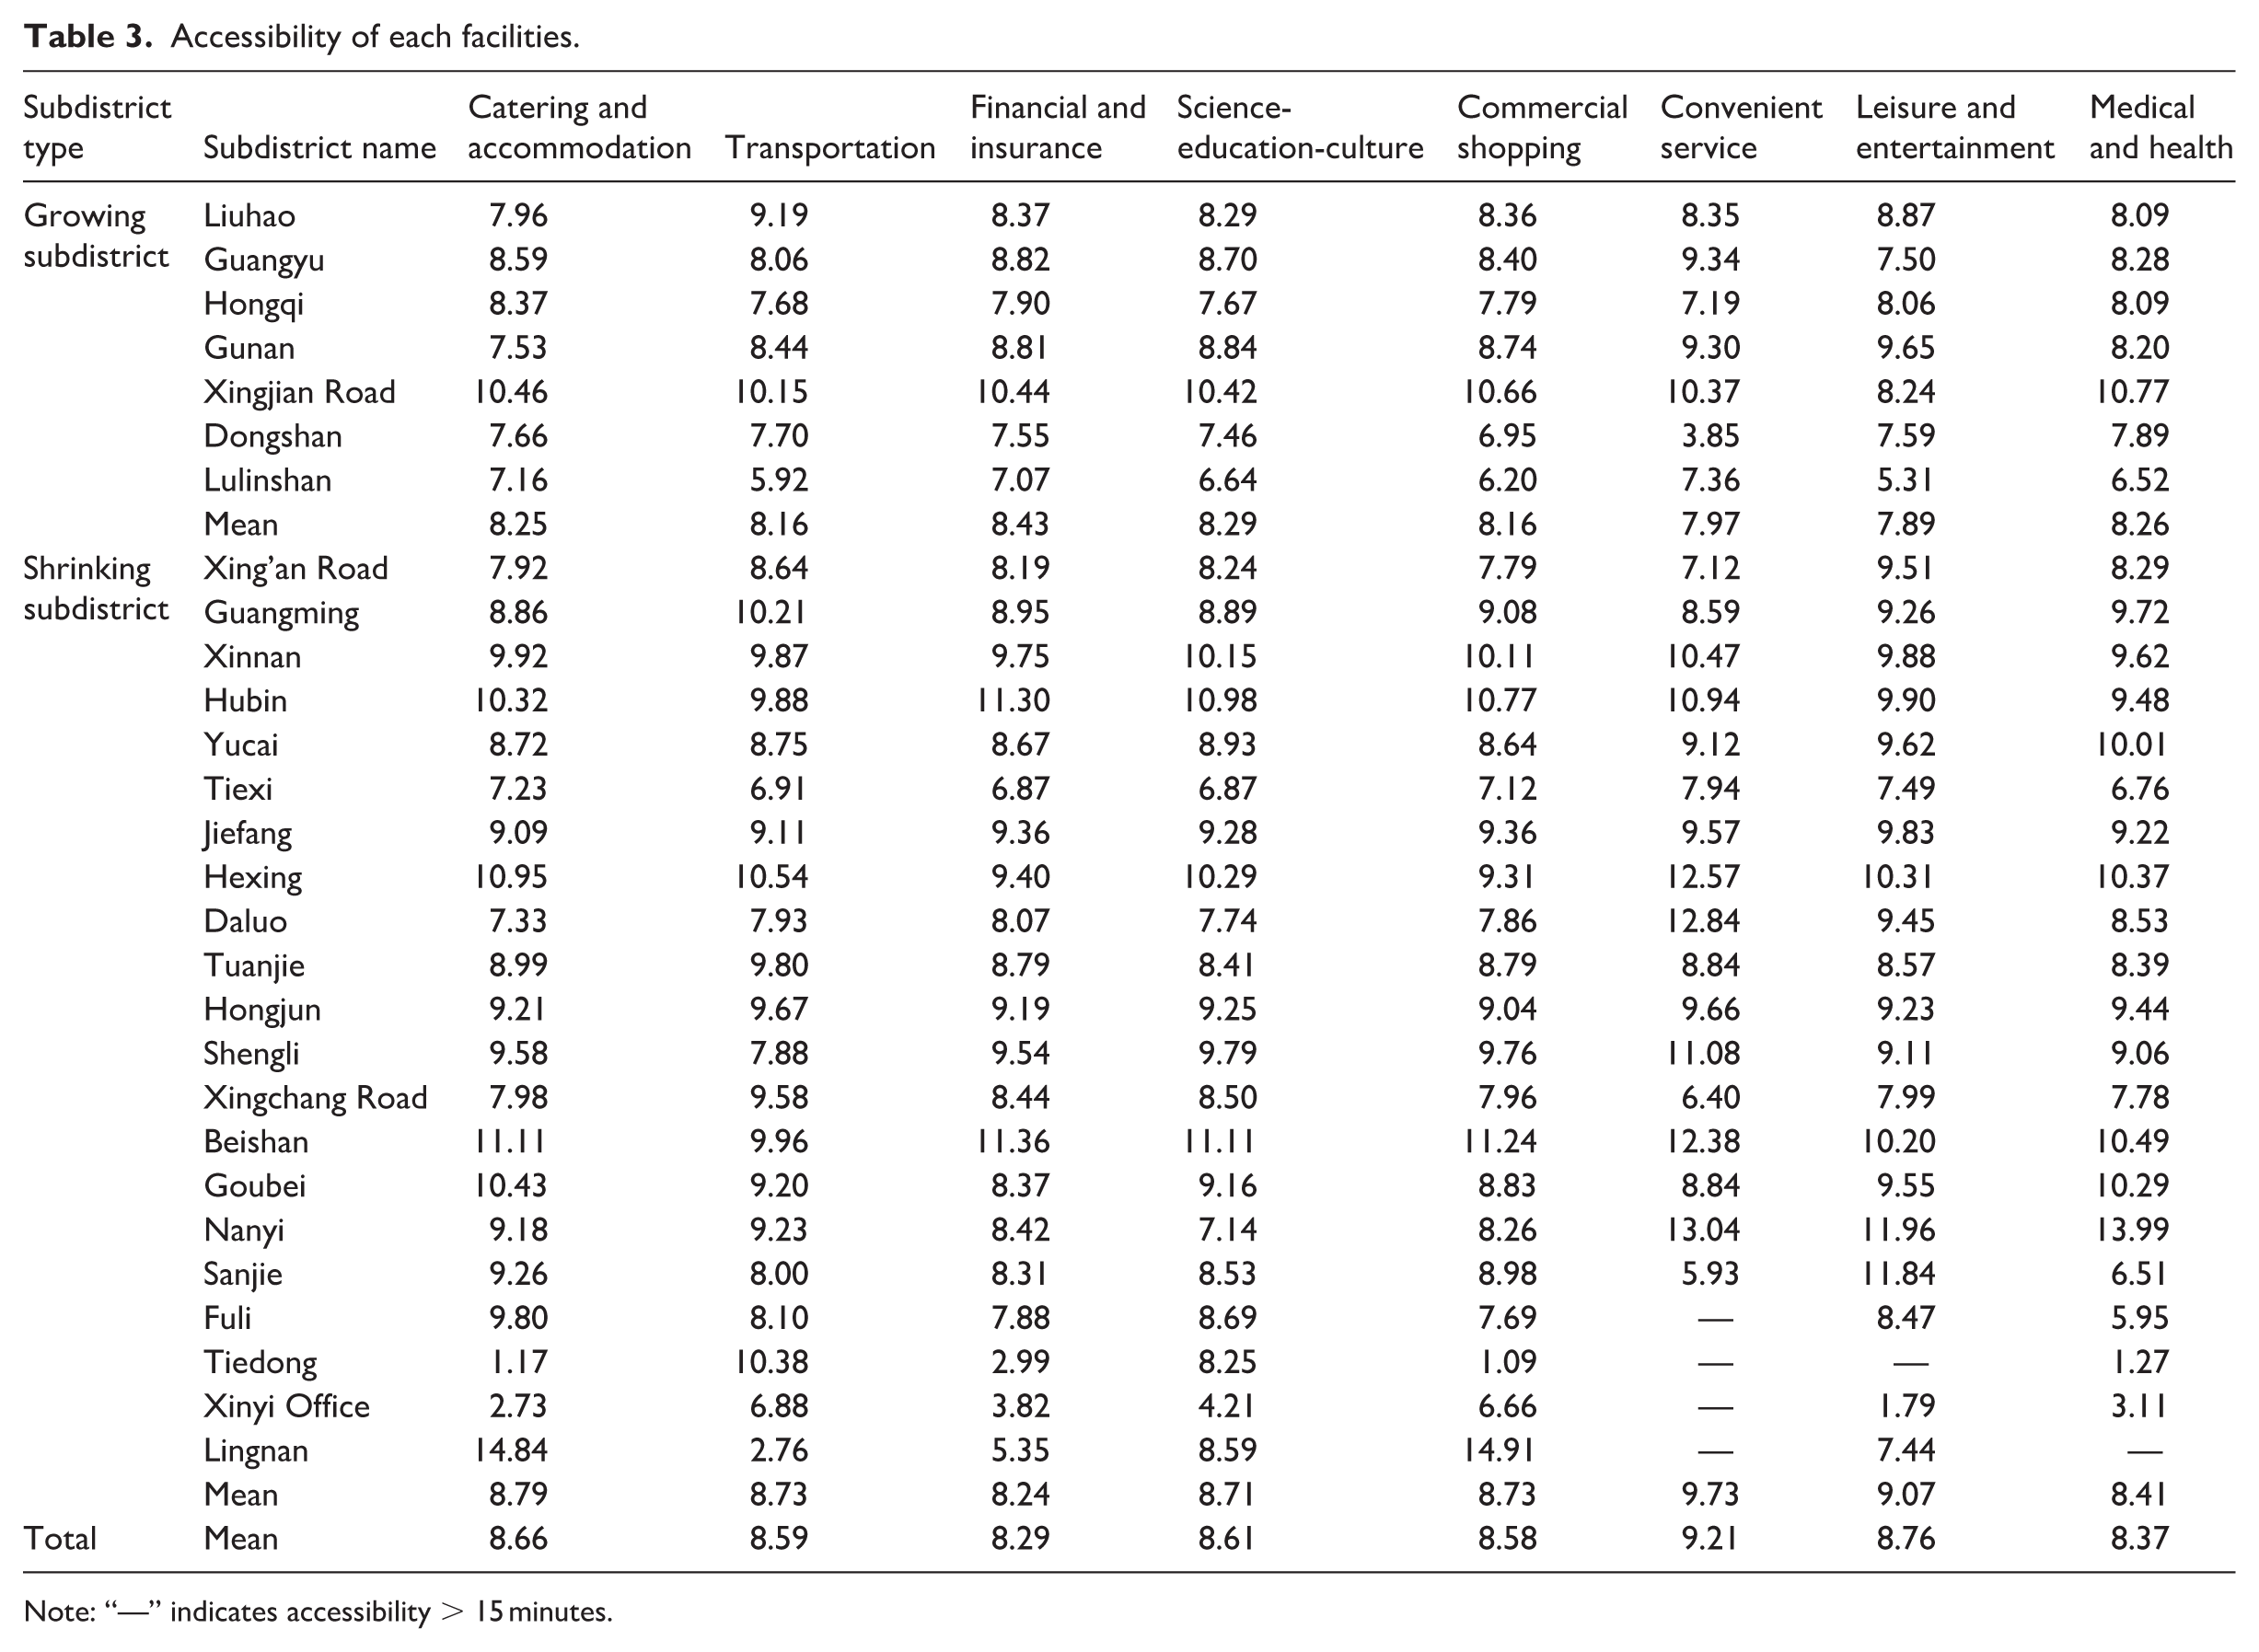
Note: “—” indicates accessibility > 15 minutes.
Specifically, the accessibility differences between growing and shrinking subdistricts are particularly noticeable for finance and insurance and science-education-culture facilities, with growing subdistricts having significantly better accessibility. This may be related to the relatively active economic activities in growth areas, increased demand for financial services, and the fact that financial and insurance facilities represented by banks and insurance companies have industry characteristics such as professionalism, centralization, and sensitivity to the economic environment. Consequently, the layout of financial institution outlets has been optimized accordingly, thereby improving accessibility. Science-education-culture facilities such as schools and libraries are mainly government-led and lack the flexibility of market mechanism adjustments, resulting in their spatial layout adjustments lagging behind population spatial restructuring and failing to adjust in a timely manner. Additionally, some subdistricts have unreasonable spatial matching relationships between scattered residential communities and centralized science-education-culture facilities, leading to low facility accessibility, such as in Guangming Subdistrict. Furthermore, for facilities with limited numbers, the transportation network also significantly affects accessibility. The sparse road network in the southern part of Xinnan Subdistrict reduces residents’ convenience in accessing science-education-culture facilities.
The situation regarding medical and health facilities is more complex, with good accessibility in some growing subdistricts and some shrinking subdistricts (such as Tiexi Subdistrict, which has transformed from an industrial zone), while some traditional shrinking subdistricts in old urban areas (such as Jiefang and Hubin Subdistricts), despite historically rich medical resources, may have experienced decreases in actual medical convenience due to factors such as intensified aging populations, outflow of young populations and quality medical resources, resulting in relatively low accessibility, gradually forming a passive situation of “high-density facilities—low service quality—high aging population.”
Leisure and entertainment facilities are mainly concentrated in shrinking subdistricts in the city center, and although their density is high, the accessibility is poor due to spatial mismatches with existing residential areas. Taking Hubin Subdistrict as an example, leisure and entertainment facilities are concentrated in the northwestern of the subdistrict, while residential communities are located in the southern of the subdistrict and gradually extend eastward, with facility layouts maintaining the old state and failing to achieve precise matching with residents’ needs in space.
Transportation facilities show good accessibility in some growing subdistricts (such as Lulinshan Subdistrict) and some shrinking subdistricts (such as Tiexi Subdistrict), but some shrinking subdistricts located in core areas (such as Guangming and Tuanjie Subdistrict) may have reduced resident travel efficiency and deteriorated accessibility due to reasons such as public transport route adjustments and station mergers or closures. The accessibility differences for catering and accommodation, and convenient service facilities between the two types of subdistricts are relatively small. Commercial shopping facilities, due to their high degree of marketization, flexible point layout, and large numbers, have the smallest accessibility gap, with shrinking subdistricts even slightly better.
Overall, the research results reveal a key phenomenon: many shrinking subdistricts with higher facility density have lower accessibility than growing subdistricts with lower facility density, forming a “high density-low accessibility” spatial paradox. This indicates that focusing solely on facility quantity or density is insufficient; the actual spatial layout of facilities, their matching degree with residential areas, transportation convenience, and the service quality of the facilities themselves collectively determine residents’ actual accessibility experience. Shrinking subdistricts may have issues such as untimely optimization of facility stock, fixed layout, and declining service efficiency, while growing subdistricts, while accommodating population, may have facility incremental layouts that are closer to resident needs or benefit from better new district road network structures.
Supply-demand balance analysis of accessibility and population density
To further explore the matching relationship between facility accessibility and spatial distribution of population, i.e., the supply-demand balance situation, this study employed bivariate spatial autocorrelation analysis methods. First, the global Moran’s I analysis results (Table 4) show that among the eight types of facilities, only transportation, finance and insurance, and science-education-culture facilities have positive Moran’s I values, indicating that their accessibility is positively correlated with population density, while the remaining five types of facilities (catering and accommodation, commercial shopping, convenient service, leisure and entertainment, medical and health) show negative correlations, meaning that in areas with higher population density, the accessibility of these facilities closely related to daily life is actually worse. This, to some extent, confirms the aforementioned “high density-low accessibility” phenomenon, reflecting that although there may not be a small number of living service facilities in population concentration areas, their layout is unreasonable or service efficiency is low.
Location quotient of various facilities by subdistrict type.
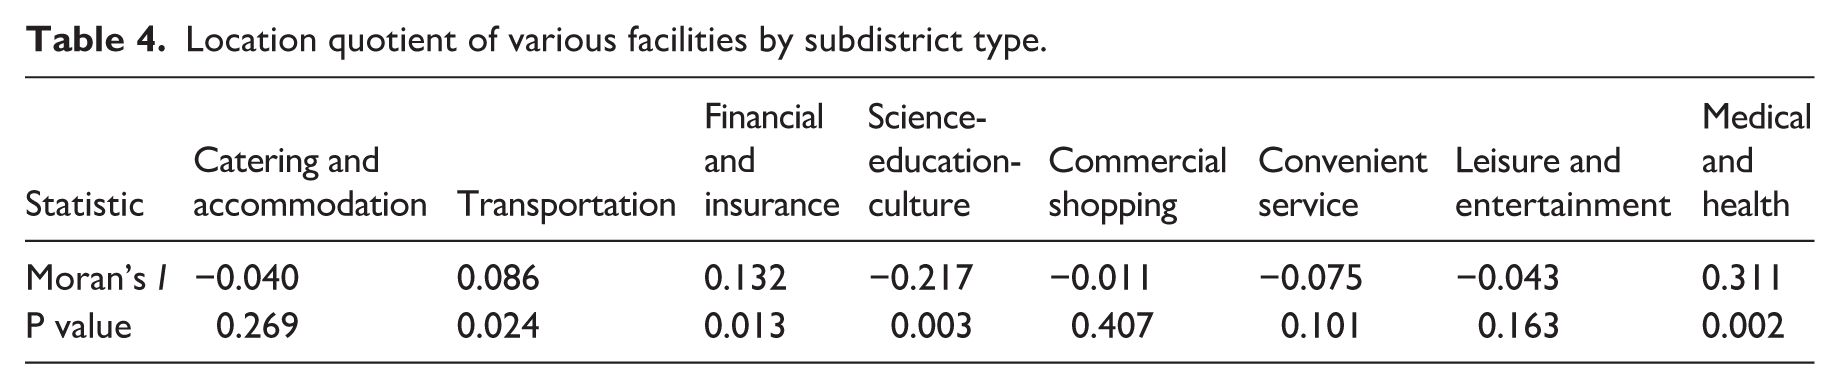
However, since the global Moran’s I values for most facilities did not pass significance tests, it indicates that the overall spatial correlation between facility accessibility and population density in the entire research area is not significant. Therefore, it is necessary to identify specific spatial clustering patterns through local spatial autocorrelation (LISA) analysis.
The LISA clustering results (Figure 5) reveal the spatial distribution patterns of four main types of supply-demand relationships. Among them, the “high-high” agglomeration (high accessibility–high population density) pattern, representing good supply-demand matching, accounts for 15.6% of all subdistricts, mainly appearing in growing subdistricts such as Xinnan and Guangyu and a few shrinking subdistricts such as Tuanjie and Tiexi. The “low-low” agglomeration (low accessibility–low population density) pattern, representing low supply and demand on both sides, has the highest proportion at 28.6%, mainly distributed in the peripheral areas of the research area with sparse population and low facility service levels. The “low-high” agglomeration (low accessibility–high population density) pattern, representing insufficient supply or unreasonable layout, accounts for 15.6%, concentrated in shrinking subdistricts in central urban areas such as Jiefang, Tuanjie, and Shengli, where, although population density remains high, residents’ convenience in accessing services is poor. The “high-low” agglomeration (high accessibility–low population density) pattern, representing relative surplus or advanced supply, has the lowest proportion at 13.8%, mainly appearing in some shrinking subdistricts such as Fuli, Dalu, and Sanjie, where population density is low but facility accessibility is better, possibly related to timely facility updates or advanced planning. Overall, subdistricts in the research area that are in the two supply-demand imbalance states of “low-high” and “high-low” account for approximately 29.4% of the total. Among them, shrinking subdistricts face more complex and prominent supply-demand imbalance problems, including both insufficient service in high population density areas (LH type) and relative idleness of facilities in low population density areas (HL type). While growing subdistricts have a relatively higher proportion of supply-demand matching (HH type), they also generally face the challenge of low per capita facility ownership (LQ < 1).
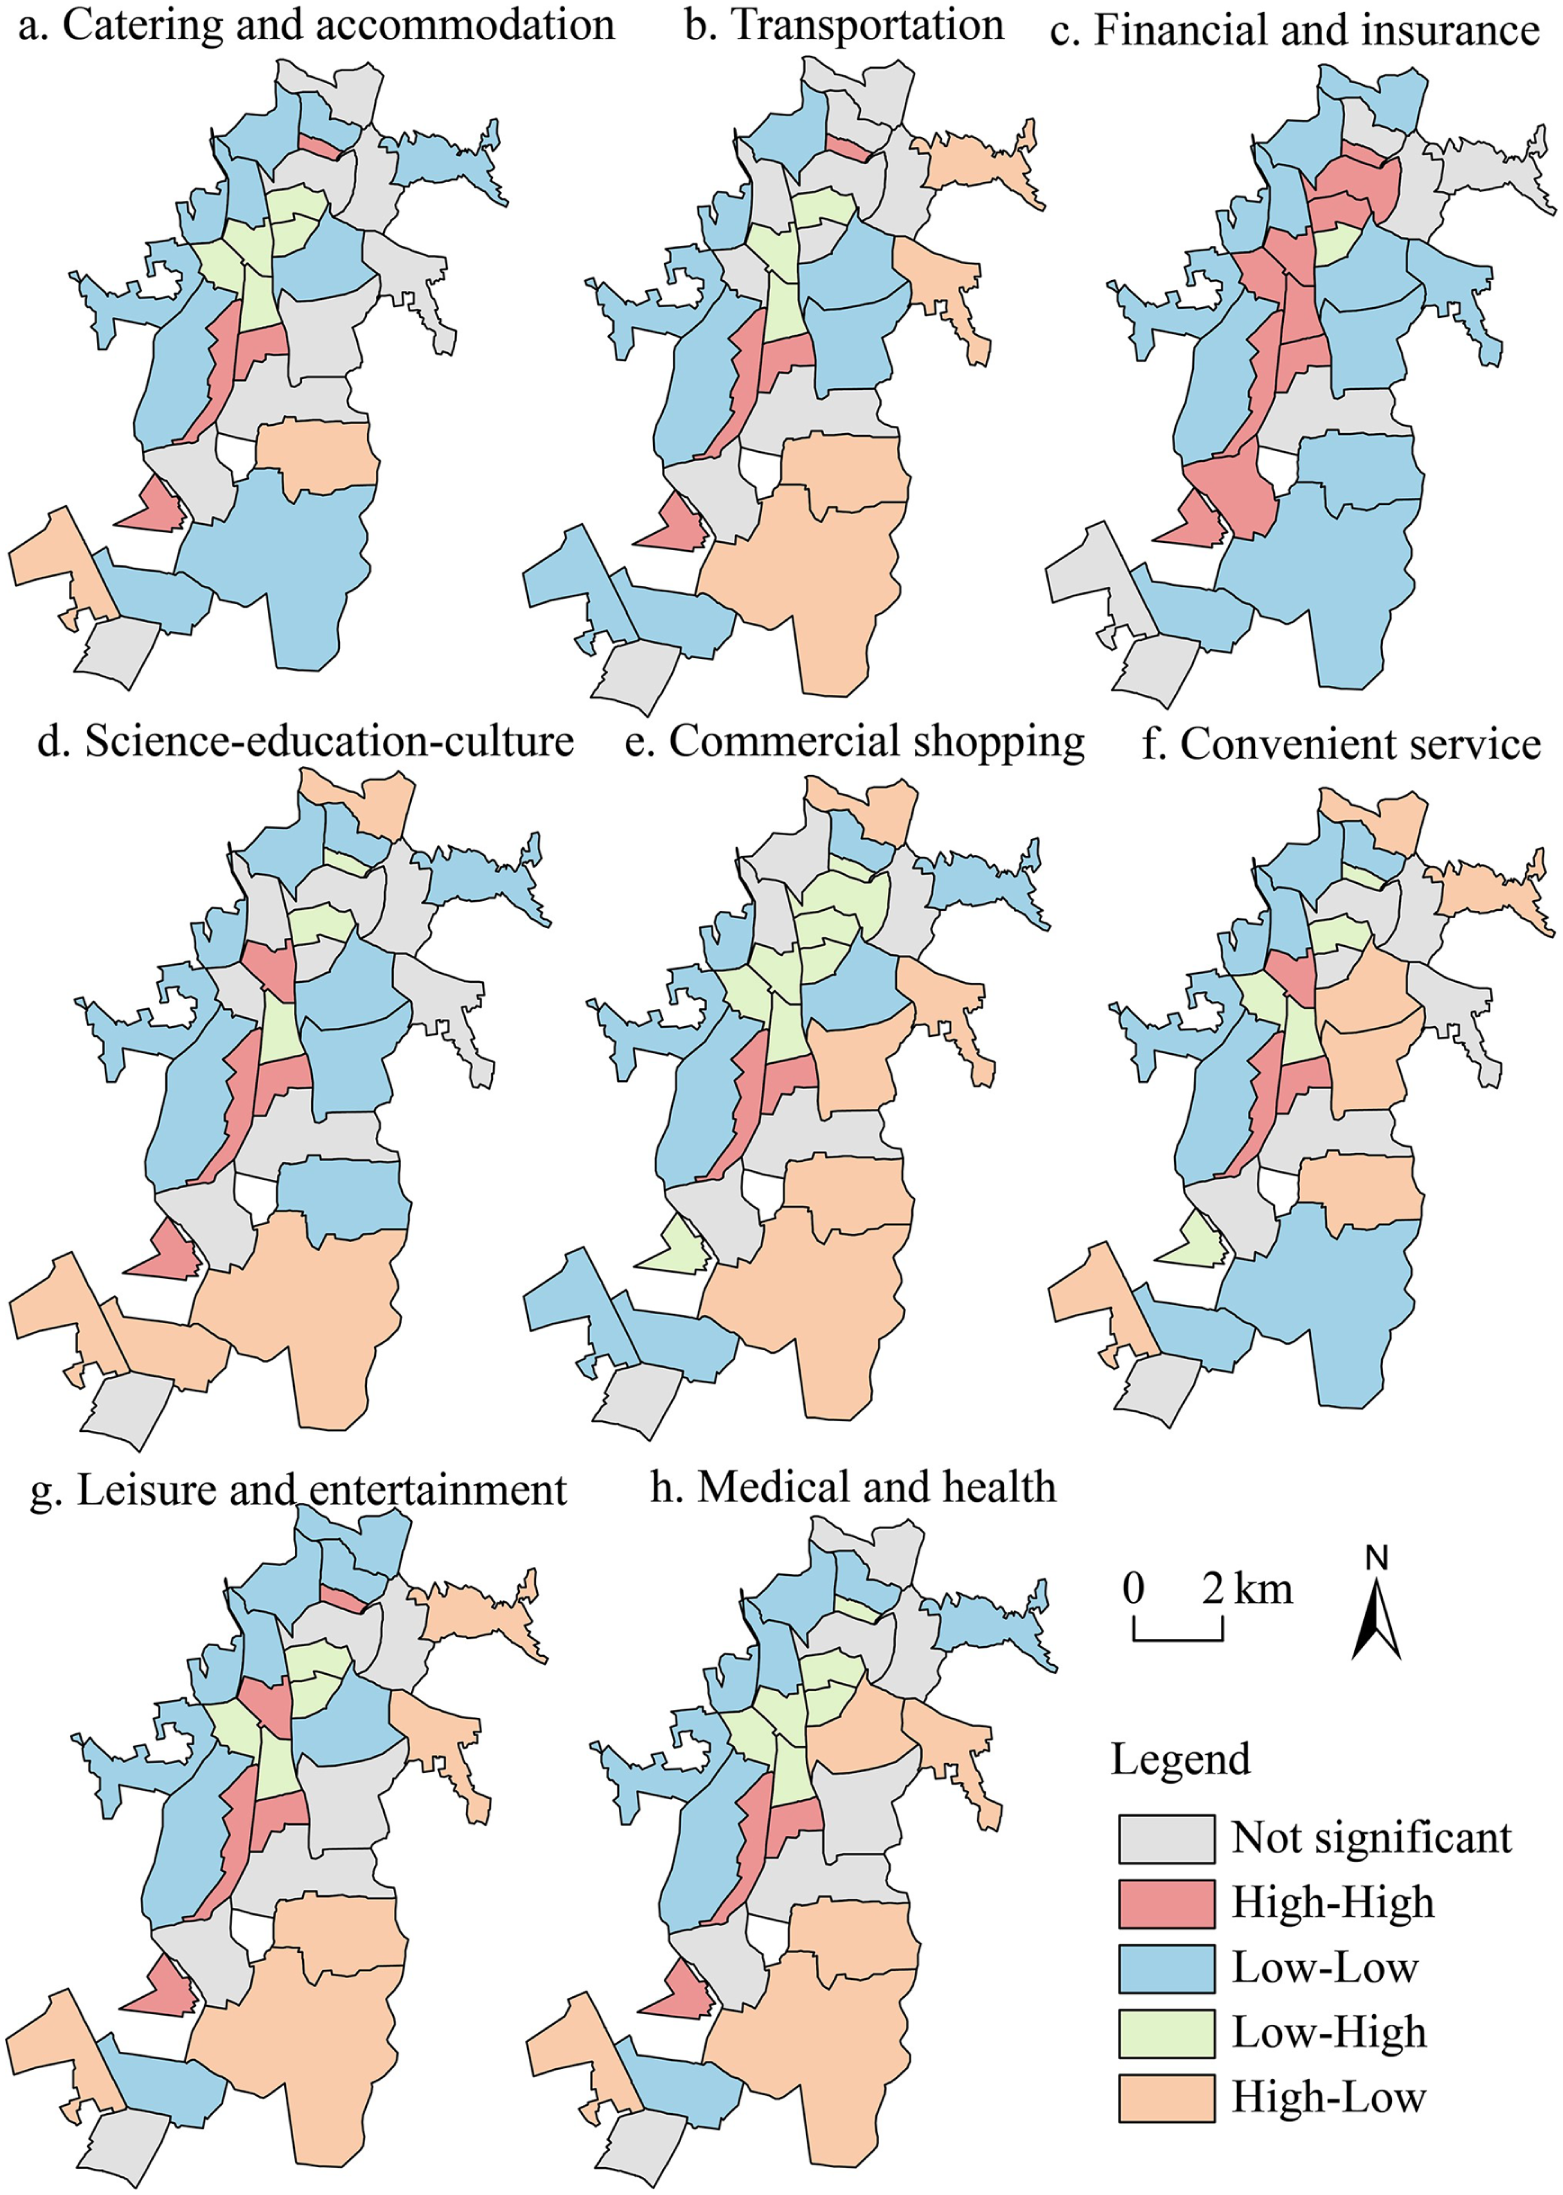
LISA cluster diagram of facilities. (a) Catering and accommodation. (b) Transportation. (c) Financial and insurance. (d) Science-education-culture. (e) Commercial shopping. (f) Convenient service. (g) Leisure and entertainment. (h) Medical and health.
Discussion
This study thoroughly examines the relationship between urban shrinkage and the spatial distribution of living service facilities through an analysis of Hegang City, a typical shrinking city, further revealing the supply-demand matching issues under this background. Several points warrant in-depth consideration and discussion:
First, existing research generally suggests that urban shrinkage leads to a decline in public service facility provision, particularly in shrinking cities where infrastructure maintenance and renewal often face dual challenges of fiscal pressure and population loss (Fol, 2012; Liu and Sun, 2023; Wang and Xu, 2025). However, this study finds that during Hegang’s shrinkage process, despite a significant population decrease, the number and density of living service facilities showed an increasing trend, especially in shrinking subdistricts. This phenomenon contradicts existing research conclusions and cognition, reflecting a structural imbalance between facility supply and population demand in shrinking cities, with extremely serious spatial mismatches. Potential reasons may include: (1) There is a contradiction between the construction and development logic of cities under the guidance of expansionary policy goals and the actual results of urban shrinkage. The interaction between supply inertia and demand changes has resulted in a structural imbalance in the supply and demand relationship. China has experienced a rapid urbanization process, and cities are still under the policy goal of expansion. The supply side of public service facilities has formed a strong institutional inertia, continuing the growth-oriented supply ideas, mechanisms, and organizational structures (Li et al., 2024). However, the demand side is facing changes such as scale reduction and structural aging caused by population loss in the context of urban shrinkage. As a result, there is a systemic contradiction between the supply and demand of public service facilities. (2) Living service facility supply has obvious policy intervention characteristics. As a socialist country, China’s administrative system and development concepts have a significant impact on the configuration of public service facilities, resulting in longer adjustment cycles for public facilities and difficulty in responding promptly to population changes. Particularly for public service facilities in education, healthcare, and other livelihood categories, the government is more cautious in facility consolidation decisions (Wang and Xu, 2025; Wei et al., 2024), leading to facility adjustments lagging behind population changes. (3) The regulatory role of market mechanisms is limited in shrinking cities. Theoretically, commercial facilities with higher marketization degrees should be more sensitive to population changes, but the research found that even commercial shopping facilities in shrinking subdistricts showed a significant increase in location quotients, indicating that market regulation mechanisms have somewhat failed in the context of shrinkage. This may be related to China’s unique fiscal system and urban development model. Even in areas with population loss, government-led land development and infrastructure construction continue, providing physical space for commercial facilities, but with low actual utilization efficiency (Zhang et al., 2022). Therefore, shrinking cities should overcome the path dependency of growth planning paradigms in future development and shift toward adaptive, flexible “smart shrinkage” planning paradigms, considering precise supply based on actual population needs.
Second, research results indicate a clear contradiction between the spatial distribution and accessibility of public service facilities in Hegang City, seriously impacting facility supply and maintenance as well as residents’ well-being. The “high density-low accessibility” paradox and significant configuration differences between growing and shrinking subdistricts challenge the traditional perception of viewing shrinking cities as homogeneous entities (Pallagst et al., 2021) and question the view that population decrease improves per capita service levels (Fu et al., 2022; Haase et al., 2014). Although shrinking subdistricts have higher facility density, their accessibility is generally lower than growing subdistricts, indicating significant spatial mismatches between facility layout and residents’ actual needs in shrinking areas, limiting infrastructure service capacity and reducing urban residents’ convenience and happiness index. Meanwhile, different types of facilities show significant accessibility differences, with financial insurance and scientific-educational-cultural facilities showing the most significant accessibility gaps between the two types of subdistricts. This reflects different spatial restructuring performances between highly marketized facilities and those with stronger public attributes: the former tends to concentrate in growing areas with stronger development vitality due to efficiency considerations, while the latter are constrained by policy orientation and construction cycles, making it difficult to respond quickly to urban spatial changes. In comparison, commercial shopping facilities have the smallest accessibility gap between growing and shrinking subdistricts due to their lower investment thresholds, approval and construction procedures, and stronger market regulation capabilities. Notably, some traditional old urban district shrinking subdistricts have high facility density but lower accessibility, revealing a passive situation of “high facility density-low service quality-high aging” in shrinking cities. This phenomenon further reflects the mismatch between facility spatial layout and population distribution, as well as the lag in functional space restructuring during urban shrinkage. Additionally, some shrinking subdistricts form higher accessibility because facilities are fewer but concentrated around residential areas, indicating that rational facility layout rather than simply pursuing high density can enhance service effectiveness in a shrinking context. This finding provides insight for smart planning in shrinking cities—attention should be paid to spatial optimization of facilities rather than simply pursuing quantity growth.
Third, urban shrinkage not only leads to population loss and declining economic vitality but also severely impacts local fiscal revenue, thereby weakening governments’ ability to provide and maintain public service facilities. With declining tax revenues and land transfer fees, shrinking cities face problems such as insufficient public service facility supply and shortage of maintenance funds (Reckien and Martinez-Fernandez, 2011), easily falling into a vicious cycle of “urban shrinkage-rising fiscal pressure-declining public service capacity-declining urban livability-lower population happiness index-urban shrinkage.” Meanwhile, decreased facility utilization rates lead to increased unit operation costs, exacerbating fiscal burdens. Against this background, how to optimize the spatial layout of living service facilities, improve resource utilization efficiency, and ensure basic public service levels becomes a key issue for sustainable development of shrinking cities. Based on this study’s findings, the following policy recommendations are proposed: (1) Accept the reality of urban shrinkage, abandon traditional growth-oriented planning thinking, transform shrinking city planning approaches, and adopt “smart shrinkage” strategies. More attention should be paid to dynamically adjusting public service facility layouts according to population changes and demand fluctuations, avoiding facility oversupply or undersupply. Especially in shrinking areas, governments should prioritize optimizing existing facilities rather than blindly expanding total facilities. Through strengthening functional adjustments and utilization rate improvements of existing facilities, resource waste can be avoided while ensuring that public services meet actual needs. (2) In the context of increasing fiscal pressure, shrinking cities need to pay more attention to fiscal investment efficiency. To address insufficient fiscal funds, shrinking cities can optimize fiscal expenditure structures to improve the construction and maintenance efficiency of public service facilities, especially through public-private partnership (PPP) models to guide social capital participation in infrastructure construction and operation. This not only alleviates fiscal pressure but also improves facility operational efficiency and sustainability, ensuring effective operation of public service facilities even with limited funds. (3) Promote spatial optimization and reorganization of facilities to enhance facility quality and efficiency. For different types of supply-demand mismatch areas, differentiated and precise strategies should be adopted. For “L-H” clusters (low accessibility–high population density), typically found in central-city subdistricts, the focus should be on “stock optimization.” Concrete measures could include: improving the service quality and management of existing facilities, introducing flexible service models such as mobile medical vehicles and administrative service stations, and converting underutilized ground-floor commercial spaces into community service points (e.g., canteens for the elderly, childcare centers) to address the most urgent needs of residents. For “H-L” clusters (high accessibility–low population density), often located in peripheral subdistricts, strategies should center on “facility consolidation and functional conversion.” For instance, nearby primary schools with low enrollment can be merged to concentrate educational resources. Redundant administrative buildings or underutilized industrial facilities could be transformed into public spaces such as elderly care centers, community activity hubs, or urban parks to revitalize assets and improve the local living environment. (4) Adapt social welfare and security facilities to demographic shifts and fiscal constraints. To ensure basic social welfare protection, strategies should focus on both efficiency and equity. This includes establishing a tiered welfare facility system that balances centralized, specialized institutions at the district level with accessible basic touchpoints at the community level. In shrinking subdistricts, underutilized public assets, such as vacant schools, should be repurposed into functional welfare spaces like senior activity centers or nursing homes. To compensate for facility gaps in low-density areas without requiring extensive fixed investments, flexible models like mobile service units and digital platforms should be developed. Finally, to ensure financial sustainability, local governments should pursue inter-governmental fiscal transfers and innovative public-private partnerships to support the delivery of essential welfare services, thereby maintaining livability and social equity despite population decline. (5) With increasingly complex urban development needs, future urban planning should pay more attention to refined management and dynamic monitoring and evaluation of public service facility layouts. Combining GIS technology, big data, and other information methods for more accurate facility demand forecasting and resource allocation can effectively improve the scientific and rational nature of facility supply. At the same time, using big data and information technology to build service facility monitoring and evaluation systems and platforms, regularly assessing service facility supply status, improving the timeliness and accuracy of infrastructure maintenance and adjustment, and improving the quality and efficiency of public service supply.
While this study reveals the spatial distribution and accessibility characteristics of convenient service facilities in the context of urban shrinkage, some limitations remain. First, due to data acquisition limitations, the study only used facility quantity data from two time points (2010 and 2020) and POI data from 2024, making it difficult to capture the continuous dynamic process of facility evolution. Second, the study focuses on facility spatial distribution and accessibility analysis, with insufficient evaluation of facility quality and usage efficiency. Third, the research fails to fully examine residents’ actual behavioral patterns and satisfaction when using facilities, which are crucial for understanding facilities’ actual service effectiveness. Fourth, this study uses only a single 15-minute threshold to assess accessibility. While this aligns with national and local planning policies and serves a micro-level research purpose, it requires further analysis of the hierarchical supply and accessibility of different services. Future research could further deepen in the following directions: first, expand multi-temporal data to construct continuous time series analysis of facility evolution in shrinking cities. Second, combine resident behavioral survey data to evaluate actual efficiency and resident satisfaction with facilities. Third, deeply explore differentiated adjustment mechanisms for different facility types to support precise shrinkage planning. Fourth, conduct comparative studies among shrinking cities to reveal commonalities and differences in facility spatial restructuring under different shrinkage types, degrees, and regional backgrounds. Fifth, multiple time thresholds (e.g., 5, 10, and 15 minutes) could be used to explore differences in accessibility of different services within shrinking urban communities. Overall, future research should focus more on fine-grained analysis of human-land-facility interaction relationships in shrinking cities, providing a scientific basis for sustainable development and livability enhancement in shrinking cities.
Conclusion
This study examines Hegang City as a typical Chinese shrinking city case, employing POI data and multiple analytical methods including kernel density analysis, location quotient, network analysis, and bivariate spatial autocorrelation to systematically analyze living service facilities’ spatial distribution and accessibility. The matching issues between population changes and facility supply-demand under urban shrinkage were deeply revealed.
The result finds that over 70% of Hegang’s subdistricts exhibit population shrinkage, forming a “central growth - peripheral shrinkage” spatial pattern. Contrary to expectations, shrinking subdistricts demonstrate higher facility density than growing subdistricts but lower accessibility, creating a “high density-low accessibility” paradox that challenges traditional assumptions about per capita service improvements following population decline, reflecting structural imbalance and spatial mismatch in shrinking city facility configuration.
Location quotient analysis shows resource allocation inequities: shrinking subdistricts have excess facility supply (LQ > 1) while growing subdistricts face insufficient supply (LQ < 1). Financial and insurance facilities exhibit the most significant spatial imbalance, while commercial facilities show the smallest accessibility gaps between subdistrict types. Bivariate spatial autocorrelation indicates that 62.5% of facility types demonstrate negative correlations between accessibility and population density, with 29.4% of subdistricts experiencing supply-demand mismatches.
These findings deepen the understanding of shrinking cities’ internal spatial restructuring and provide scientific evidence for optimizing public service facility configurations under “smart shrinkage” paradigms. The study emphasizes the need for adaptive planning approaches prioritizing spatial optimization over quantity expansion, supporting sustainable development in shrinking urban contexts. Future research should incorporate multi-temporal analysis, resident behavioral surveys, and comparative studies across different shrinking city types to provide more comprehensive guidance for shrinking city planning and governance.
Footnotes
Author contributions
Naigang Cao: Conceptualization, writing-original draft, data curation, visualization
Xinling Jiang: Data curation, visualization
Pingjun Sun: Conceptualization, writing-review & editing, supervision, funding acquisition
Xiaotong Gao: Software, data curation
Zhichong Zou: Conceptualization, supervision
Funding
The authors disclosed receipt of the following financial support for the research, authorship, and/or publication of this article: This work is funded by the Key Special Project of the National Key Research and Development Program of China (grant number 2024YFC3807800), Humanities and Social Sciences Fund of the Ministry of Education of China (grant number 24YJA790056).
Declaration of conflicting interests
The authors declared no potential conflicts of interest with respect to the research, authorship, and/or publication of this article.