
Abstract
Enhancing urban bikeability is crucial in building environmentally friendly and sustainable cities. While numerous studies have proposed various metrics, they generally overlooked the potential yet crucial impact of the urban visual environment on cycling behavior. To address this gap, we propose a Visual Bikeability Score (VBS). This score is derived by modeling the semantic elements within street view images against the actual volume of cycling activity. We apply this model to cycling on both routine and non-routine roads during the morning and PM peak. Based on this, we identify mismatches between the cycling environment and cycling behavior. Through Random Forest and SHAP analyses, we then uncover the underlying socio-economic factors that contribute to these mismatches. Our results indicate that VBS effectively evaluates the visual bikeability of urban spaces, particularly highlighting the critical role of beautiful urban landscapes. Based on the VBS analysis, we further categorize roads into “forgotten,” “matchable,” and “over-cycling” types. The analysis of socio-economic characteristics reveals that routine routes are consistently associated with work-related characteristics, whereas non-routine routes show a stronger correlation with socio-demographic and ethnic characteristics. This study provides targeted and broadly applicable strategies to mitigate the mismatch between the cycling environment and behavior, and to enhance urban cycling participation.
Introduction
Making cities more bike-friendly is crucial to developing an environmentally friendly and sustainable city (United Nations, 2015; World Health Organization, 2010). For citizens, cycling promotes the physical and mental well-being of citizens and allows them to participate in outdoor activities (Becker et al., 2022; Hallal et al., 2012; Zeng et al., 2025). For the whole city, cycling offers a feasible approach to reducing transport emissions (Cao et al., 2021; Neves and Brand, 2019), noise pollution (Mahdjoub et al., 2018), and the heat island effect (Rojas-Rueda et al., 2012).
Understanding the relationship between the built environment and cycling behavior is fundamental to creating a bike-friendly city, and this dynamic can be conceptualized as a supply-demand balance (Moudon et al., 2005; Olds, 2001). The built environment provides its capacity to support cycling through its infrastructure and aesthetic qualities, while observed cycling volumes directly reflect the public demand for cycling. However, achieving an ideal supply-demand balance is often challenging. Some areas demonstrate an oversupply, they own outstanding infrastructure and aesthetic quality but remain underutilized due to their specific location or function (Meng et al., 2014). In contrast, other areas suffer from an undersupply, where weak and unsafe infrastructure is overwhelmed by a high volume of necessary trips, causing demand to far exceed the environment’s capacity (Yu et al., 2021). Oversupply leads to overuse and investment in public resources, while undersupply severely degrades the cycling experience and increases the risks of traffic accidents. Therefore, accurately assessing the degree of supply-demand balance and identifying their spatial patterns are crucial to guide planning interventions and building a human-centric and cyclable city.
The supply of urban environment can be observed by street bikeability, which measures how convenient, comfortable, and safe a street is for cycling (Amiri and Sadeghpour, 2015; Zhou et al., 2019). Many existing tools assess street bikeability through the physical audit of the urban built environment, such as the Bike Score® (Winters et al., 2016) and the Active Commute Route Environment Scale (ACRES) (Wahlgren et al., 2010). The achievements of computer vision and urban sensing technologies inspire big data-based street bikeability evaluation, which can conduct a large-scale, fine-grained, and automated evaluation.
However, existing bikeability metrics still have two main limitations. Firstly, they often overemphasize improving traffic efficiency while often overlooking the latent impact of the urban visual environment on cycling behavior. An aesthetic landscape not only improves physical comfort through features such as broad roads and street trees, but also improves mental health by promoting a sense of security and enjoyment (Etminani-Ghasrodashti et al., 2018; Yeboah, 2014), thereby stimulating urban residents to participate more in cycling activities. Secondly, from the perspective of bikeability modeling, it is also challenging to take the complex and diverse urban visual characteristics into consideration.
Achievements in computer vision and urban sensing technologies have significantly inspired urban researchers to combine these innovative technologies for large-scale, fine-grained, and automated surveys of urban bikeability assessment through street view images (SVIs) (Cheng et al., 2019; Tang and Long, 2019). SVIs capture detailed depictions of urban street landscapes through a human-like perspective, making them a naturally popular data source for exploring micro-level street characteristics (Zhang et al., 2024). Given these unique advantages, current research is increasingly focused on using SVIs to conduct more in-depth bikeability evaluation through semantic analysis and virtual audits, thus widely applied to foster public engagement in cycling activities (Gu et al., 2018; Zhang et al., 2023).
Given these motivations, this article investigates the mismatch between the cycling visual environment and cycling behavior through SVIs, with the Greater London Area (GLA) as a case study. We propose the Visual Bicycleability Score (VBS), which evaluates streets’ bikeability from a street aesthetic perspective through urban landscapes captured by SVIs. By comparing the VBS with actual cycling behavior, we identify and analyze the mismatch between the visual environment and cycling behavior (i.e., cycling-and-environment mismatch). Furthermore, VBS is considered the theoretical supply of street cycling potential in terms of landscape aesthetics, and the actual cycling behavior directly reflects the real demand of the public for the street cycling environment. Therefore, this mismatch also reflects the supply-demand relationship in street cycling patterns. To further explore the relationship between socio-economic characteristics and cycling-and-environment mismatch, we employ a random forest classifier to test whether the model can classify the cycling-and-environment mismatch correctly. SHapley Additive exPlanations (SHAP) are utilized to investigate the socio-economic influence on the mismatch.
Our findings confirm the effectiveness of the VBS in evaluating street visual bikeability and detecting cycling-and-environment mismatch. Furthermore, the random forest classifier and SHAP’s results help us find the socio-economic characteristics like public cycling participation, distance to work, young and middle-aged population, and household wealth (vehicle ownership, etc.) that influence the cycling-and-environment mismatch in London. It also sheds light on the Chinese metropolitan’s construction to enhance the urban landscape aesthetics and cycling infrastructure to support the construction of a cycling-friendly city. Our research provides practical solutions to identify and reduce the supply-demand mismatch between the urban visual environment and cycling behavior. It also offers policy implementations from physical and socio-economic dimensions, contributing to the construction of an environment-friendly, equitable, and sustainable development process.
Related works
Evaluating street’s active travel
In the accelerated development of sustainable and environmentally friendly urban landscapes, accurately assessing the capacity of the streets to support active travel, particularly walking and cycling, has become a critical task. However, given the complex and multi-dimensional impact of the built environment on cycling activities, a unified standard for evaluating bikeability and walkability is a significant obstacle in this evaluative endeavor. Early studies predominantly relied on questionnaires and on-site street auditions to explore bikeability and walkability. For instance, the Index of Accessibility and Attractiveness of the Pedestrian Environment (IAAPE) designs a 7Cs framework (connectivity, convenience, comfort, conviviality, conspicuousness, coexistence, and commitment), and distributes questionnaires for different age groups to understand variations in their walking activities (Moura et al., 2017). The Bikeability and Walkability Table (BiWET) is an audit tool that assesses road bikeability and walkability based on 15 built environment factors (Hoedl et al., 2010).
The rapid advancement of Geographic Information Systems (GIS) technology has revolutionized this field, as it allows for quantifying key indicators for the urban built environment across multi-source data, such as accessibility between different points of interest (POIs) and road connectivity (Gu et al., 2025b). Furthermore, the high computational efficiency of GIS has greatly advanced large-scale, automated virtual audits across urban areas. A representative example is Walk Score®, which calculates a walkability score based on the distance from streets to 13 types of amenities (e.g., grocery stores, cinemas, schools, parks, etc.) (Seat, 2011). Walk Score® provides a widely popular walkability calculating algorithm whose effectiveness is widely recognized (Carr et al., 2010; Duncan et al., 2011; Koohsari et al., 2018). However, it has also been criticized for focusing solely on accessibility while overlooking other important factors. To address this shortcoming, a series of studies have introduced new considerations from different dimensions to enrich and refine the street bikeability and walkability assessment. Leslie et al. (2007) calculated a walkability index by combining residential density, connectivity, diversity in land use, and ratio of floor area retail. Yin (2017) employed 3D GIS technology to measure openness and visibility to design a walkability index. Lwin and Murayama (2011) utilized a combination of GIS and remote sensing (RS) methods to quantify urban green spaces, creating an environment-friendly walking score to assist citizens in making decisions about environment-friendly dwelling choices.
The emergence of SVIs significantly expands the dimensions of walkability and bikeability assessments, paving the way for developing human-centered evaluation (Gao et al., 2024; Kang et al., 2020; Shi et al., 2024). As an image medium with abundant geographic information, SVI combines GIS’s spatial analysis capabilities at the macro level and the street audit’s fine-grained street description at the micro level, serving as a bridge between these two mainstream assessment methods (Hou et al., 2025). On one hand, SVI, as a standardized and high-quality data source, can be systematically collected, processed, and effectively integrated into GIS frameworks, providing outstanding data support for urban spatial analysis (Han et al., 2023; Ito and Biljecki, 2021). On the other hand, by incorporating machine learning and deep learning algorithms, researchers can efficiently and automatically extract various key elements of the urban environment from SVI, including street layouts, architectural styles, traffic signal systems, and signage, achieving virtual street audits that vividly reflect streets’ actual conditions and details (Zhang et al., 2025). This process not only greatly enhances the precision and efficiency of assessments but also establishes a comprehensive and highly automated virtual audit process, offering unprecedented convenience and depth to walkability and bikeability evaluations (Huang et al., 2023; Li et al., 2022).
In addition, SVIs capture street landscapes from a human perspective, allowing researchers to closely simulate the real experiences of pedestrians on the streets, thereby advancing the development of human-centered bikeability assessment methods (Hou et al., 2024a). Given these advantages, an increasing number of research projects have actively adopted SVI as a key data source in recent years (Hou et al., 2024b; O’Regan et al., 2022; Wang et al., 2024). SVIs have not only deepened our understanding of urban walking and cycling environments but also sparked in-depth exploration of the walking experiences of different citizen groups, particularly the elderly and adolescents, within street spaces (Huang et al., 2025b; Wei et al., 2024). SVIs provide us with a visual perspective to precisely analyze the obstacles and conveniences these specific groups may encounter during walking or cycling, leading to the design of more humanized and inclusive urban planning and transportation solutions, thereby truly achieving a human-centered urban environment.
The mismatch between urban environment and human behavior in cycling
Despite increasing global investment in cycling infrastructure, there is a mismatch between meticulously designed physical environments and the actual behaviors and experiences of cyclists. This mismatch is more than a problem in urban planning, but it also reveals how the built environment interacts with complex human behaviors and social structures (He and He, 2024). Finally, it exacerbates the existing social inequalities.
The mismatch between cycling behavior and the urban environment stems from a structural supply-demand contradiction between the environment and cyclists (Gao et al., 2021). Affordance theory says that, the physical features of an environment are not neutral, but actively afford or constrain human actions. An ideal environment provides positive affordances (Gibson, 2014). For example, a continuous and protected bike lane provides safe and smooth travel, successfully providing cyclists with positive cycling experiences (Wang et al., 2025). However, real-world urban cycling environments are often fraught with negative affordances and design constraints. A bike lane that abruptly ends at an intersection poses a high risk of conflict with vehicles, while a lane obstructed by obstacles forces cyclists to perform dangerous evasive maneuvers (Xiao et al., 2025). Furthermore, these flaws can create unintended affordances, such as a wide sidewalk next to a congested street that offers illegal but rational sidewalk riding. This systemic mismatch is not accidental, but is shaped by multi-dimensional factors. First, it is rooted in infrastructural flaws, as disconnected networks, hazardous intersections, and inadequate parking undermine the viability and safety of cycling (Liu et al., 2025b). This is compounded by the narrowed planning paradigms that often reduce cycling to only a commuting activity, failing to support the diverse needs of daily life, such as errands or leisure (Liu et al., 2025a). Finally, the mismatch is deepened by the neglect of environment quality, as critical sensory and aesthetic factors like greenery, cleanliness, and perceived safety, all of which are decisive for a cyclist’s choice and comfort, are frequently marginalized (Mao et al., 2025).
Traditionally, detecting such mismatch between the urban environment and cycling behavior has primarily relied on sample surveys or small-scale manual observations (Gu et al., 2025a). Although these classic methods offer in-depth insight, they have inherent limitations in terms of spatio-temporal scale, cost-effectiveness, and data objectivity. In recent years, the field of urban computing and big data has revolutionized this paradigm. By analyzing massive trajectory data (such as GPS from shared bikes and records from fitness apps), researchers can directly describe the networks that reflect real travel intentions. Spatially comparing these networks with official infrastructure plans allows for the efficient identification of network disconnections, actual detours, and potential cycling shortcuts.
However, these behavior- and event-centric data streams essentially record the phenomena and consequences of the mismatch. That is, where people cycle, where they detour, and where accidents occur. However, they lack sufficient explanatory power regarding the environmental ”triggers” that cause these phenomena. For instance, GPS trajectories can reveal that a certain route is widely avoided, but they cannot explain whether this is due to severe pavement damage, a lack of nighttime lighting, or an unsafe-feeling environment (Shi et al., 2023). Street view imagery, as a high-dimensional proxy for environmental perception, offers a comprehensive record of the urban street environment. Its unique advantage lies in its ability to systematically decode the physical and social spatial cues that shape cycling behavior (Ki et al., 2023; Liu et al., 2023). Specifically, street view images capture ground-level details completely missed by trajectory data (Huang et al., 2025a). Leveraging advanced computer vision algorithms (such as image segmentation and object detection), we can quantitatively analyze key design elements like the physical separation type and effective width of bike lanes, the presence of obstacles, pavement conditions, and intersection sight lines (Shi et al., 2025). Furthermore, street view imagery can also assess the environmental ambience and aesthetic qualities that influence the willingness to cycle. For example, metrics such as the green view index, sky view factor, level of maintenance (indicated by the presence of graffiti or litter), and street vitality—soft indicators that are difficult to capture with other forms of big data—can all be quantified through image analysis. By spatially matching the environmental features extracted from street view images with data on cycling trajectories and accident hotspots, this research can build a powerful explanatory model. This model directly tests “which environmental features” lead to “which cycling behaviors or outcomes,” thereby providing a scientific basis for precise environmental interventions and evidence-based design.
Research area and data
Research area
This study’s research area is the Great London Area. As an international metropolitan, London is responsible for constructing an active travel city to achieve sustainable urban development. In 2018, the mayor of London launched the Mayor’s Transport Strategy, which shows the ambition of constructing London as “the world’s best big city for cycling and walking” (Transport for London, 2018). This strategy inspires more Londoners to participate in cycling and walking activities to promote their health and the city’s transportation. Nowadays, London is trying its best to improve cycling infrastructure, accessibility, and awareness to establish London as a universally cycling-friendly city, aiming to guarantee 80% of London travel will be by cycling, walking, or public transport by 2041 (Transport for London, 2018).
Data
In this study, we primarily focus on cycling count data, street view images, points of interest (POI) and socio-economic data in London.
London cycling count data shows cycling intensity in London at different times and places. This data is provided by Transport for London (TfL) cycling monitoring program 1 (Transport for London, 2022). It is collected from 1,268 sampling sites in central London (i.e., “the area within the Congestion Charge zone”), inner London (i.e., “the area within the inner cordon boundary and outside the Congestion Charge zone”), and outer London (i.e., “the area within the outer cordon boundary and outside the inner cordon boundary”). From 2016 to 2020, TfL counted the number of cyclists at each sampling site during selected two-week periods every spring (data in central London are collected in every quarter) and provided cycling status information such as site, weekday, weather, 15-minute period cycling count from 6 AM to 9:59 PM.
Street view images (SVIs) used in this study are requested through the Google Street View platform. As one of the most popular location-based service providers, Google Maps provides high-quality SVIs that cover almost every street in London (Anguelov et al., 2010). In this study, we collected SVIs for streets corresponding to the locations of our cycling count sampling sites. For each street, we sampled SVIs at 25-meter intervals along the road. At each sampling point, we gathered images facing the front (0 degrees), back (180 degrees), left (90 degrees), and right (270 degrees) as one group that provides a comprehensive description of the urban visual environment surrounding each point.
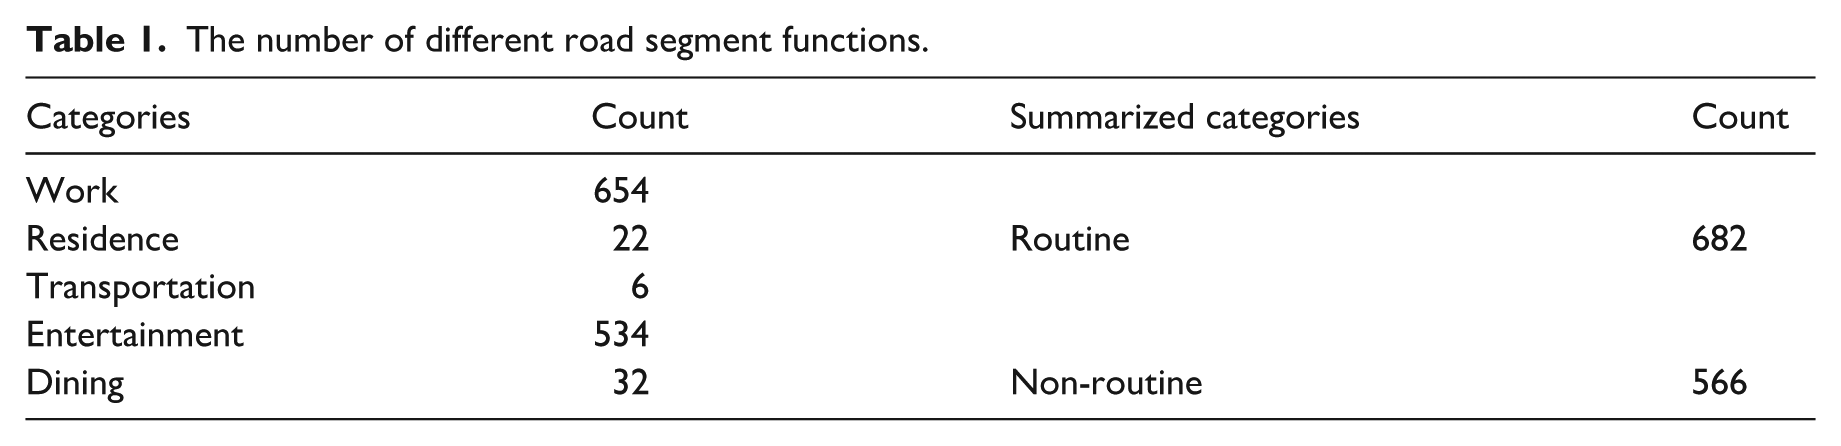
The UK POI data used to target the street function is provided by the Overture Maps Foundation 2 (Ballantyne and Berragan, 2024). This data captures a diverse range of POIs across the entire United Kingdom in September 2024. Given that the 440 POI types within the study areas complicated further analysis, we aggregated all the POI categories into five classes: Work, Entertainment, Dining, Residence, and Transportation. The number of different road segment functions is shown in Table 1. Due to the imbalance in the categories of road segment functions, we merged work, residence, and transportation into the category “Routine”, then merged dining and entertainment as “Non-routine” to facilitate further grouped analysis.
The number of different road segment functions.
The 2021 London census data is used to explore the relationship between the socio-economic atmosphere and the mismatch between the visual environment of cycling and actual cycling behaviors. The 2021 London census data provides accurate information on the Greater London Area’s local demographics, housing, employment, and needs of the Greater London Area (Office for National Statistics, 2023). The census data employed in this study encompasses five categories of socio-economic indicators: Demography and Migration; Ethnic Group, Language and Religion; Labour Market; Housing, Qualifications; and Disability, Health, and Care in Lower Layer Super Output Areas (LSOAs) level, which are finely-grained geographical units utilized throughout the United Kingdom (Black and Street, 2014). Detailed descriptions of these socio-economic characteristics are presented in the supplementary materials. LSOAs comprise between 400 and 1,200 households and have a usually resident population between 1,000 and 3,000 persons (Black and Street, 2014; Forsyth and Krizek, 2010). LSOA-level census data offers an appropriate scale to align socio-economic activity with cycling behavior. In addition, we also calculate LSOA-level Point of Interest (POI) entropy and land use entropy from OpenStreetMap as land use information.
Methodology
Figure 1 describes the three-stage framework for identifying and interpreting the mismatch between the cycling visual environment and cycling behavior. Firstly, we conduct data matching and semantic segmentation processes to extract the visual semantic information about streets, encompassing the alignment of cycling count data with the appropriate roads, aggregating SVIs related to the identified roads, and extracting semantic information from SVIs via a deep learning framework. Then, we introduce a visual-based metric for assessing visual bikeability as a proxy for cycling supply: the visual bikeability score (VBS). By comparing the difference between VBS and actual cycling behavior, we categorize the mismatch between the cycling visual environment and cycling behavior (cycling-and-environment mismatch), a proxy for supply-demand mismatch in cycling patterns. Finally, we employ random forest and SHapley Additive explanation (SHAP) to uncover and interpret potential socio-economic variables that may influence the emergence of cycling-and-environment mismatch.
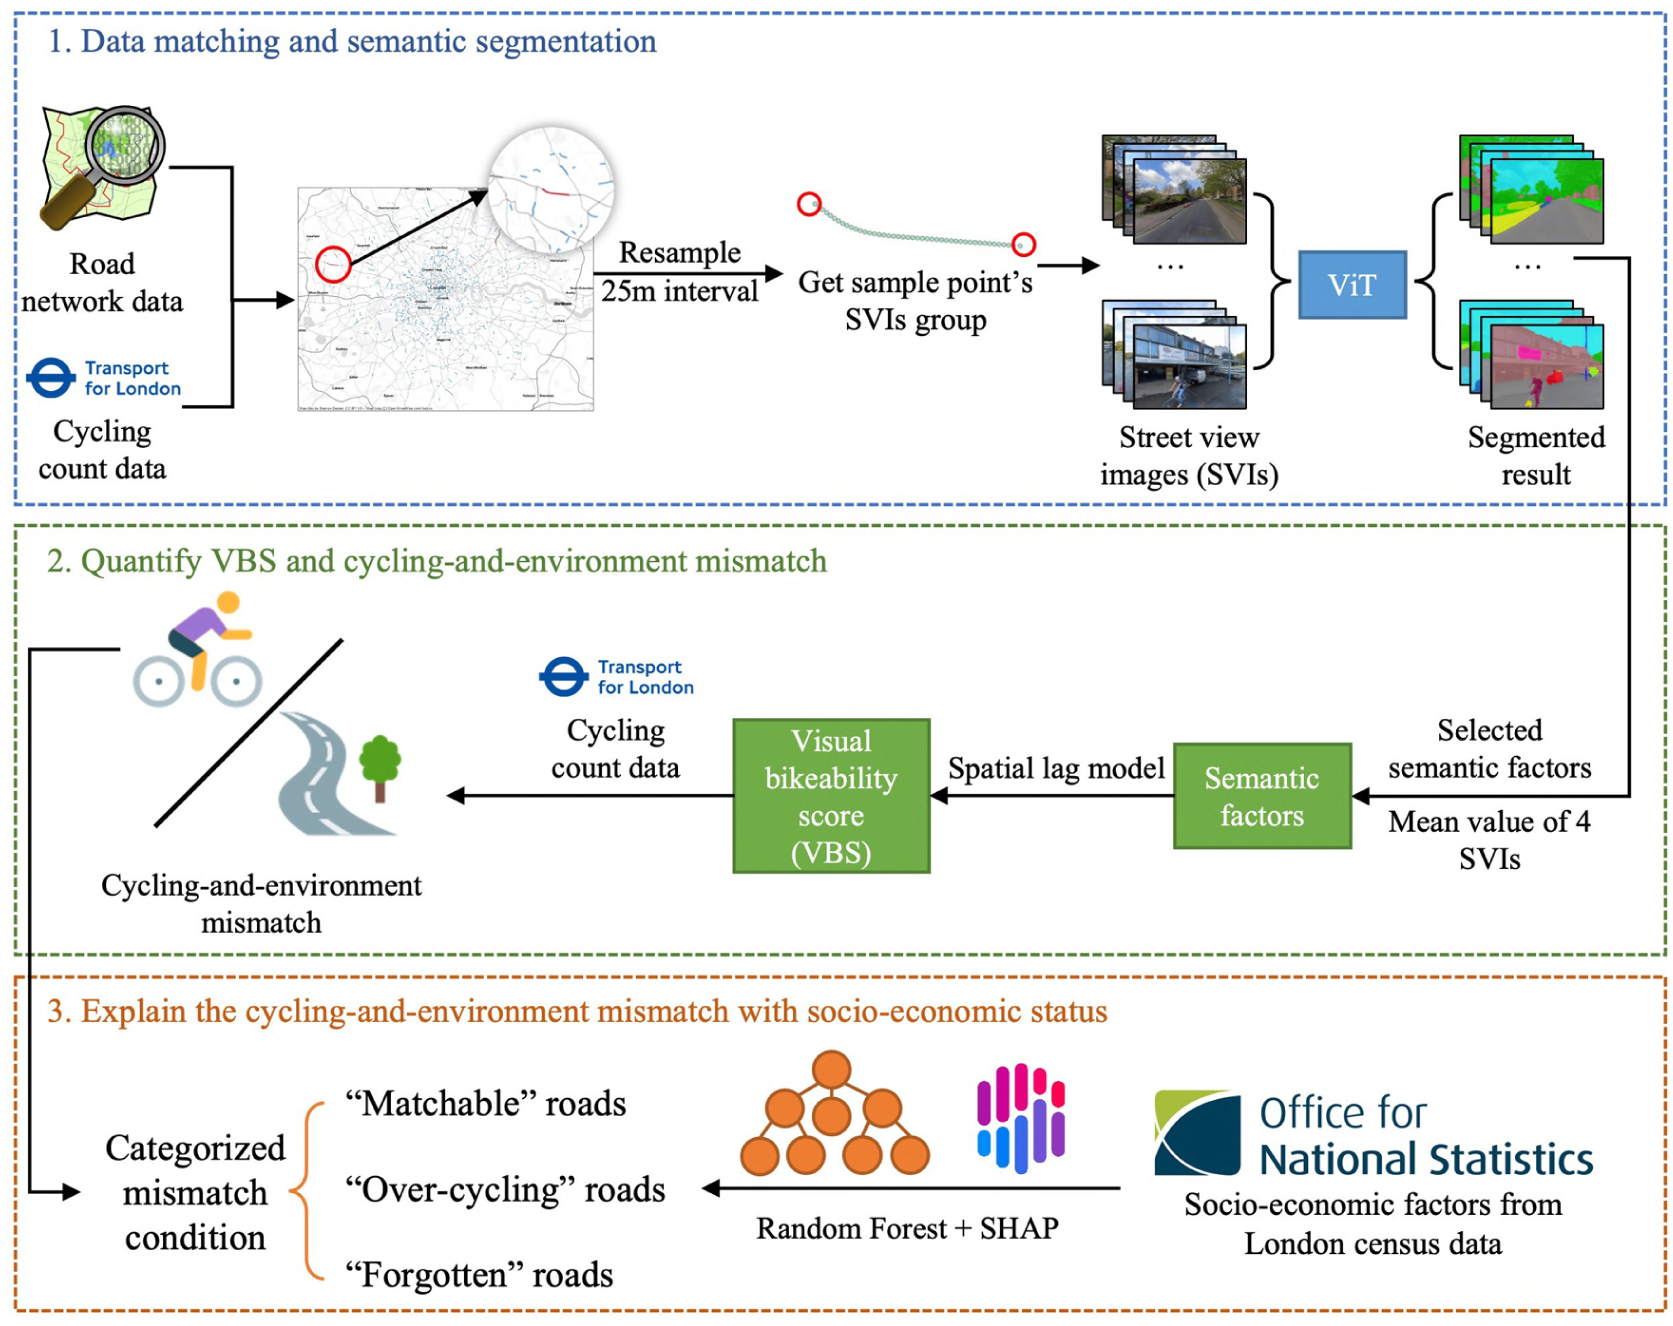
Framework of the study. We use a three-stage framework to recognize and interpret the supply-demand mismatch between the cycling visual environment and cycling behavior. Firstly, we conduct a data matching and semantic segmentation process to extract the visual semantic information about streets. Based on that, we propose the visual bikeability score (VBS) and then categorize the mismatch between the cycling visual environment and cycling behavior (cycling-and-environment mismatch). Then, we employ random forest and SHapley Additive explanation (SHAP) to uncover and interpret potential socio-economic variables that may influence the emergence of cycling-and-environment mismatch.
Data preprocessing and semantic segmentation
In this study, we implemented data filtering and preprocessing procedures for cycling count data, SVIs, and 2021 London census data to ensure that the data is both high-quality and effective in subsequent experiments.
For cycling count data, we only analyze the data from sunny days on workdays. In addition, since cycling occurs mainly on the streets, we match the appropriate street according to the corresponding sampling sites. Figure 2 shows the roads where sampling points are located and their function (routine or non-routine). Subsequently, we identified the temporal patterns of the cycling count data, classifying the cycling activities into distinct periods.
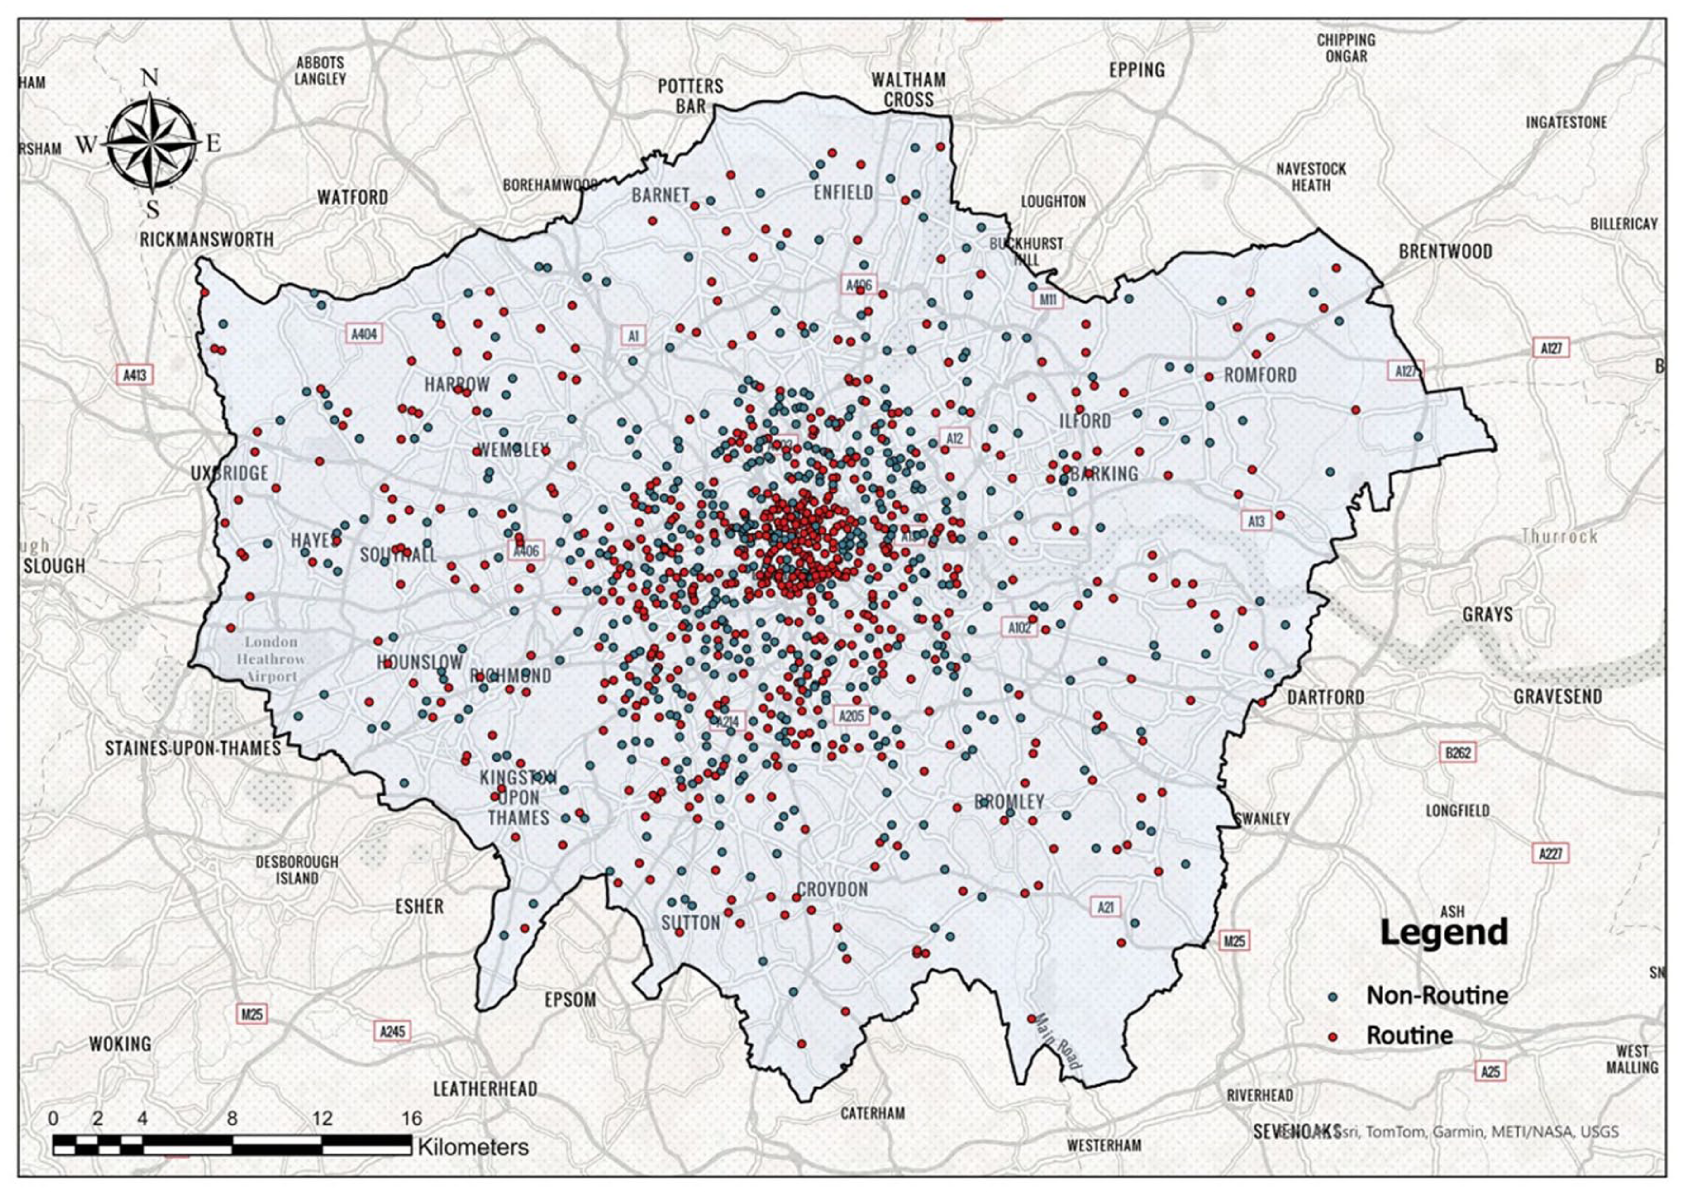
The location of roads where sampling points are located with different functions.
Since high-quality SVIs are crucial for modeling the actual environment during cycling, we implemented a comprehensive data processing and validation pipeline to ensure that the SVIs are available and of high quality in our experiment. This pipeline included finding SVIs for missing points and removing low-quality images. Specifically, we chose SVIs after 2019 for this study. For locations where SVIs were not available (perhaps due to obstructions, GPS drift, or out-of-date), we substituted them with an image of the nearest valid point. Then, to filter for low-quality SVIs (e.g., blurry, non-street images, or taken in winter or at night), we trained a random forest classifier on a manually curated set of 200 high-quality and 200 low-quality images. We then applied this classifier to our entire dataset. The automated classification was followed by manual verification to correct any misclassifications. If any image at a sample point was deemed low-quality, all four images for that point were discarded. This resulted in the removal of 988 SVIs (from 247 sample points). Finally, at the street level, any road segment missing from 40% of its sampled SVIs was excluded from further analysis. Through this series of filtering steps, we ensure the high quality and relevance of the SVI data used in subsequent experiments. During data preprocessing, 1,153 roads (out of 1,268 roads with sampling sites) and 99,580 SVIs (organized into 24,930 groups) were validated for inclusion in the subsequent analysis.
Subsequently, we determined the function of these selected road segments based on their associated POIs. Specifically, we created a 100-meter buffer around each road segment and identified the dominant POI category within this buffer. This category was then assigned as the function of the corresponding segment.
To filter out socio-economic characteristics that are highly relevant to cycling counts, we quantify the correlation between these socio-economic characteristics and cycling counts. In this process, we collect socio-economic characteristics at the LSOA level and calculate the average cycling count within each LSOA to aggregate the cycling data. We verified the integrity of the original socio-economic data and ensured it had no null values and was consistent at the LSOA level. Then we quantify the Pearson correlation between these aggregated cycling data and socio-economic characteristics and remove factors that showed a low correlation (i.e., an absolute correlation coefficient value of less than 0.2) with cycling counts (as shown in Chapter 1 of the supplementary materials).
Subsequently, we performed semantic segmentation on SVIs to extract the street’s semantic information about the urban visual environment. After investigating various deep learning frameworks for semantic segmentation tasks, we selected the Vision Transformer (ViT) model based on performance evaluations and effectiveness comparisons to carry out this task (as shown in Chapter 2 of the supplementary materials).
Visual bikeability score
Based on existing literature, VBS is composed of the visual semantic elements related to safety, cycling-friendly roads, and high-quality urban landscapes, which are represented by three categories in this research: safety, traffic, and aesthetics (Lee and Moudon, 2004; Wang et al., 2016). VBS is calculated as Eq. (1):

where ki is the proportion of built-environment elements in SVIs, and wi is the weight of these urban visual environment elements.
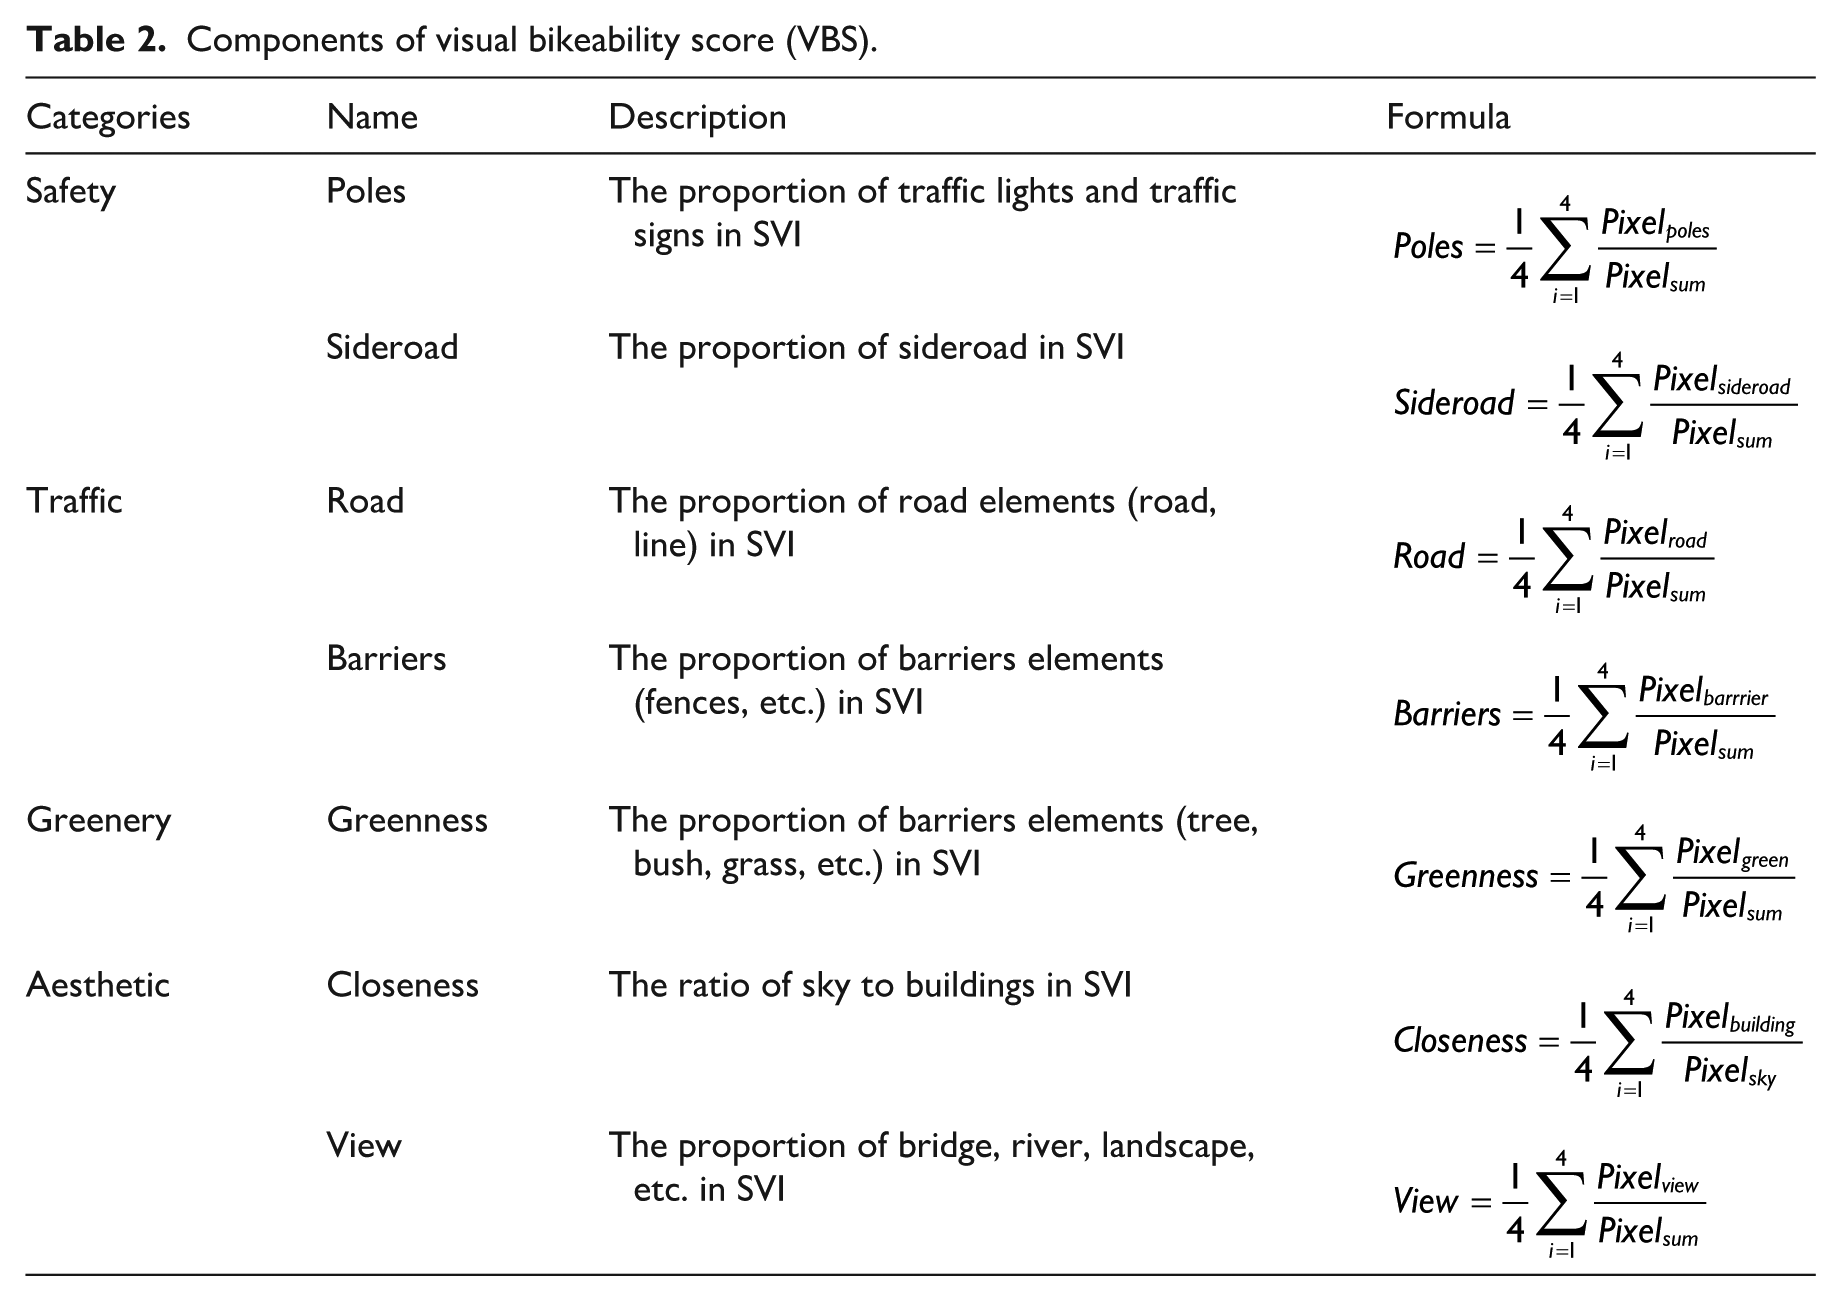
The description of VBS and its corresponding urban visual environment components are shown in Table 2 and Figure 3.
Components of visual bikeability score (VBS).
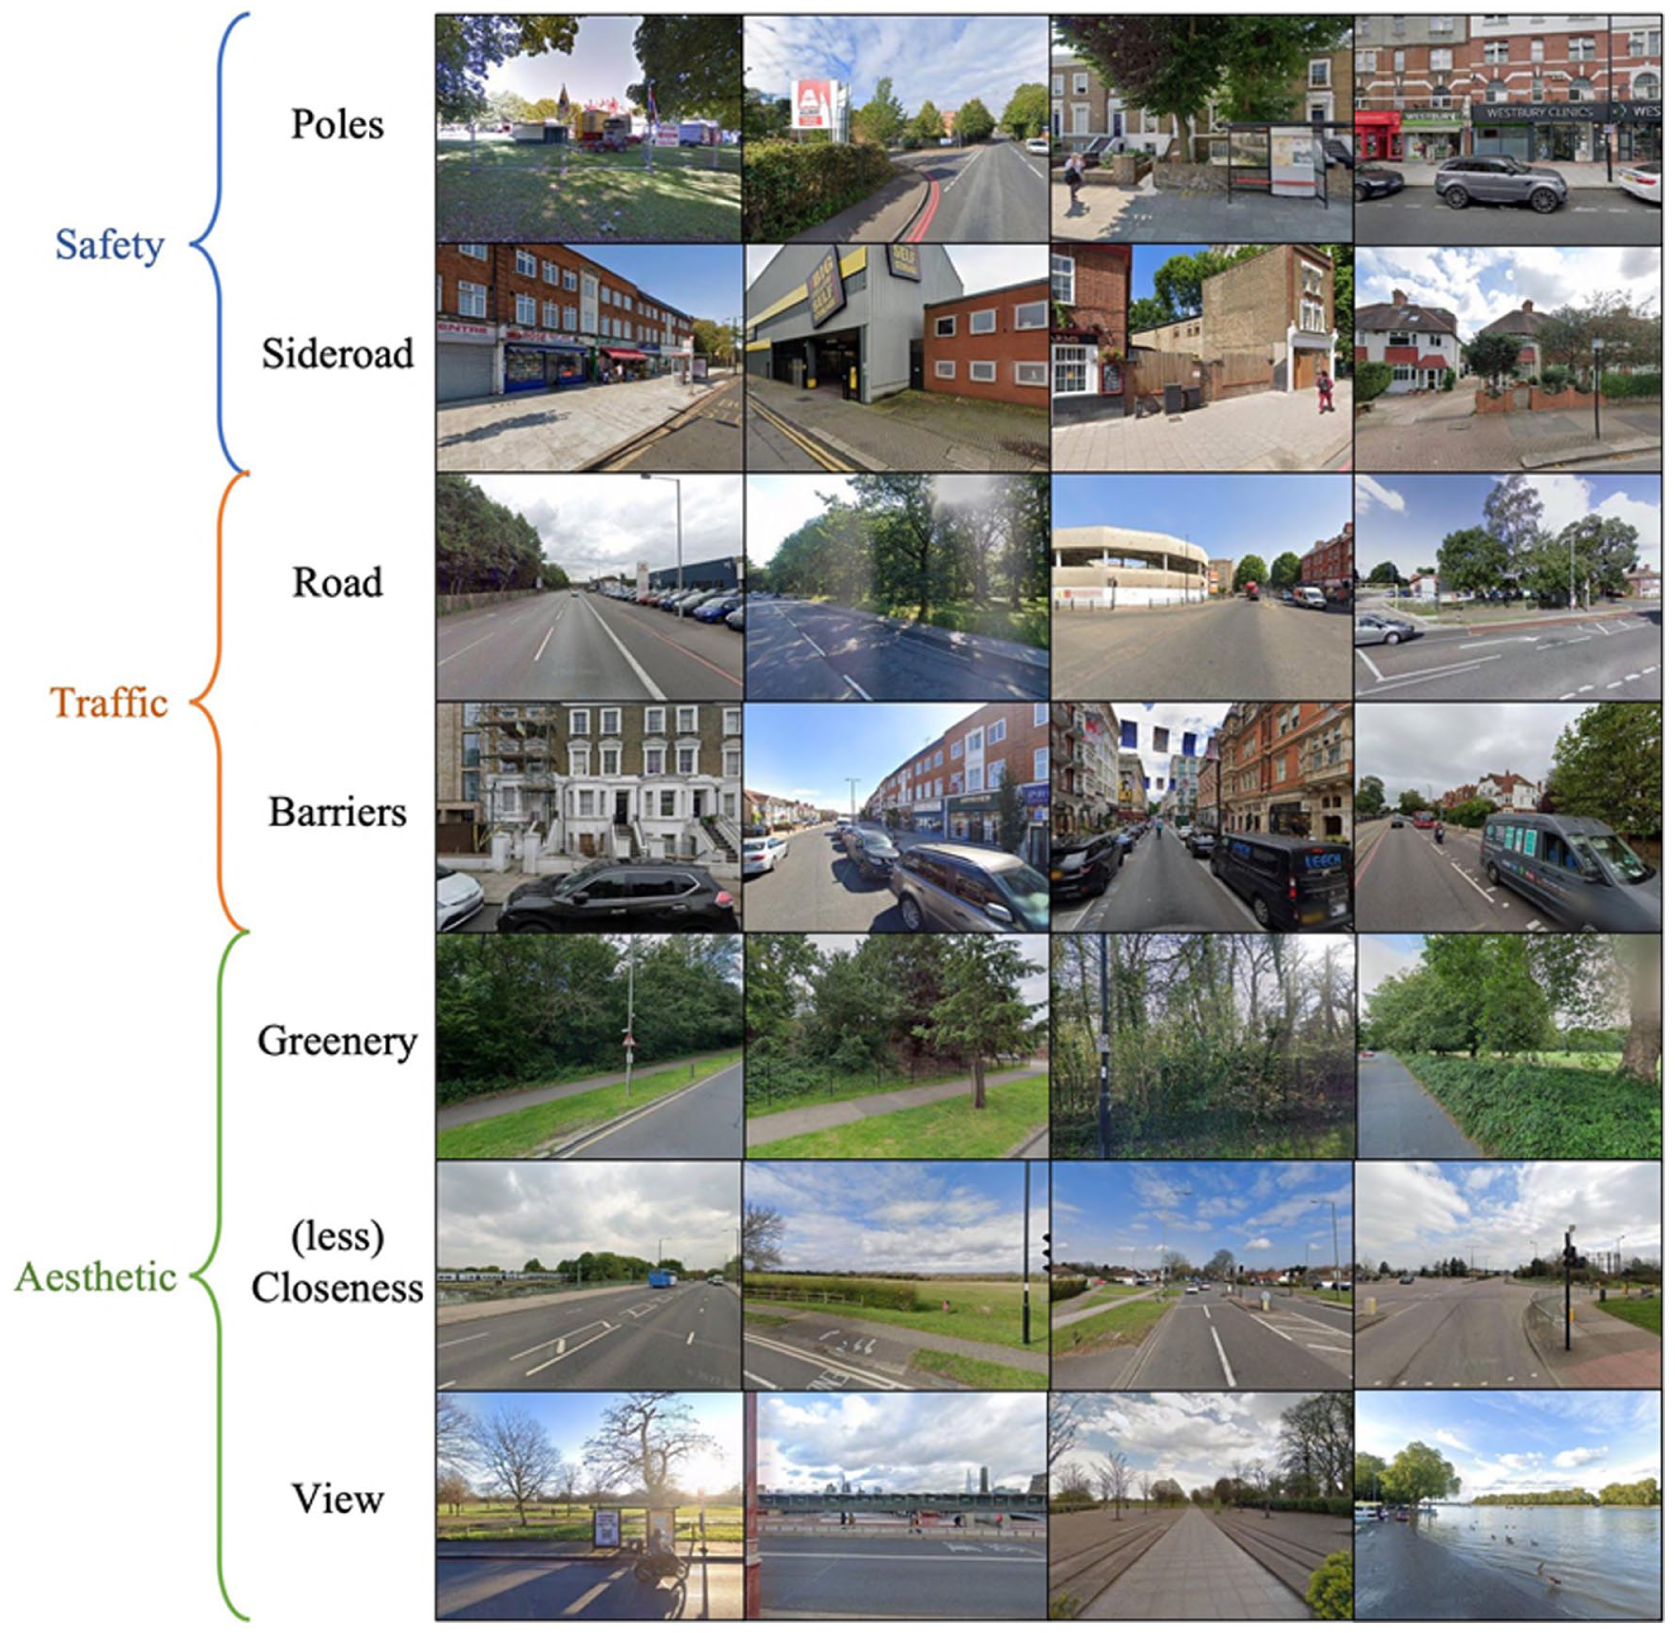
Some examples of urban visual environment elements for composing visual bikeability score (VBS).
where the Pixelelements is the number of elements (i.e. poles, sideroad, road, barriers, vehicles, view, greenery, closeness) pixels in SVI; Pixelsum is the whole SVI’s pixel number; and i is SVIs collected from a different angle (0, 90, 180, 270). Due to the ViT model pre-trained through ADE20K can provide detailed segmentation results with 150 object categories (Zhou et al., 2019), which exceeds the level of granularity required for urban analysis. Additionally, some of these categories are unlikely to occur within the context of street scenes. Therefore, we summarize the variables into eight major categories: poles, sideroad, road, greenery, building, sky, barriers, and views according to our definition of VBS (as shown in Table S2 in the supplementary material).
In the initial regression, we take the logarithm of cycling count data and standardize all the independent and dependent variables to reduce the skewness. After that, we conduct an ordinary least square (OLS) and spatial lag model (SLM) to build the relationship between cycling count in different time periods and the street’s VBS components (integrated by the mean value of SVI’s semantic information of VBS components in every SVI collecting point located in the street) respectively, and then use Moran’s I to test the spatial autocorrelation in the cycling behavior on the residuals of both OLS and SLM. The formula of the OLS and SLM are shown in Eq. (2) and Eq. (3):


where cyclingi is the cycling count of street; Xi is the vector of VBS’s component in streeti, including poles, sideroad, road, barriers, greenery, closeness, view; Deg is the average degree centrality of the two endpoints of the street; cyclingj is the cycling count values from observations other than streeti; and W is the spatial weight matrix, which records the adjacent relations in a binary manner based on the K nearest neighborhood method (K = 4). γ, ρ, and βi are estimated coefficients of spatial autocorrelation and VBS’s component (Darmofal, 2015).
Explaining the cycling-and-environment mismatch
VBS reflects the visual supply for cycling activities from the built environment, while the cycling count depicts the demand for cycling. A matched supply-demand relationship between the built environment and cycling behavior can provide people with efficient, safe, and comfortable cycling conditions. On the contrary, a mismatched supply-demand relationship between the built environment and cycling behavior (cycling-and-environment mismatch) can lead to traffic congestion, reduce people’s willingness to cycle, and ultimately hinder the development of sustainable urban planning. To investigate the cycling-and-environment mismatch, we adopt the principle of outlier detection in the normal distribution function from classical statistical analysis theory. First, we calculate the cycling-and-environment mismatch indicator R, the residual between the fitted value in SLM model and the logarithm of cycling count, to investigate the cycling-and-environment mismatch, as shown in Eq. 4:

where
Over-cycling roads: a street with a high cycling count but low VBS.
Forgotten roads: a street with a low cycling count but high VBS.
Matchable roads: a street with high VBS and high cycling or low VBS and low cycling.
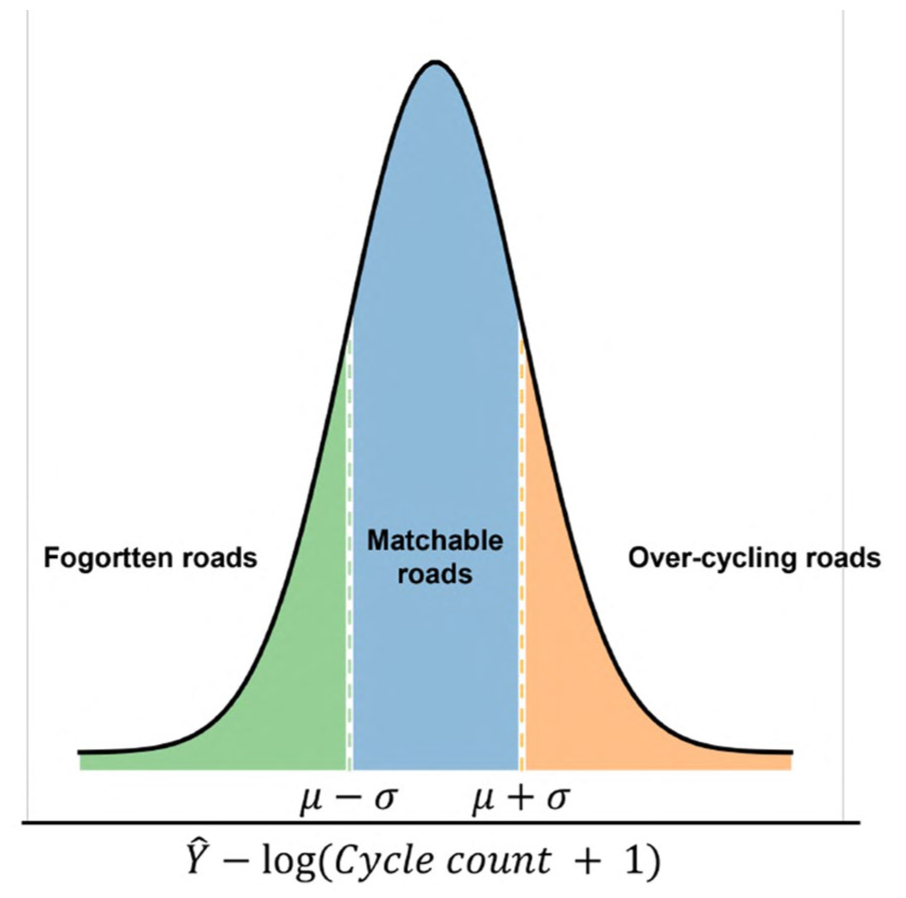
The categorizing for cycling-and-environment mismatch through the ratio between the logarithm of cycling count and VBS. One standard deviation range from the mean is set as the threshold for “matched” roads, with the left side defined as forgotten roads and the right side defined as over-cycling roads.
To uncover the potential socio-economic characteristics that are associated with the cycling- and-environment mismatch, we collected socio-economic characteristics in London from 2021 census data, which are proven to have an influence on urban cycling behavior, to explore the associations between these factors with cycling-and-environment mismatch phenomenon (Azmi and Ahmad, 2015; De Meester et al., 2012; Hinckson et al., 2014). We employ socio-economic characteristics from 2021 London census data and conduct a primary data filter as described under “Data preprocessing and semantic segmentation”. Here, we moved beyond traditional statistical models, such as linear or logistic regression. These methods are often limited by linear assumptions and struggle to capture the complex non-linear relationships and high-order interaction effects prevalent in high-dimensional socio-economic data (Liu et al., 2025c, 2026), potentially leading to oversimplified conclusions. We therefore selected the Random Forest classifier, which is exceptionally well suited for this task as it excels at handling high-dimensional data, is robust against overfitting, and innately captures non-linear patterns. To overcome the “black box” problem and ensure interpretability, we paired RF with SHapley Additive exPlanations (SHAP), which provides richer and more robust explanations than the static coefficients of traditional models (Liu et al., 2025d).
Results
Temporal pattern division of cycling pattern
Given the significant variations in human cycling behavior at different times of the day, our initial data process focuses on accurately describing cycling patterns in the London area from 6:00 AM to 9:59 PM. To achieve this, we first reorganize the cycling counts from 15-minute intervals into hourly intervals. Then, using a hierarchical clustering method, we performed a data-driven clustering of the hourly cycling counts from different sampling points based on their temporal correlations, as shown in Figure 5:
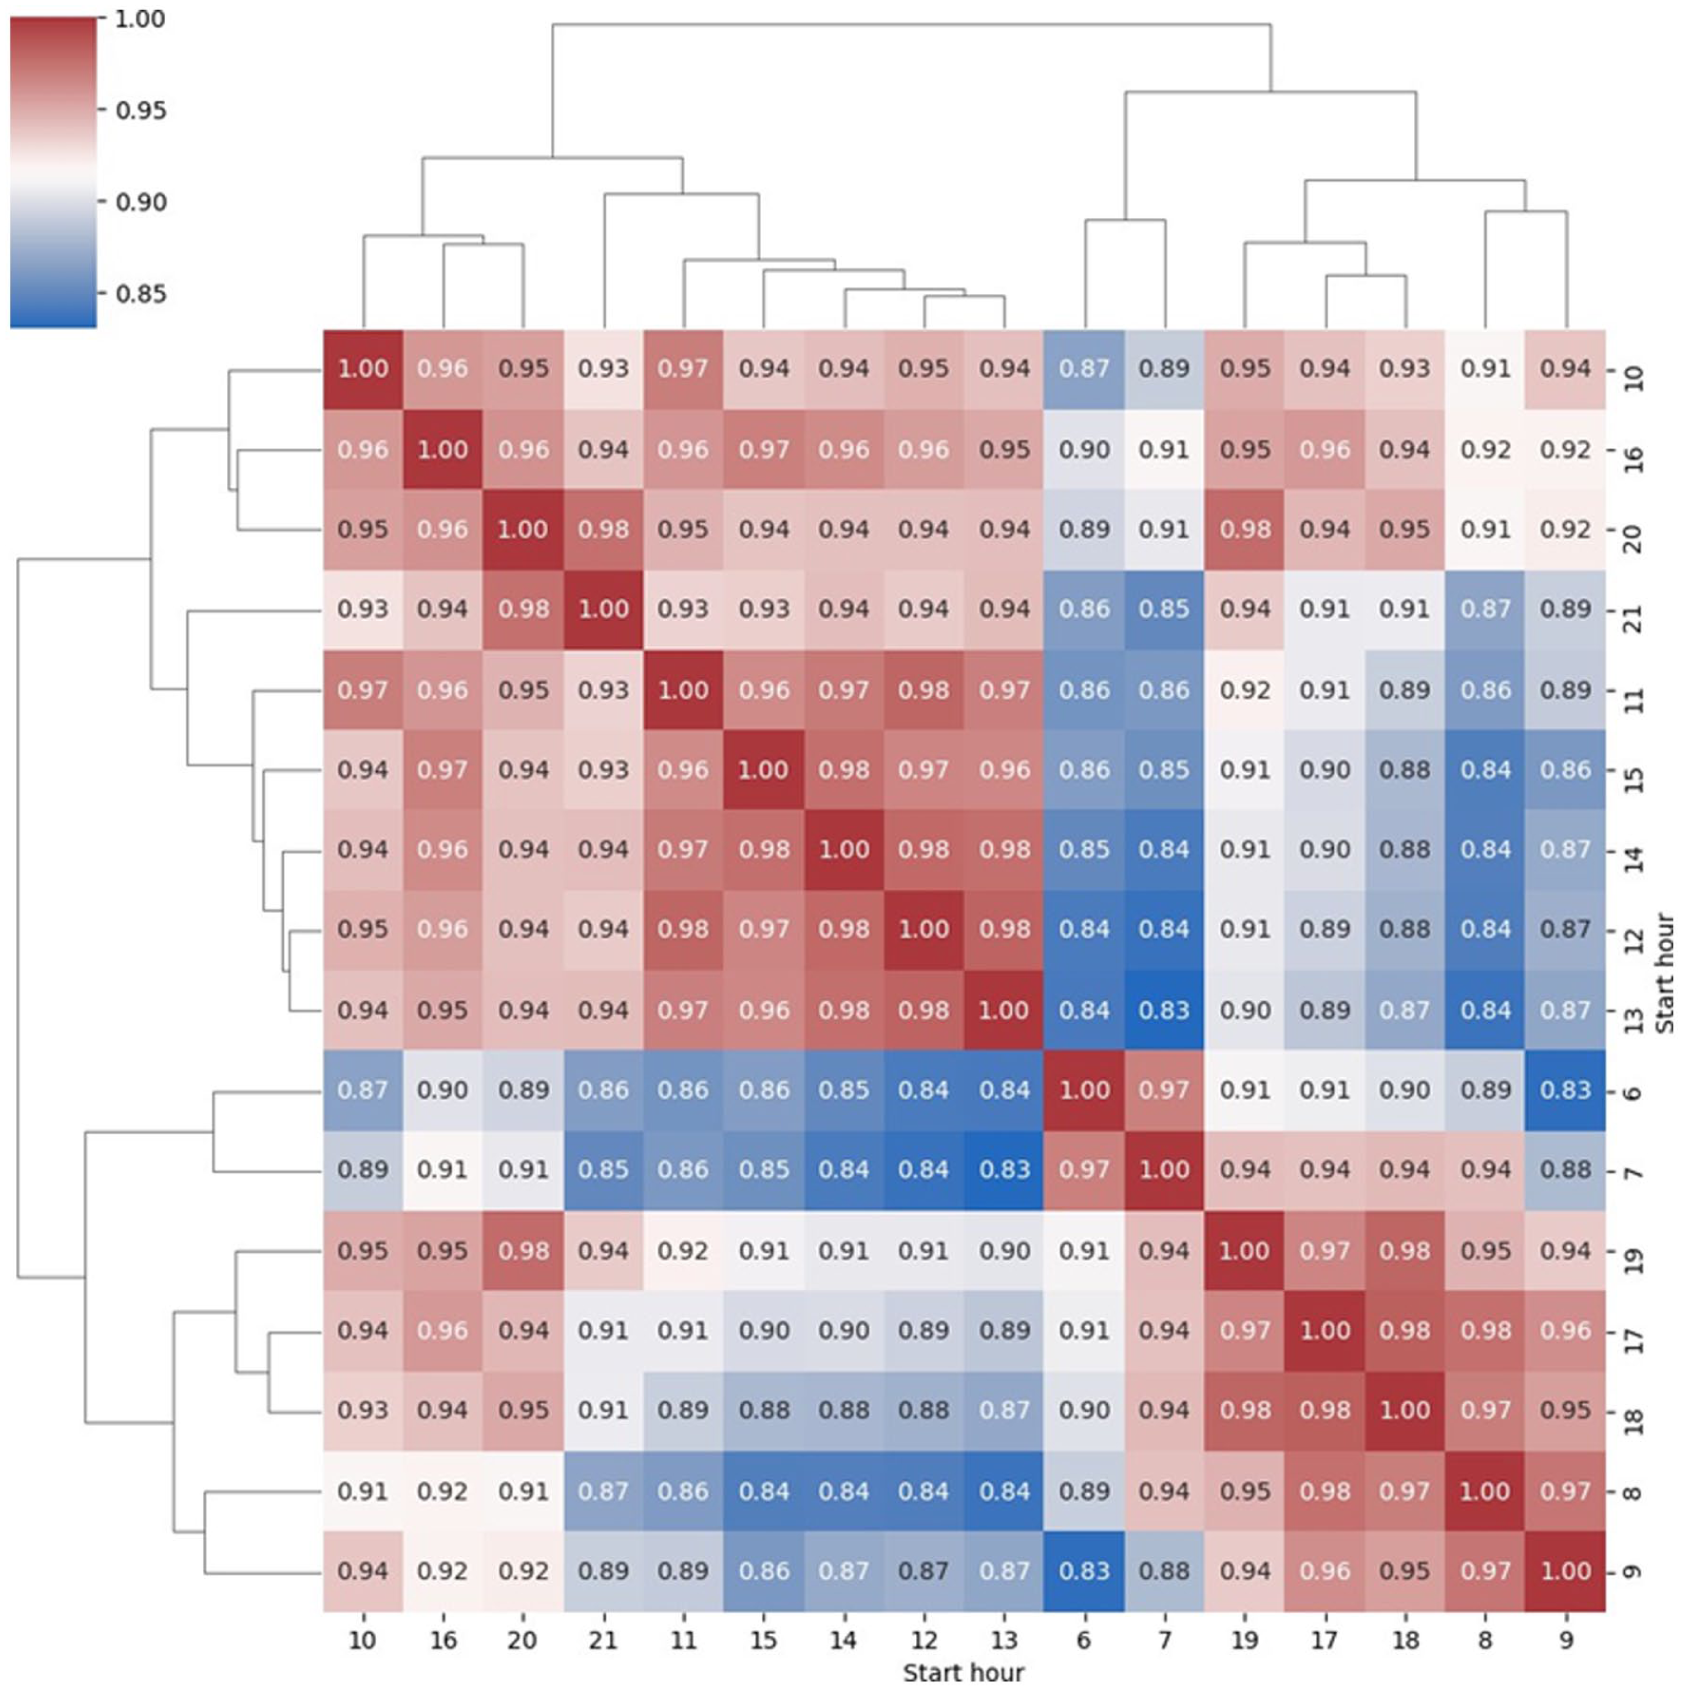
Hierarchical clustering results about cycling rate every hour from 6 AM to 9:59 PM.
Through the hierarchical clustering result, we can recognize three aggregated time periods:
10:00 AM – 4:59 PM, 8:00 PM – 9:59 PM (midday and night)
6:00 AM – 7:59 AM (morning)
8:00 AM – 9:59 AM, 5:00 PM – 7:59 PM (AM/PM peak)
Considering temporal continuity, we further rearrange these data-driven clusters into five temporally continuous and representative time periods. These time periods accurately reflect the unique characteristics and trends of cycling behavior in London at different times of the day:
Morning: from 6 AM to 7:59 AM;
AM peak: from 8 AM to 9:59 AM;
Midday: from 10 AM to 4:59 PM;
PM peak: from 5 PM to 7:59 PM;
Night: from 8 PM to 9:59 PM.
Figure 6 displays the rearranged five time periods which describe people’s cycling patterns in London. The result is consistent with what happens in real life: cycling activity frequently occurs during the AM and PM peaks because of commuting. Cycling intensity is low in the morning, midday, and night. In this study, we only selected the morning and PM peak as representative time periods for the research.
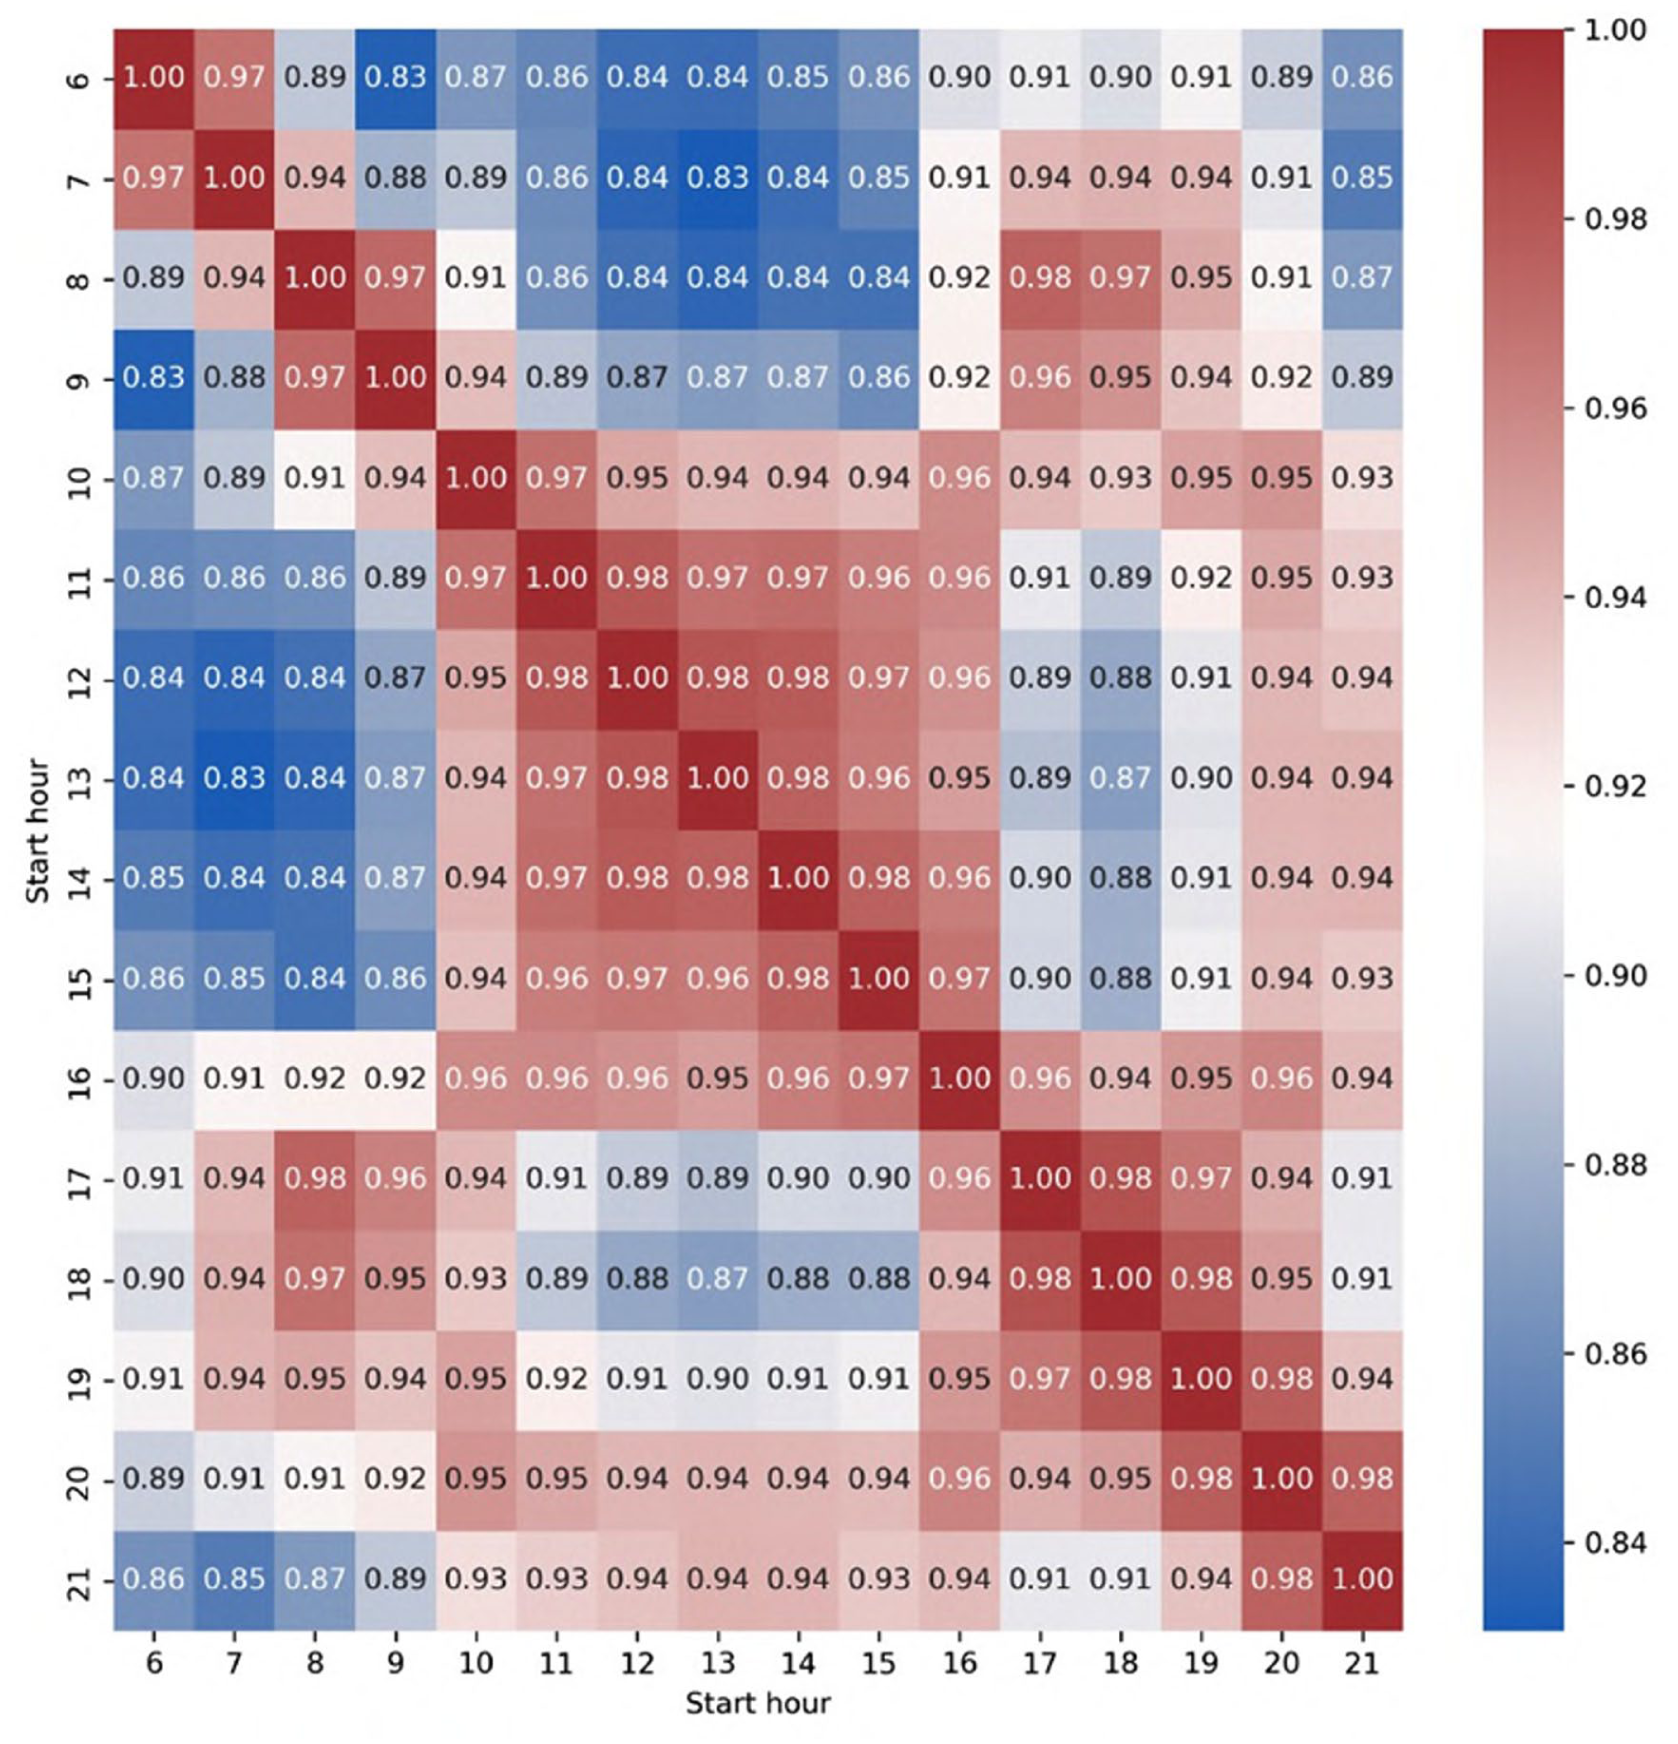
Rearranged correlation matrix about cycling rate every hour from 6 AM to 9:59 PM.
To get accurate semantic segmentation results, we investigated six deep learning frameworks’ performance in semantic segmentation, and ultimately chose the pre-trained Visual Transformer (ViT) in this study (as shown in Figure S1 in the supplementary material). We further reviewed the segmentation results and excluded images where the classification outcomes for our target categories fell at the extreme ends of the distribution (99th percentile). Figure 7 shows one example of a semantic segmentation result:
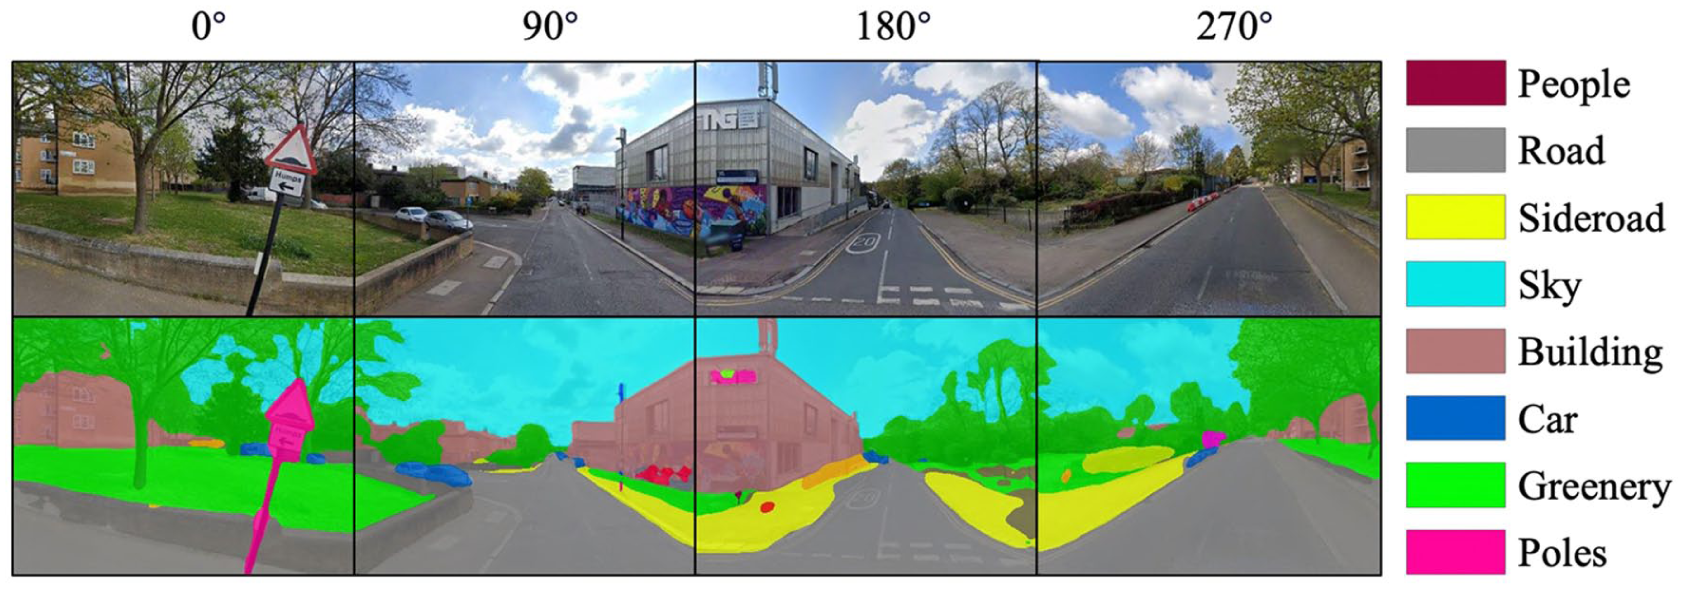
An example of SVI’s segmentation result. The first line is a group of street view image examples, and the second line is a segmented result by ViT. Since the ViT is trained with AED20K datasets (Zhou et al., 2019), the semantic segmentation result only shows the detailed categories that occurred in the dataset rather than categories in the definition of VBS.
How can the cycling environment explain urban cycling behaviors?
Tables 3 and 4 show the ordinary least square (OLS) and spatial lag model (SLM)’s model and every variable’s coefficient. Variance inflation factor and Pearson correlation for VBS components show that there is no significant multicollinearity and linear correlation for the components of VBS in the regression.
OLS result and coefficients of all the variables.
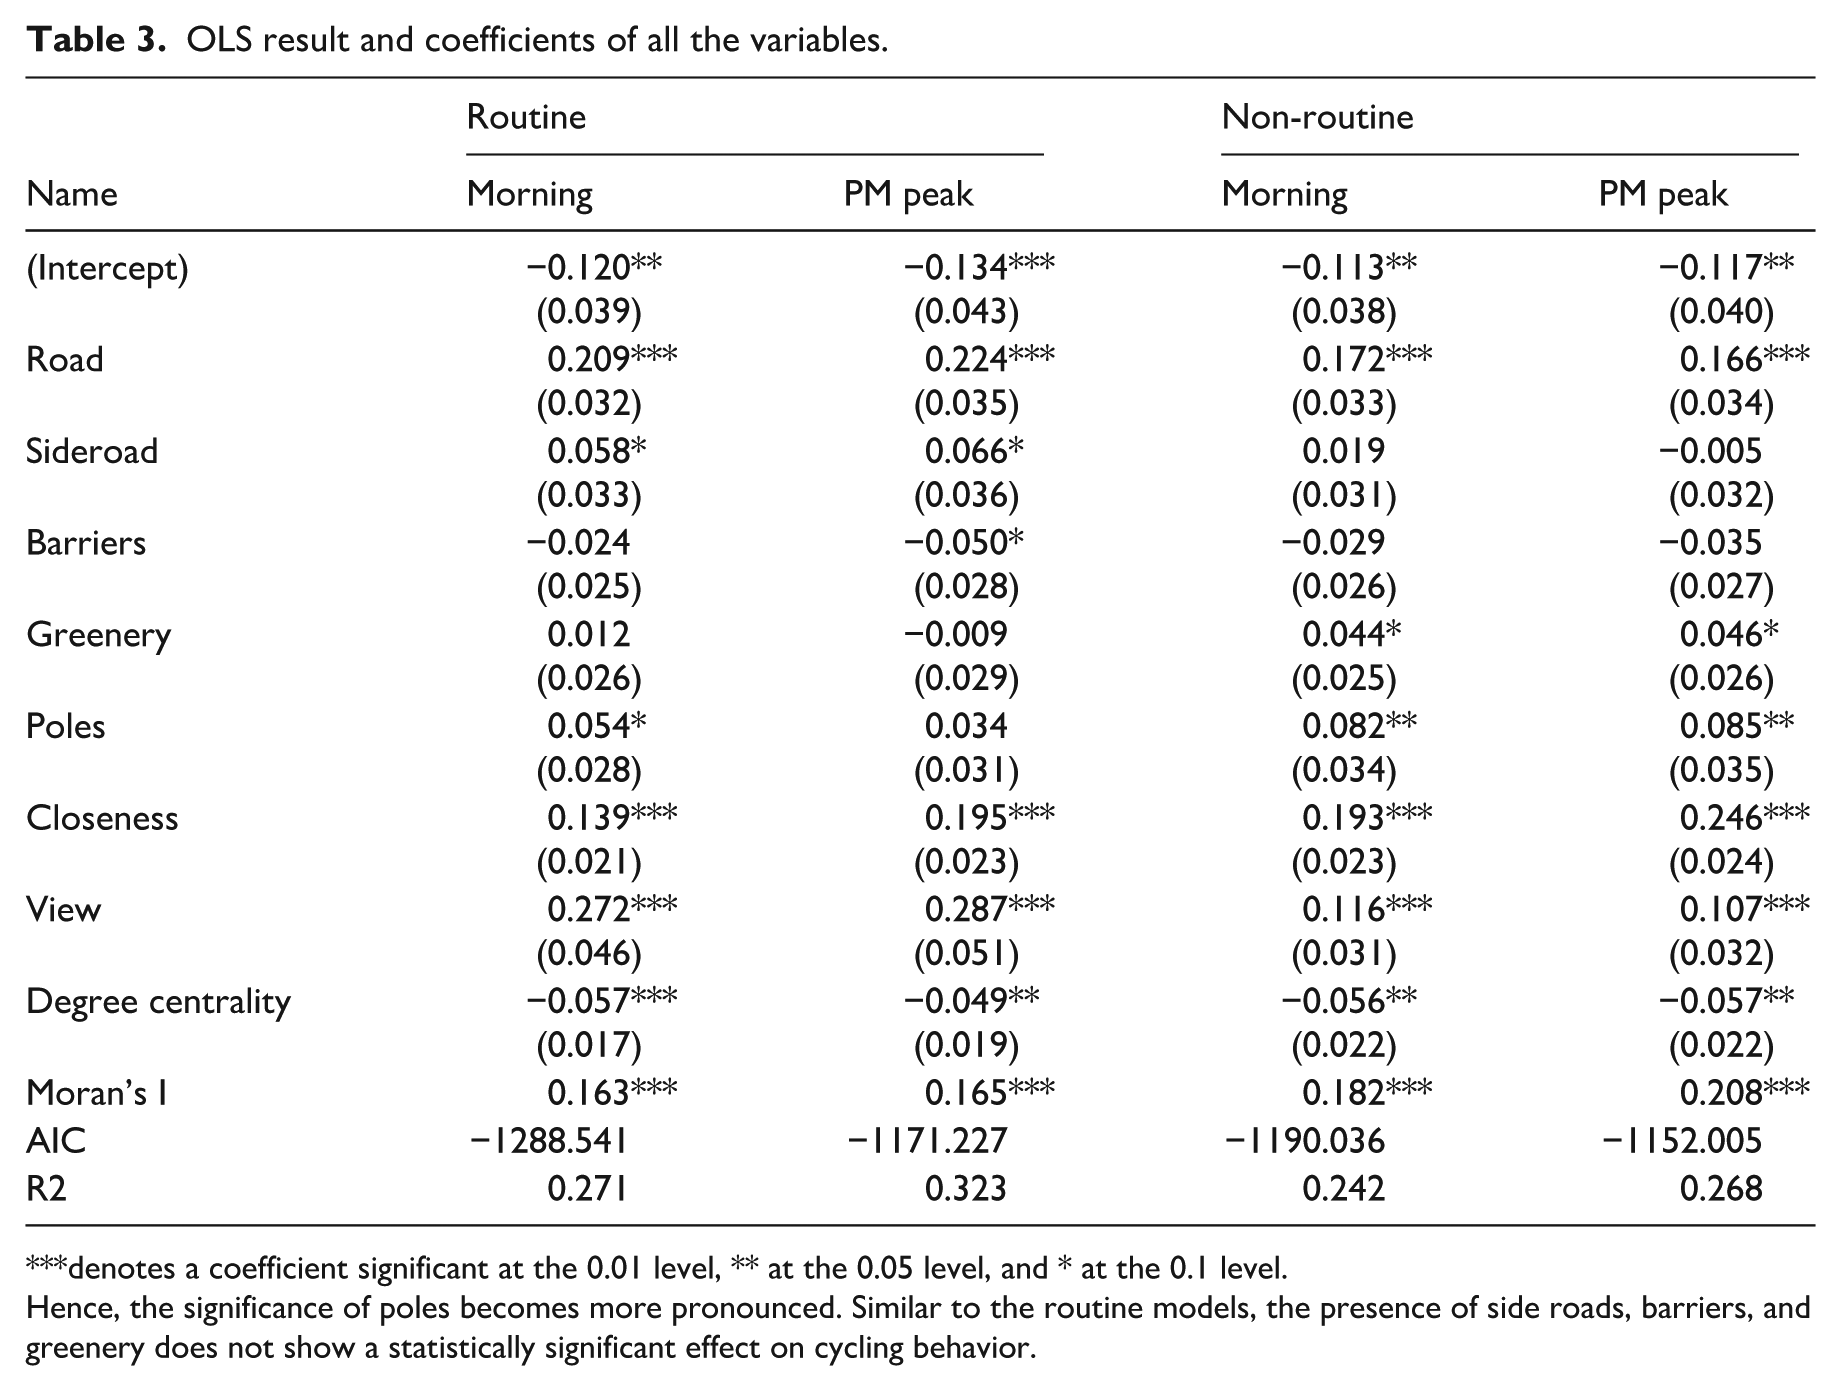
denotes a coefficient significant at the 0.01 level, ** at the 0.05 level, and * at the 0.1 level.
Hence, the significance of poles becomes more pronounced. Similar to the routine models, the presence of side roads, barriers, and greenery does not show a statistically significant effect on cycling behavior.
SLM result and coefficient for all the variables.
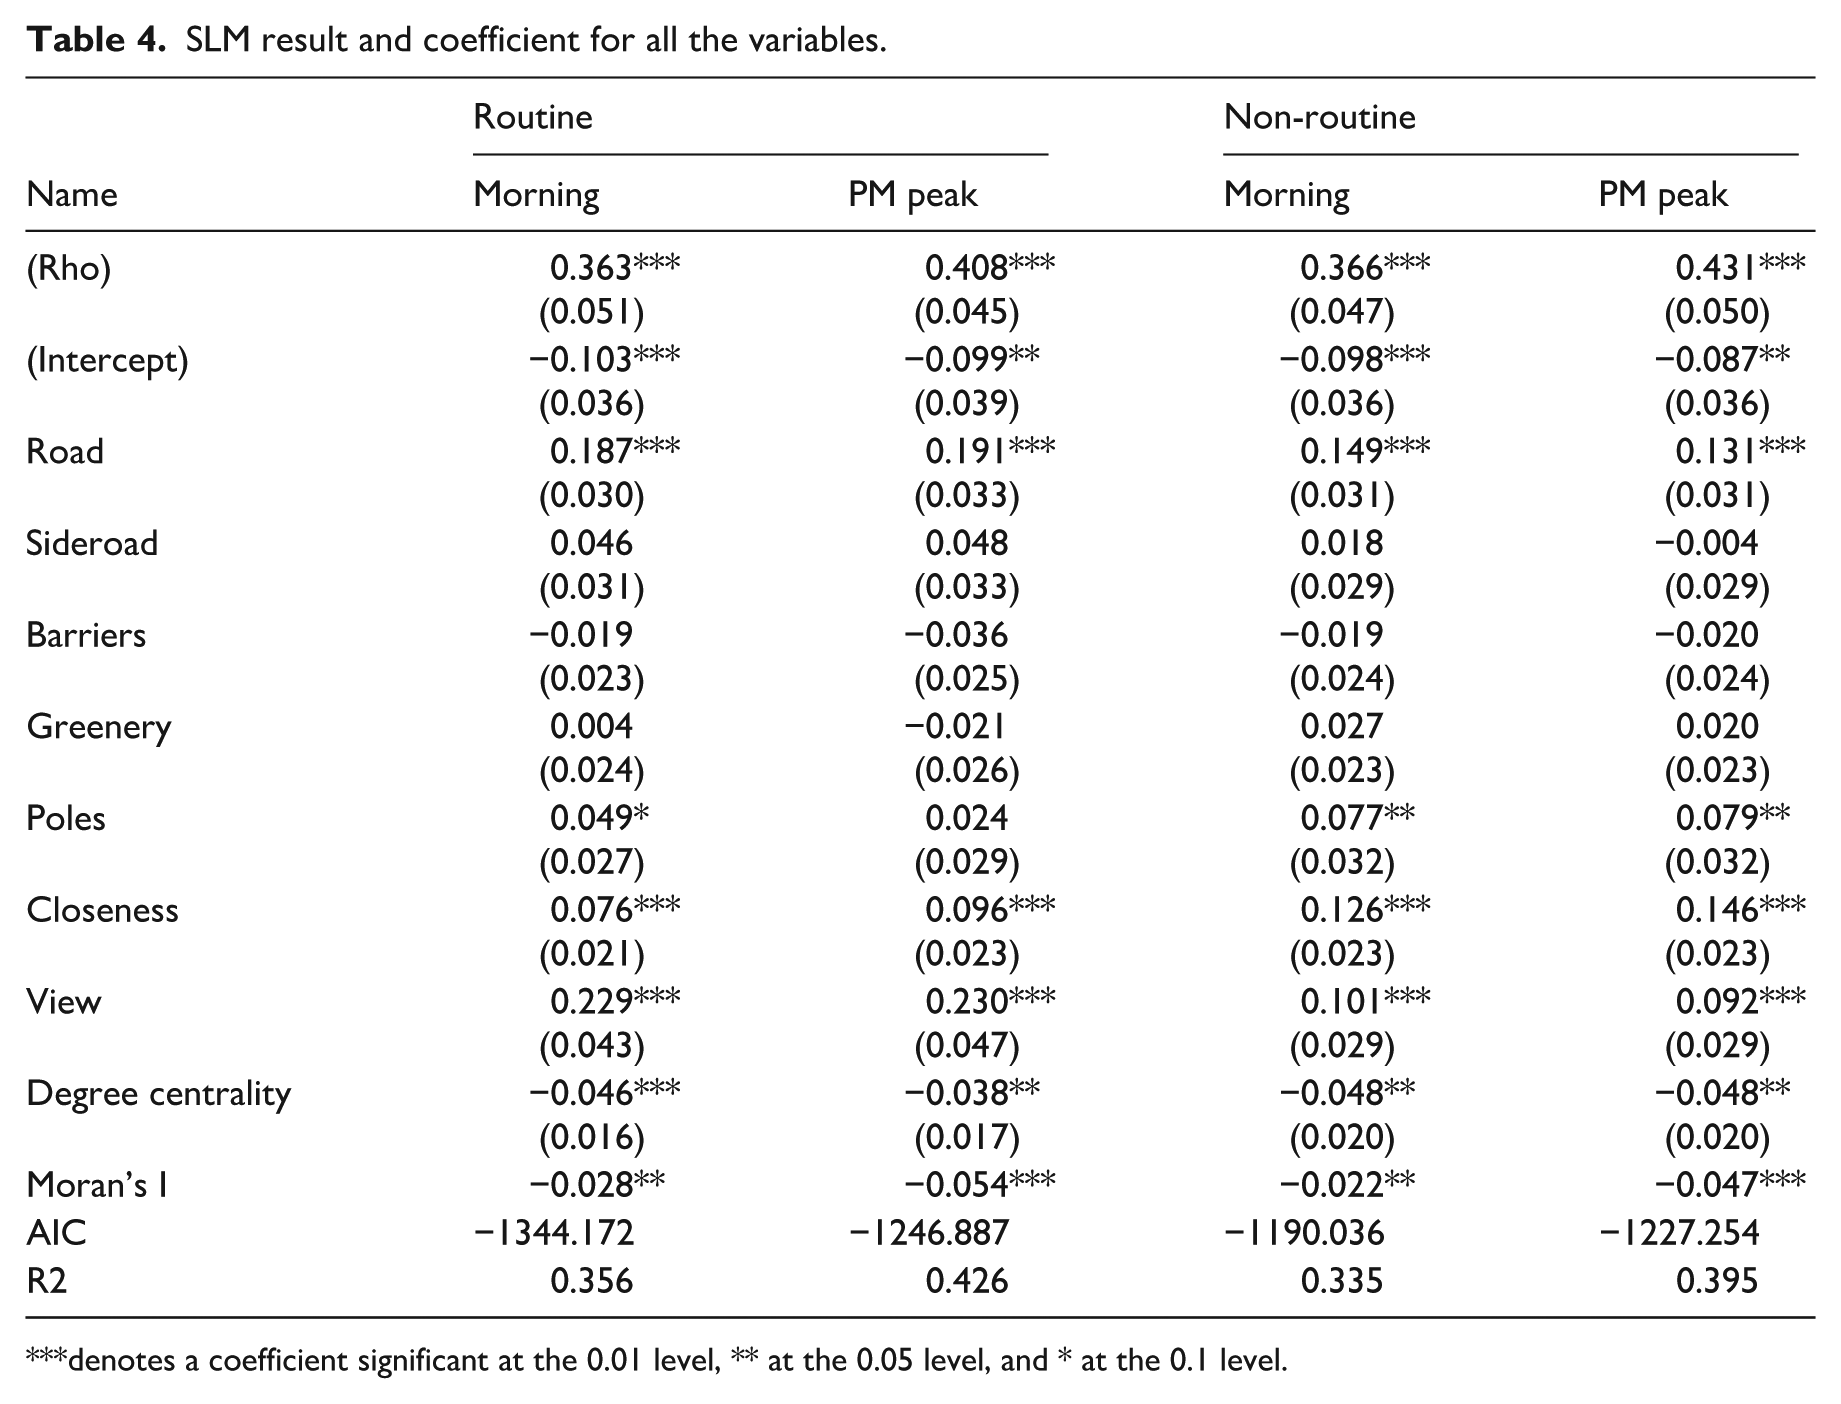
denotes a coefficient significant at the 0.01 level, ** at the 0.05 level, and * at the 0.1 level.
The OLS’s result exhibits an evident spatial autocorrelation, and SLM can effectively mitigate this effect and achieve better performance than the OLS model. The SLMs’ R2 shows that VBS can explain the cycling activities from 33.5% and 42.6%. The results from the SLM reveal differences in the factors influencing routine and non-routine cycling behavior. As a fixed effect, the degree centrality is statistically significant in all four models, while its coefficient is consistently small (β is around −0.05), suggesting that its practical effect on cycling is marginal. For routine roads, road width, closeness, and view quality are significant predictors. Among these, view quality is the most influential factor, with coefficients of 0.229 and 0.230 during the morning and PM peaks, respectively. In contrast, factors such as greenness, the presence of side roads and poles (e.g., traffic signs, lamp posts) are not statistically significant. This indicates that for streets used primarily for routine activities, cycling patterns are characteristic of commuting between fixed points. Consequently, cyclists prioritize scenic quality, road space, and sky view, while paying less attention to greenery or traffic infrastructure. Morning and PM peak’s models are consistent.
For non-routine roads, road width, poles, closeness centrality, and view quality all significantly influence a street’s cycling behavior. Road width exerts the strongest influence in this context. Given that non-routine activities are often concentrated on streets with entertainment and dining venues, which are typically more congested and have a higher risk of traffic incidents.
To visually demonstrate the built environment characteristics corresponding to different VBS, we uniformly selected a series of representative street view images ranging from low to high scores, as shown in Figure 8. An urban environment with low VBS scores is typically characterized by narrow roads, low spatial openness, or weed-filled roads. As VBS scores increase, the street environment shows a significant improvement. The visibility of the sky increases, roads become broader and more orderly, and the buildings and landscapes on both sides become more harmonious, exemplified by decent residential houses. In the high-score images, landmark elements such as waterfront views and churches appear, greatly enhancing the environment’s aesthetic value.
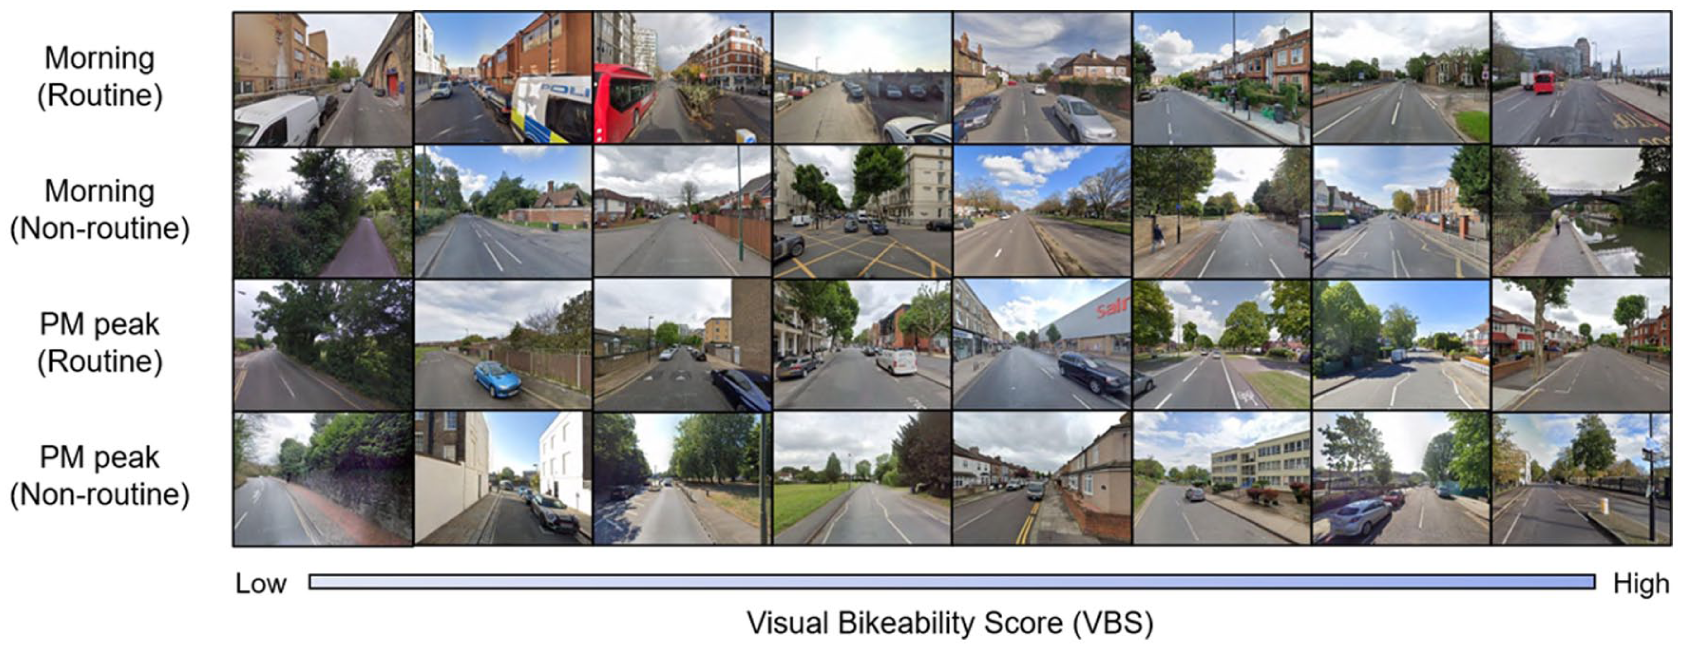
Street view image samples depicting different visual bikeability scores from low to high.
Identifying “Cycling-and-environment mismatch” in London
We identify the cycling-and-environment mismatch based on the results under “How can the cycling environment explain urban cycling behaviors?” Figure 9 show the cycling-and-environment mismatch of all the sample sites and LSOA level in the morning (6 AM to 7 AM) and PM peak (5 PM to 7 PM).
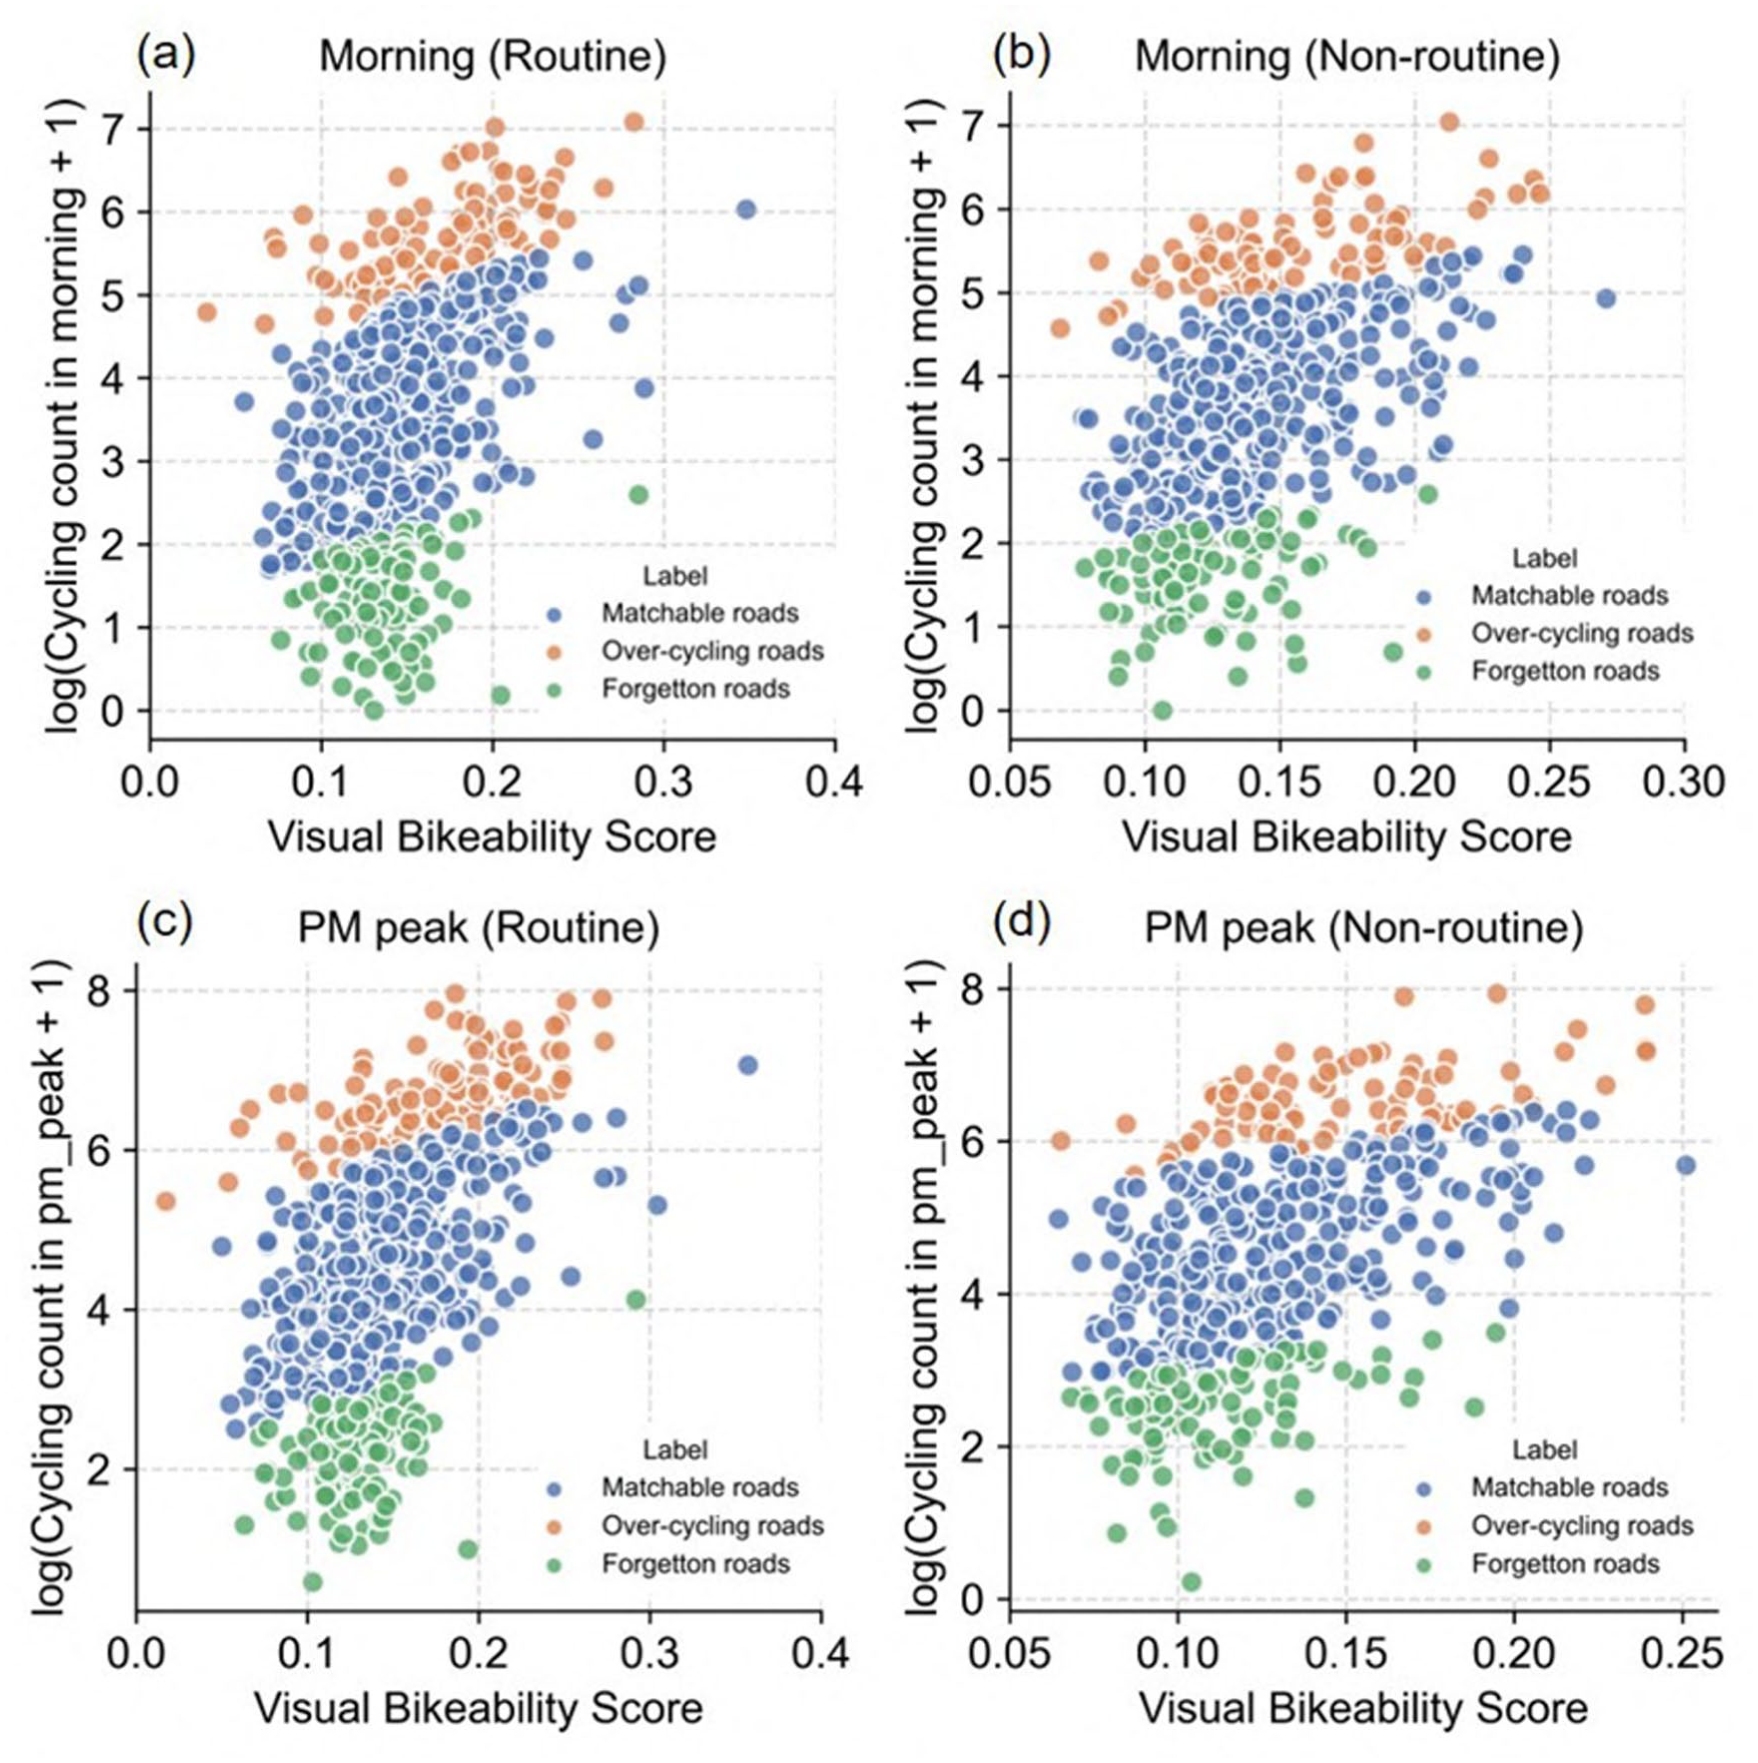
The cycling-and-environment mismatch of all streets in the morning and PM peak (a) Morning (Routine). (b) Morning (Non-routine). (c) PM peak (Routine). (d) PM peak (Non-routine).
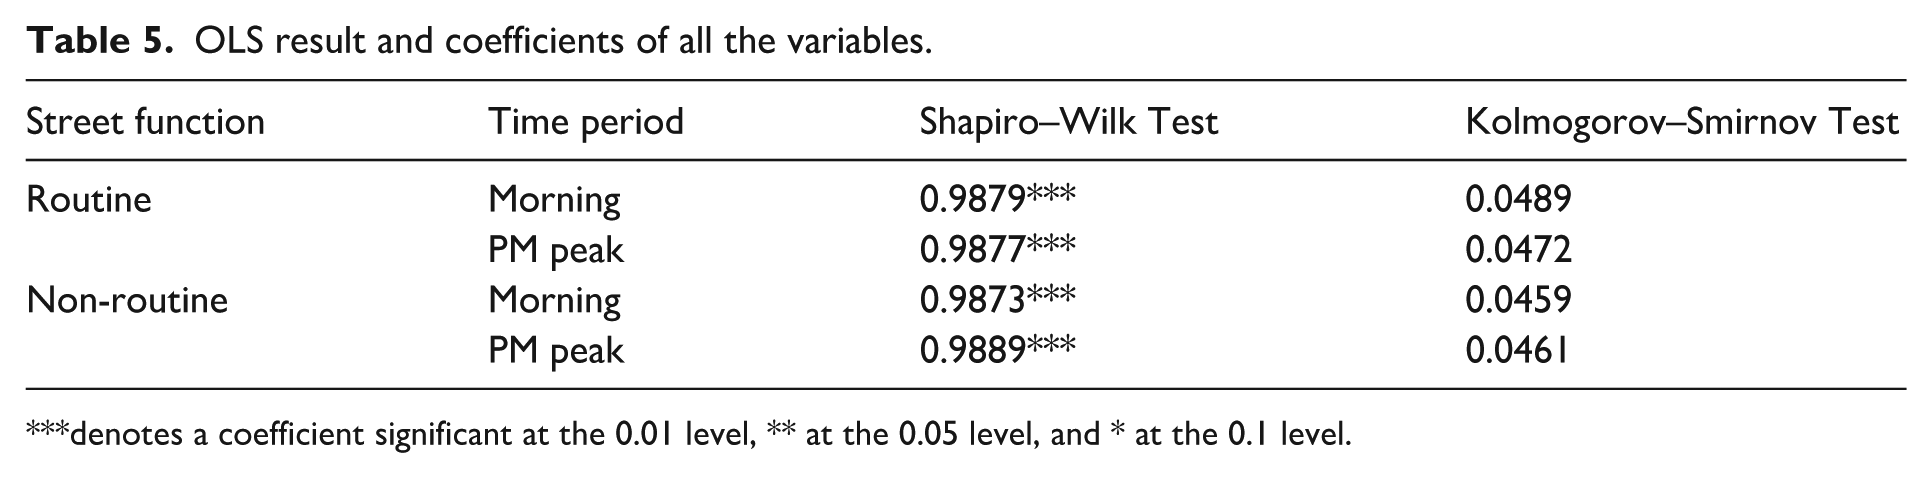
To verify the hypothesis that the cycling-and-environment mismatch indicator R follows a normal distribution, we conducted both the Shapiro–Wilk Test and the Kolmogorov–Smirnov Test on the logarithmic cycling-and-environment mismatch ratio R for both morning and PM peak periods. The results of both tests indicate that R in these time periods has a probability of over 99% following a normal distribution (as shown in Table 5). Based on these results, we used one standard deviation of the mean of this distribution as a threshold to categorize the matchable roads, over-cycling roads, and forgotten roads.
OLS result and coefficients of all the variables.
denotes a coefficient significant at the 0.01 level, ** at the 0.05 level, and * at the 0.1 level.
Socio-economic characteristics related to “cycling-and-environment mismatch”
To further explore how socio-economic characteristics potentially act upon and influence the phenomenon of cycling-and-environment mismatching. Random forest and SHAP are employed to explore their relationships. Specifically, the Random Forest model has a high prediction accuracy of up to 97% for the mismatch between cycling and the environment at different times, which indicates a high correlation and importance between the selected set of socio-economic features and the formation of the mismatch phenomenon in the cycling environment. We summarize the impact of the top 10 features and their importance in the morning and PM peak model in routine and non-routine roads, as shown in Figure 10. The importance here refers to the significant impact of the variable on the mismatch, without indicating whether the impact is positive or negative.
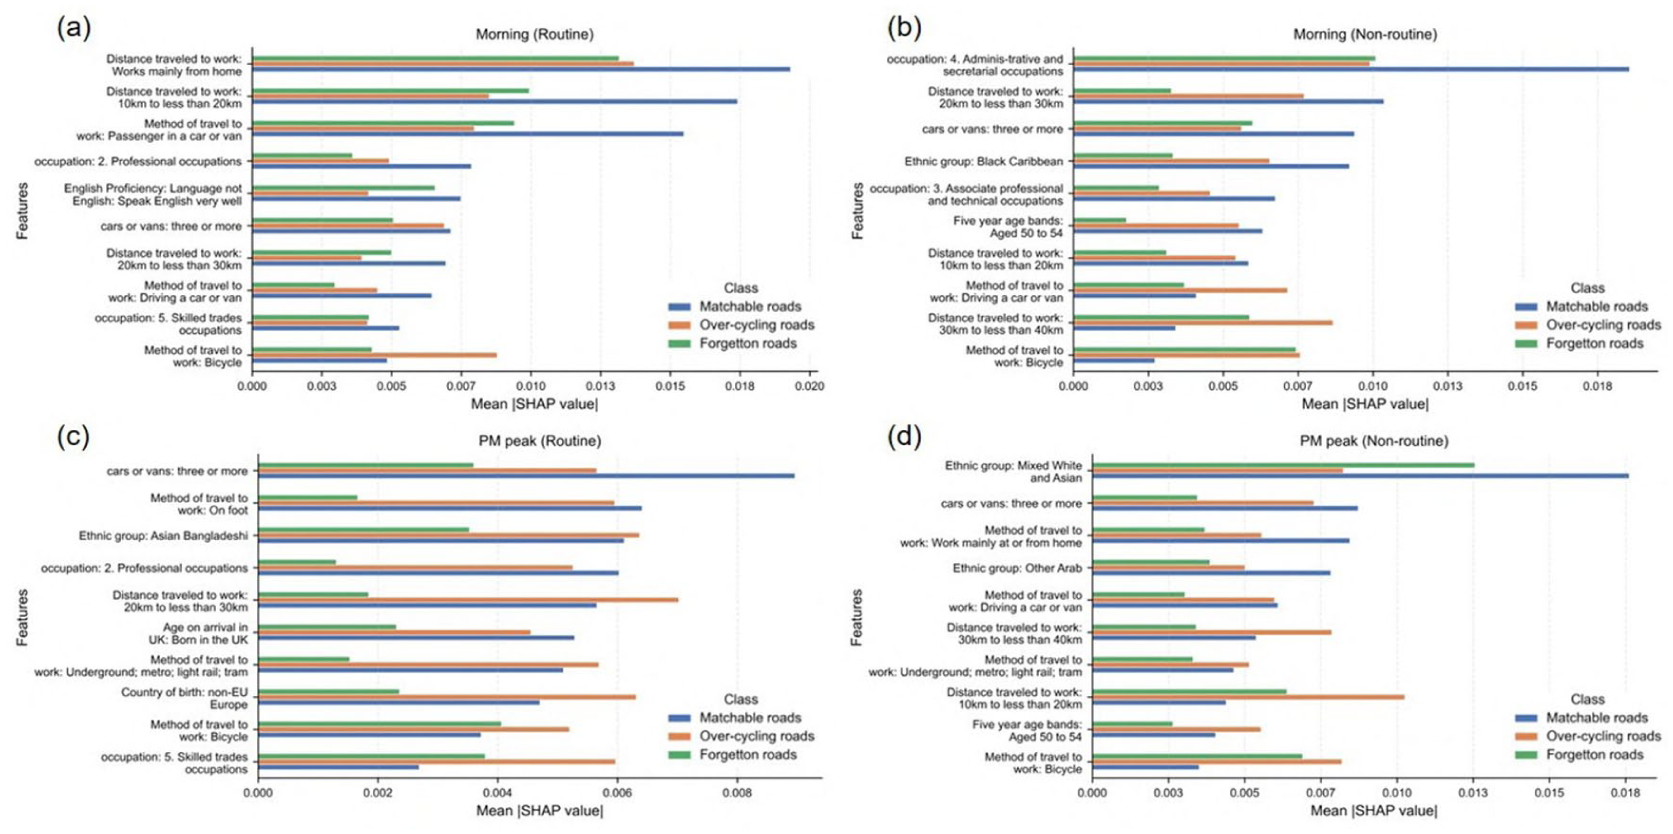
Top 10 feature’s average impact on model output magnitude, calculated by mean (|SHAP value|) (a) Impact of every feature in morning’s model for routine streets. (b) Impact of every feature in morning’s model for non-routine streets. (c) Impact of every feature in the PM peak’s model for routine streets. (d) Impact of every feature in the PM peak’s model for non-routine streets.
Exploring the relationship between socio-economic characteristics and cycling-and-environment mismatch provides a basic understanding of London’s community. Figure 10 illustrates the top 10 most influential features for predicting road classification, as determined by their mean absolute SHAP values across four distinct models. A clear difference emerges when comparing the feature importance between routine and non-routine roads.
For routine roads, both in the morning (Figure 10(a)) and the PM peak (Figure 10(c)), the models are predominantly influenced by work-related characteristics. Specifically, “Distance traveled to work” consistently ranks as the most significant predictor, followed by other commuting-related factors such as “method of travel to work,” “occupation,” and “cars or vans” ownership. This indicates that for routine journeys, which are largely commutes, the model’s predictions are most sensitive to the established travel patterns and professional status of the local population.
Notably, the feature “Works mainly from home” has a strong impact on identifying forgotten roads. This suggests areas with high remote-work populations are less cycling activity. The overall feature importance patterns between the morning and PM peak models for routine roads are highly similar, reflecting the stable and predictable nature of daily commutes.
In stark contrast, the models for non-routine roads (Figure 10(b) and (d)) are most heavily influenced by socio-demographic and ethnic characteristics. In the morning model (Figure 10(b)), “occupation” and “Ethnic group: Black Caribbean” are the top predictors, while in the PM peak model (d), “Ethnic group: Mixed White and Asian” is the most impactful. While work-related travel features are still present, their importance is diminished compared to demographic attributes like ethnicity and age bands. This suggests that non-routine travel, likely associated with leisure, social, or shopping activities, is more strongly segmented by the cultural and demographic profiles of residents rather than their commuting habits. The variation in top features between the morning and PM peak non-routine models further implies that the drivers of these trips are more dynamic and time-dependent.
Discussion
How to create a neighborhood with matched cycling visual environment and cycling behavior?
Figure 11 illustrates the geographical distribution of the cycling-and-environment mismatch at the LSOA level. The results reveal that the patterns for all road types across both morning and PM peak periods are basically consistent. Beyond this observation, our analysis uncovers the profound impact of an aesthetically pleasing urban environment on cycling, which is often understated in previous studies. For routine roads, in particular, the influence of the visual landscape is more significant than the basic elements of the road. This demonstrates the necessity of investing in a high-quality urban landscape to effectively encourage cycling.
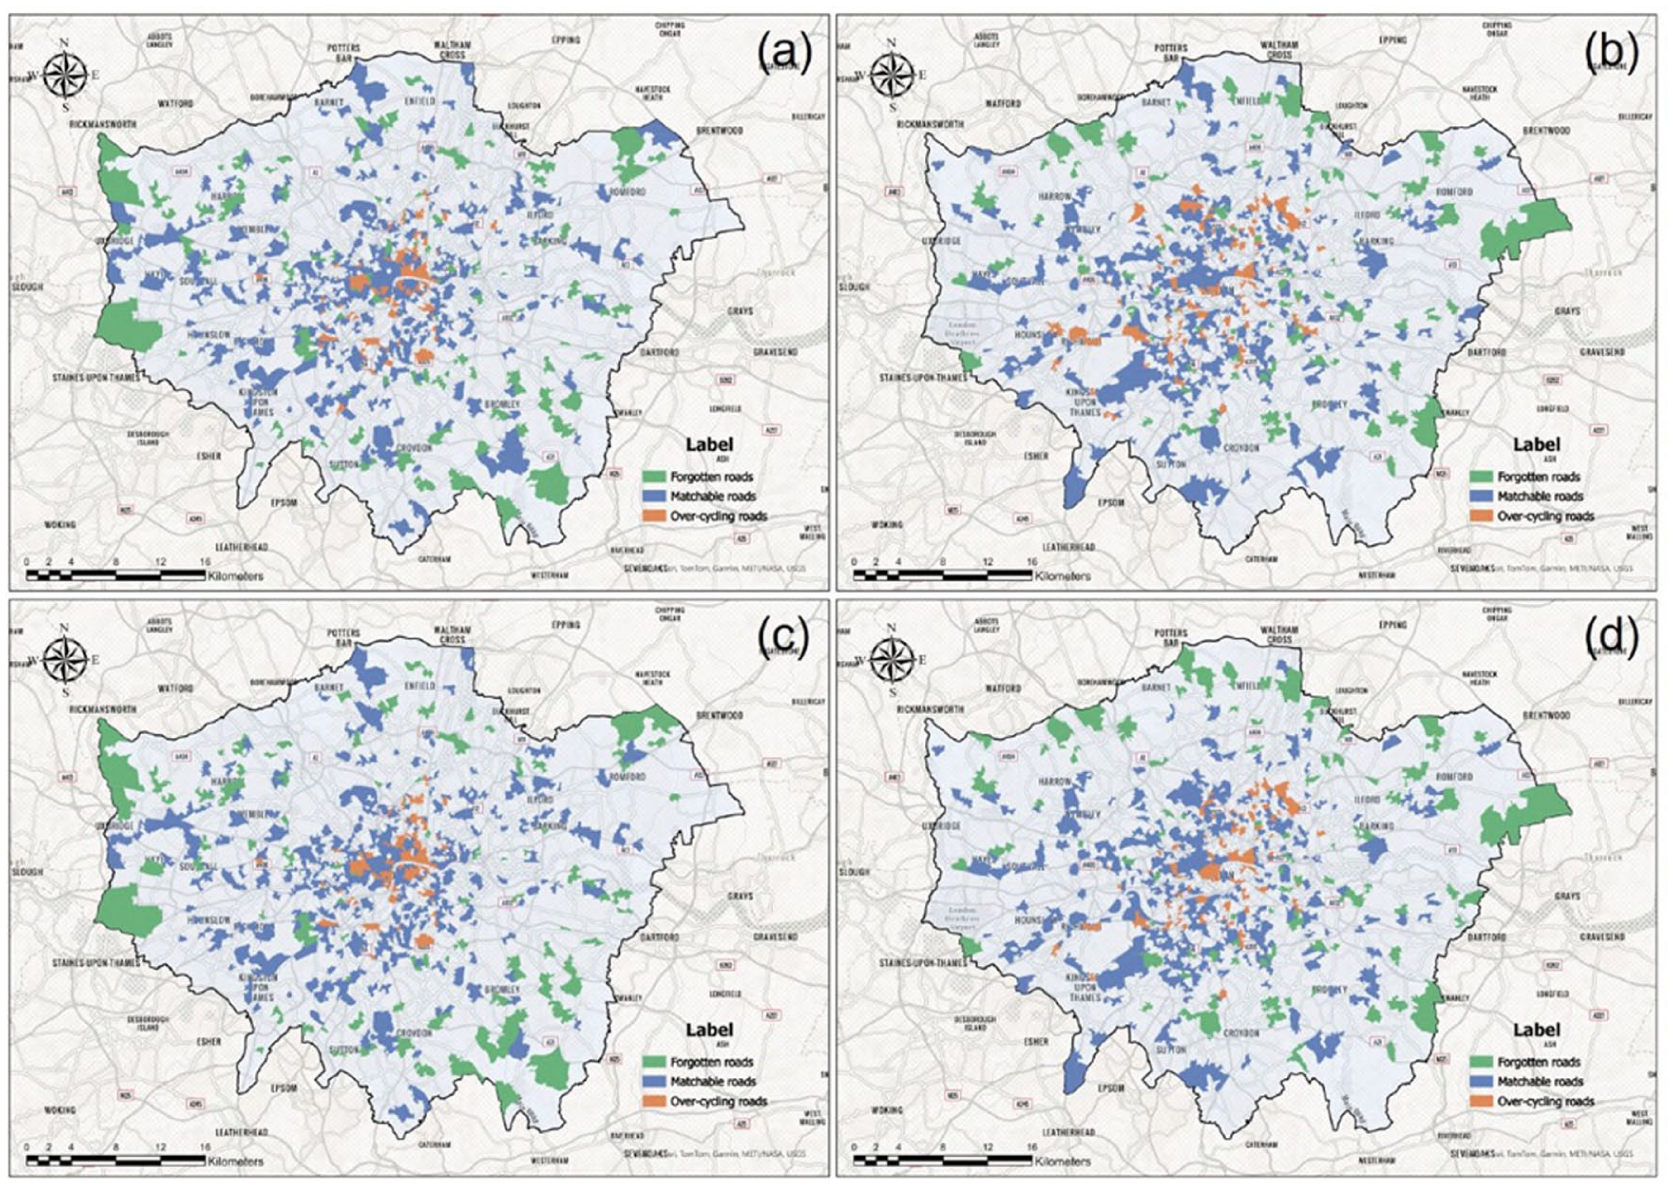
Geographical distribution of cycling-and-environment mismatch in LSOA level. Since the socio-economic characteristics are collected at the LSOA level, we aggregate the cycling-and-environment mismatch from the street level into the LSOA level. (a) Morning (Routine). (b) Morning (Non-routine). (c) PM peak (Routine). (d) PM peak (Non-routine).
For routine roads, a clear geographical logic emerges. Over-cycling roads are intensely concentrated in London’s central urban core. As the city’s main business and residential hub, the area generates a great demand for cycle commuting, which the narrow, historic street network cannot adequately accommodate. In contrast, forgotten roads are predominantly found in the city’s outermost peripheries. These recently developed areas feature modern infrastructure with a high cycling capacity, yet remain underutilized due to lower population density and less established cycling cultures. Bridging these extremes are the “matchable” roads, located in the transition zones between the core and the suburbs. These areas strike a balance with sufficient residential populations to generate cycling demand and an environment that is less congested than the city center, making them highly conducive to cycling.
The patterns for non-routine roads present a notable difference. Here, over-cycling areas are significantly more dispersed, extending from the city center into adjacent suburbs. This widespread pattern reflects the nature of non-routine cycling, which is often driven by leisure and recreational activities with more varied destinations. Consequently, the demand for recreational cycling frequently overwhelms the infrastructure capacity in numerous locations beyond the central core. Meanwhile, the distributions of forgotten and matchable roads for non-routine roads mirror those for routine roads, occupying the urban fringe and transitional zones, respectively. In summary, the decentralized distribution of over-cycling on non-routine roads underscores a key difference: unlike the predictable and centralized demand of commutes, leisure-based cycling creates pressure points across a much broader and more scattered urban landscape.
The importance of socio-economic characteristics also describes the image of areas with different cycling-and-environment mismatches from another dimension. Specifically, the core findings under “Socio-economic characteristics related to ‘cycling-and-environment mismatch’” reveal that matchable roads are often related to high public participation in cycling activities. Young adults predominantly populate these areas and show multicultural backgrounds, and this group shows a more obvious acceptance and appreciation for cycling culture. In contrast, forgotten roads are more often associated with decent socio-economic characteristics of the neighborhood, such as high rates of car ownership. Furthermore, they are usually located in newly developed areas far from city centers, with spacious roads and modern urban infrastructure. This characteristic makes the commuting distance in these areas generally longer, and residents are more inclined to travel by car. Furthermore, the concentration of commute distances within the 10–20 kilometer range further corroborates the formation of this travel preference. Interestingly, the cycling demand exhibited by over-cycling roads is relatively independent and less influenced by the socio-economic variables mentioned above. This suggests that the high cycling rate on these roads is primarily driven by objective travel needs and the natural alignment with existing environmental conditions.
Policy implementation for London and Chinese cities
Our study first reveals that the drivers of cycling behavior differ significantly between routine and non-routine roads. This suggests that a differentiated policy response is necessary to enhance cycling for both routine and non-routine infrastructure. For routine roads, aesthetic quality is the most influential factor (“view” in Table 4, Coeff. = 0.272), while “greenery” and “poles” are not statistically significant. Therefore, interventions on these vital commute corridors should prioritize enhancing the visual and spatial experience. Planners should move beyond costly road widening or generic tree-planting, focusing instead on improving building facades and investing in high-quality public art or landmark visibility to support and grow commuter cycling. In contrast, non-routine roads exhibit different characteristics. Our model indicates that “poles” is more important than routine roads, likely due to high congestion and perceived risk in these busy zones. Consequently, the policy priority should shift to physical infrastructure and safety management. This includes ensuring adequate road space (e.g., protected lanes) and deploying clear, frequent traffic signaling and lighting to safely manage complex interactions between cyclists, pedestrians, and vehicles.
Furthermore, the “cycling-and-environment mismatch” clearly reveals the supply-demand imbalance between cycling behavior and the cycling environment. Over-cycling is predominantly observed in areas around central London. This finding reflects the strong commuting needs of residents in the area. The socio-economic characteristics also indicate that these areas should focus on continuously optimizing and updating the urban visual environment to accommodate and support more cycling activities. For these high-volume areas, policy should focus on continuously optimizing the visual environment and enhancing transport connectivity through measures like expanding the bike lane network and improving road smoothness. Additionally, investing in improving the cycling-friendliness of road infrastructure, such as installing dedicated bicycle traffic lights and enhancing road smoothness, would further encourage residents to choose cycling as their commuting method. Conversely, “forgotten roads” are typically located on the urban periphery areas. The socio-economic characteristics also shows that these areas usually correlated with populations who work mainly from home. Given this, promoting commuter cycling is ineffective. Instead, policy should focus on encouraging local, non-routine short trips by creating safe routes to local shops and parks. For residents with long commutes, the priority should be enabling multi-modal journeys. Since the visual environment in these areas is often already high, the focus should be on building high-quality, secure connections from these routes to major public transport hubs.
Although this study is conducted in London, its analytical framework and policy insights are highly transferable to other international metropolises and even smaller cities. Especially, applying these insights to China requires tailoring them to its unique urban context. Compared to London, Chinese cities operate on a larger scale with more diverse patterns of urbanization. Their roads are often wider, and bicycle ownership and usage far exceed those in London, which is enhanced by the prosperous sharing economy and instant delivery services. These characteristics result in more severe over-cycling issues and a greater diversity of cycling destinations in Chinese cities. Hence, this context calls for a differential policy approach grounded in our findings. First, for all cities, ensuring safety is the foundational priority. Given the high intensity of cycling, robust road infrastructure is essential. Urban governments should focus on improving traffic signals and signage to clearly regulate interactions between motor vehicles and bicycles. In urban centers, placing more traffic signs and demarcating bicycle lanes from car lanes explicitly is a highly effective strategy to create a safer and more comfortable cycling environment. This foundational approach is especially pertinent for small and medium-sized cities with limited budgets. For major metropolises with the capacity for greater investment, well-designed urban aesthetics serve as an advanced strategy to encourage cycling. Our research confirms that beautiful urban landscapes and open spaces are critical for encouraging cycling behavior. Therefore, administrators in these large cities should prioritize creating aesthetically pleasing and pleasant environments. Such investments not only attract more residents to choose cycling, but also represent a long-term investment in improving the city’s overall quality of life and sustainability.
Limitation and future trends
Although this article provides a solution for assessing the street visual bikeability and the relationship between cycling behavior and its corresponding urban visual environment, there are still some limitations that can be further improved. One of the limitations is the inaccurate semantic segmentation for SVIs. Although Visual Transformer has been proven effective in many semantic segmentation scenarios and has shown good performance in recognizing typical street elements in this research, uncertainties still exist in special cases, especially in some special contexts. For example, the sideroad is divided by potted plants on the Royal College Street southbound track (as Figure 12 shows).
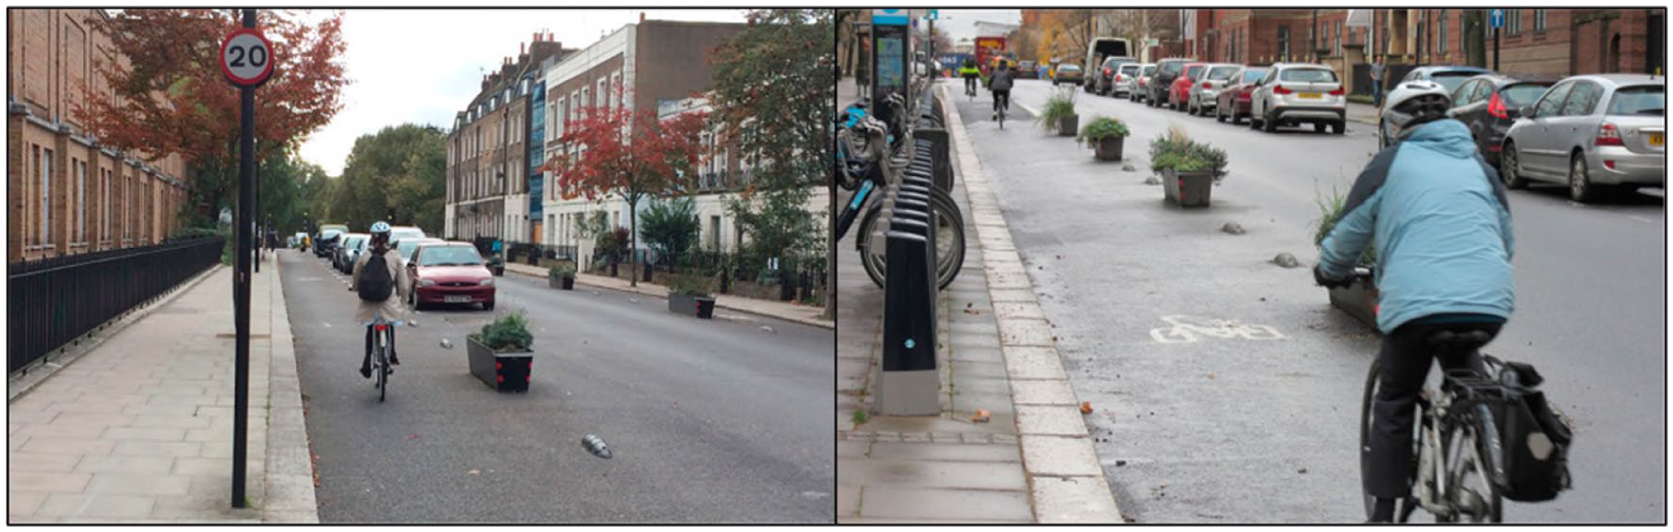
The potted plants are acted as the division of sideroad in Royal College Street southbound track (Aldred and Dales, 2017).
In addition, the data quality can be improved. Cycling data is only sampled every spring in areas beyond central London; such incomplete data sampling may lead to data bias. Plus, the outdated data may reduce the validity of our model. The data loss happens when cycling count data and SVI factors are integrated into the LSOA level. More detailed data can improve data quality and reduce data loss.
Finally, the cycling demand in this article is simply represented by the number of rides. However, in reality, the need for cycling is likely to be hidden among those who do not currently exhibit cycling behavior and is closely related to human mobility within city.
Above all, future research should aim to address the limitations previously mentioned. This includes adopting more advanced methods to accurately represent the urban visual environment, such as self-supervised learning techniques or large language models (LLMs) (Hou et al., 2025). Additionally, utilizing human mobility data could offer a more precise measure of cycling demand within the city. These efforts would provide deeper insights into the socio-economic dynamics and contribute to the development of a more equitable and diverse cycling environment in London.
Conclusion
This study proposes a visual likeability score (VBS) framework according to semantic elements extracted from the urban visual environment recorded in street view images, then detects the cycling-and-environment mismatch between the urban visual environment and cycling behavior according to the VBS and cycling counts. Furthermore, the random forest classifier and (SHAP) are used to investigate the potential socio-economic characteristics that influence this cycling-and-environment mismatch. Our results indicate that VBS effectively evaluates the visual bikeability of urban spaces, particularly highlighting the critical role of beautiful urban landscapes. The analysis of socio-economic characteristics reveals that routine routes are consistently associated with work-related characteristics, whereas non-routine routes show a stronger correlation with socio-demographic and ethnic characteristics. This study provides targeted and broadly applicable strategies to mitigate the mismatch between the cycling environment and behavior, which not only optimizes the overall efficiency of resource utilization, but also reduces disparities in cycling behavior among different groups within the city through strategic allocation and resource redistribution. Consequently, it fosters a more equitable and inclusive development of cycling activities, and offers valuable insights and guidance for achieving a more equitable and sustainable urban development pathway.
Supplemental Material
sj-docx-1-tus-10.1177_27541231261416070 – Supplemental material for Why people cycle? Uncovering the mismatch between cycling visual environment and cycling behavior
Supplemental material, sj-docx-1-tus-10.1177_27541231261416070 for Why people cycle? Uncovering the mismatch between cycling visual environment and cycling behavior by Ce Hou, Chen Zhong, Huanfa Chen, Yuhao Kang, Shiqi Wang, Yikang Wang and Fan Zhang in Transactions in Urban Data, Science, and Technology
Footnotes
Funding
This project has received funding from the European Research Council (ERC) under the European Union’s Horizon 2020 research and innovation programme (grant agreement No 949670).
Declaration of conflicting interests
The authors declared no potential conflicts of interest with respect to the research, authorship, and/or publication of this article.
Supplemental material
Supplemental material for this article is available online.