
Abstract
Shrinking cities are more vulnerable to abrupt changes triggered by economic fluctuation and disaster events, particularly in Northeast China, due to a lack of resources including financial support, young labor, technological capacity, and skilled talent. Climate change has led to an increase in both the frequency and intensity of extreme events, surpassing traditional typologies and thereby elevating risks. Additionally, economic downturns and technological revolutions result in higher unemployment. This research evaluates the socio-economic vulnerability of shrinking cities in Northeast China, using Harbin as a case study. By integrating open data, this study employs an innovative methodological approach combining PCA-based socio-economic vulnerability assessment, GWR modeling, and XGBoost algorithm with SHAP analysis to measure urban shrinkage patterns. The findings reveal regional disparities in the distribution of socio-economic vulnerability. Specifically, the maps highlight areas within a city exhibiting heightened vulnerability to disaster risks. Furthermore, this research discovers spatial overlap between socio-economic vulnerability and disaster risks in shrinking cities, as well. A dynamic, bidirectional feedback mechanism exists where socio-economic vulnerability intensifies exposure to disaster risks and vice versa. This research contributes new insights into the study of urban shrinkage while offering critical implications for the management of disaster risks under current climate change scenarios.
Keywords
Introduction
In recent years, most Chinese cities have faced significantly increased risks of emerging disasters due to global climate change. According to the latest global climate assessment by the Intergovernmental Panel on Climate Change, these disasters show rising trends in both intensity and frequency, with continually expanding types. Meteorologically-driven disasters, water-sensitive secondary disasters, and socially-derived disaster risks are rapidly increasing (Elliott et al., 2015; Zheng et al., 2024). Many inland cities now face potential threats from typhoons, heavy rainfall, and extreme precipitation events that they have never experienced before. Notably, traditional disaster prevention systems are primarily constructed based on historical disaster experiences, with serious deficiencies in scenario simulation and adaptive planning for new types of disasters. This creates systemic safety hazards for inland cities when responding to sudden disasters, rendering them unable to effectively address these new challenges.
These challenges brought by climate change, combined with regional economic downturn pressures, have created a dual compounding effect, particularly prominent in shrinking cities. Urban shrinkage has emerged as a widespread global phenomenon (Großmann et al., 2013). In Western contexts, urban shrinkage is fundamentally defined by sustained population loss (Schilling and Logan, 2008), though the precise thresholds and measurement approaches vary. The Shrinking Cities International Research Network establishes a baseline definition requiring at least 10,000 residents experiencing population decline for more than two years alongside economic transformation and structural crisis symptoms (Wiechmann and Pallagst, 2012). European researchers typically employ a threshold of population loss exceeding 3% over five years or 1% annually for at least three consecutive years (Wolff and Wiechmann, 2018). Identification methods predominantly rely on decennial census data analyzed at municipal or functional urban area scales, with recent studies incorporating nighttime light data and land-use change detection to capture the multi-dimensional nature of shrinkage beyond demographic indicators (Haase et al., 2014; Martinez-Fernandez et al., 2012). Chinese research has adapted these frameworks while recognizing unique national characteristics, particularly the paradox of population decline within rapid urbanization. Early studies identified 180 shrinking cities between 2000–2010 using administrative boundaries, representing over 25% of Chinese cities (Long and Wu, 2016; Wu et al., 2015). Subsequent research has evolved to address the challenge that administrative cities encompass vast rural areas, leading to methodological innovations using nighttime light intensity data and natural city delineation to more accurately capture urban population dynamics (Jiang et al., 2020; Meng and Long, 2022). Chinese scholars have developed context-specific definitions that account for the distinctive pattern of population loss coupled with spatial expansion, introducing multi-dimensional evaluation systems that integrate demographic, economic, and spatial indicators to identify shrinkage patterns, particularly in resource-dependent cities of Northeast China (Kang and Wei, 2021; Xie et al., 2024).
These challenges brought by climate change, combined with regional economic downturn pressures, have created a dual compounding effect, particularly prominent in shrinking cities in Northeast China. With deepening academic research on urban shrinkage phenomena, increasing attention has been paid to the socio-economic vulnerability of shrinking cities when facing disasters (Guan et al., 2021; Hartt and Hackworth, 2020). Through comparative analysis, Seymour et al. found that compared to growing cities, shrinking cities exhibit higher vulnerability when facing natural disasters, mainly stemming from their limited fiscal resources, aging population structure, and deteriorating infrastructure (Seymour et al., 2020). Berglund et al. further pointed out that there exists spatial coupling between socio-economic vulnerability and disaster risks in shrinking cities, forming specific “high-risk-high-vulnerability” areas, which are often concentrated in the most severely declining old urban areas and industrial recession zones (Berglund, 2020; Noy, 2009; Shang et al., 2024).
In this context, socio-economic vulnerability and population shrinkage form a vicious cycle: economic downturn leads to increased vulnerability, which further prompts more population outflow, especially young talents, resulting in further decline of urban innovation capacity and economic vitality, ultimately trapping cities in dual challenges of development dilemmas and risk accumulation (Cutter and Emrich, 2006; Cutter et al., 2003). This phenomenon exhibits significant spatial imbalance in its distribution. Through GIS spatial analysis techniques, Yang et al. revealed the spatial clustering characteristics of vulnerability in shrinking cities, providing important basis for policy interventions (Yang et al., 2022).
Existing research on socio-economic vulnerability has primarily focused on assessing conventional disaster risks during periods of economic upturn. Chen et al. studied the impact of climate change on urban flood risks, but did not adequately consider the amplification effect of vulnerability in the context of economic recession (Chen et al., 2013). Li et al. explored the relationship between urban shrinkage phenomena and social resilience, but lacked systematic analysis of emerging disasters (Oh et al., 2024). Gu et al. proposed a socio-economic vulnerability assessment framework at the community scale, but it was mainly applied to economically developed coastal cities, with limited applicability to inland shrinking cities (Gu et al., 2018). Although interdisciplinary research has begun to address the intersection of shrinking cities, vulnerability, and disaster risks in recent years, there remains a lack of a comprehensive framework for systematically correlating economic downturn, population shrinkage, and emerging disaster risks. In particular, research on the spatial distribution characteristics of socio-economic vulnerability and its coupling mechanism with disaster risks remains insufficient for shrinking cities under dual pressures, especially in the Northeast region.
Harbin serves as an ideal case study for investigating socio-economic vulnerability to disaster risks due to its distinct characteristics and challenges. As an inland city, Harbin’s traditional disaster prevention systems were primarily designed for common cold region hazards such as low-temperature freezing damage. However, under the influence of climate change, the city now faces increasingly frequent emerging disaster challenges. For instance, in August 2012, Harbin experienced unprecedented flooding when influenced by the remnant circulation of Typhoon “Damrey,” resulting in severe waterlogging throughout the central urban district and significant economic losses. This event highlighted the insufficient awareness and response capability of inland cities to emerging meteorological disasters. Furthermore, Harbin exhibits pronounced spatial heterogeneity, with the Songhua River serving as a natural boundary dividing the city into southern and northern districts. The southern old urban area bears historical legacy issues including aging infrastructure, crowded living environments, and concentrations of low-income and elderly populations. In contrast, newly developed areas such as Songbei District and Qunli New District possess well-established public services and superior living environments, attracting middle and high-income groups and quality resources. This uneven resource distribution has exacerbated disparities between old and new urban areas, objectively weakening the former’s capacity to respond to disaster risks. These characteristics make Harbin particularly valuable for examining the spatial coupling relationship between socio-economic vulnerability and urban shrinkage, thereby providing scientific insights for formulating precise disaster prevention and mitigation policies.
To address these deficiencies, this study constructed a comprehensive socio-economic vulnerability assessment model and an urban shrinkage measurement model, systematically revealing the multi-scale influence mechanisms of population density changes in Harbin and their spatial correlation with socio-economic vulnerability. By integrating multiple analytical techniques including principal component analysis, geographically weighted regression, and extreme gradient boosting algorithms, this study overcame the limitations of traditional single methods, capturing both the overall patterns of urban shrinkage and revealing significant spatial differences in socio-economic vulnerability. The research findings not only provide scientific decision-making basis for Harbin to address the dual challenges of population shrinkage and disaster risks, but also offer a replicable research framework and policy ideas for other cities facing similar urban shrinkage issues in the Northeast region and throughout the country.
The structure of this paper is arranged as follows: the next section introduces the study area and data sources, providing detailed information about Harbin City and the open-source internet data used in this research, including socio-economic indicators, housing information, and points of interest data. The following section elaborates on the research methodology, including the construction of the socio-economic vulnerability index, urban shrinkage assessment methods, and the application of geographic information system technology for analyzing the spatial relationship between the two. This is following by a section presenting the research results, displaying the spatial distribution patterns and regional differences of socio-economic vulnerability in Harbin’s central districts, identifying characteristics of vulnerability-shrinkage areas, and revealing the bidirectional feedback mechanism between socio-economic vulnerability and disaster risks. The next section provides a discussion, analyzing the intrinsic mechanisms of vulnerability-shrinkage area formation, and the final section concludes the paper, summarizing the research findings and their policy implications and theoretical contributions to disaster risk management in the context of climate change.
Case study and data
Study area
Harbin City (45°41′–45°58′N, 126°24′–126°51′E), as the capital of Heilongjiang Province and an important central city in Northeast China (Figure 1), has exhibited significant spatial heterogeneity, with the Songhua River serving as a natural boundary dividing the city into southern and northern districts.
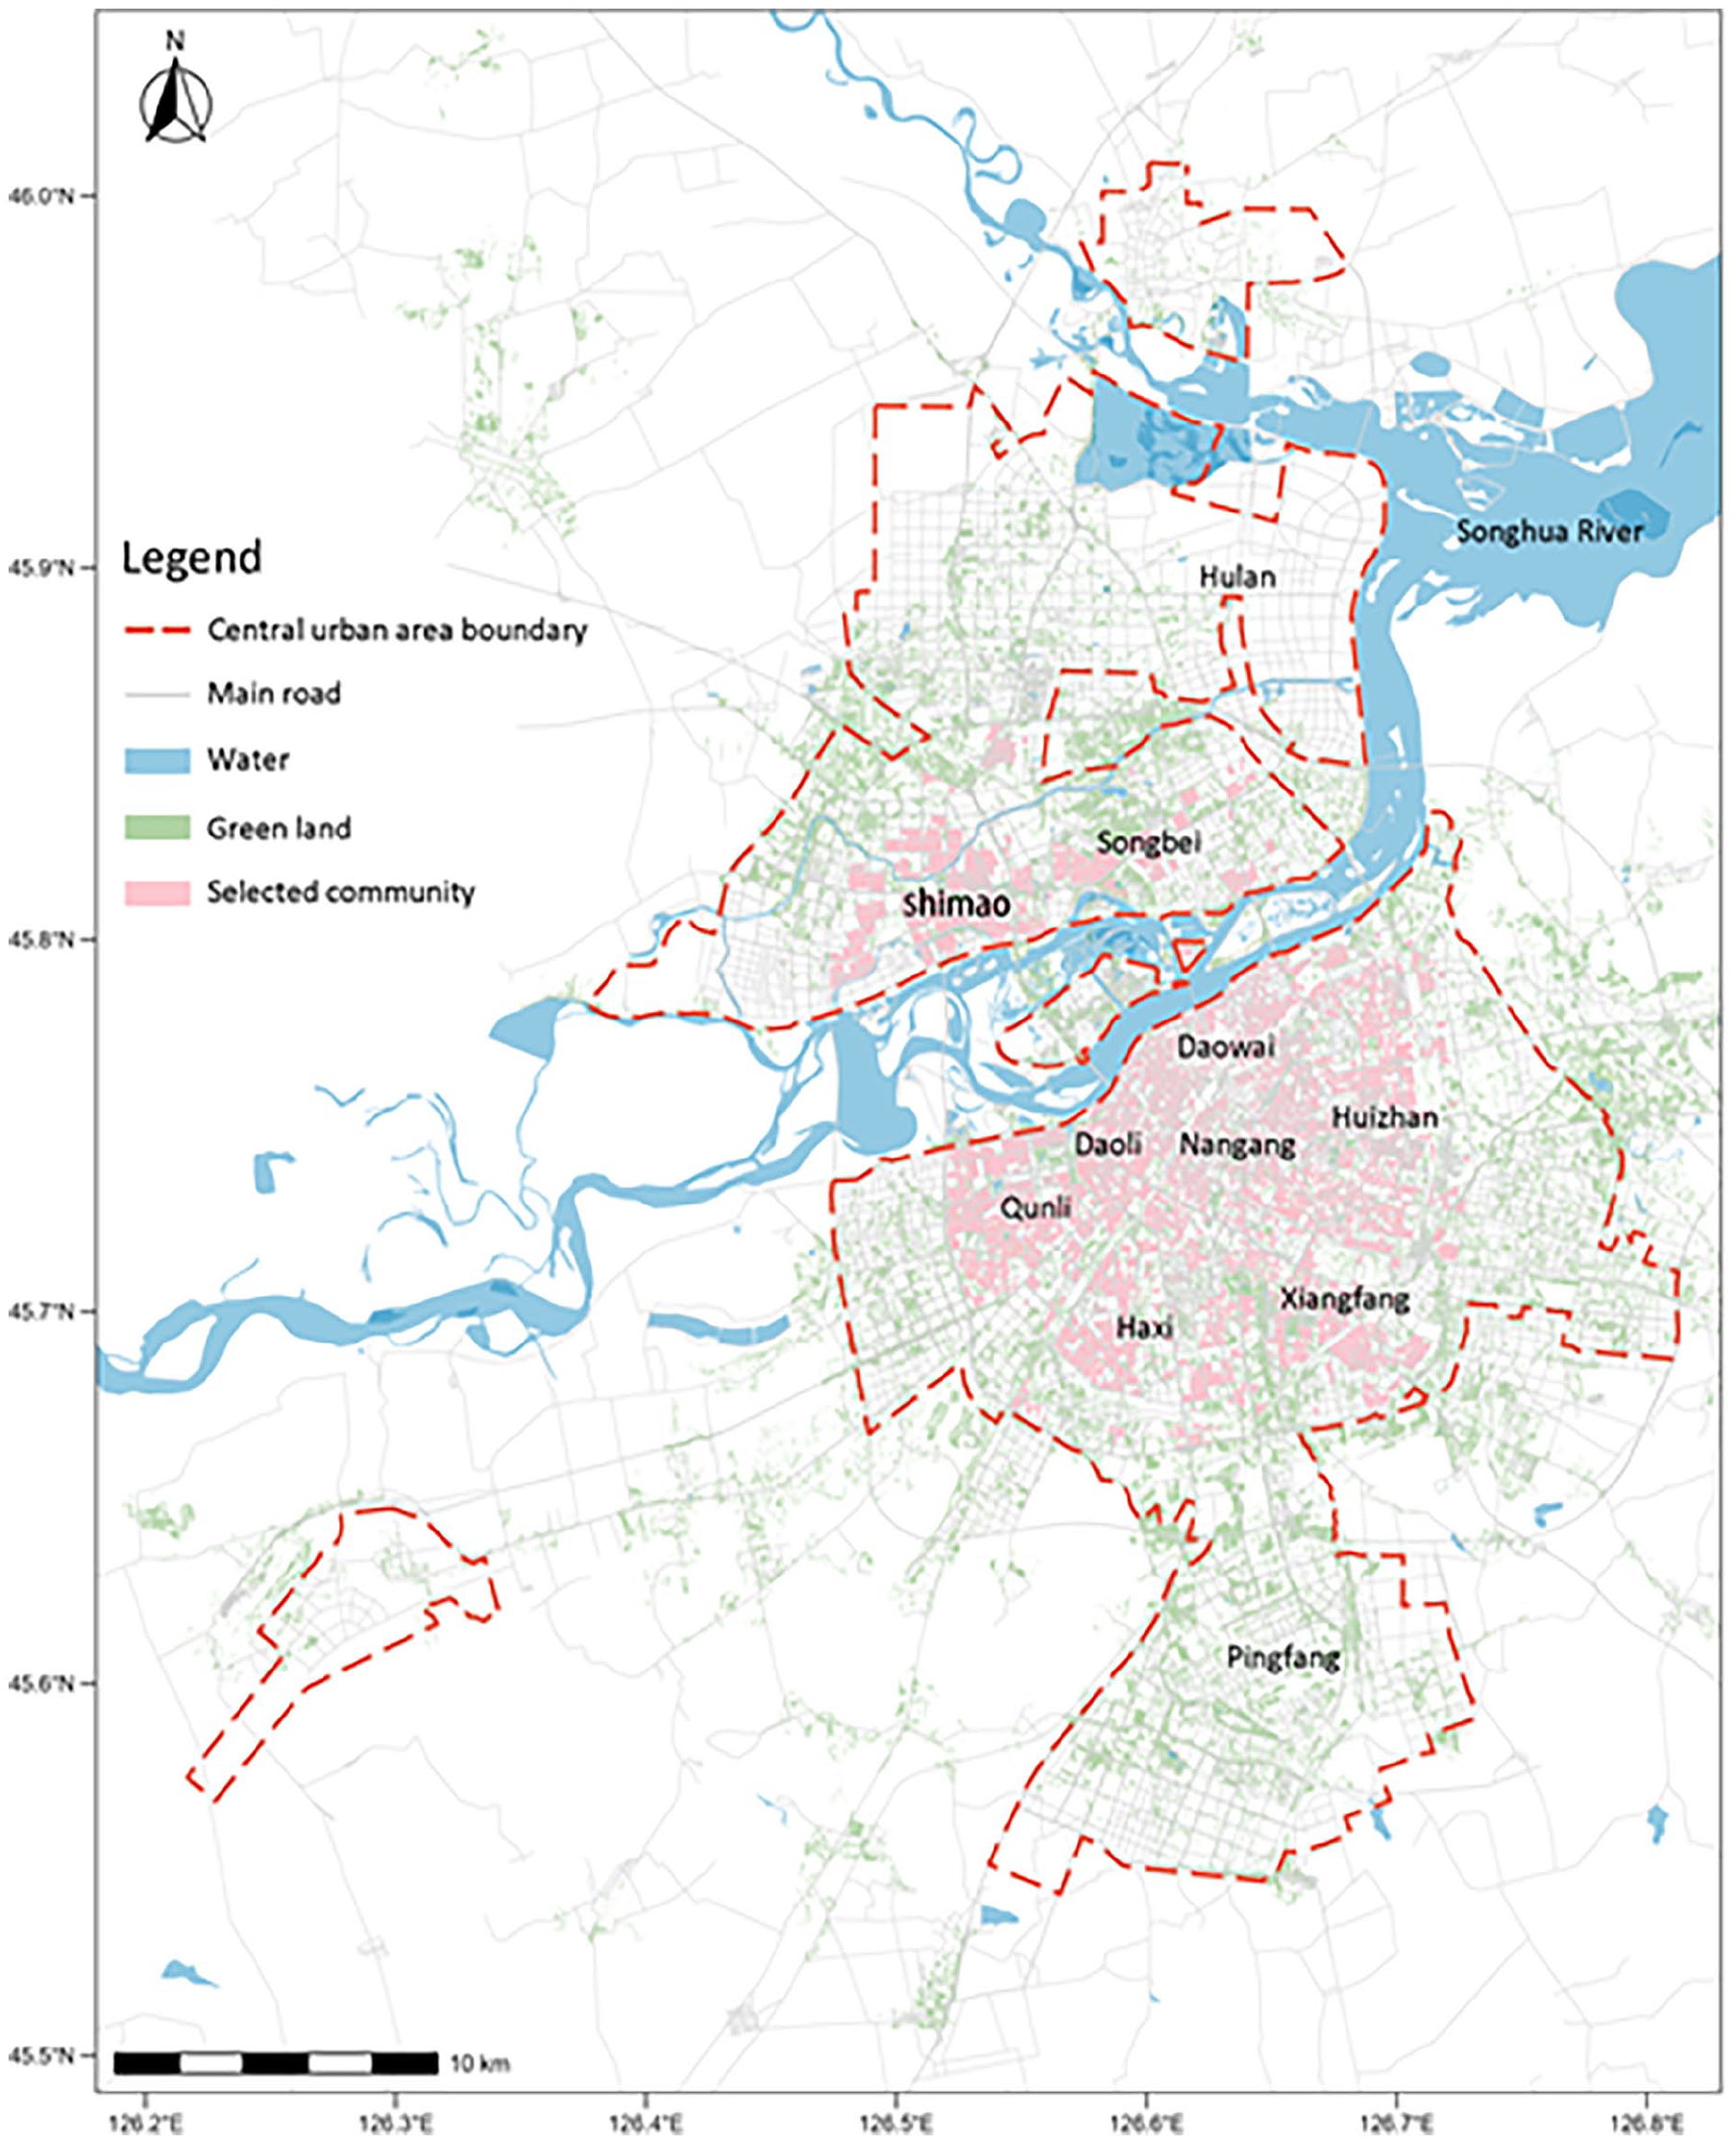
The location, scope, and administration divisions of Harbin.
The demographic evidence supports Harbin’s classification as a shrinking city within the contemporary multi-dimensional framework. Figure 2(a) reveals that Harbin’s elderly population (⩾65 years) surged from 5.97% in 2000 to 14.65% in 2020, significantly outpacing the national average which rose from 6.67% to 13.47% during the same period. This accelerated aging trajectory, particularly pronounced between 2010 and 2020 when Harbin’s elderly share increased by 6.56 percentage points compared to the national increase of 4.77 points, indicates selective outmigration of younger, working-age populations—a hallmark characteristic of shrinking cities where diminishing economic opportunities drive demographic restructuring.
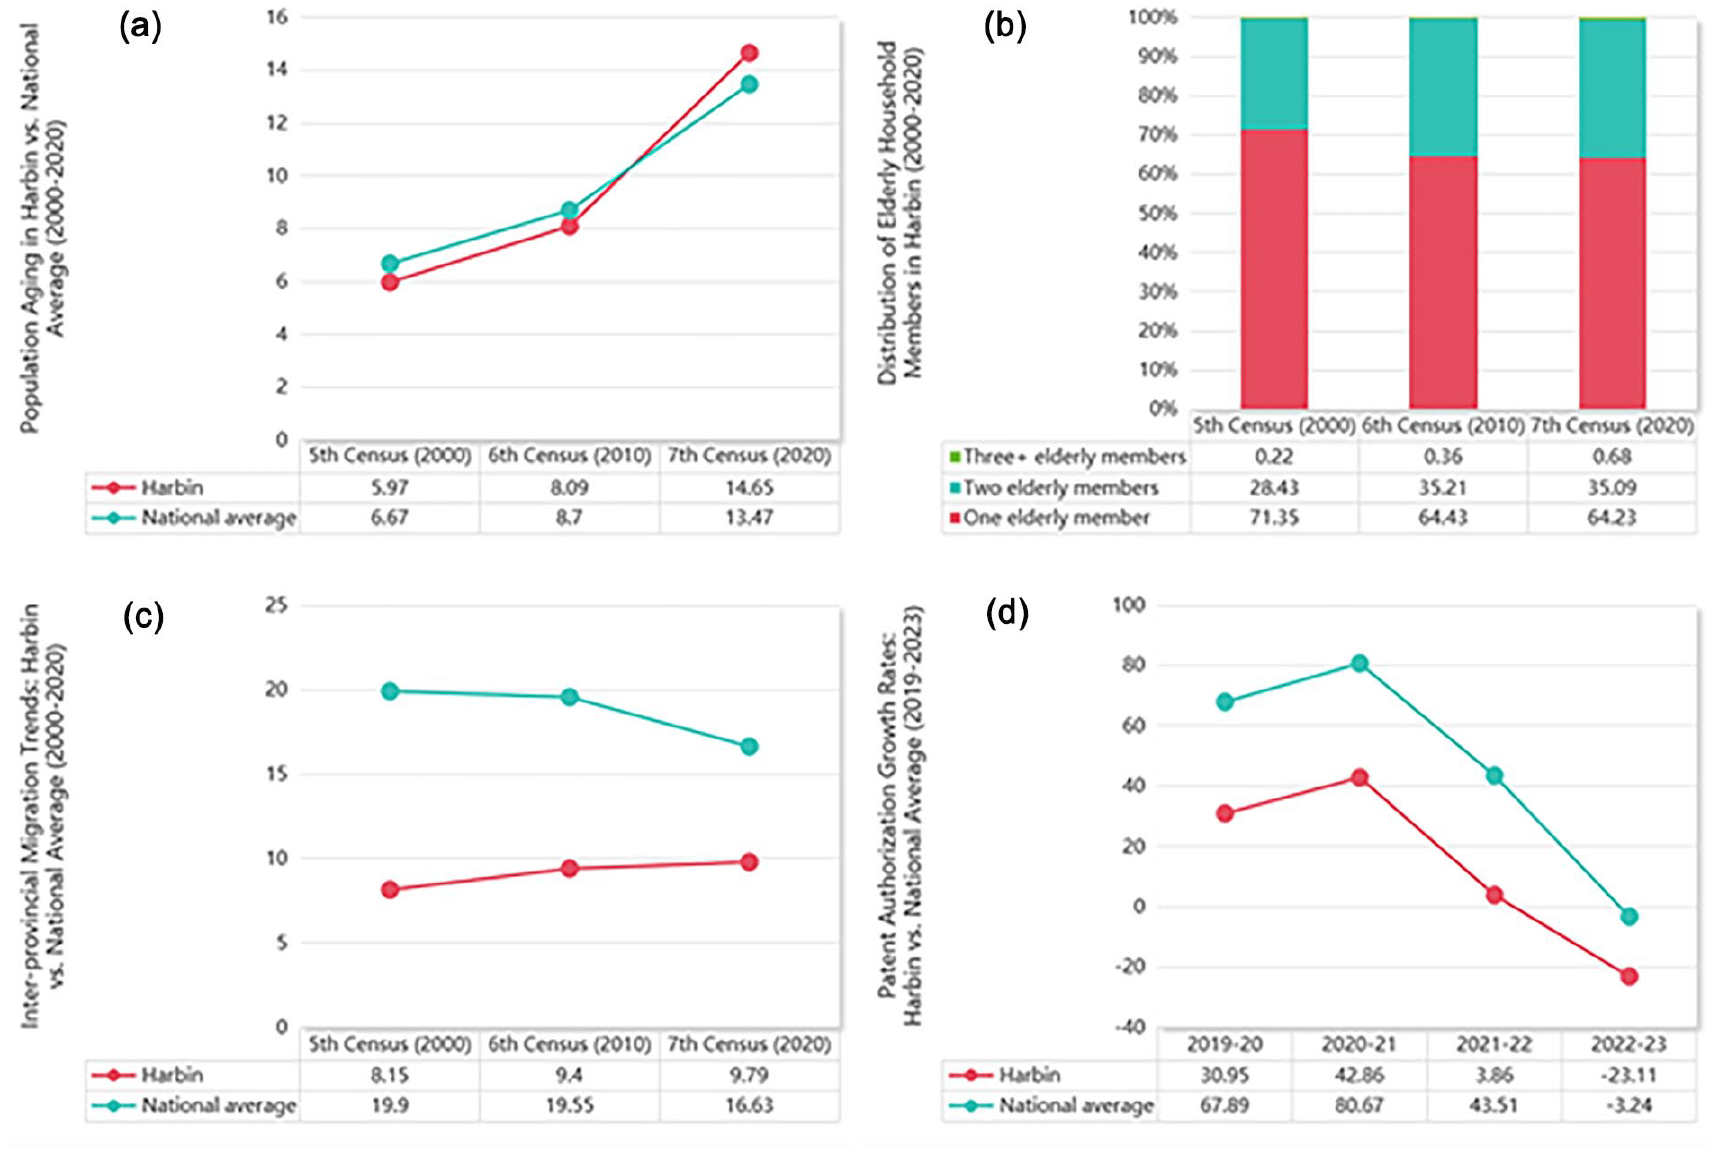
Population aging in Harbin vs. national average (2000–2020) (a), distribution of elderly household members in Harbin (2000–2020) (b), inter-provincial migration trends: Harbin vs. national average (2000–2020) (c), and patent authorization growth rates: Harbin vs. national average (2019–2023) (d).
Beyond aggregate aging trends, Figure 2(b) demonstrates a critical transformation in household composition that amplifies socio-economic vulnerability. The proportion of households with multiple elderly members has increased substantially, with two-elderly-member households rising from 28.43% to 35.09% and three-or-more-elderly-member households tripling from 0.22% to 0.68% between 2000 and 2020. This concentration of elderly individuals within households creates compound vulnerabilities particularly relevant for disaster risk management and socio-economic resilience. When multiple elderly members reside together, households face diminished capacity for emergency response, limited access to digital information systems, and reduced economic productivity during recovery periods. These structural demographic changes, rather than absolute population decline, exemplify how contemporary urban shrinkage manifests through qualitative transformations that fundamentally alter a city’s capacity to respond to various urban challenges, thereby justifying Harbin’s selection as a critical case study for understanding vulnerability in shrinking cities.
Figure 2(c) reveals a critical dimension of Harbin’s limited attractiveness to external talent, further substantiating its classification as a shrinking city. While the national average for inter-provincial migrants decreased from 19.9% in 2000 to 16.63% in 2020, Harbin’s share of residents from other provinces increased only marginally from 8.15% to 9.79% over the same period. Despite this slight upward trend, Harbin’s inter-provincial population remains dramatically below the national average—representing only 58.8% of the national level in 2020. This persistent gap indicates fundamental weaknesses in Harbin’s ability to attract and retain talent from other regions, a critical marker of urban vitality in China’s competitive city system.
Figure 2(d) starkly illustrates Harbin’s deteriorating innovation capacity. Throughout the 2019–2023 period, Harbin’s patent authorization growth rates consistently underperformed the national average by substantial margins. This dramatic divergence in innovation performance reflects the erosion of Harbin’s technological competitiveness and its diminishing capacity to generate new knowledge and attract innovation-driven industries. The persistent underperformance in patent growth, particularly the transition into deep negative territory, signals structural weaknesses in the city’s innovation ecosystem that align with broader patterns of urban shrinkage, where cities lose not only population but also their economic dynamism and capacity for technological advancement.
Figure 3 reveals the extensive and persistent exposure to meteorological disasters across Heilongjiang Province, with Harbin (shown in blue at the base of each column) consistently experiencing significant disaster impacts throughout the 2000-2012 period (Heilongjiang Statistical Yearbook, 2001–2015, n.d.). The data demonstrates that Harbin typically accounts for 15–20% of the province’s total disaster-affected area annually. The overall provincial pattern shows considerable year-to-year variability, with total affected areas ranging from approximately 3,500 square kilometers in 2005 to over 7,600 square kilometers in 2007, indicating the region’s high exposure to extreme weather events including floods, droughts, and severe storms. Additionally, Li et al. developed a SVI using county-level data from 2000, 2010, and 2020 to assess the spatiotemporal evolution of social vulnerability across China (Li and Jiang, 2024). The research demonstrates that economic development and demographic factors significantly influence spatial distribution patterns of socio-economic vulnerability.
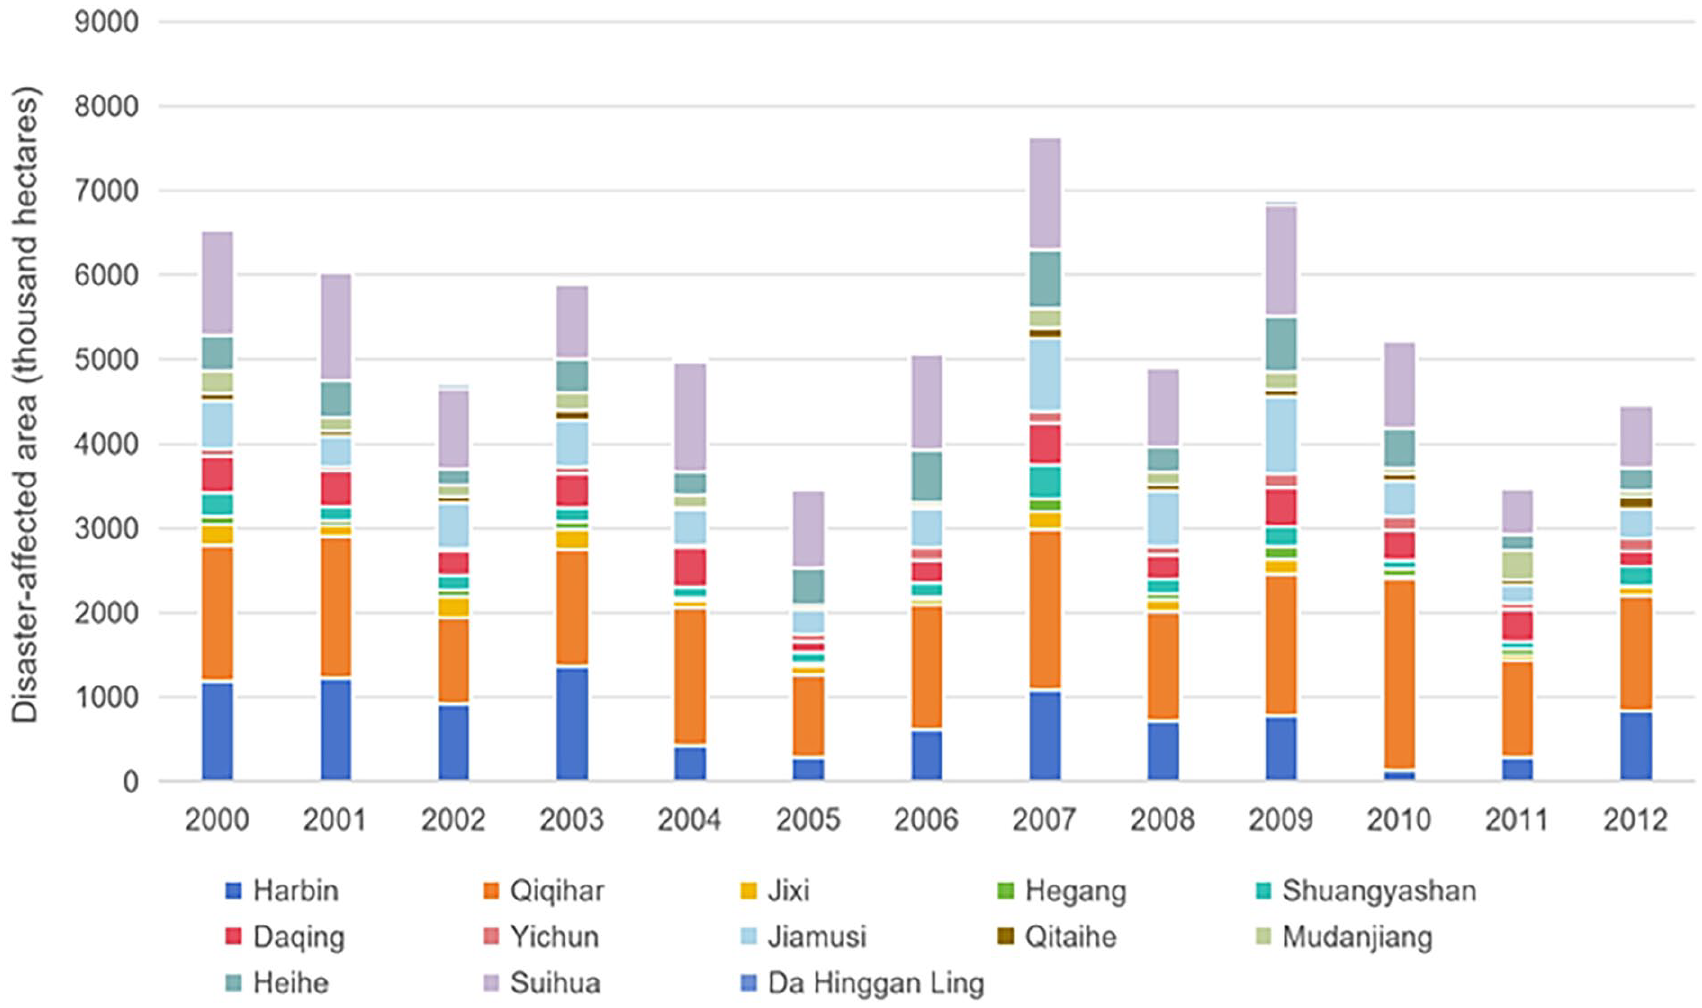
Annual disaster-affected areas by city in Heilongjiang Province (2000–2012).
Data sources
This study constructed a multi-dimensional, high-resolution data system to systematically analyze the spatial heterogeneity of socio-economic vulnerability and its impact on population shrinkage. This data system encompasses key dimensions including community physical characteristics, socio-economic attributes, and infrastructure distribution, supporting multi-scale analysis from macro to micro levels (Table 1).
Variables, scales, dataset years, and sources used in the study.
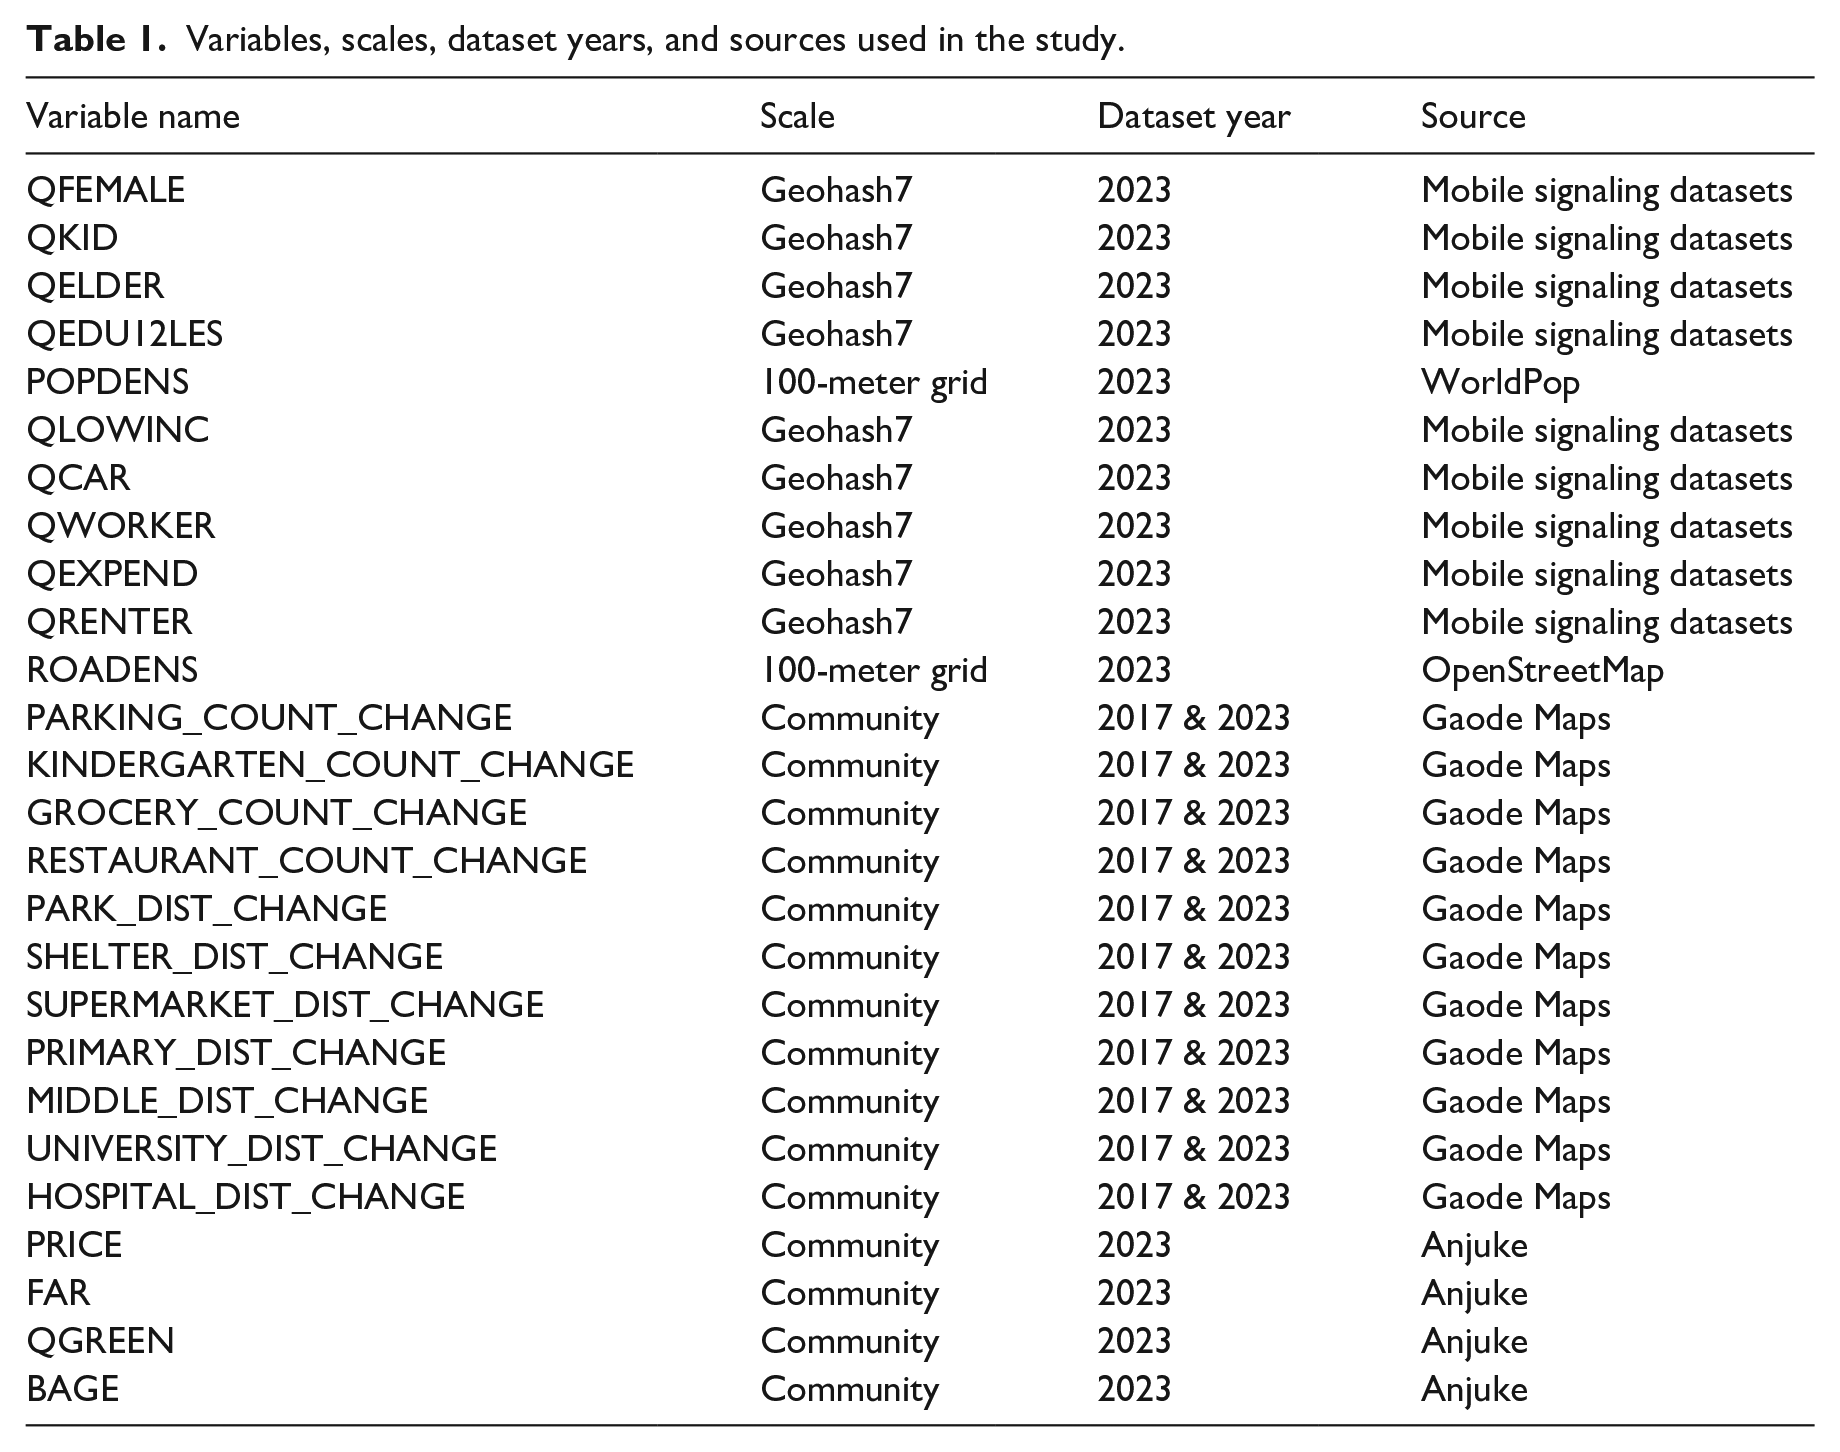
The research used residential communities as the basic analytical unit, with the study area covering approximately 350 square kilometers, containing 65% of the city’s permanent residents and 80% of the urban built-up area. Basic information of residential communities (including housing prices, floor area ratio, building age, community names and addresses) was collected from the Anjuke 1 real estate data platform. To enhance the spatial representativeness of the data, this study incorporated points of interest data from Gaode Maps 2 to supplement the community samples, ultimately obtaining 2445 valid community samples. Urban road network data was sourced from OpenStreetMap (OSM), 3 and administrative divisions were derived from the Resource and Environmental Science Data Center of the Chinese Academy of Sciences. 4 The polygon data for community boundaries was collected from the Baidu Open Platform. 5 Population data primarily came from the Landscan 6 database and was cross-validated and calibrated using China’s Seventh National Census data and mobile phone signaling data with geohash7 precision to obtain more refined spatiotemporal distribution characteristics of the population. Historical disaster data was obtained from the National Earth System Science Data Center. 7
Our study required fine-grained spatial resolution to accurately capture vulnerability and shrinkage patterns at the community level. Traditional Chinese statistical reporting systems aggregate data at the “subdistrict” (jiedao) administrative level, which often encompasses diverse socio-economic populations within a single unit (Hou et al., 2016; Huang et al., 2024). Unlike Western vulnerability studies that benefit from readily available census tract or neighborhood-level data, comparable granular datasets are less accessible in the Chinese context. While some Chinese studies employ surveys to achieve finer resolution, their limited sample sizes often fail to adequately represent regional vulnerability patterns across dense urban environments.
In densely populated Chinese cities like Harbin, significant vulnerability disparities can exist between adjacent communities or even within the same subdistrict administrative boundary. To address these methodological challenges, we employed de-identified mobile phone signaling data for population calibration, which provides superior spatial resolution for detecting fine-grained socio-economic patterns. This approach allows us to identify vulnerability variations that would otherwise be obscured in aggregated administrative statistics, thereby enabling more precise identification of high-risk communities.
Methodology
Construction of socio-economic vulnerability index
To systematically assess the socio-economic vulnerability of Harbin, this study constructed a multi-dimensional evaluation framework. Based on the accessibility of community-scale data and local characteristics of Harbin, this study made localized improvements to the Social Vulnerability Index (SoVI) proposed by Cutter et al. to better capture vulnerability differences at the micro-spatial scale (Cutter et al., 2003). Ultimately, 26 variables were selected from four dimensions (Table 2).
The selected 26 variables and their potential contributions to socio-economic vulnerability index.
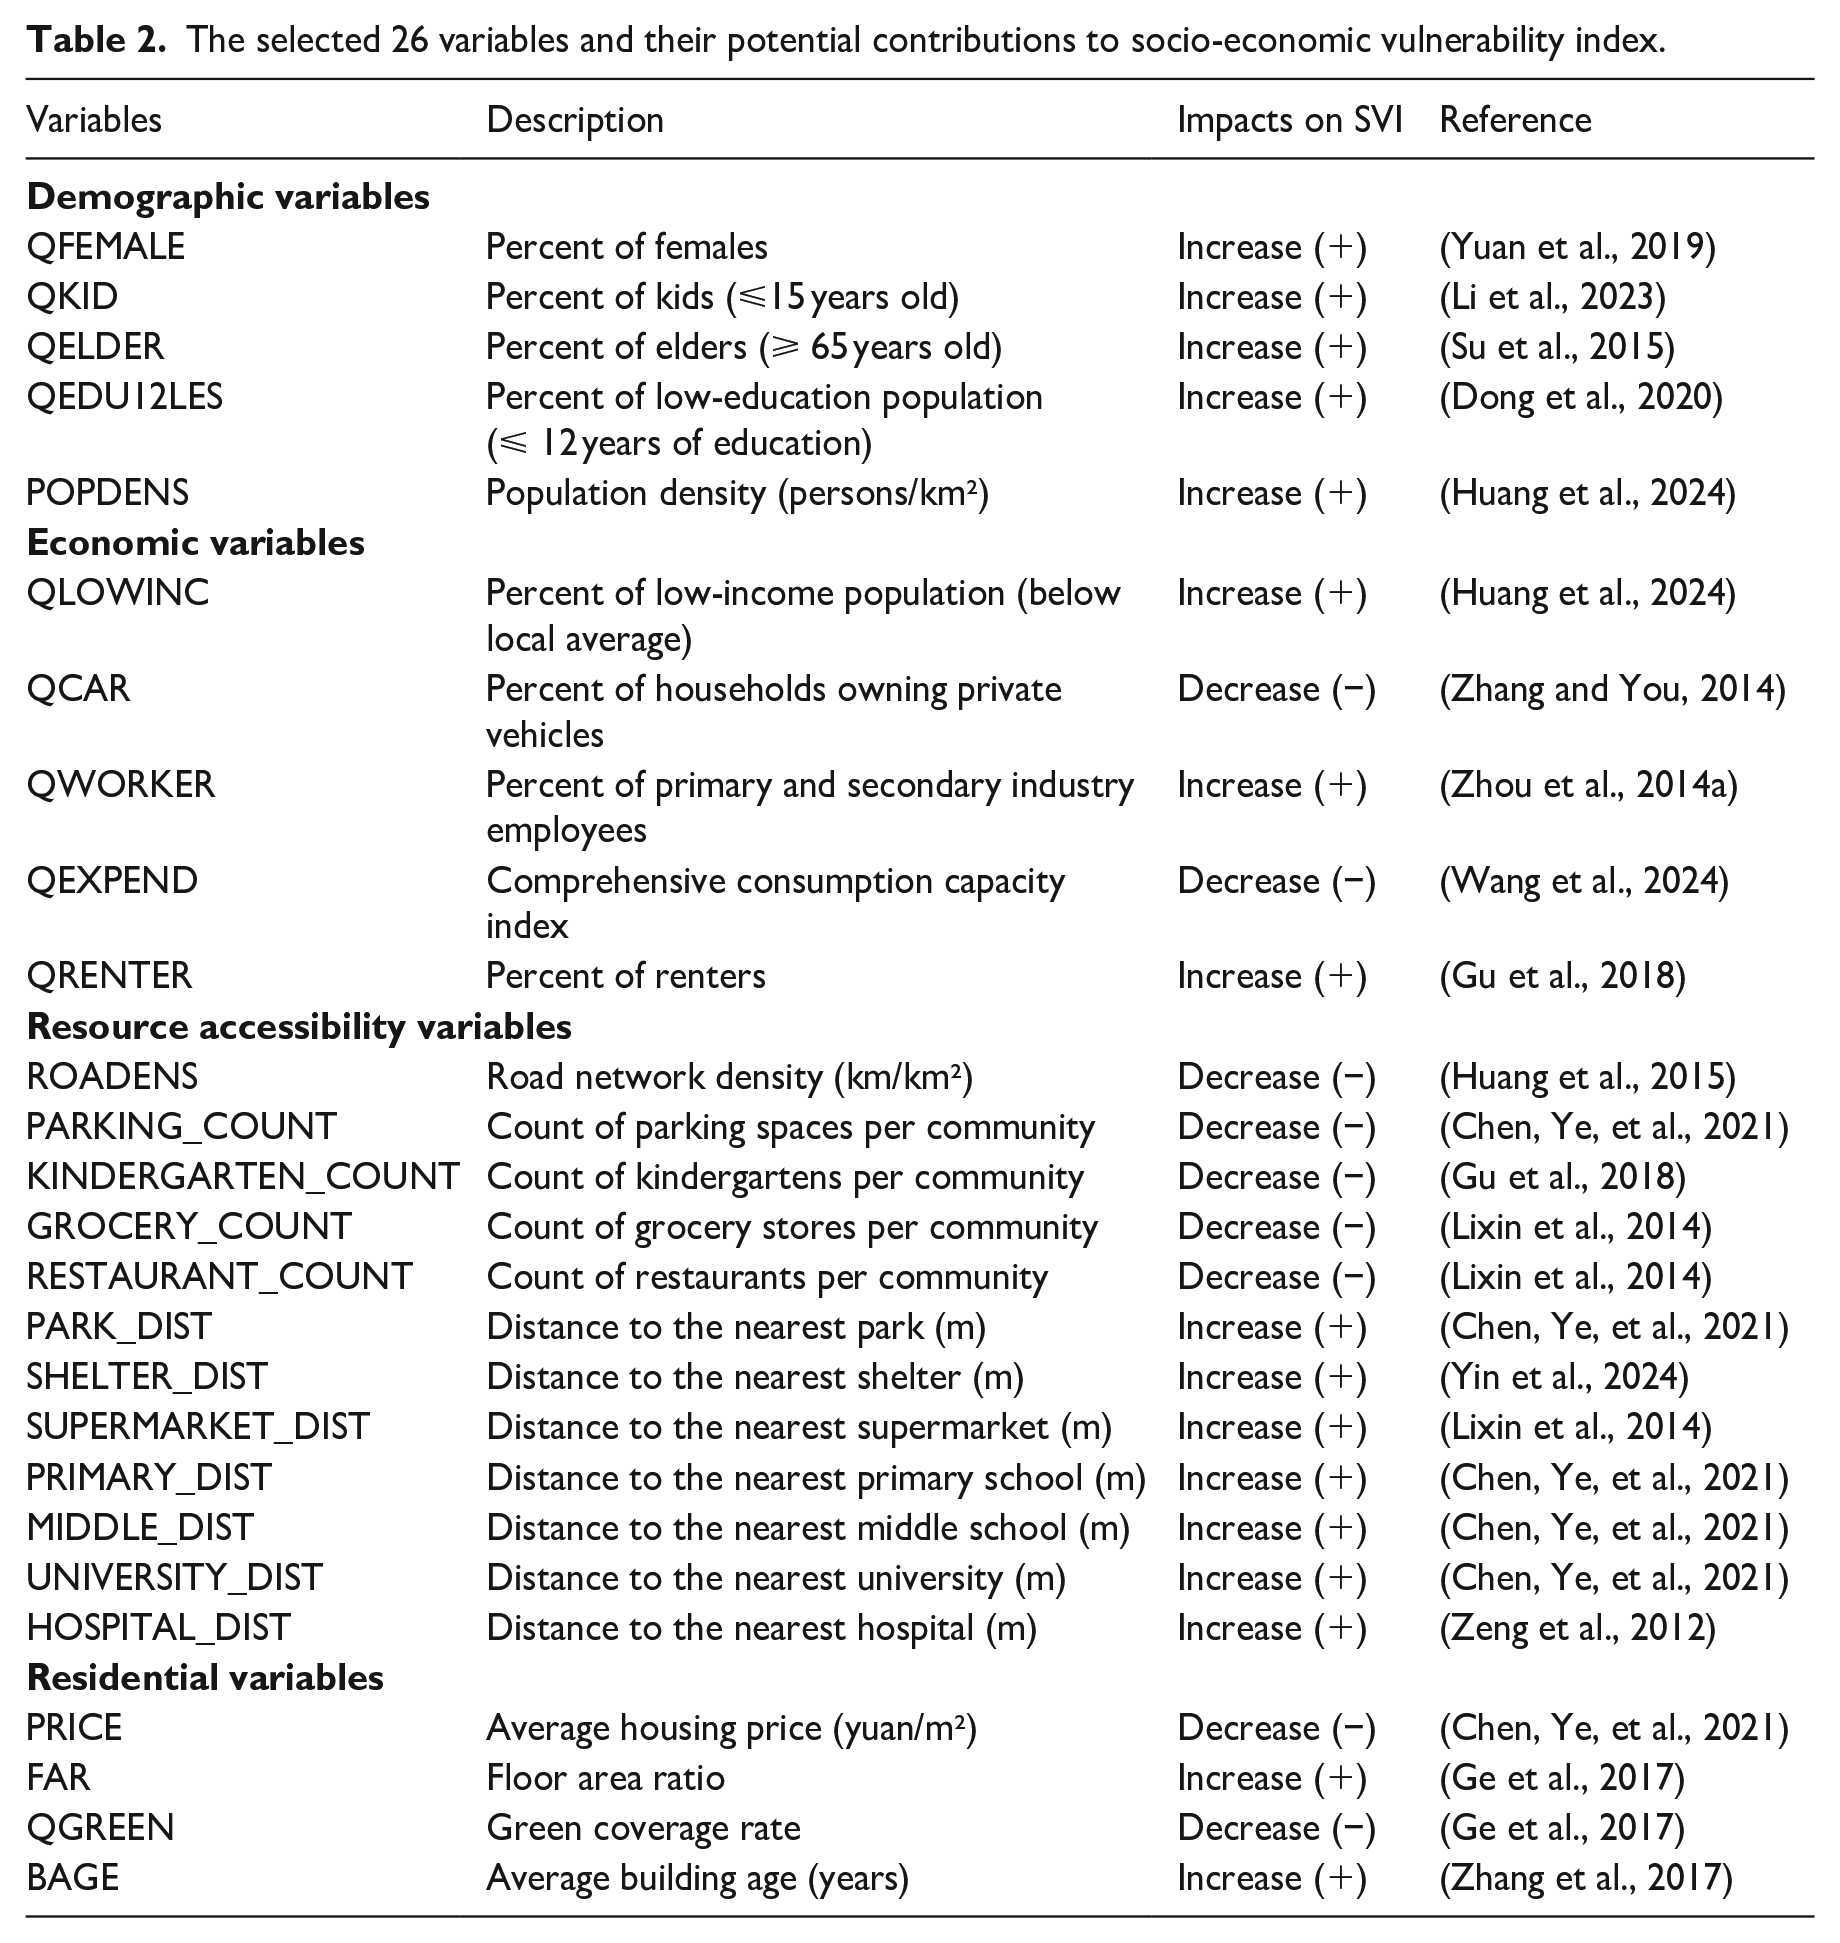
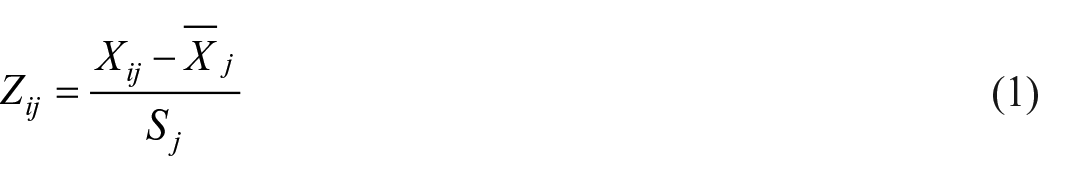
This study employed principal component analysis (PCA) to construct a socio-economic vulnerability index and utilized factor analysis (FA) to identify key potential driving factors (Abdi and Williams, 2010; Zhou et al., 2014a). First, all variables were standardized using the Z-score method according to Equation (1) to eliminate the influence of different spatial scales and indicator dimensions.
Where
Next, principal component analysis and factor analysis were performed in conjunction with the maximum variance rotation method. To ensure the accuracy of the assessment results, this study first determined the initial number of principal components using the Kaiser criterion (eigenvalue greater than 1). Considering the differentiated manifestation of vulnerability across various spatial dimensions, a direction judgment matrix was established. By multiplying each variable’s loading value with its directional impact on vulnerability (1 for increase, −1 for decrease), the comprehensive directional impact of each principal component on vulnerability was obtained.
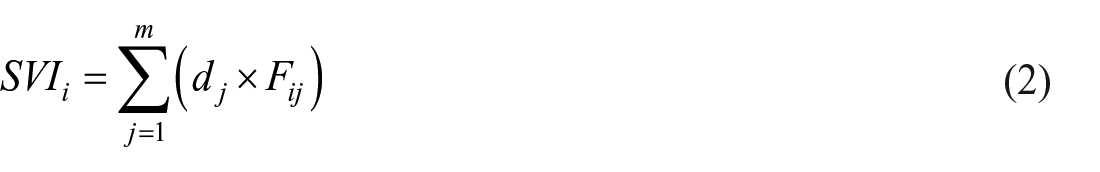
Finally, the socio-economic vulnerability index (SVI) was constructed using Equation (2).
Here,
Shrinkage estimation
This study used residential communities in Harbin, China, as research units to identify potential population shrinkage areas by comparing population density changes from 2017 to 2023. The study employed relative change rate as the dependent variable, calculated using Equation (3):
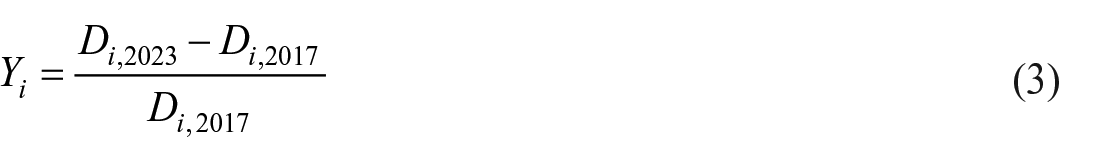
where
Geographically weighted regression
Considering the influence of spatial heterogeneity, this study adopted a geographically weighted regression (GWR) model to explore the spatial non-stationary effects of various variables on population density changes. Prior to constructing the GWR model, Variance Inflation Factor (VIF) tests were conducted to examine multicollinearity among all independent variables (Table 1), and Z-score standardization was applied to all independent variables according to Equation (1) to eliminate the influence of different variable dimensions. Subsequently, a global Ordinary Least Squares (OLS) regression model was established as a benchmark, and this study used a bi-square kernel function (Equation (4)) to define spatial weights.
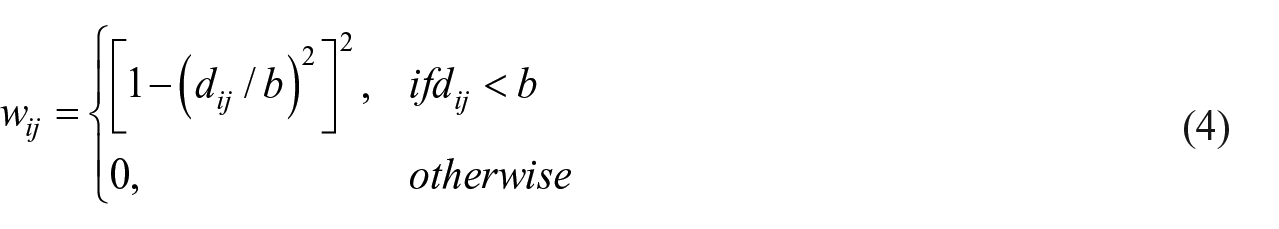
In this function,
Extreme gradient boosting (XGBoost)
This study constructed an urban population density change prediction model based on the XGBoost algorithm, using residential communities in Harbin, a city in northeastern China, as research units to analyze the relative change rate of population density between 2017 and 2023. To ensure sample representativeness across different levels of population density change, this study first divided the dependent variable into quartiles, then adopted stratified sampling, splitting the dataset into training and testing sets at a ratio of 7:3, ensuring consistent sample proportions in each quartile group. To enhance model performance, this study applied the Yeo–Johnson transformation to the dependent variable to adjust its distribution, facilitating the processing of data containing zeros and negative values; all numerical independent variables underwent centering and standardization to make features of different dimensions comparable.
In the model parameter optimization phase, 10-fold cross-validation was initially employed to preliminarily evaluate the model, and an early stopping strategy was applied to prevent overfitting. To further enhance model performance, this study designed a detailed hyperparameter grid, including regularization parameters gamma, lambda, and alpha, selecting the parameter combination with the minimum RMSE on the test set as the optimal parameters through grid search. Based on the grid search results, the final model was trained using the optimal parameters.
Contribution evaluation
To interpret the model prediction results and evaluate the impact of various factors on population density changes, this study employed the SHAP (SHapley Additive exPlanations) method to analyze feature importance. SHAP values, based on the Shapley value concept from cooperative game theory, calculate the marginal contribution of each feature to the prediction result (Equation (5)):
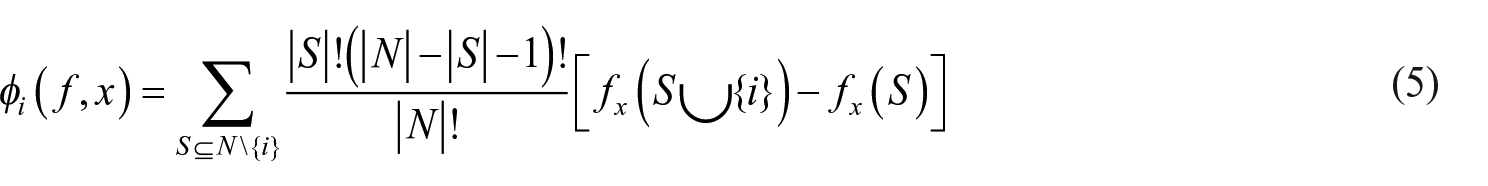
where
Results
Spatial patterns of socio-economic vulnerability
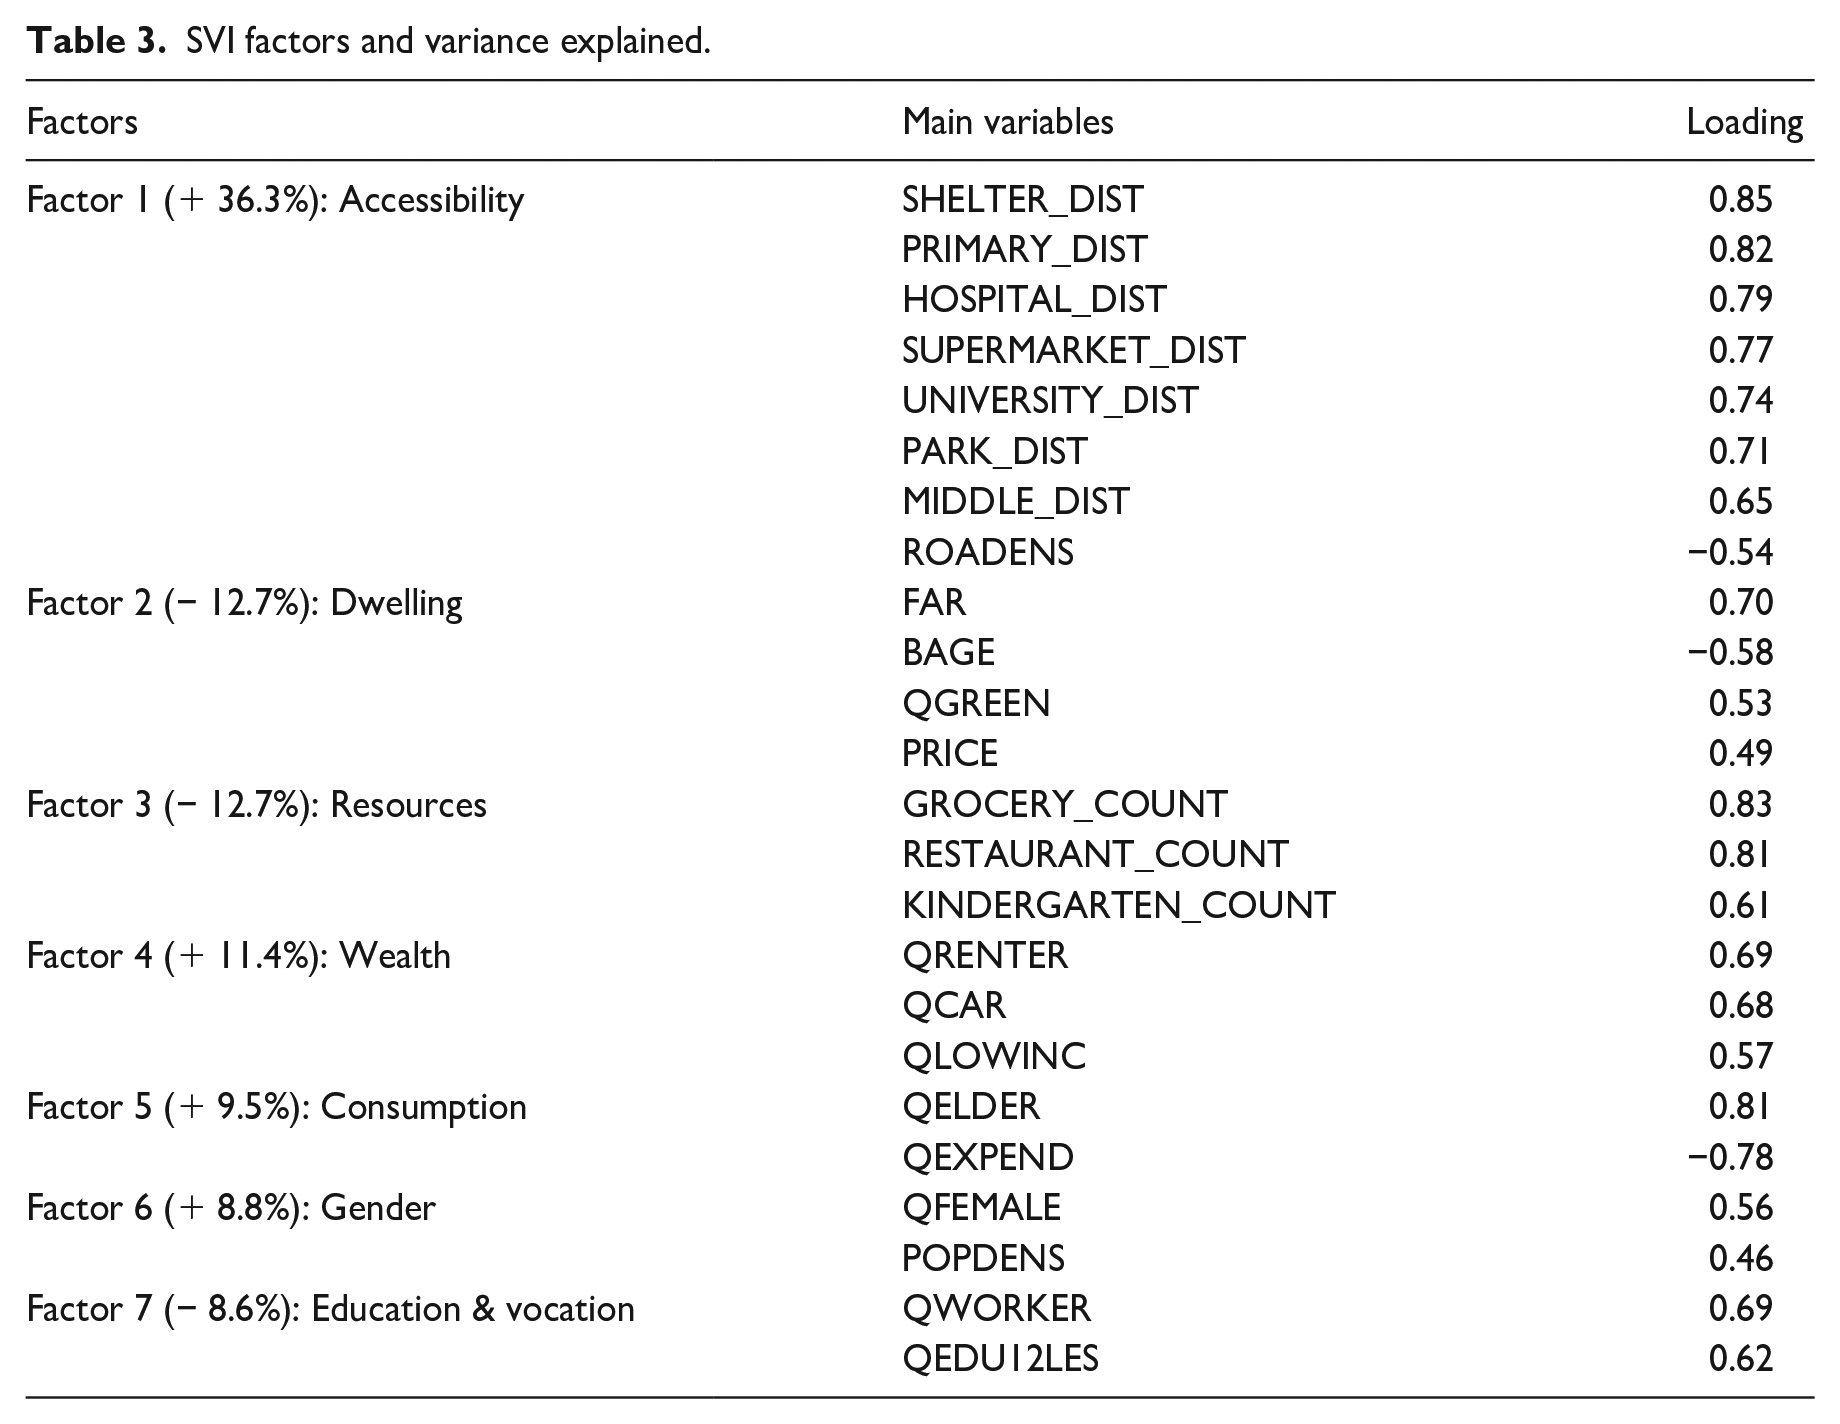
This study first conducted data suitability tests, with a KMO value of 0.86 and highly significant results from Bartlett’s test of sphericity (degrees of freedom df = 325, p < 0.001), indicating suitability for factor analysis. Based on the principle of eigenvalues greater than 1, seven factors were extracted from the 26 original variables, collectively explaining 56.47% of the total variance of the original variables. Each factor was assigned a corresponding sign based on the influence of its dominant variables on socio-economic vulnerability (Cutter, 2024; Cutter and Emrich, 2006; Painter et al., 2024; Turner et al., 2003), and variables with absolute factor loadings greater than or equal to 0.5 were identified as the primary driving variables for that factor (Table 3).
SVI factors and variance explained.
By integrating the seven factors mentioned above and summing them after adjusting for their respective signs, the socio-economic vulnerability to disaster risk in Harbin City was calculated. The standard deviation method was used for mapping, dividing the SVI into five levels and displaying the calculation results at the residential community level to examine the spatial distribution characteristics of socio-economic vulnerability at a fine scale (Figure 4(a)). The SVI scores ranged from −10.48 to 19.72, representing the lowest and highest socio-economic vulnerability among residential communities, with a median of 0.05. As shown in Figure 4(a), approximately 72.7% of residential communities in Harbin exhibited medium or higher levels of vulnerability. Communities with low vulnerability were primarily distributed in Haxi and Qunli New District in the southwest and the Convention and Sports Center area in the east, while highly vulnerable communities were mainly located in Jiangbei and the inner-city peripheral areas around the Southern Third Ring Road. The central urban area was predominantly characterized by medium and higher vulnerability levels. These spatial differentiation characteristics suggest that even when facing the same external shocks, different residential communities exhibit significant variations in their probability of disaster occurrence as well as residents’ coping capacity and resilience.
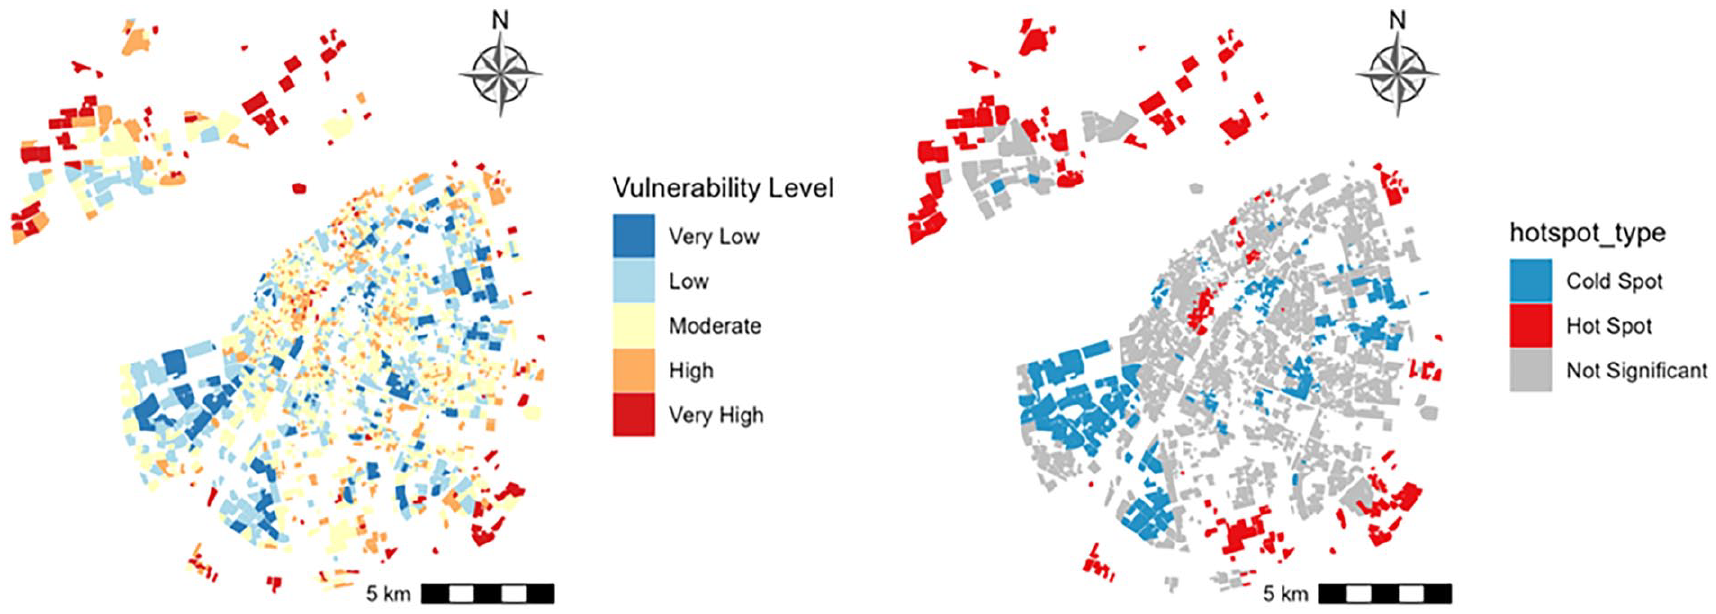
Socio-economic vulnerability map (a) and hot spot analysis (b).
Global spatial autocorrelation analysis of socio-economic vulnerability in Harbin revealed a global Moran’s index of 0.44, with a standardized Z-statistic of 45.33 and a p-value less than 0.01, rejecting the null hypothesis of random spatial distribution. This indicates that socio-economic vulnerability in Harbin exhibits significant positive spatial autocorrelation. Hotspots and cold spots occupied 271 (11.1%) and 308 (12.6%) communities, respectively. Overall, the socio-economic vulnerability index of Harbin City shows a distinct center-periphery spatial pattern (Figure 4(b)), with Qunli, Haxi, and the Convention Center areas serving as core clusters of low vulnerability.
Spatial determinants of population density variation
Model hyperparameters were determined through grid search optimization, with the final configuration as follows: learning rate of 0.1, maximum tree depth of 3, minimum sample weight sum for leaf nodes of 3, subsample and colsample both at 0.5, and 3994 iterations. The population density change measurement model calculated feature importance based on SHAP values, with Figure 5 demonstrating the systematic influence of various variables on population density changes in Harbin City. The SHAP value distribution diagram presents the direction and intensity of each feature’s impact on model predictions, with features arranged from top to bottom according to importance. Each point represents a sample, the horizontal axis represents SHAP values (positive values increase prediction results, negative values decrease them), colors indicate feature value magnitude (blue for low values, red for high values), and horizontal distribution width reflects the degree of heterogeneity in feature influence.
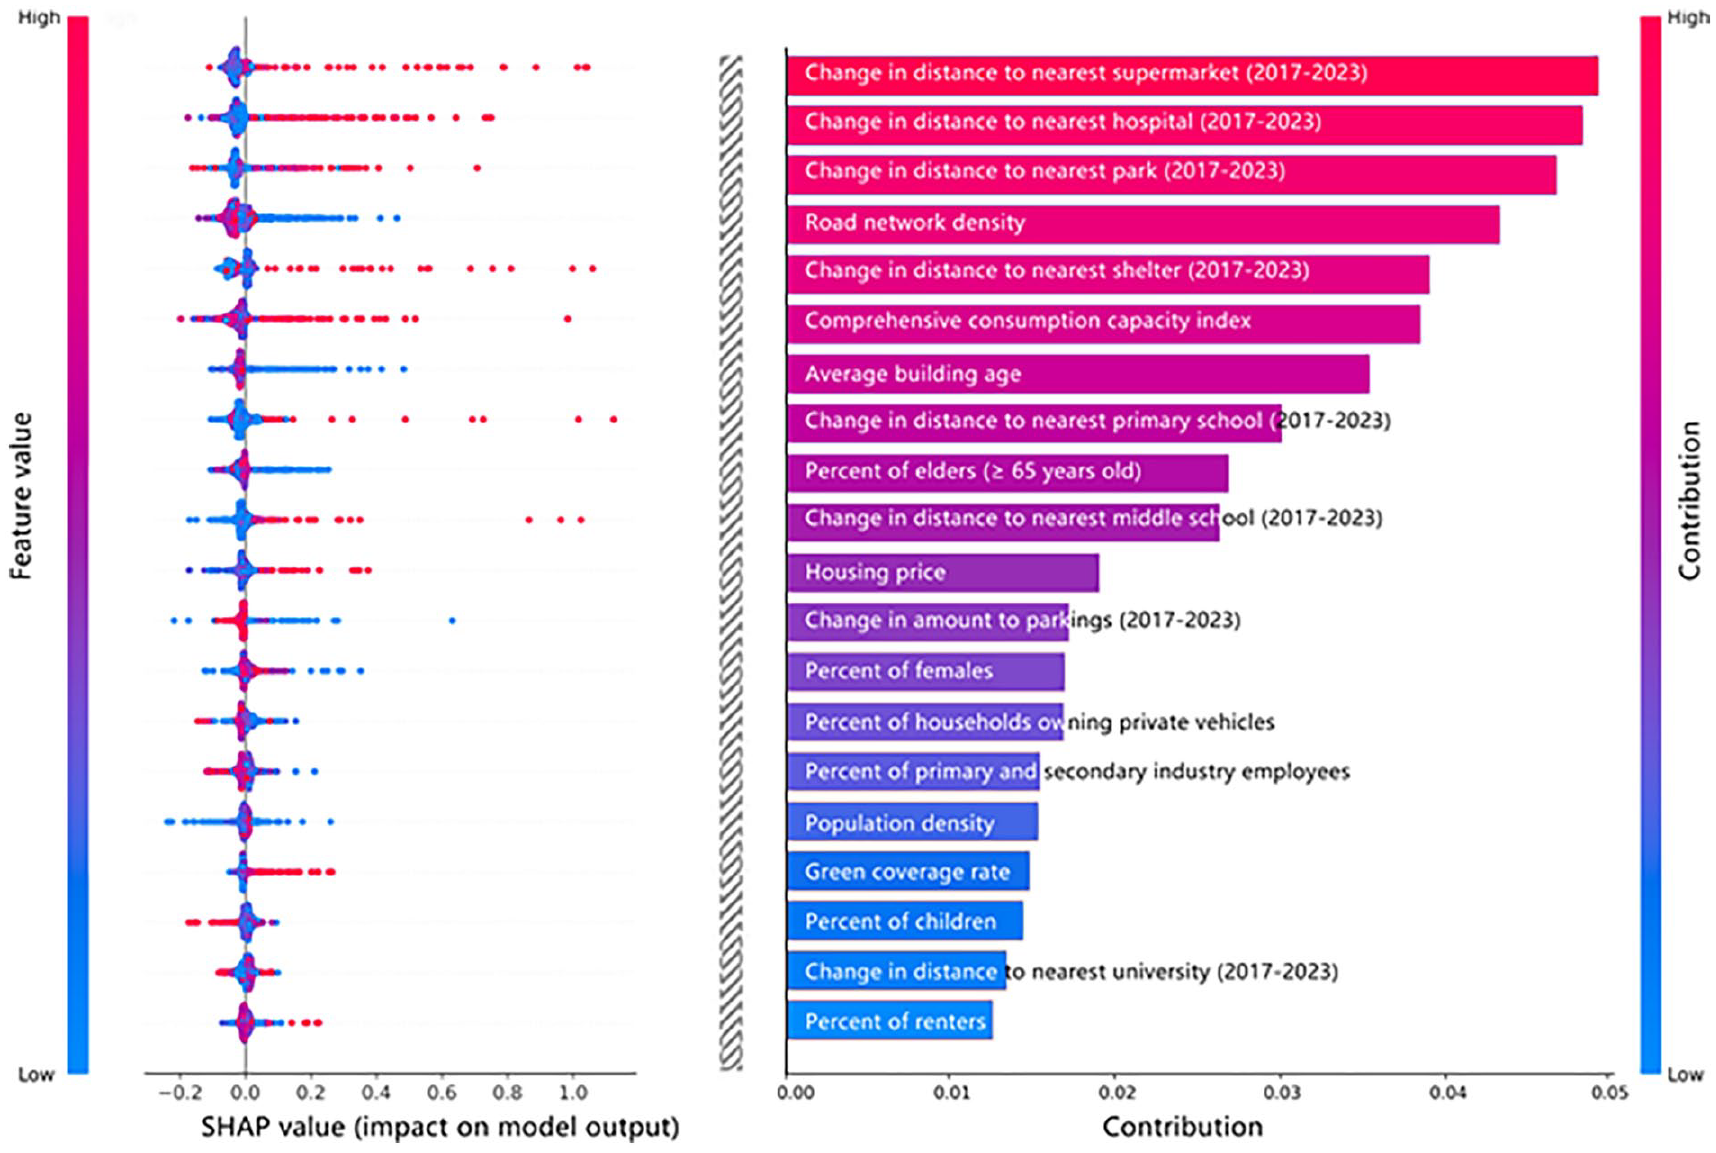
Top 20 key driving factors (SHAP value).
Figure 5 shows that facility accessibility-related indicators dominate population density changes, consistent with principal component analysis results, where Factor 1 (Accessibility) explained 36.3% of variance. Change in distance to nearest supermarket, hospital, and park (2017–2023) rank as the top three in feature importance, cumulatively contributing nearly 20% of the model’s explanatory power. The SHAP value distributions of these facility accessibility indicators exhibit a clear positive concentration trend, with most points appearing red, indicating that greater distances from facilities such as hospitals and large supermarkets contribute more positively to population density growth.
Road density and elderly population proportion rank as the fourth and ninth most important factors, exhibiting relatively concentrated distribution characteristics. High road density values are primarily concentrated in the negative SHAP value region, indicating that higher network density contributes less positively to population density growth, consistent with Harbin’s actual situation: old urban areas have river-distributed road networks that are dense and complex in structure, while new urban areas have planned road networks that are wider with fewer branch roads, resulting in relatively lower road network density. The influence of elderly population proportion shows predominantly negative characteristics, with residential communities having high elderly proportions mostly exhibiting negative SHAP values, indicating that aging communities face population loss challenges.
Building characteristics and socio-economic factors show relatively lower importance, with high building age generally producing negative effects on population growth. The influence distribution of consumption levels is relatively dispersed, with high-consumption areas showing diversified population change trends, reflecting the complex influence of social stratification on residential choices and confirming the necessity of introducing geographically weighted regression analysis.
Spatial distribution of GWR coefficients
This study employed the golden section search method to determine the optimal bandwidth that minimizes the corrected AIC, establishing a value of 539.0, indicating that each local regression model incorporated neighboring community samples within a radius of approximately 539 units. Model performance was evaluated by comparing indicators such as the corrected Akaike Information Criterion (AICc) and adjusted coefficient of determination (R²) between ordinary least squares (OLS) and geographically weighted regression (GWR) models (Table 4). Significance tests were conducted on coefficients obtained from the GWR model, and spatial visualization was used to display the distribution patterns of various coefficients to identify the spatially heterogeneous effects of different factors on population shrinkage. This method complements the XGBoost regression model: GWR, as a spatial econometric method, focuses on capturing spatial non-stationarity in parameter estimation, while XGBoost, as a machine learning method, emphasizes identifying complex non-linear relationships and interaction effects between variables. The combination of these two approaches enables the research to both reveal spatial heterogeneity and obtain overall predictive capability.
Model fit comparison between OLS and GWR.
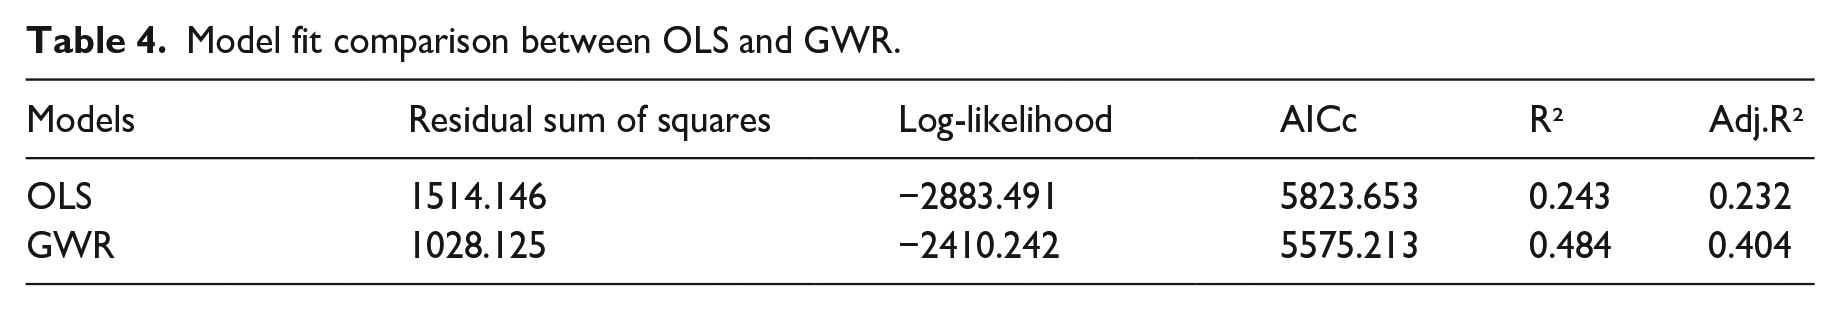
Figure 6 presents the spatial distribution of geographically weighted regression coefficients for the top nine important features from the XGBoost regression model at the residential community scale, revealing the spatial differences in how various variables influence population density changes across different communities in Harbin. Consistent with the SHAP value analysis results, the coefficients for change in distance to nearest supermarket, hospital, and park (2017–2023) are generally positive, indicating a strong negative relationship between the accessibility of such facilities in the study area and population shrinkage. From a spatial pattern analysis, the road density coefficient exhibits obvious spatial clustering characteristics, forming a strip distribution with increasing coefficient gradients in the southwest direction, indicating that the intensity of road density’s impact on population shrinkage varies significantly across space and cannot be summarized using a single global coefficient. Figure 6 further indicates that the influence of different characteristics on population shrinkage conditions in Harbin exhibits significant spatial heterogeneity, with the southwestern part of the Jiangnan area and the Jiangbei new district showing higher sensitivity to public service facility accessibility, while the old urban areas and southern peripheral regions respond more significantly to socio-economic attribute characteristics.
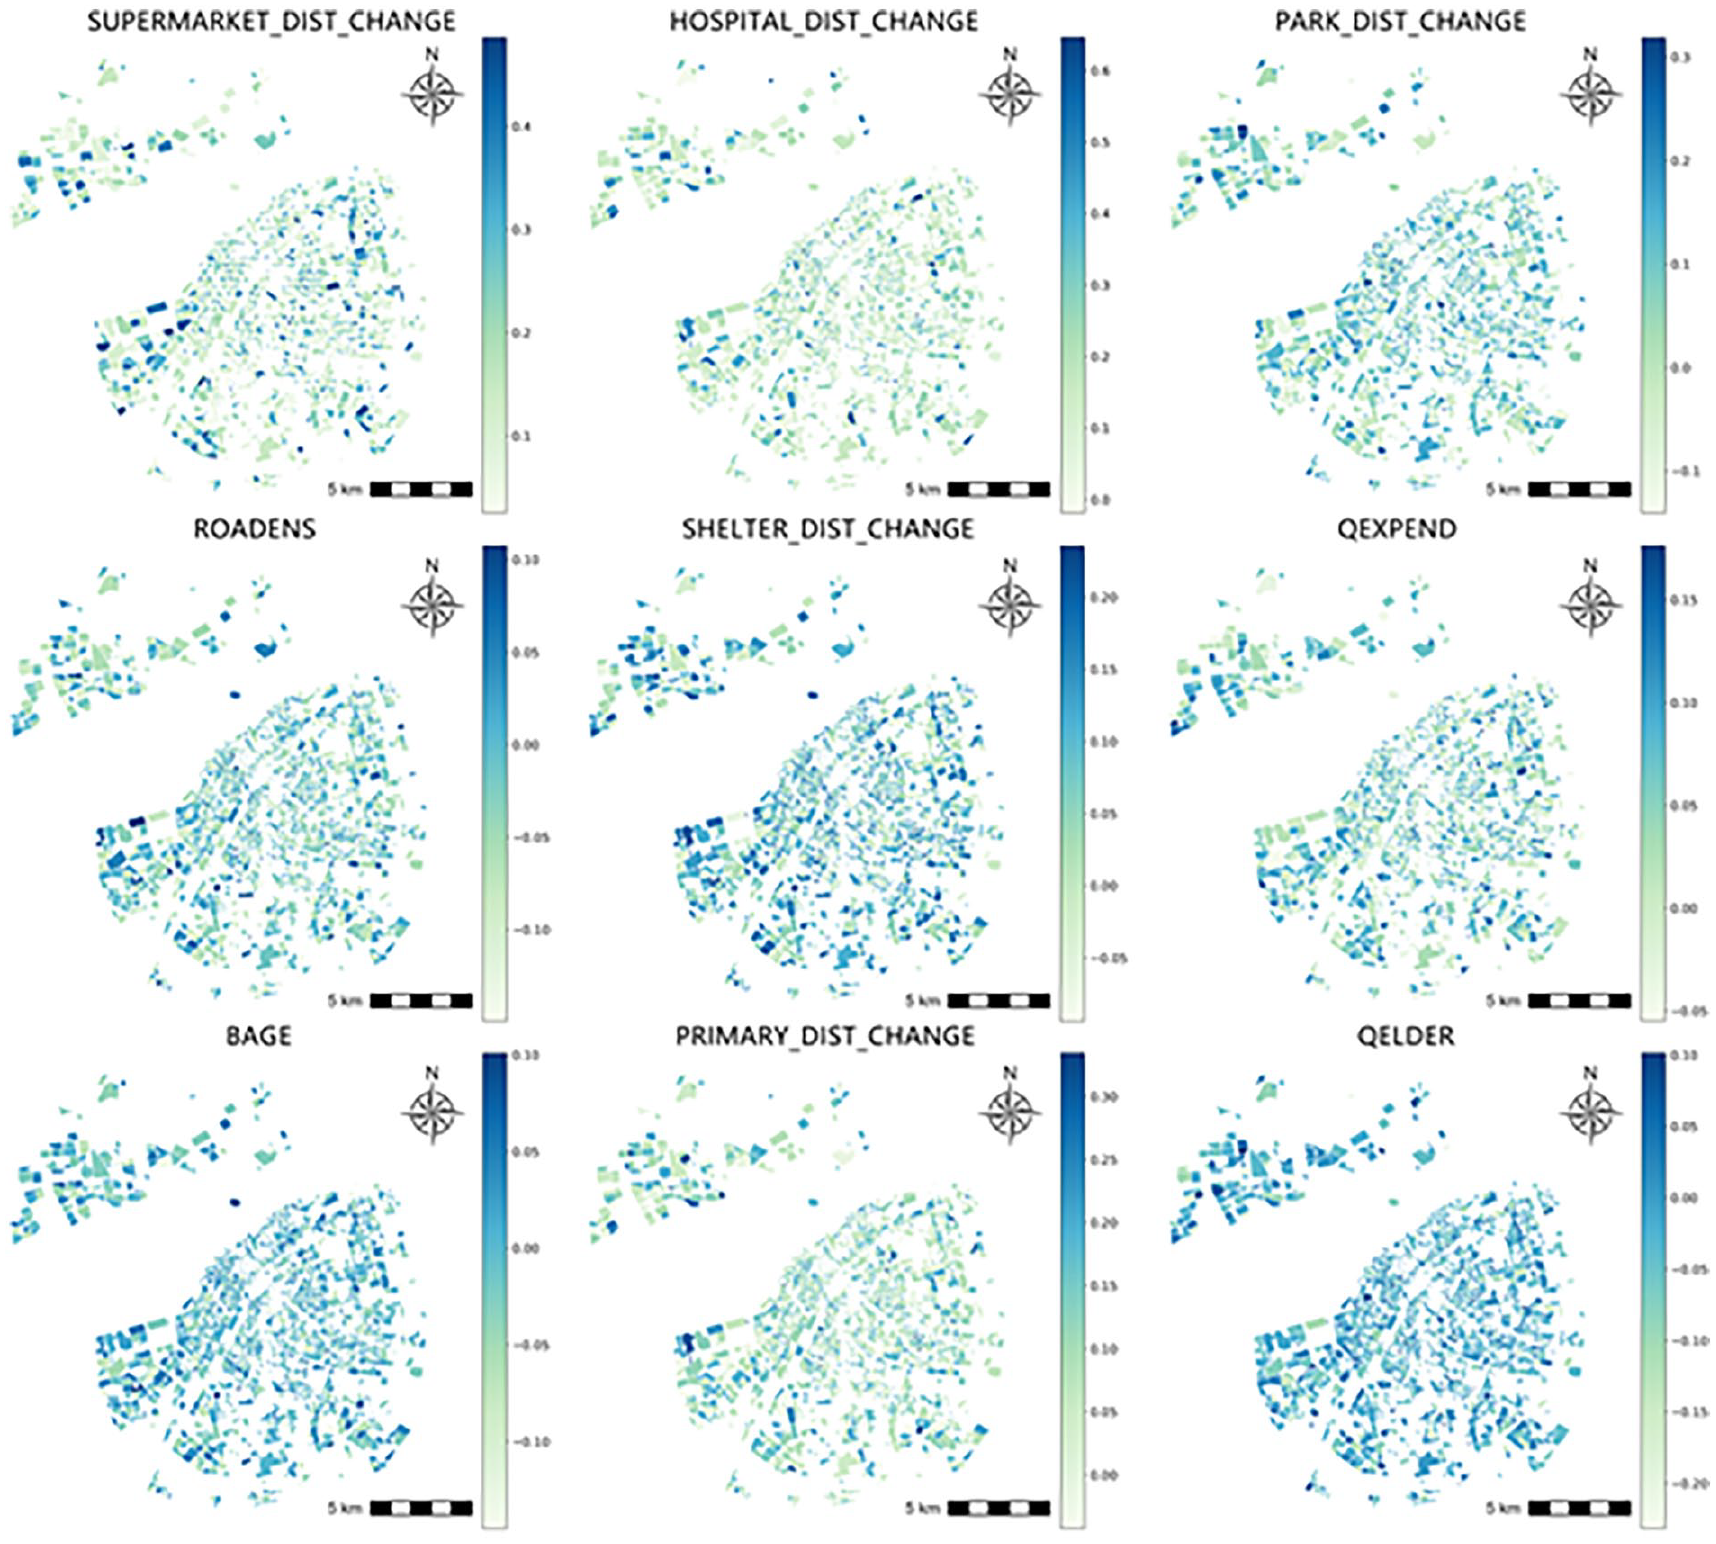
Spatial distribution of GWR coefficients at the community scale.
Discussion
Through the integrated application of geographically weighted regression, XGBoost modeling, and socio-economic vulnerability analysis, this study reveals the spatial differentiation patterns and underlying mechanisms of population density changes in Harbin. Our analysis identifies a pattern in Harbin where older urban areas with relatively complete infrastructure exhibit population shrinkage trends, while newer districts with relatively insufficient infrastructure demonstrate population growth. Specifically, although new urban districts such as Haxi and Qunli perform poorly on infrastructure accessibility indicators (with higher values for distance to hospitals, supermarkets, schools, etc.), their socio-economic vulnerability scores are significantly lower than those of older urban areas, and their population density shows a continuous growth trend.
This pattern, while consistent with global urban development trends documented in the literature on shrinking cities and neighborhoods (Martinez-Fernandez et al., 2012), presents interesting characteristics in the Chinese context. Cities worldwide have experienced similar “waves” of core depopulation and peripheral growth, followed sometimes by revitalization of central areas, driven by complex combinations of economic restructuring, changing lifestyle preferences, housing market dynamics, and policy interventions (Großmann et al., 2013; Haase et al., 2014). Our cross-validation using three methodologies confirms the existence of this phenomenon in Harbin and helps elucidate its specific formation mechanisms.
In-depth analysis indicates that while this urban development pattern is observed globally, its manifestation in Harbin is significantly shaped by China’s particular policy intervention mechanisms (Chen et al., 2013; Chen, Liu, et al., 2021; Tang et al., 2024). Harbin City has systematically guided the shift of urban development focus toward new districts through policy measures such as administrative resource transfers. This administrative promotion works alongside market forces, contributing to a distinctive urban development trajectory. Specifically, this is manifested in: the migration of government institutions driving the relocation of numerous public employees and related service industries; policy-biased land development and infrastructure investment enhancing the expected value of new districts; these factors collectively pushing housing prices in new districts significantly higher than in older urban areas, forming a selective attraction for higher socio-economic status groups.
Administrative-led urban new district development, as a characteristic pathway of Chinese urban expansion, has the advantage of rapidly forming new urban spaces and guiding urban structural adjustments. However, it simultaneously leads to problems such as uneven resource distribution, intensified social spatial differentiation, and hollowing out of older urban areas. The Harbin case demonstrates the specific characteristics of this development model within the Chinese context, providing important empirical evidence for understanding the transformation paths of cities in Northeast China while contributing to the broader global literature on urban shrinkage and growth patterns.
Conclusion
This study examines socio-economic vulnerability in shrinking cities through the dual lens of emerging disaster risks and economic downturn, using Harbin as an empirical case. By integrating geographically weighted regression, XGBoost modeling, and vulnerability assessment, we reveal that shrinking regions exhibit heightened vulnerability when facing these dual pressures. Notably, while Harbin’s old urban areas possess high infrastructure density, they demonstrate weaker disaster resilience due to aging facilities, population aging, and concentration of socio-economically disadvantaged groups.
Our findings suggest that vulnerability reduction in shrinking cities requires both technological innovation and spatial restructuring. We recommend establishing a “Digital Economy” development strategy to leverage internet technologies and artificial intelligence, creating asset-light development pathways that attract digital nomads while preserving local cultural assets. From a spatial planning perspective, implementing differentiated strategies is crucial: organic renewal combining micro-improvements with disaster prevention enhancement in old districts, and climate-adaptive design integration in new developments. Community-level interventions should implement differentiated development strategies that accelerate infrastructure deployment and public service facility construction in growing new districts while simultaneously upgrading facility functions and addressing infrastructure aging in older urban areas. Sensitivity analysis demonstrates that 15% improvements in key indicators—distance to hospitals, supermarkets, and shelters—can reduce high-vulnerability areas by approximately 26%, providing scientific evidence for targeted resource allocation under budget constraints.
Several limitations constrain this study’s scope. First, our reliance on cross-sectional data (2017–2023) limits understanding of dynamic evolution processes, particularly the long-term development potential of new districts transitioning from construction to functional completion. Second, the absence of systematic comparison with economically active regions like Beijing-Tianjin-Hebei and the Yangtze River Delta constrains assessment of Harbin’s competitive position within broader regional contexts. Third, our demographic analysis lacks cohort ratio metrics that would reveal age group transitions over time, a methodological gap stemming from data accessibility constraints.
Future research should incorporate spatiotemporal sequence analysis to track dynamic responses as new district facilities develop, conduct multi-scale regional comparative studies to evaluate Harbin’s position within national urbanization patterns, and construct resource flow network models to explore systematic impacts of uneven distribution on urban resilience. Additionally, collecting longitudinal mobile phone signaling data will enable cohort ratio analysis, strengthening understanding of how demographic transitions influence vulnerability at the community scale (Aoki, 2022, 2024; Park et al., 2024). Scenario simulation research for emerging disaster risks should be expanded to provide scientific foundations for climate adaptation planning in shrinking cities.
Although demonstrated through Harbin’s case, our methodological framework exhibits broad applicability to other inland cities facing population shrinkage challenges, particularly in Northeast China. The integration of multi-dimensional vulnerability assessment with machine learning approaches effectively captures spatial heterogeneity and non-linear relationships across different urban contexts. As China’s urbanization transitions toward high-quality development, this research contributes to understanding how shrinking cities can enhance resilience and sustainable development capabilities while addressing the dual challenges of climate change and economic transformation. The quantifiable analytical framework enables direct translation of research findings into planning elements and policy development, bridging the gap between theoretical research and practical urban governance applications.
Footnotes
Declaration of conflicting interests
The author(s) declared no potential conflicts of interest with respect to the research, authorship, and/or publication of this article.
Funding
The author(s) received no financial support for the research, authorship, and/or publication of this article.