
Abstract
The zero-COVID policy that China maintained during the COVID-19 pandemic was effective in controlling virus transmission, while also having a profound impact on people’s emotions. Previous studies have shown that urban green spaces (UGS) can improve people’s emotional status during pandemics. However, the specific way that UGS affects people’s emotions after lifting the zero-COVID policy is still unknown. Here, we used a regression discontinuity in time method to evaluate the effect of sentiment and emotional changes in the UGS posed by the lifting of zero-COVID policy, using 2.36 million geotagged social media data from Weibo in China. Our results show that people who visited UGS had higher sentiment scores compared to those who stayed at home. Moreover, the emotional regulation capacity of UGS significantly decreased by 0.044 units after the lifting of the zero-COVID policy. The difference also showed heterogeneity across provinces, and UGS demonstrated greater emotional regulation capacity for women, highly educated individuals, and two age groups (18–22 and 33–40). This study emphasizes the critical role of UGS to mitigate emotional distress during public health crises and highlights the potential of social media data in providing timely policy interventions.
Introduction
Since January 2020, worldwide governments have implemented a variety of policies in response to the COVID-19 pandemic and have made unprecedented efforts to halt the spread of SARS-CoV-2 (Sibley et al., 2020). The Chinese government’s “zero-COVID” policy has contained the spread through strict short-term lockdowns and mandatory quarantines, minimizing the impact of community transmission of the new coronavirus on health and sanitation systems in most areas. Various countries’ prevention and control strategies have restricted individual mobility to varying degrees (Hunter et al., 2021). While lockdown is an effective solution, it has resulted in emotional changes that have yet to be properly assessed. For example, lockdowns have reduced face-to-face social contact and broader connections with others, leading to an increase in psychological problems such as isolation, high uncertainty, anxiety, and stress (Hwang et al., 2020). These negative emotions have affected public mental health to a certain extent and may even lead to deterioration in mental health and increasing more extreme social problems such as multiple suicide risk factors (O’Connor et al., 2021; Qiu et al., 2020; Wang et al., 2020).
However, China’s COVID-19 lockdown policy shifted dramatically in November 2022. On November 11, 2022, the Chinese government issued the “20 measures,” which slightly softened the stringent interventions. These were replaced by the “10 measures” on December 7, 2022, resulting in the removal of nearly all intervention policies. On January 8, 2023, the decision was made to treat COVID-19 as a Class-B infectious disease, essentially ending the zero-COVID policy (https://en.wikipedia.org/wiki/Zero-COVID). Indeed, the abrupt lifting of the zero-COVID policy resulted in a large number of infections in a short period of time, putting an enormous strain on the healthcare system in many cities (Du et al., 2023) and emotional shifts on social media (Wang et al., 2024a). In this context, monitoring emotions on social media provided critical support to policymakers, allowing them to immediately identify public responses and concerns (Sukhwal and Kankanhalli, 2022). A growing number of studies have shown that sentiment analysis based on social media posts can serve as an effective indicator of sentiment at the societal level (Ma et al., 2024; Zhao et al., 2024; Zheng et al., 2019). Therefore, analyzing social media data is crucial for understanding the social consequences of policy changes, tracking public sentiment and emotional changes during extraordinary events, and ultimately enhancing urban resilience and safeguarding public mental health.
Numerous studies have demonstrated an association between exposure to nature and emotional changes, and the epidemic has further emphasized the importance of UGS (Kleinschroth and Kowarik, 2020; Schwartz et al., 2019). According to research by Lu et al. (2021), in Asian cities, such as Hong Kong, Singapore, Tokyo, and Seoul, the frequency of UGS use is highly connected to the intensity of the epidemic. During crises, people tend to visit UGS. Studies have even shown that people experiencing psychological distress benefit from the exposure to residential greenery, even during home quarantine (Nishimura et al., 2023; Wang et al., 2024b). These studies further highlight the critical role of UGS in public health crises and promote nature-based public health strategies as urban solutions to mitigate the negative effects of the pandemic.
To better understand the role of UGS in the global epidemic, several studies have used geolocation data to investigate the relationship between UGS use and emotional health during containment policies in different countries. For example, under Norway’s comparatively lenient containment policy, a study based on mobile data and Google Trends revealed that people increased their usage of UGS for recreational activities during COVID-19, confirming that UGS provided a healthy buffer zone (Venter et al., 2020). Similarly, a study analyzing Weibo data in Beijing, China examined how residents’ emotions changed before and during the pandemic and discovered that UGS had a direct impact on residents’ emotions during the peak of the pandemic (Guo et al., 2022). These studies offer compelling evidence of the beneficial effects of UGS on people’s emotional status throughout the pandemic.
Despite these timely and valuable studies, it remains unclear how UGS have influenced emotions nationwide in China under the context of the zero-COVID policy lifting. Furthermore, most existing studies are based on longitudinal data from specific nations, regions, or populations, and the impact of UGS may differ across geographical and socioeconomic situations (Larson et al., 2022; Lu et al., 2024). There is a lack of large-scale, multivariate, quasi-natural experimental investigations in China, which requires more research on the mechanisms underlying the role of UGS, as well as the regional and population variation in their effects.
To fill this research gap, this study investigates the sentiment and emotional changes of people who were staying at home or visiting green spaces across the country before and after the complete lifting of the lockdown in China, using geotagged social media data from June 2022 to June 2023 collected on Weibo, and assesses the relationship between the “zero-COVID” policy adjustment and the regulation capacity of UGS. We use natural language processing (NLP) approaches to analyze social media posts from 31 Chinese provinces by analyzing geotagged posts located in UGS and residential areas. We expanded the framework of emotional research by conducting both sentiment and emotional analysis. Sentiment refers to the overall attitude or feeling expressed in the posts, such as positive or negative, and is accomplished through a common emotion polarity dichotomous categorization task, and emotion refers to a more specific feeling or emotional state, which is achieved through a fine-grained multi-label emotion classification task (Nandwani and Verma, 2021). Specifically, we use bidirectional encoder representations from transformers (BERT) model to conduct sentiment analysis and classification on Weibo posts, calculating post texts as relative positive sentiment values from 0 to 1, and classifying post texts into six categories of emotion: angry, fear, happy, neutral, sad, and surprise, to assess people’s emotional changes. In addition, a regression discontinuity in time (RDiT) was used to analyze the relationship between zero-COVID policy adjustments and the emotional regulation capacity of UGS (see Methods). To explain and measure the emotional effects of UGS use, we further investigated differences in the mitigating capacity of different types of UGS, as well as the variation in their mitigating effects across different socio-demographic groups (such as gender, education level, and age).
Our research focuses on the following specific questions: 1) In the context of China, what is the trend of people’s emotional changes when visiting UGS and residential areas before and after the lifting of the zero-COVID policy? 2) How does the emotional regulation capacity of UGS change after the lifting of the zero-COVID policy? 3) To what extent do the emotional regulation capacities of different provinces, populations, and green space categories differ? What factors are associated with these differences? By analyzing the differential effects of UGS on people’s emotions over time, this study aims to provide a multidimensional heterogeneity perspective on the underlying causes of these differences. The findings will provide scientific evidence for urban managers to effectively utilize UGS in future public health emergencies. In addition to contributing to the body of knowledge on the relationship between UGS and mental health, this research has important implications for improving public well-being and strengthening urban resilience.
Data
This study collected national wide Weibo posts from June 2022 to June 2023, spanning the period before and after the zero-COVID policy. Users were given the option of attaching point-of-interest (POI) information while posting. The posts’ tagged POIs are of interest to our analysis. Finally, we constructed a Weibo mobility dataset consisting of 1.82 million posts uploaded in UGS (Figure 1a) and 0.54 million posts uploaded in residential areas.
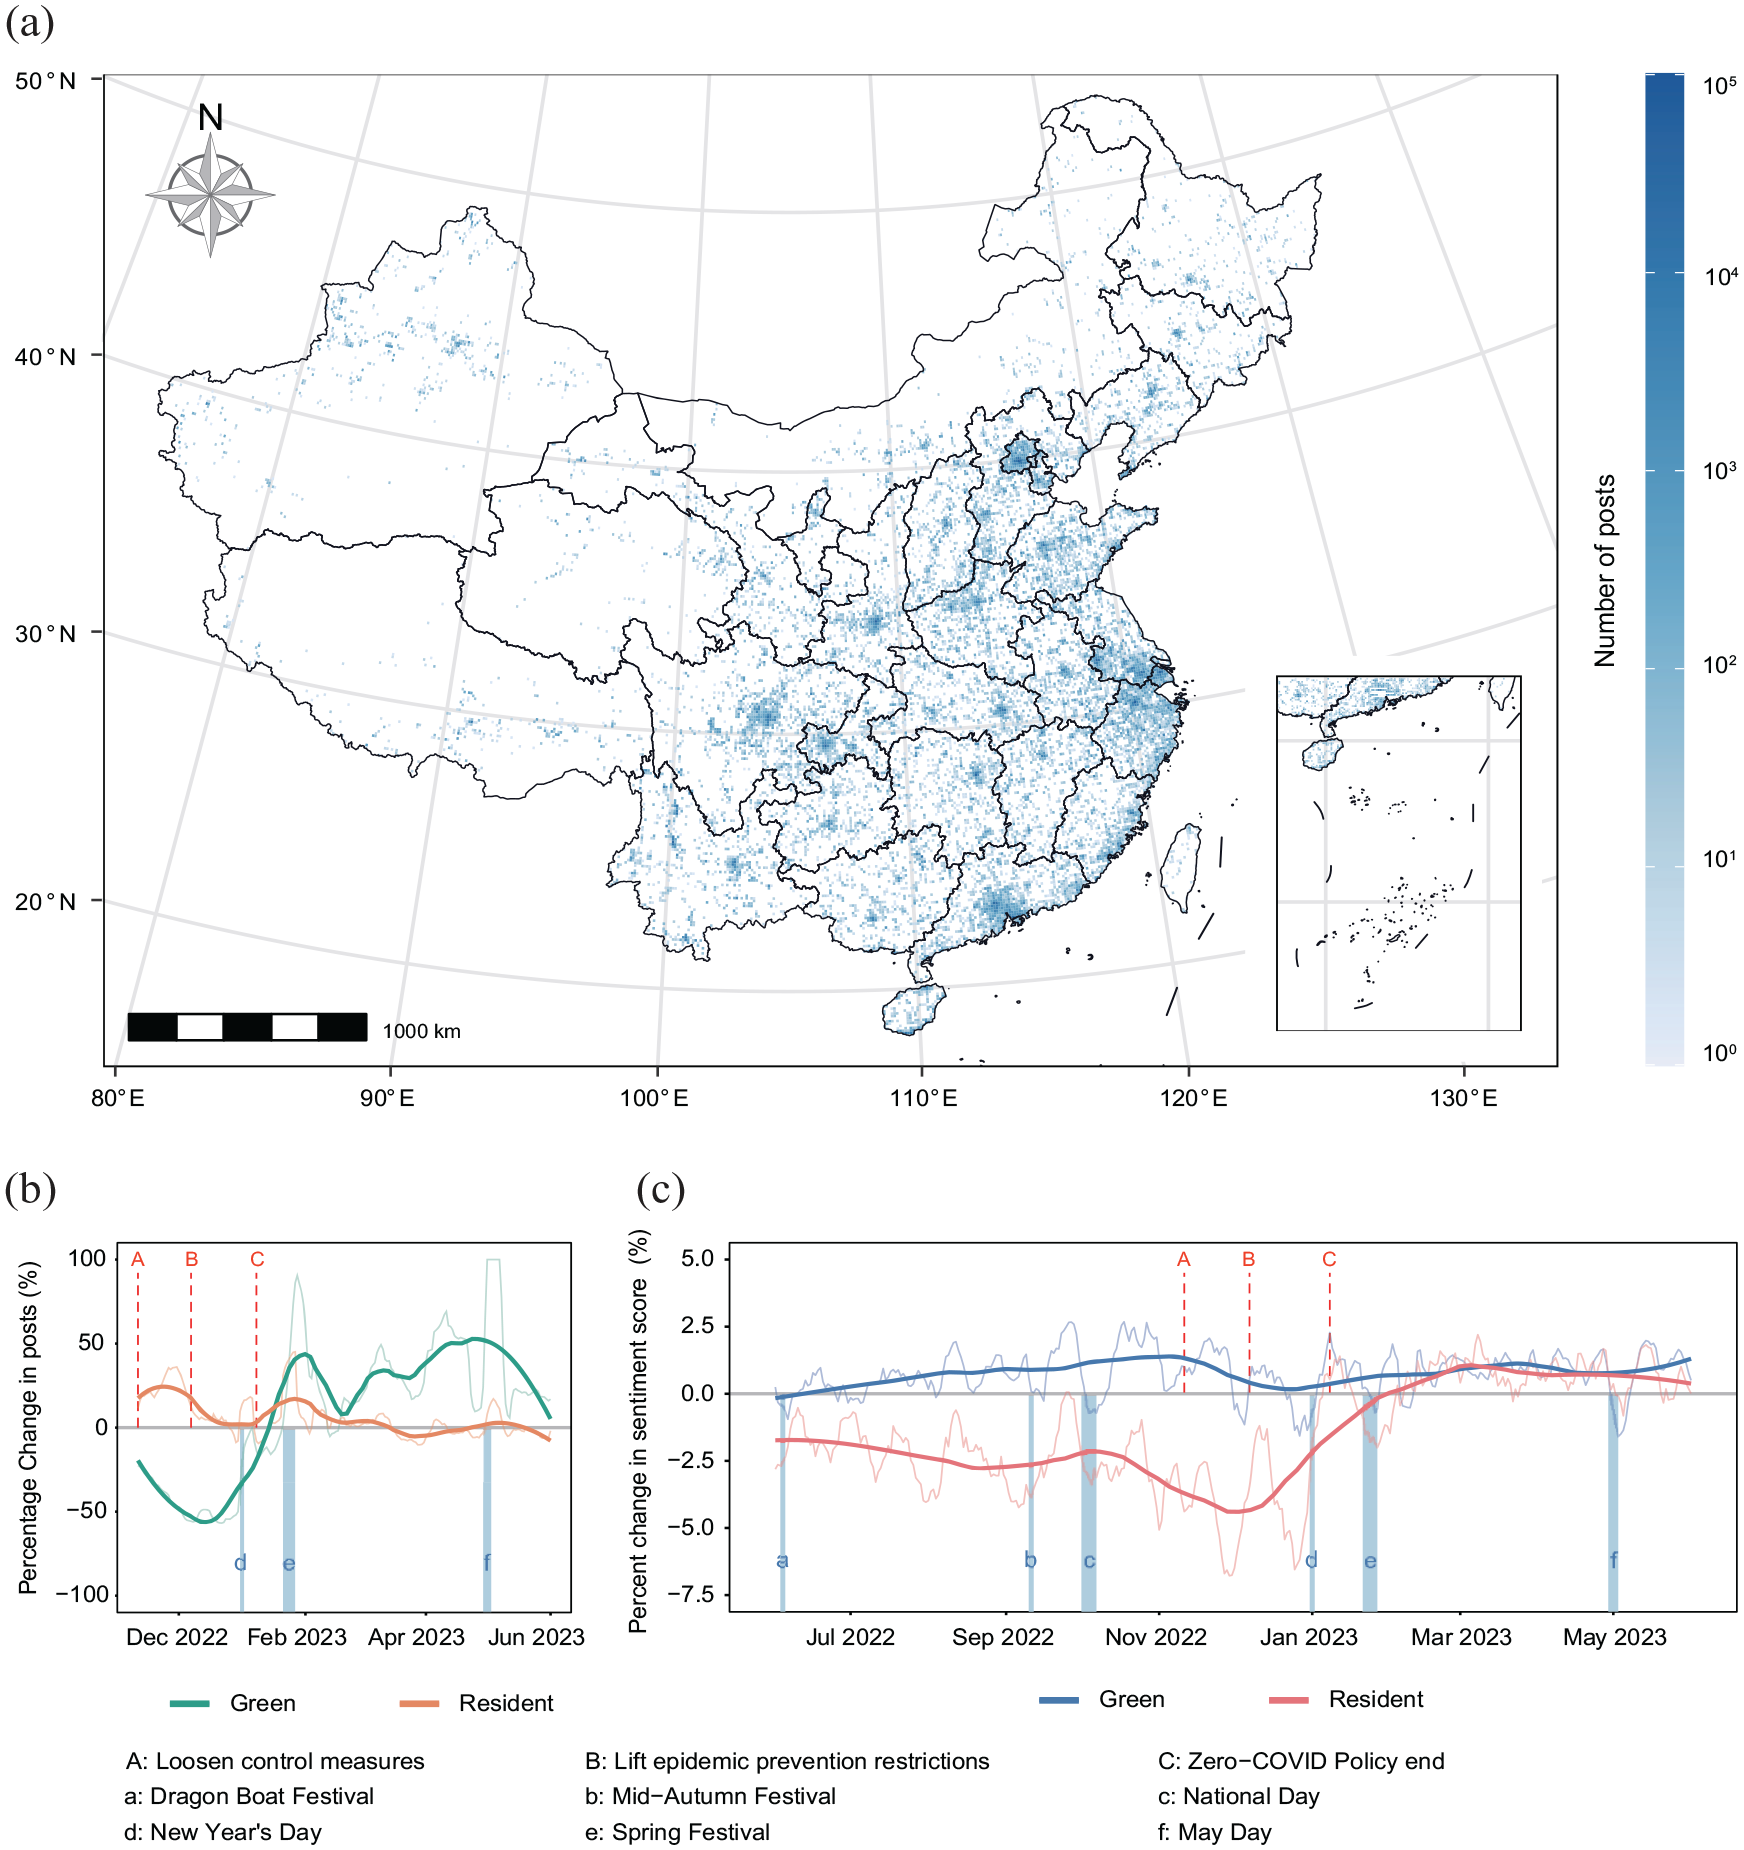
Spatiotemporal distribution of geotagged social media data across China. (a) Spatial distribution of 1.83 million geotagged social media posts uploaded in green spaces from Weibo between June 1, 2022, and June 1, 2023. (b) Percentage change in the number of posts. The figure shows the relative change in the number of posts after December 2022. It is calculated by comparing the post count from June to December 2022 (baseline). (c) Percentage change in the median sentiment score of posts. Lines with high transparency depict the original sentiment score, while lines with low transparency depict the sentiment trends after STL processing. The dashed lines indicate the three key dates marking the end of the zero-COVID policy (A: Loosening control measures on November 11, 2022; B: Lifting epidemic prevention restrictions on December 7, 2022; C: Official end of the zero-COVID policy on January 8, 2023). The labels “a” through “f” represent the public holidays in China (a: Dragon Boat Festival; b: Mid-Autumn Festival; c: National Day; d: New Year’s Day; e: Spring Festival; f: Labor Day).
Geotagged social media data
Weibo, equivalent to Twitter (now called X), China’s most influential social media platform, offers the public an effective platform for engagement, communication, and collaboration. Its real-time nature enables it to reflect the public’s immediate response to the surrounding environment (Zhu and Xu, 2021). During the COVID-19 pandemic, Weibo served as a major communication tool and information source for the Chinese people, playing a vital role in understanding public concerns and demands (Wang et al., 2020; Zhao et al., 2020).
To conduct a nationwide comparative analysis, we used reverse geocoding technology to identify the province and city for each geotagged post from its geographical coordinates. Furthermore, we linked Weibo post data with user profiles to examine population heterogeneity, incorporating details such as gender, birth date, and education level. All user profiles were obtained from Weibo’s personal profile page and anonymized to ensure that users’ privacy was fully protected.
Weibo point-of-interest data
The location point information added by Weibo will be matched to a specific POI category (https://open.weibo.com/wiki/Location/category). We collected a total of 25 subcategories of POI related to the UGS and then used the categories to group some locations with similar characteristics into scenic green spaces, park green spaces, square green spaces, natural green spaces, and the other five POI categories for subsequent analysis (see Supplementary Table 1). For POIs related to residential areas, we selected only posts associated with residential locations, including five subcategories: residential areas, villas, residential communities, dormitories, and community centers. These are collectively referred to as residential-related posts.
Normalized difference vegetation index (NDVI) data
NDVI, as one of the most commonly used and easily accessible vegetation indices, has been widely employed as a proxy for urban green space exposure (Gascon et al., 2016; Rojas-Rueda et al., 2019). In this study, we utilized the MOD13A3 dataset, regularly published by NASA (www.earthdata.nasa.gov/), to obtain monthly NDVI data for each province in China from June 2022 to June 2023. In the RDiT regression analysis, we incorporated the monthly NDVI data of each province as a control variable to account for differences in green space coverage, while limiting seasonal variation in green space cover to more accurately identify sentiment changes driven by policy shifts.
Methods
To understand the relationship between the zero-COVID policy shifts, public sentiment, and the influence of UGS, we examined two dimensions: “sentiment and emotional changes” and “emotional regulation capacity.” We measured sentiment and emotional changes by analyzing the time series data of posts across the country and provinces. Additionally, we employed the RDiT model to identify the impact of the lifting of zero-COVID policy on the emotional regulation capacity of UGS.
The sentiment analysis was conducted in phases, with three key policy milestones defining these stages: November 11, 2022 (A), December 7, 2022 (B), and January 8, 2023 (C). We established three key time windows for subsequent analysis: the period prior to Policy A is referred to as the zero-COVID Policy Period (ZcPd), the period between A and C is called the zero-COVID Policy Transition (ZcTr), and the period after C is defined as the zero-COVID Policy Lifting (ZcLt). See the time period definition in Figure 1c.
Sentiment and emotional analysis
To extract public sentiment and emotional changes from a large number of social media posts, we used NLP technology, which can automate text mining and convert unstructured text data into structured data for subsequent quantitative analysis (Salloum et al., 2017). Several NLP techniques have been extensively used in the sentiment analysis field, such as Linguistic Inquiry and Word Count (LIWC), which uses the relative frequency of emotion-related words to identify positive and negative emotions (Pennebaker et al., 2015). However, a study by Jaidka et al. (2020) notes that evaluating subjective well-being based on word level may be inaccurate because of linguistic variations across cultures and geographical locations, which could alter the anticipated relationship. Furthermore, the BERT model employs a bidirectional Transformer structure to capture word context semantic information, allowing for precise word meaning identification in much more complicated contexts. More importantly, BERT, one of the most advanced text processing transformers, has achieved state-of-the-art performance across numerous NLP tasks (Devlin et al., 2019), particularly in sentiment analysis. These multilingual pre-trained models have been frequently used for social media post analysis and have shown great potential for cross-linguistic analysis (Sukhwal and Kankanhalli, 2022; Wang et al., 2022). Furthermore, BERT enables pre-training on extensive unannotated text samples and can produce extremely accurate sentiment classification results with only a few parameter adjustments (Sun et al., 2019).
Considering the advantages of BERT, we chose the BERT-chinese model (https://github.com/google-research/bert) to handle sentiment classification on Chinese social media posts. The training data is a labeled dataset of about 28,000 posts on Weibo, coming from “The Evaluation of Weibo Emotion Classification Technology (SMP2020-EWECT).” Specifically, each post is manually labeled with one of six categories: angry, fear, happy, neutral, sad, and surprise (Guo et al., 2021). Then we fine-tuned a pre-trained BERT model on the Chinese dataset. After the model’s parameter tuning, training, and evaluation, we find that the model achieves an accuracy of 0.787 and an F1 score of 0.756 in the Chinese text categorization task. Compared to other deep learning methods used for sentiment classification of Chinese Weibo posts, the BERT model demonstrated a significant performance advantage (Guo et al., 2021). Furthermore, this model demonstrated its higher performance by outperforming the baseline BERT model results (accuracy: 0.772, F1 score: 0.739).
Along with categorizing each post’s sentiment, we also determined the text’s emotional polarity (positive or negative) and sentiment score based on the BERT-chinese model, which ranges from 0 to 1 (for examples see Supplementary Table 2). To maintain consistency and facilitate comparison, we modified the scores for postings expressing negative emotions by subtracting the emotional score from 1, ensuring that all emotional scores were converted into relative positive emotional scores. Subsequently, we aggregated the sentiment scores for residential areas and UGS by day for the country and provinces. We used the median of the daily sentiment scores to minimize the interference of extreme values. These daily median sentiment scores served as the raw data for the subsequent analysis.
Differences in green space regulation capacity
Sentiment trends
To identify potential long-term sentiment and emotional trends and achieve a more precise analytical result, we used seasonal trend decomposition based on LOESS smoothing as a data preprocessing technique (He et al., 2022). This approach decomposes the original time series of sentiment values into trend, seasonal, and residual components (see Supplementary Figure 1). To reduce noise from daily sentiment and emotional fluctuations, we applied a 7-day moving window to both UGS and residential data. This approach provided smoother and lower-noise time series data, which served as inputs for the RDiT analysis. To ensure the robustness of our results, we performed sensitivity analyses using 3-day, 7-day, and 14-day moving windows, all of which revealed consistent sentiment trends (see Supplementary Table 3).
Regression discontinuity in time (RDiT)
RDiT is a regression design technique that employs time as the independent variable and treatment date as the threshold (Hausman and Rapson, 2018). In this study, we collected geotagged data at the daily level and used the RDiT framework for regression design. Our outcome variable is the difference in sentiment values between the UGS and residential areas. The regression design employs time (i.e., the number of days passed) as an operating variable to evaluate the effect of policy changes on the ability of UGS to alleviate emotions. To reduce the intervention of unobservable confounders during policy changes, we refer to the method of Barreca et al. (2011) and remove the observations near the policy change threshold (November 11, 2022 to January 8, 2023). We used local linear regression to fit sentiment values on both sides of the threshold and conducted regression analysis. The model is depicted as follows:

In this model,
Result
Trends in emotional changes between green spaces and residential areas
We utilize time series data to illustrate variations in the amount of Weibo posts and sentiment scores in China. By utilizing the number of posts from June to December 2022 as a baseline, Figure 1b depicts the percentage change in the number of posts from the implementation of Policy A to June 2023. Following the lifting of some intervention measures, the number of posts uploaded in UGS dropped sharply, reaching a minimum decrease of 56.8% around December 22, 2022, before a gradual recovery and returning to the baseline value after around 30 days. This decline was likely caused by the sudden surge in infections due to the abrupt lifting of interventions. The subsequent holidays, including Labor Day and the Spring Festival, probably contributed to increasing the number of people who visited UGS, with visits continuously rising throughout the Spring Festival and peaking at 90.5% on January 28, 2023. In contrast, posts uploaded in residential areas briefly increased before stabilizing near the baseline.
Figure 1c shows the percentage change in the sentiment value of UGS and residential posts across the country between June 2022 and June 2023. Overall, sentiment scores in UGS were consistently higher than those in residential areas, averaging 2% higher, especially throughout the ZcPd. Sentiment fluctuation in UGS was slight, implying more steady emotional responses. In contrast, residential areas showed higher levels of emotional volatility, particularly during the ZcTr, where emotions experienced the largest drop around November 29, 2022, with a decrease of −6.7%. This decline may be linked to concerns triggered by the unexpected lifting of zero-COVID policies, especially among unvaccinated populations who were anxious about potential shortages of medical supplies and the strain on the healthcare system. After approximately 40 days, sentiment scores in residential areas had returned to baseline levels. This suggests that during the pandemic and policy transitions, UGS served as an emotional buffer, with their positive effects being especially noticeable during periods of widespread emotional distress among residents (Figure 1).
To identify differences in sentiment trends between provinces, we analyzed daily sentiment scores over a specific period (Figure 2). In most provinces, UGS had higher sentiment values compared to residential areas. Compared with the baseline, UGS posts in Nei Mongol, Heilongjiang, and Xinjiang showed lower sentiment scores during the ZcTr, while Yunnan and Beijing showed more positive emotion, and Zhejiang and Guangdong’s sentiments were least affected by the policy. Residential posts in most provinces exhibited negative emotions during both the ZcPd and ZcTr. Guangdong and Shanghai had higher sentiment values and lower fluctuations than the national residential sentiment trend. In contrast, Ningxia and Jilin had higher negative sentiment status and stronger fluctuation.
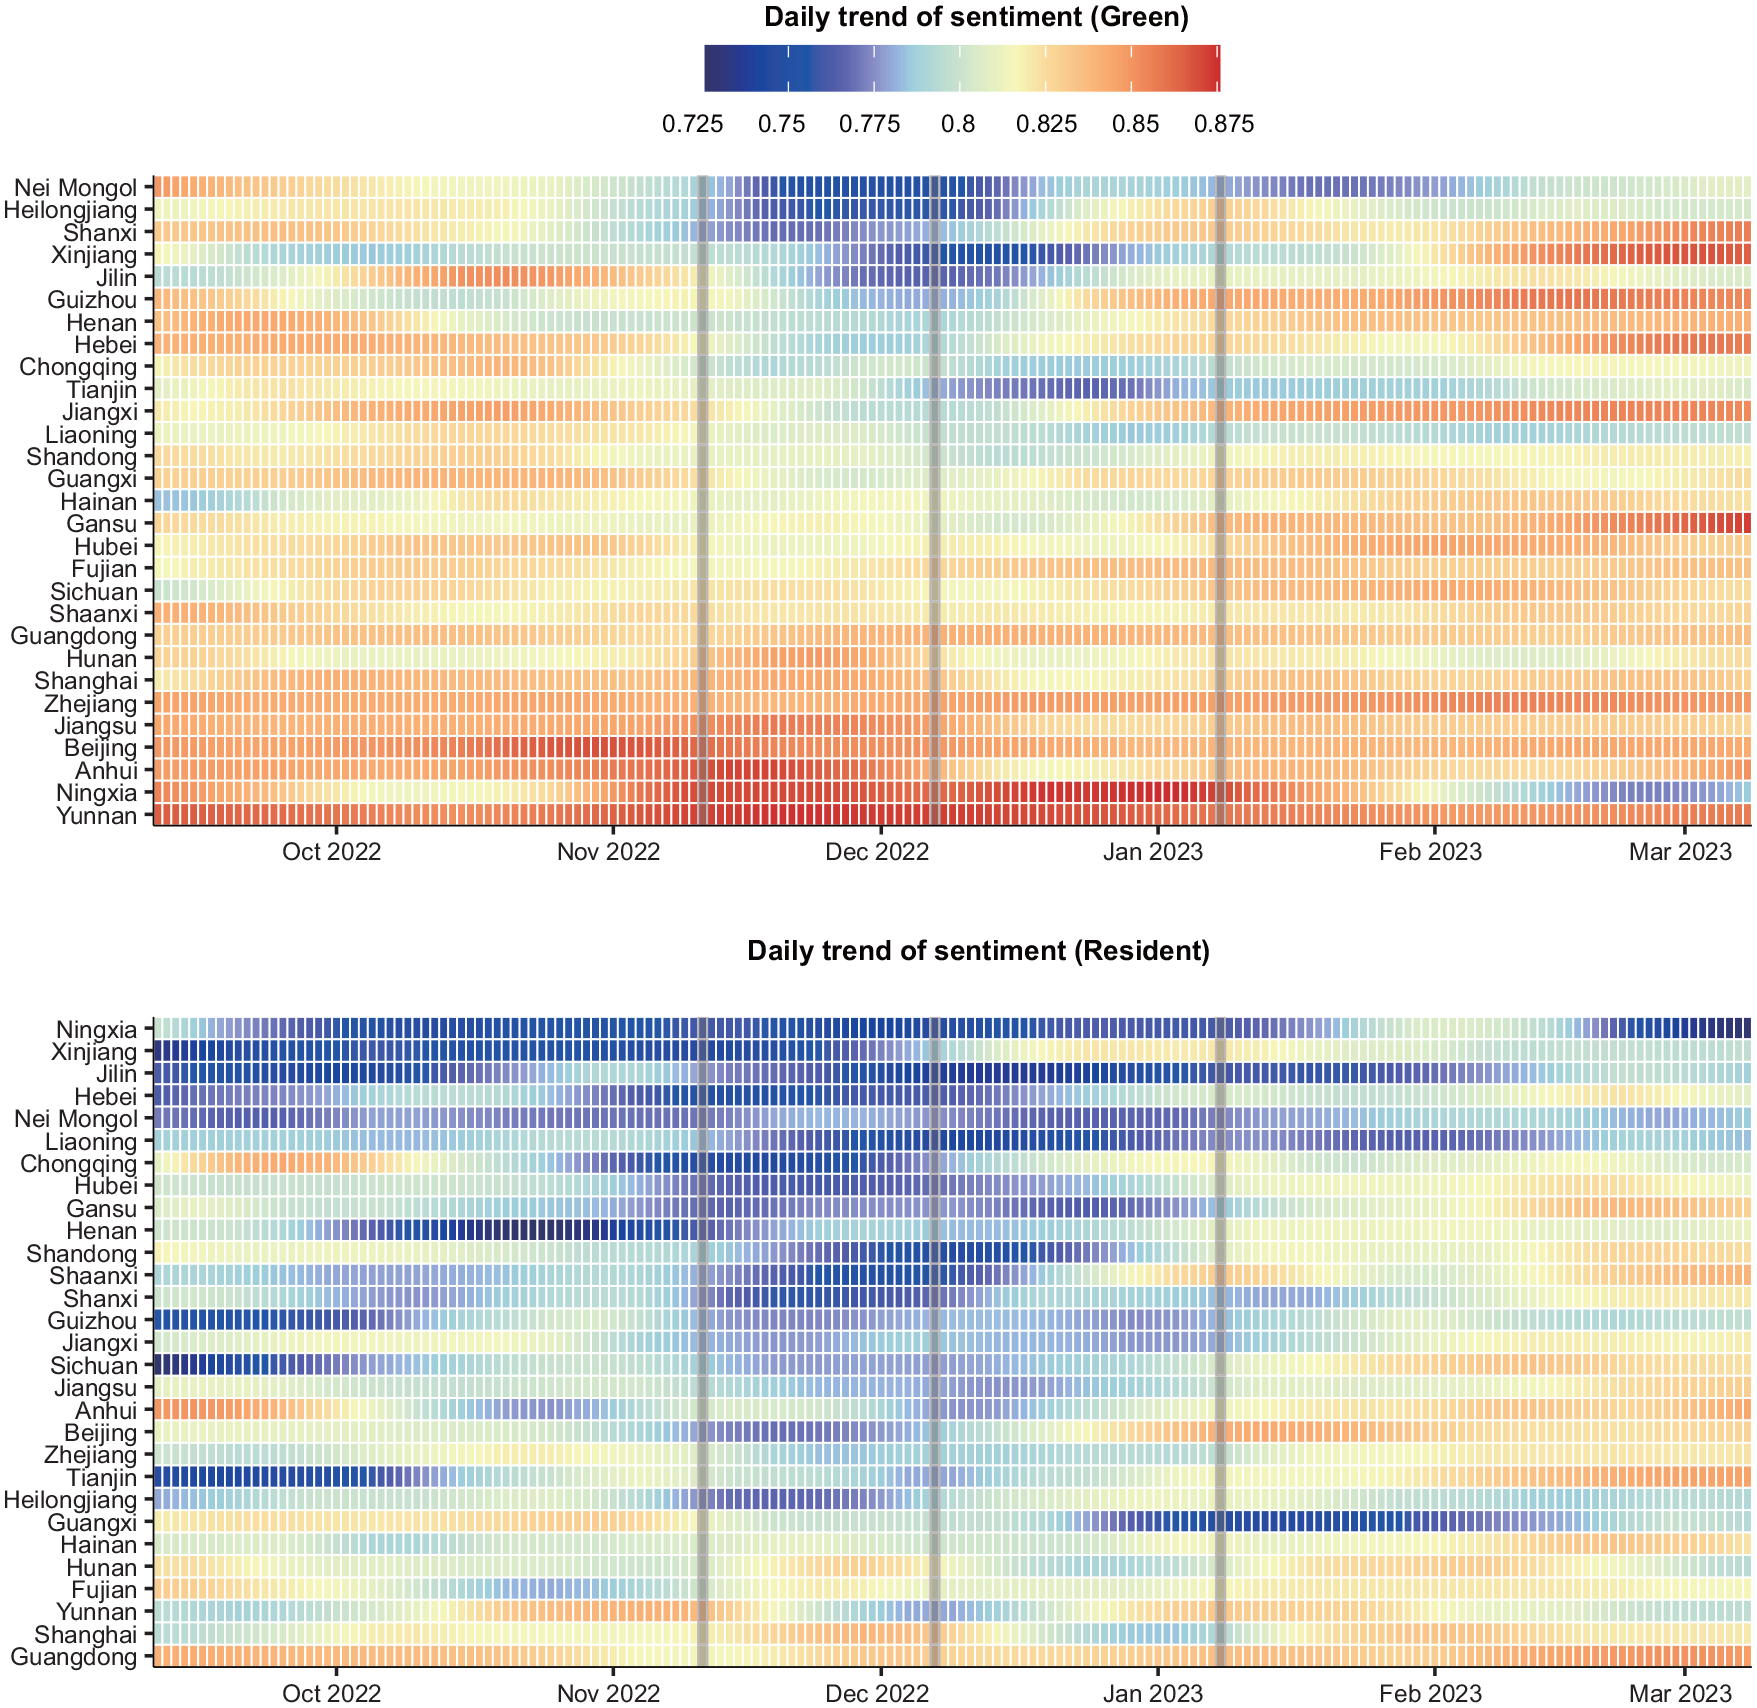
Sentiment trends of urban green space and residential areas across provinces. The figure illustrates daily sentiment trends across 29 provinces derived from the raw time series data smoothed using STL decomposition. The provinces “Qinghai” and “Xizang” are excluded from the analysis due to insufficient post counts on certain dates. The vertical lines indicate three key time points marking the lifting of the zero-COVID policy, as previously mentioned.
Trends of six category of emotion
To fully reveal the complexities of people’s emotional changes, we used sentiment classification to divide the emotions in posts into six categories: surprise, sadness, neutral, happiness, fear, and anger (Figure 3). We then examined the temporal variations of these emotional categories to provide a more comprehensive understanding of public emotion fluctuations.
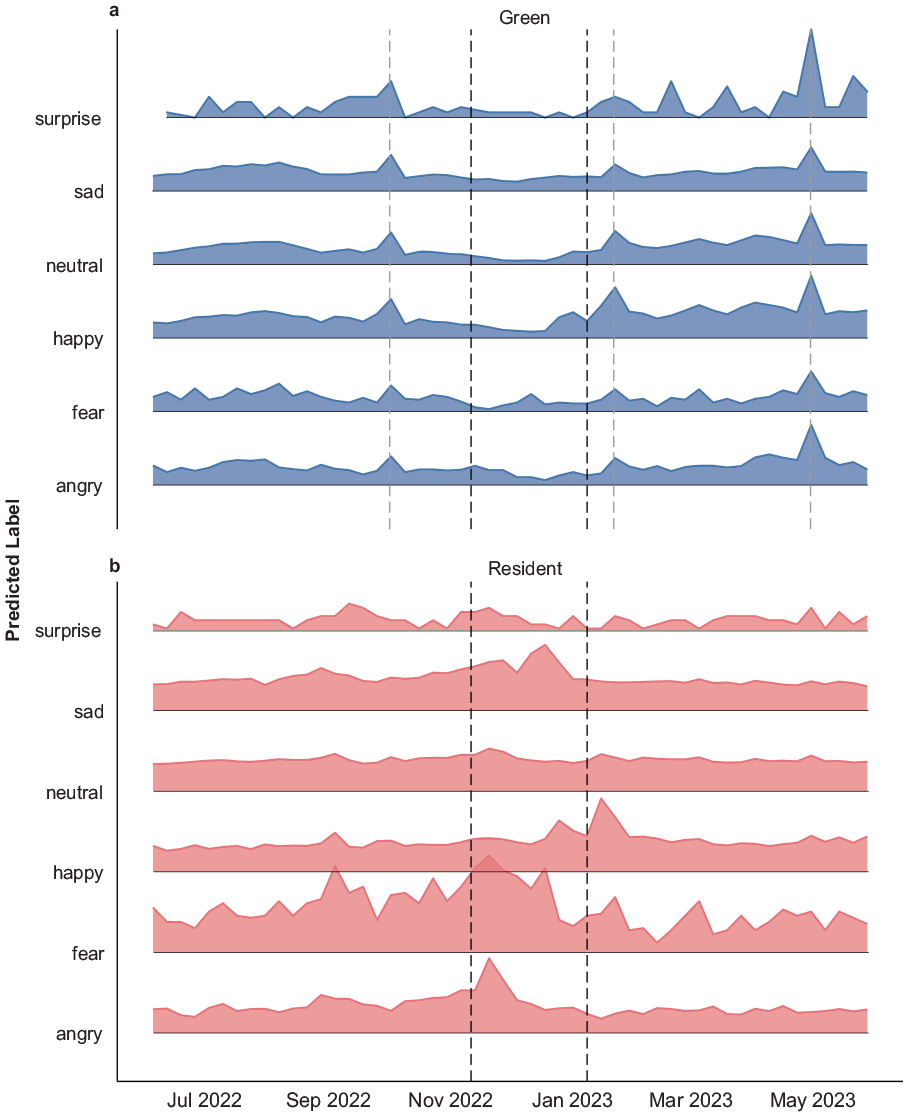
Frequency of six category of sentiment. The figure shows the percentage change in word frequency for six detected sentiment categories over time derived from green (a) and resident (b) posts. The number of posts is aggregated weekly, and the percentage changes are calculated. These values are normalized and mapped to a range of 0–100%, clearly visualizing emotion fluctuations in different periods. In both (a) and (b), the black dashed lines indicate the time points policy changes occurred, while in (a), the gray dashed lines represent three major holidays in China: National Day, Spring Festival, and Labor Day.
The findings show that during the holidays, the number of emotion categories in green space-related posts changed significantly. Specifically, during the National Day holiday, all six emotion categories demonstrated a slight peak, followed by the highest growth in the quantity of surprise and happiness during Labor Day, which may be due to the increased holiday travel activities. During the ZcTr, there was a modest rise in fear-related posts, possibly due to the concerns about health and safety following the unexpected easing of restrictions. Following ZcTr, the number of posts with happiness increased, indicating the public’s positive reaction to the lifting of the zero-COVID policy.
In contrast, emotion in residential posts appeared to be more directly influenced by policy changes. Both “sad” and “angry” saw a significant rise in the ZcTr, which could be attributed to public dissatisfaction with policy or social security. After the policy ended, these two types of emotions gradually declined and remained stable. Furthermore, fear fluctuated significantly throughout the observation period, particularly during the ZcPd. Due to the strict lockdown measures, the public may have experienced increased fear stemming from restrictions on living constraints and health risks. The quick dissemination of uncertainty on social media and information asymmetry may be responsible for the temporary spike in anxiety at the start of the ZcTr.
Urban green space regulation capacity in negative emotion
Although we have examined the temporal variations in sentiment scores and sentiment categories of posts from both UGS and residential areas, we have not yet directly determined the specific role UGS play in emotional regulation or the relationship between lifting of policy and sentiment. Thus we used the trends in sentiment difference between UGS and residential posts across the nation as a proxy for emotional regulation capacity. We then applied the local linear regression to model the trend of sentiment differences during the ZcPd and ZcLt to capture the patterns in emotional shifts. Furthermore, we employed the regression discontinuity in time (RDiT) model to quantify the changes in UGS’s emotional regulation capacity, enabling a more exact assessment of the lifting of policy’s impact on public sentiment.
We observed that there was a significant discontinuity in the UGS regulation capability before and after the lifting of the zero-COVID policy (Figure 4). The emotional difference in the ZcPd was significantly higher than the other two stages, with UGS’ emotional regulation capacity consistently increasing throughout the ZcPd. The ability demonstrates a continuously increasing trend, but this trend weakens in the ZcTr after the policy was implemented, and the emotional difference begins to decline, indicating that the emotional regulation ability of UGS is affected as the policy changes. The sentiment difference further narrowed in the ZcLt, suggesting that UGS were no longer equally essential for regulating emotions as they had been during the pandemic. According to the results, the lifting of zero-COVID policy had a discontinuity value of −0.044 (95% CI, (−0.050 to −0.038)) and a significance level of p < 0.001, indicating a noteworthy influence of the policy adjustment on sentiment regulation capacity for UGS.
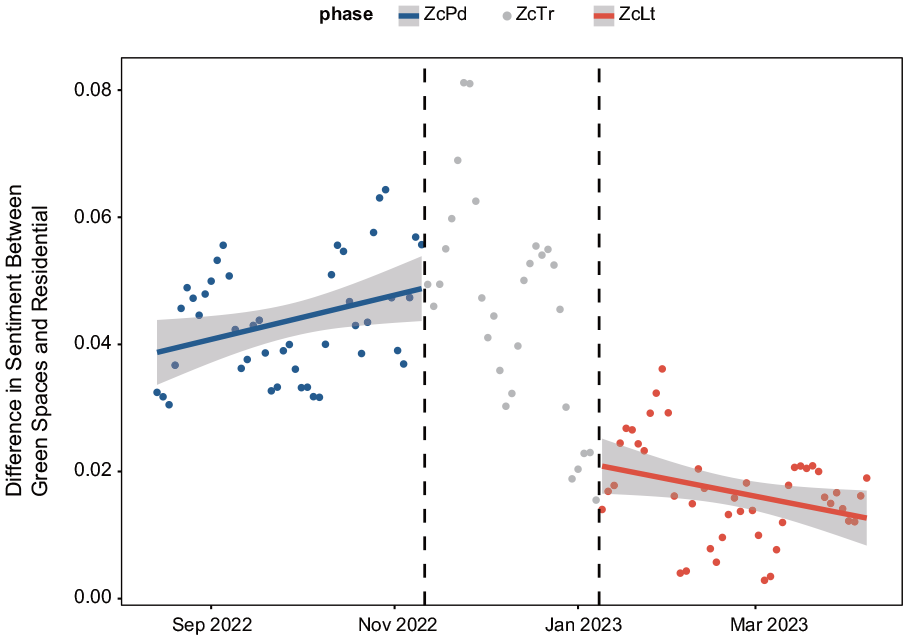
Regulation capacity of urban green spaces compared to residential areas. The figure shows the regulation capacity of green spaces in three policy phases (ZcPd: blue, ZcTr: gray, ZcLt: red). The blue, gray, and red dots represent the sentiment trend within each phase, respectively. The black dashed line marks the policy implementation cutoff, and the sentiment values between the cutoffs, directly affected by the policy intervention, were excluded from the RDD analysis. The discontinuity effect is −0.044, with a significance level of p < 0.001.
To illustrate the pattern of sentiment change in UGS across provinces, we show the results of the analysis for representative provinces with significant breakpoint effects (Figure 5). This leads to the conclusion that the policy change affected 69% of the provinces with a significance level of p < 0.05 and exhibited heterogeneity (see Table 1 for results for all provinces). The result shows that the UGS regulation capacity diminished the most compared to the ZcPd in Beijing (coefficient = −0.095; 95% CI, (−0.114, −0.077)), Guangdong (coefficient = −0.09; 95% CI, (−0.122, −0.058)), Hubei (coefficient = −0.081; 95% CI, (−0.107, −0.054)), and Hebei (coefficient = −0.079; 95% CI, (−0.121, −0.036)), but for some provinces, the regulation capacity of the UGS instead showed a continuing trend of enhancement, such as Heilongjiang (coefficient = 0.168; 95% CI, (0.088, 0.247)), Shanxi (coefficient = 0.149; 95% CI, (0.072, 0.227)), Ningxia (coefficient = 0.116; 95% CI, (0.068, 0.164)), and Guangxi (coefficient = 0.092; 95% CI, (0.074, 0.110)).
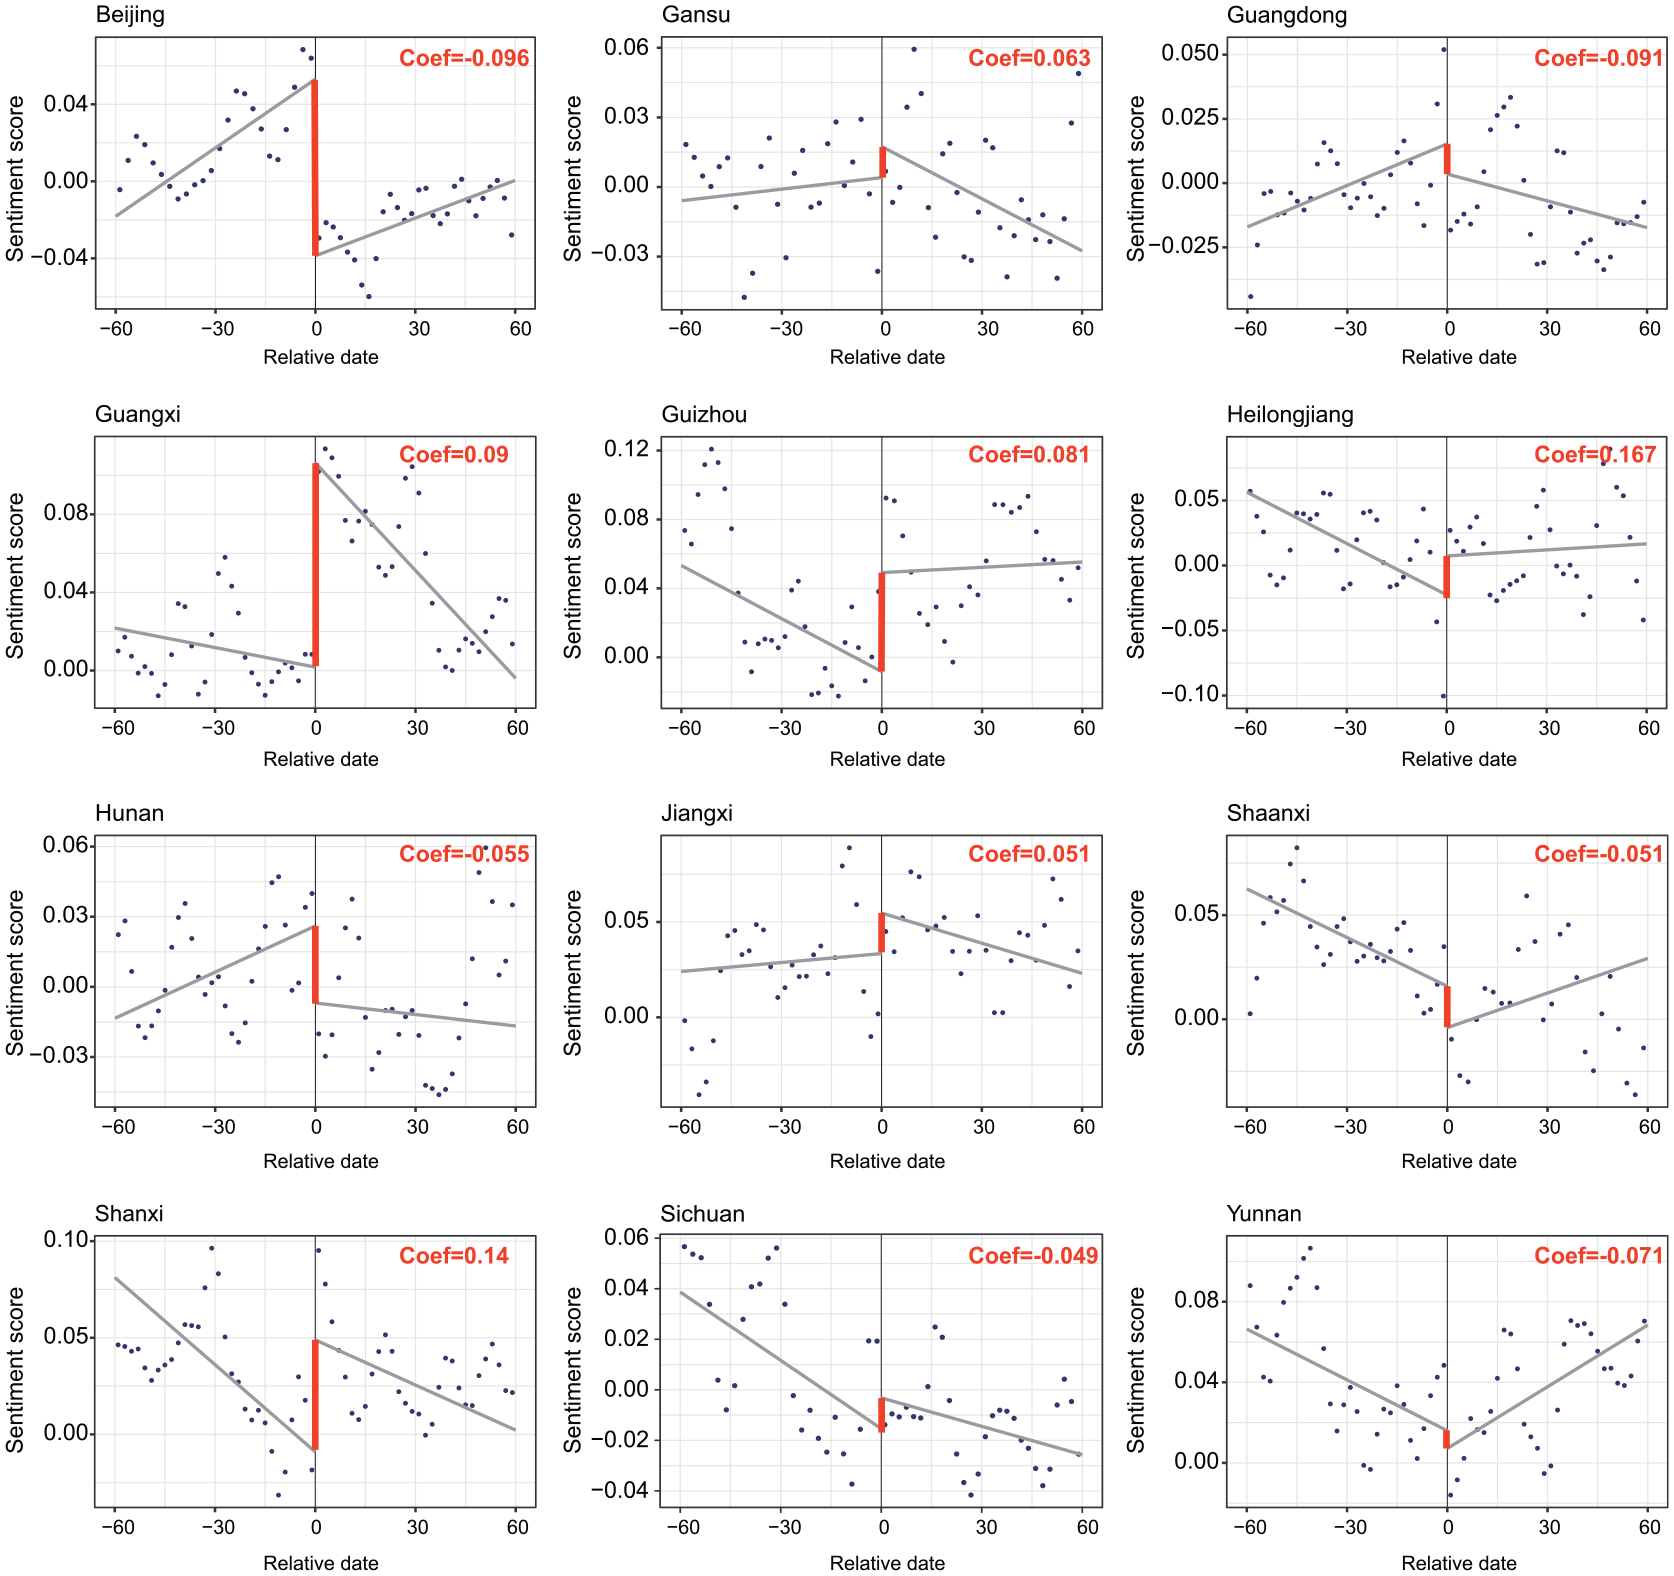
Regulation capacity of green spaces in representative provinces based on regression discontinuity design. The sample includes data from each province covering 60 days before and after the lifting of zero-COVID policy. Blue dots represent the sentiment scores smoothed by STL decomposition, while the red line shows the result of local linear fitting using triangular weights on both sides of the cutoff. The estimation of coefficient based on RDD regression for all displayed provinces meets the significance level of p < 0.001.
Regression discontinuity regression results for all provinces: differences of sentiment score between UGS and residential areas (day-of-week fixed effect).
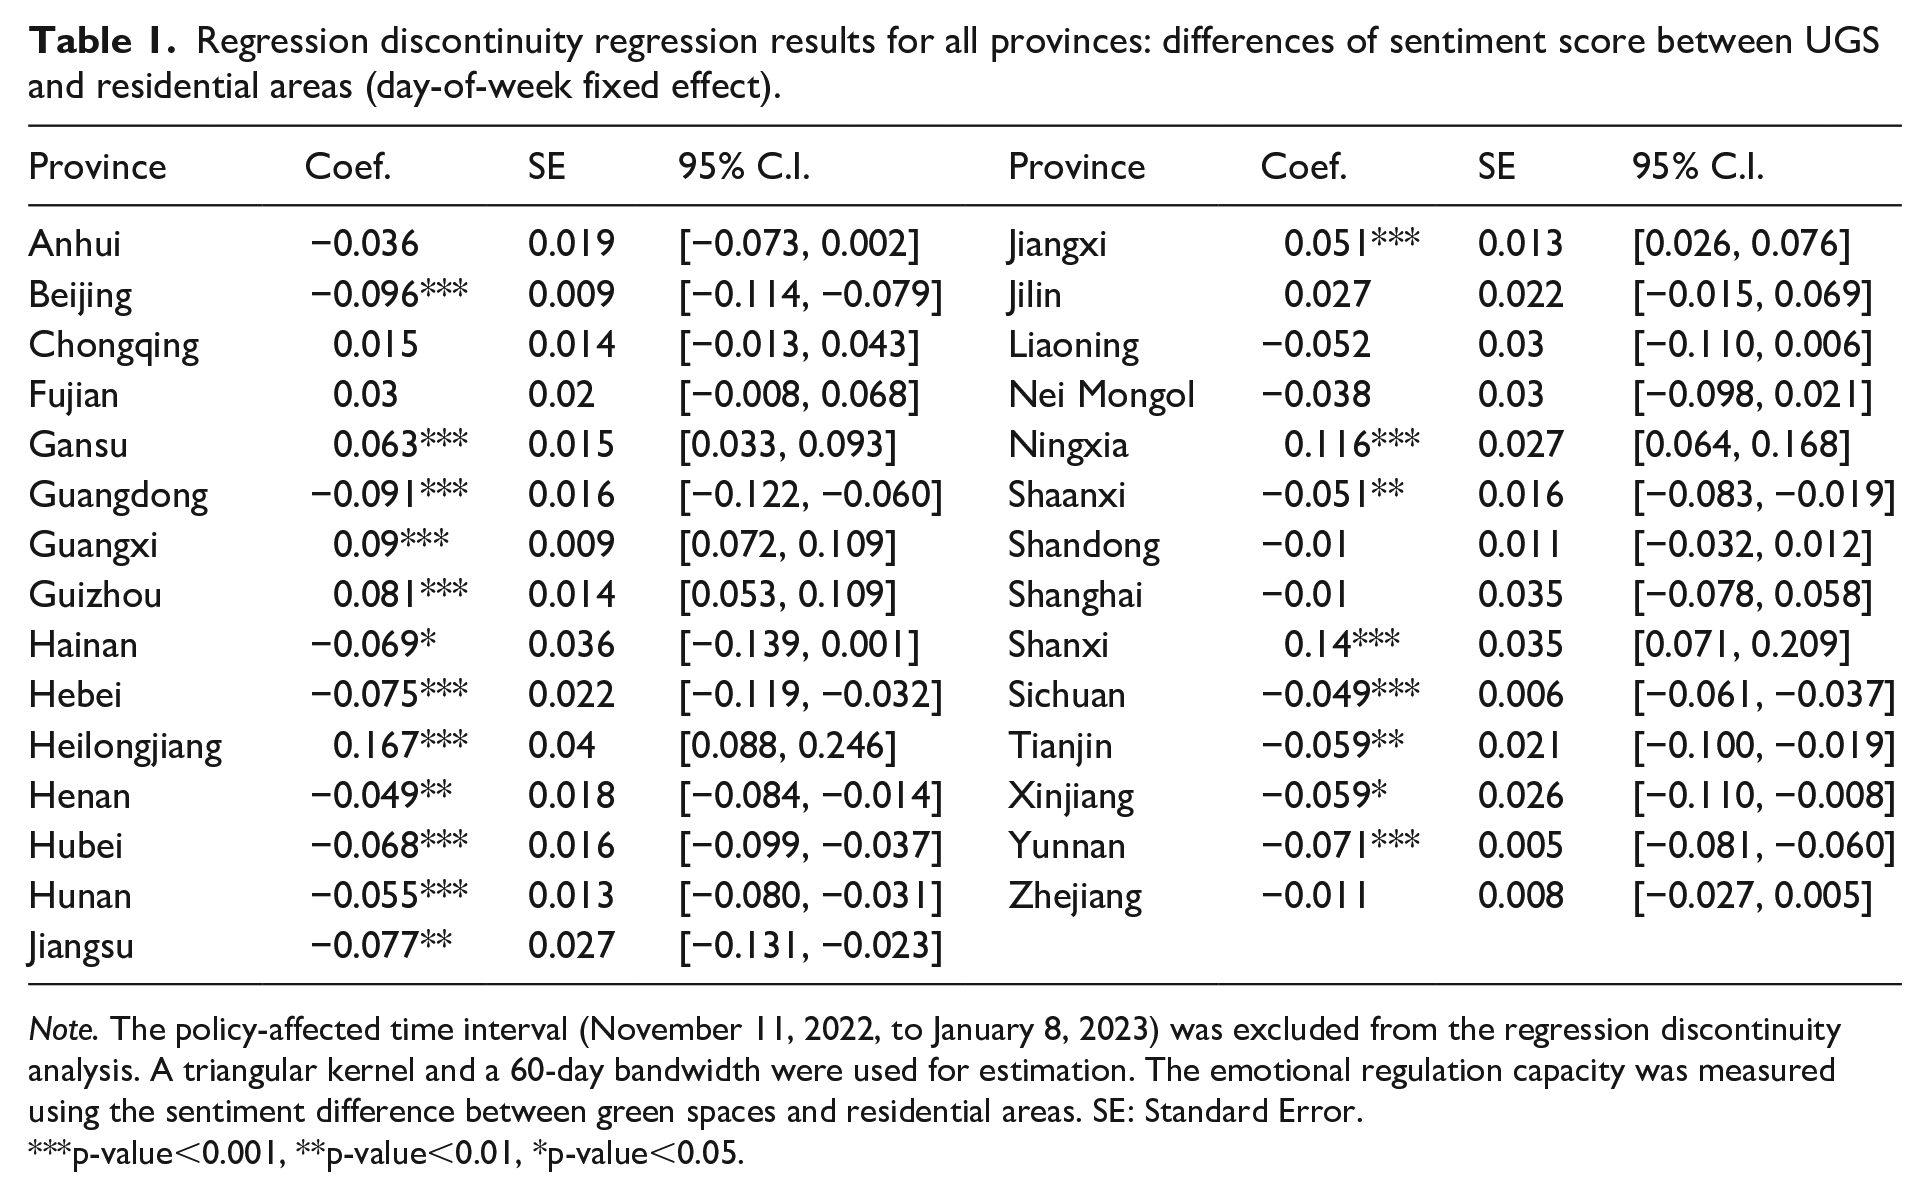
Note. The policy-affected time interval (November 11, 2022, to January 8, 2023) was excluded from the regression discontinuity analysis. A triangular kernel and a 60-day bandwidth were used for estimation. The emotional regulation capacity was measured using the sentiment difference between green spaces and residential areas. SE: Standard Error.
p-value<0.001, **p-value<0.01, *p-value<0.05.
Heterogeneity analysis of green space regulation capacity
In a discussion of population heterogeneity (Table 2), there is a significant difference in the regulation capacity of UGS between males and females. UGS demonstrate a more significant regulation capacity for females (coefficient = −0.088; 95% CI, (−0.115, −0.061)), implying that interaction with nature helped females’ moderate negative feelings more effectively. The effect of education level on emotional regulation was equally significant. The group with higher education showed a lower discontinuity value (coefficient = −0.057; 95% CI, (−0.076, −0.039)), suggesting that younger people may be more adaptable to policy changes and modify their emotional responses over time. Furthermore, identified substantial policy impact effects for two age groups: 18–22 (coefficient = −0.096; 95% CI, (−0.127, −0.064)) and 33–40 (coefficient = −0.054; 95% CI, (−0.087, −0.022)).
Emotional regulation capacity of different category of UGS for different groups.
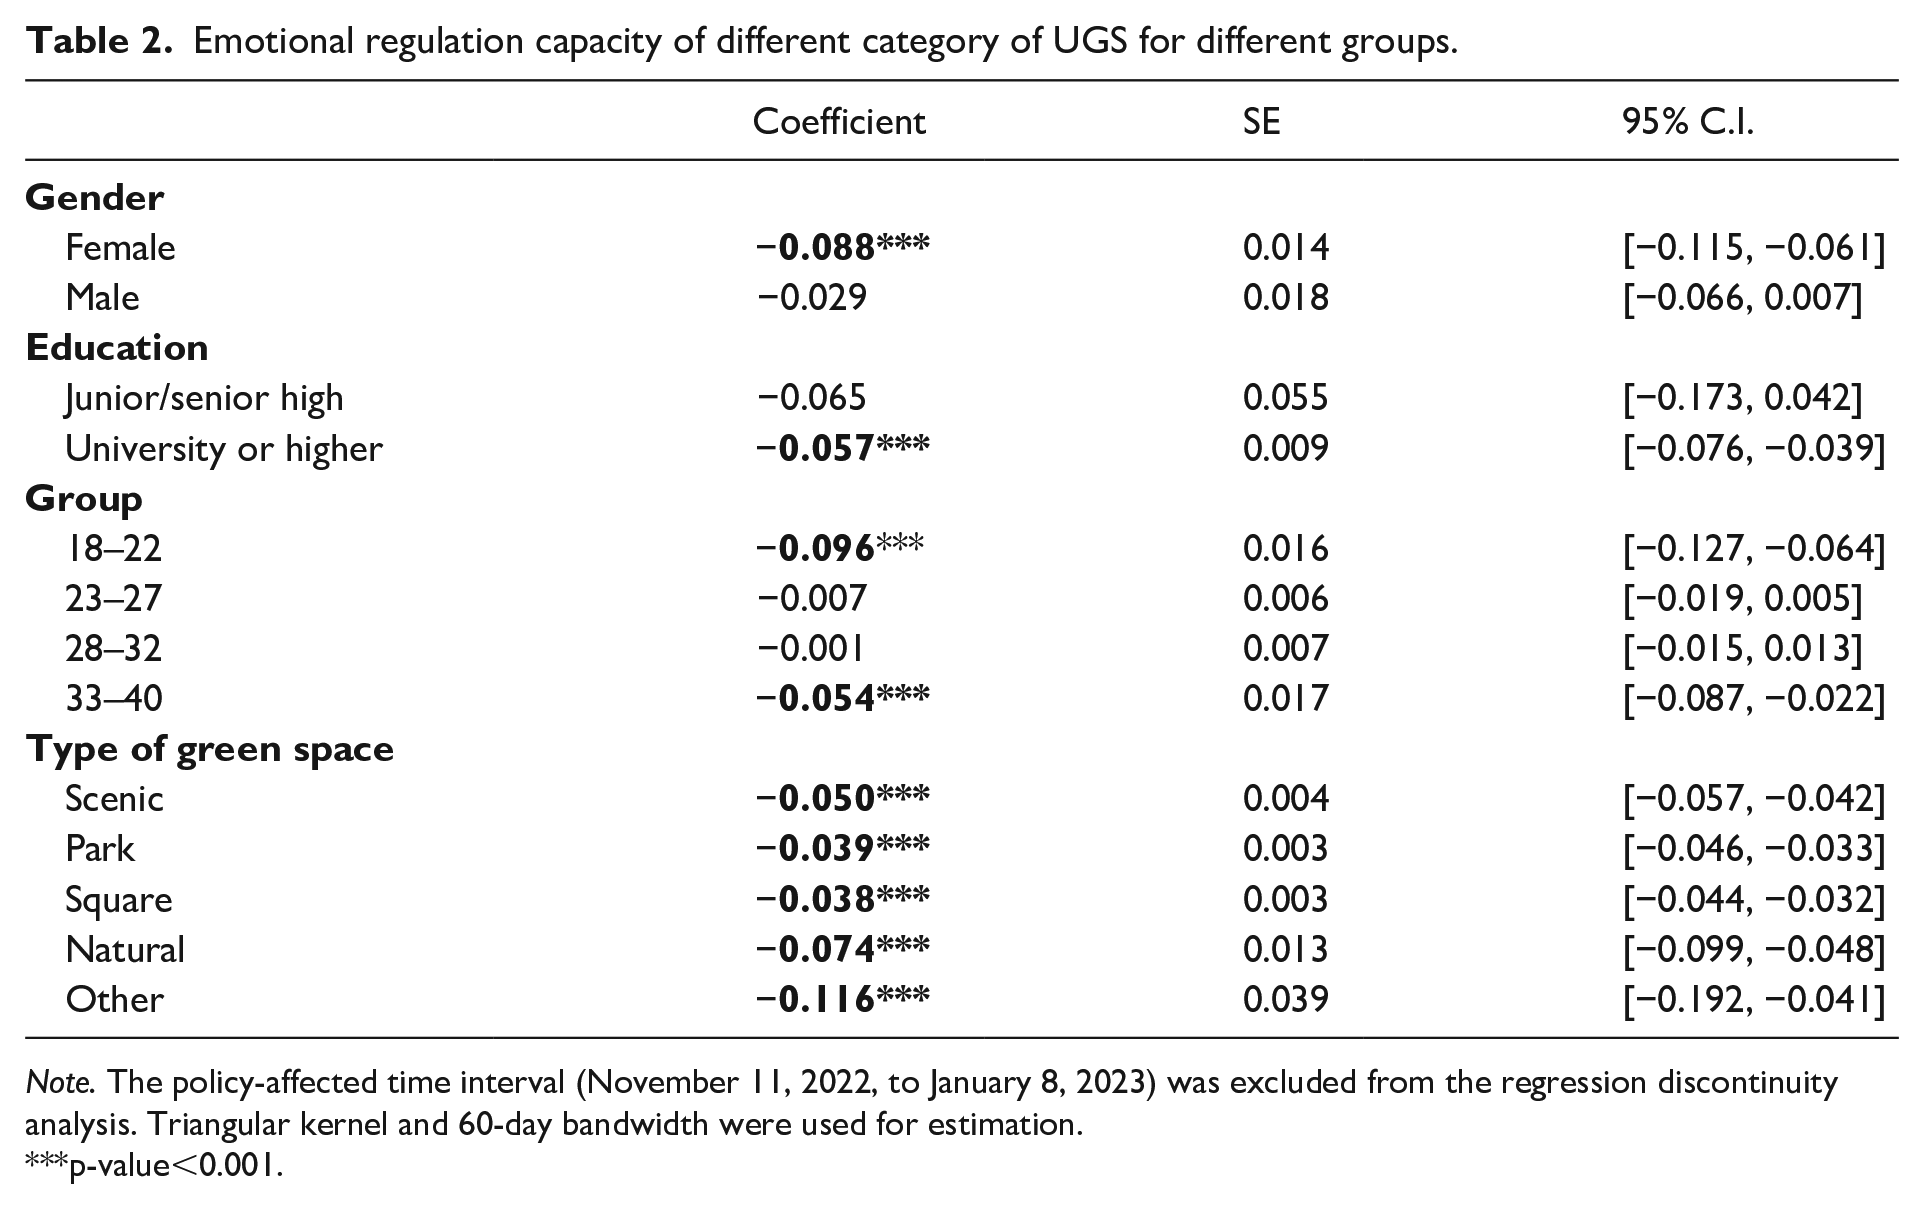
Note. The policy-affected time interval (November 11, 2022, to January 8, 2023) was excluded from the regression discontinuity analysis. Triangular kernel and 60-day bandwidth were used for estimation.
p-value<0.001.
The regression discontinuity effects were all significantly correlated for five types of UGS. Among them, natural green spaces and other green spaces had greater regulation capacity during the ZcPd. This could be the result of larger spaces holding more greenery or the fact that big parks are typically located outside of cities, providing a more immersive natural experience. Additionally, these areas offered safer spaces for socially isolated activities throughout the pandemic. The weakest regulation capacity was found in square green spaces, which is probably because they have less green cover than other types of green spaces.
Discussion
This study used NLP techniques to evaluate the sentiment analysis and sentiment classifications of Weibo posts, revealing the impact of the lifting of the zero-COVID policy on public sentiment. Our research reinforces the evidence base for the emotional benefits of UGS exposure, demonstrating that these positive effects were more pronounced during the pandemic. The findings can better inform adjustments to public health policies or urban park planning to maximize urban safety and well-being.
Our research demonstrates that policy changes have a considerable impact on both the quantity of posts and the sentiment value at the national level, with UGS playing a major mediating role in emotion regulation. When comparing the number of posts to the baseline, the national UGS posts count saw a sharp drop followed by a quick recovery during the ZcTr, reaching its lowest point of UGS visits around December 22, 2022. This phenomenon can be attributed to the rapid spread of the virus following the sudden lifting of the zero-COVID policy. Additionally, the observed lowest value is consistent with predictions by Goldberg et al. (2023), which indicated that the nationwide pandemic would peak on December 23. This expands on the broader utilization of social media data, which has been shown to have major potential for tracking illness trends, precisely estimating the number of individuals afflicted, or detecting high-risk regions (Alessa and Faezipour, 2018; Qin et al., 2020; Shen et al., 2020).
According to the sentiment expressed on Weibo, there was a noteworthy distinction between people’s sentiments in residential areas and those of UGS nationwide. This suggests that visits to UGS are associated with more positive emotional outcomes, especially during the zero-COVID policy period, where this disparity became more noticeable. It indicates that individuals derived greater emotional regulation from UGS during this time. This shows that UGS offered persistent emotional regulation throughout the protracted pandemic, extending the existing short-term research on the effect of COVID-19 on UGS visitation and emotional well-being (Cheng et al., 2021; Lu et al., 2021).
By further analyzing the categories of emotions in the posts, we found differences in the emotions people expressed in UGS and residential areas. UGS showed a clear positive regulatory effect on public emotions throughout the study period, with this effect becoming greater during holidays. This correlation is strongly linked to an increase in travel and activity during these times. Additionally, this trend is more pronounced during the ZcLt, where individuals tend to express greater feelings of “surprise” or “happy” while in UGS. In contrast, the policy had a more direct impact on the emotions of posts shared in residential areas, with a surge in sad, fear, and angry sentiment during ZcTr, which may stem from the surge in infection that occurs with the sudden lifting of the policy and the emergence of public uncertainty and concern about health, social security, and medical facilities (Wang et al., 2024a).
To further quantify the differences in emotional regulation provided by UGS, we conducted a heterogeneity analysis using the RDiT model at the national level, across different provinces, populations, and types of green spaces. The nationwide empirical findings demonstrated a substantial regulation effect of UGS during ZcPd, and the causal relationship was identified with the elimination of other confounders and cyclical effects. Moreover, there is a notable variation in the regulatory effect of UGS among provinces. After the policy is completely lifted, some border provinces and developing regions continue to benefit from UGS, while some developed provinces see a decline in the regulation potential of UGS. We hypothesize that less developed regions may have implemented harsher closure policies during ZcPd due to the lack of medical and human resources (Mu et al., 2023), resulting in a longer time for emotional recovery. Additionally, disparities in UGS provision between less-developed and developed areas also contribute to this difference (Wu and Kim, 2021). Developed regions typically have a more balanced distribution and abundant supply of UGS, which may allow them to rapidly ease negative emotions. After incorporating monthly NDVI data as a control variable into the experiment, the results remained robust. One possible explanation is that provincial-level seasonal fluctuations in green coverage appear to have limited effects on green space regulation capacity estimation within the RDiT framework. Additionally, the relatively short time interval of the RDiT experiment may have limited the ability of NDVI, a long-term ecological variable, to capture sentiment changes. Future research could explore more finer-grained NDVI data, such as weekly or daily measurements, or investigate other dimensions of urban green space provision to further enrich insights in this area.
We examined the regulation impacts of several UGS types and discovered that scenic and natural green spaces had higher emotional regulation capacity, while square green spaces had the lowest. There are several suitable explanations for this difference. Scenic and natural green spaces are often located on the periphery of the city due to their greater occupancy of urban land, which is consistent with the findings that larger and further UGS from metropolitan centers provide better resilience (Sukhwal and Kankanhalli, 2022). Another possible explanation is that scenic and natural green spaces may have greater canopy coverage than square green spaces, which supports the finding that viewing more greenery reduces unpleasant emotions during lockdown (Zhao et al., 2024).
Furthermore, various groups respond differently to UGS in terms of emotion regulation capacity. According to several representative studies, vulnerable groups such as women, students, and unemployment face higher mental health risks during COVID-19 (Fancourt et al., 2021; González-Sanguino et al., 2020; Xiong et al., 2020). These groups’ emotional vulnerability may result from higher levels of personal stress, which in turn makes them inclined to frequent UGS for stress relief (Stigsdotter and Grahn, 2011). Our study expands on the conclusion that UGS during ZcPd had a particularly strong emotion-moderating effect on women and college students. For college students, who are more passionate about active lifestyles and socializing, the importance of UGS is more pronounced when the rest of the recreational facilities are inaccessible (Larson et al., 2022; Venter et al., 2020). However, we are more likely to assume that the highly educated and 33–40 groups’ sentiment fluctuations throughout the period are smaller, meaning that the lifting of the policy has a slight impact on their sentiment. One explanation could be that this group is more adaptable to social change and has a higher level of acceptance and awareness of policies. Another hypothesis is that because these groups are more economically and socially stable, which makes it possible for them to have better quality neighborhood green spaces, and greater exposure to the natural environment allows them to face lower mental health risks at particular periods (Spotswood et al., 2021).
In general, this study reveals the dynamics of public sentiment in the lifting of the zero-COVID policy through timely tracking and analysis of social media data using advanced NLP techniques. It is crucial to promptly monitor public opinion to oversee and modify public policy, particularly during public health emergencies. Through the integration of the RDiT model with the analysis of national long-series data, we can understand the relationship between policy modifications and UGS emotional regulation capacity. Multiple robustness tests prove the reliability of the findings (see Supplementary Tables 7 and 8), further revealing the long-term and complex impact on public sentiment, and the importance of UGS in regulating negative emotion is well understood.
Furthermore, our findings extend beyond macro-level national and provincial sentiment monitoring to examine individual disparities at the micro level. The integration of socioeconomic data from user profiles into the research facilitates a more focused discussion of differences. Ensuring disadvantaged groups have equitable access to UGS can be an effective way to mitigate negative emotions caused by the external environment, especially when the public is experiencing psychological stress. Given the fact that UGS has demonstrated an ability to regulate emotions during the ZcPd, which adds to their significance as a public health resource infrastructure, it is more important for urban planners and policymakers to tailor future UGS planning and management to the economic, demographic, and socio-cultural characteristics of the provinces themselves to enhance the resilience of the city.
However, the study had certain drawbacks. Firstly, the unequal distribution of UGS could have a direct impact on the representativeness of the raw post data. This could include the impact of socioeconomic level on the distribution of UGS between cities (Huang et al., 2022), variations in the distribution of UGS between urban and rural areas (Zhang et al., 2020), and variations in the access to UGS among social groups (Yu et al., 2023). All of these factors could lead to unequal access to posted data, which could potentially worsen the negative effects of the zero-COVID policy on particular regions or populations. In addition, there is significant imbalance in the group of Weibo users, which may lead to biased data collection, especially as the emotions of the younger generation are more likely to be collected. Meanwhile, Weibo’s limits may exclude posts about sensitive issues (Qin et al., 2017), resulting in an underestimation of the quantity of posts in specific emotion categories. Given the limits of data gathering, future studies could examine merging data from numerous social media sites as well as traditional offline data to create a balanced and complete data sample. Furthermore, the method used to determine sentiment at home has inherent limitations. While we identified residential locations based on POIs, we acknowledge that individuals may visit friends’ or relatives’ homes, particularly following the lifting of COVID-19 restrictions. This introduces potential inaccuracies in identifying true home locations. However, our main goal was to analyze sentiment differences at a broader spatial level—between residential areas and UGS—rather than to track individual movements. Despite these individual-level variations, the overall sentiment trends at the macro level remain robust.
In this study, we have only analyzed the classification of UGS and have not explored the specific characteristics of UGS in depth. This is mainly due to the greater difficulty in obtaining detailed attribute data for UGS in all study areas on a national scale. However, we propose that future research should focus on identifying the specific environmental characteristics of UGS that have the greatest impact on emotional well-being and whether these factors differ across cities. Conducting such explanatory studies would lay the scientific foundation for better UGS planning, ensuring equitable access for all citizens, especially during public health emergencies. This would also contribute to increasing support for vulnerable populations (Xian et al., 2024).
Supplemental Material
sj-docx-1-tus-10.1177_27541231251338418 – Supplemental material for Visiting green spaces or stay-at-home: Emotional changes following the lifting of the zero-COVID policy
Supplemental material, sj-docx-1-tus-10.1177_27541231251338418 for Visiting green spaces or stay-at-home: Emotional changes following the lifting of the zero-COVID policy by Mei Meng, Kaixin Zhu and Jianghao Wang in Transactions in Urban Data, Science, and Technology
Supplemental Material
sj-eps-2-tus-10.1177_27541231251338418 – Supplemental material for Visiting green spaces or stay-at-home: Emotional changes following the lifting of the zero-COVID policy
Supplemental material, sj-eps-2-tus-10.1177_27541231251338418 for Visiting green spaces or stay-at-home: Emotional changes following the lifting of the zero-COVID policy by Mei Meng, Kaixin Zhu and Jianghao Wang in Transactions in Urban Data, Science, and Technology
Footnotes
Author contributions
J.W. and M.M. designed the project. K.Z. and M.M. collected and analyzed the data. J.W., M.M. and K.Z. interpreted the results. M.M., J.W. and K.Z. wrote the manuscript. J.W. supervised and edited the manuscript. All authors contributed to the development of the manuscript and approved the final version for publication.
Declaration of conflicting interests
The author(s) declared no potential conflicts of interest with respect to the research, authorship, and/or publication of this article.
Funding
The author(s) disclosed receipt of the following financial support for the research, authorship, and/or publication of this article: This work was supported by the National Natural Science Foundation of China (42222110).
Data availability
Data will be made available on request.
Code availability
Code will be made available on request.
Supplemental material
Supplemental material for this article is available online.
Author biographies
References
Supplementary Material
Please find the following supplemental material available below.
For Open Access articles published under a Creative Commons License, all supplemental material carries the same license as the article it is associated with.
For non-Open Access articles published, all supplemental material carries a non-exclusive license, and permission requests for re-use of supplemental material or any part of supplemental material shall be sent directly to the copyright owner as specified in the copyright notice associated with the article.