
Abstract
The Word2Vec model, originally developed for natural language processing, has been widely used to encode geographical locations such that embedded spatial information can be incorporated into machine learning and artificial intelligence models. These geo-embeddings of locations derived from human movement trajectories can capture the unique roles of locations in facilitating our everyday lives. However, most studies utilize the derived geo-embeddings for downstream tasks, while only a few studies have interpreted geo-embeddings using intrinsic approaches and explored their implications explicitly. Our study addresses this gap by evaluating whether the geo-embeddings generated by human movement trajectories can characterize the interconnectivity among locations, and how such knowledge can be further discerned from spatially explicit perspectives such as distance and spatial interaction flows. We develop an evaluation framework that considers two location representations and multiple (dis)similarity metrics regarding mobility flow patterns to examine the effectiveness of geo-embeddings in capturing spatially explicit knowledge. Large-scale mobile positioning data collected in the Twin Cities metropolitan area, Minnesota, U.S. is used as a case study to generate geo-embeddings for census tracts. Results suggest that the Word2Vec geo-embeddings can capture the distance decay effect of location interactions and spatial structure of sociodemographics. The spatial distribution of sociodemographic semantics derived from geo-embedding displays a similar pattern to the census income and race data. Moreover, the geo-embeddings can facilitate meaningful learning outcomes for enhanced community and sociodemographic studies.
Introduction
In geography, location and place are two tightly related concepts (Tuan, 1979). While a location commonly refers to the spatial coordinates of a specific point or geographical entity on the Earth, the concept of place delves deeper into the rich geographical contexts at these locations. Specifically, a place can be defined by its physical geographical features, cultural elements, historical background, and other human-environment characteristics. This definition aligns well with how people recognize a specific place and can guide informed and effective location-based services, community development, and other practices.
In the context of accelerated globalization and ever-increased mobility levels, the independent, fixed, and local perspective to understand places starts to be challenged. For example, Massey (2008) states that places are intricately connected to global processes, and the sense of place is shaped by economic, cultural, social, and political interactions brought about by the flow of population, goods, and information. In response, recent studies have started to collect and analyze movement trajectory data to uncover human mobility patterns (Alessandretti et al., 2020; Barbosa et al., 2018; Gonzalez et al., 2008; Schläpfer et al., 2021; Wang and Zhu, 2024) and explore places (Andrienko et al., 2012; Chen and Poorthuis, 2021; D. Zhu et al., 2020).
With the rapid development of machine learning and artificial intelligence models, various methods have been applied to encode location data in a hidden embedding space so spatial information can be incorporated into learning models (Mai et al., 2022). One such model is the Word2Vec model, which can capture the roles of geographical location in facilitating people’s everyday trips and activity participation and represent locational characteristics using POIs along movement trajectories and other types of movement data (Feng et al., 2017; M. Zhu et al., 2019). The basic idea is to treat each movement trajectory as a sentence, in which each word corresponds to a location along the trajectory. In such a way, we can put any location in the context of all trajectories passing it and interpret locations like we interpret words in sentences and paragraphs.
However, most studies are designed to use the embeddings of geographic locations, or geo-embeddings, for downstream tasks such as community detection and land cover classification. Few studies have attempted to explicitly interpret the spatial knowledge within these geo-embeddings. This paper aims to fill this gap by applying the Word2Vec model to derive embeddings of locations along movement trajectories and examining whether locations with more similar embeddings are closer to each other in the geographic space. The next section briefly reviews the Word2Vec model and how it is developed and situated in the context of geospatial data. This is followed by an introduction to the study area and movement trajectory data. We then illustrate our methods to derive and interpret geo-embeddings in detail. The next section presents comparison results visually and statistically. A final section summarizes the findings and identifies future research needs.
Literature review
Word2Vec
Developed in 2013, the Word2Vec model has been widely adopted in natural language processing (NLP) applications (Mikolov et al., 2013). The model utilizes a shallow neural network to map words into a low-dimensional vector space based on their context information extracted from a large text corpus. A given word’s context is determined by its surrounding words, typically identified using a fixed-size sliding window that traverses the text and records word co-occurrences. Words with similar context information are mapped to nearby points in the latent space.
By focusing on local co-occurrences of words, Word2Vec effectively captures semantic relationships, enabling it to represent words in a way that reflects their meanings and associations. Compared to earlier methods like one-hot encoding, Word2Vec generates dense, low-dimensional vector representations that encapsulate meaningful relationships among words. Hence these embeddings can facilitate various NLP tasks like word similarity measurement and other downstream applications. The pioneer model has two variants: the continuous bag of words (CBOW) and skip-grams (SG). While CBOW predicts a target word based on its surrounding context words, SG predicts context words given a target word.
The introduction of Word2Vec marked a significant milestone in the evolution of language models, bridging the gap between traditional statistical methods and modern deep-learning approaches. Compared to statistical models like n-grams (Cavnar et al., 1994) and machine learning methods such as hidden Markov models (Knill and Young, 1997), Word2Vec demonstrated the effectiveness of neural networks in efficiently capturing semantic information. Although its static representations are less capable than later models that introduced dynamic embeddings like GloVe (Pennington et al., 2014), ELMo (Peters et al., 2018), and BERT (Devlin et al., 2019), Word2Vec played a foundational role in the development of neural embeddings, paving the way for more sophisticated contextual word embeddings.
Word2Vec with spatial data
The Word2Vec model can capture rich semantic information and obtain word embedding in vector form that can be easily taken as input for follow-up analysis and learning tasks. The Word2Vec model has therefore drawn attention from domains beyond natural language processing. In geography, recent studies have applied Word2Vec models to process spatial data, embed locations into latent space, discover geo-semantic knowledge, and solve location-based problems. This section focuses on past studies that explore the geo-embedding of places or locations derived from spatial data rather than the embedding of place names learned from textual corpora (Gurnee and Tegmark, 2023; Karimi et al., 2022). A key challenge in adapting the Word2Vec model for spatial data is defining context information that effectively captures spatial dependencies and interactions among locations. This section summarizes two primary approaches to constructing spatial contexts, highlighting input corpora, methodologies, and applications.
The first approach to constructing spatial context is based on static spatial proximity between locations. The approach often utilizes Points of Interest (POIs) and similar location data that include place types and geographic coordinates. A typical way is to treat each unique POI type (e.g., school, dining) as a unique word and define its context using either the k-nearest POIs or those within a specific distance (Liu et al., 2019; Yan et al., 2017). Expanding beyond binary spatial proximity, some studies have introduced weighted contexts by incorporating distance-based decay functions, human activity frequencies, or spatial variations to optimize the choice k or distance thresholds for more precise context representation (Yan et al., 2017). Other studies have extended this framework by treating point-based POIs as words and polygons (e.g., traffic analysis zones (TAZ)) as documents and connecting POIs within a polygon using the shortest path to construct spatial contexts (Yao et al., 2017). Once vector representations of individual POIs are obtained, the vector representation of a TAZ (or other types of polygons) can be derived by averaging the vectors of all POIs within that area, enabling polygon-based spatial analysis. The Word2Vec model trained on POI and similar location data has been applied to various domains, including characterizing POI types (Silva et al., 2023), identifying urban functional regions (Hu et al., 2020; Yang et al., 2023; Yao, Zhu, et al., 2023; Zhai et al., 2019), recommending places (Yang-yang et al., 2022; Zhao et al., 2017), and comparing spatial patterns of POIs across cities (Liu et al., 2019).
The second approach to constructing spatial contexts extends beyond static spatial proximity by incorporating dynamic human movements, often represented through location trajectory data. The call detailed records (CDR) data is one of the most commonly used trajectory data, which tracks the sequential locations of the nearest cellular stations as a user accesses mobile services. Drawing an analogy to natural language processing, Li et al. (2019) view each base station as a word, each movement trajectory as a sentence consisting of word sequences, and all trajectories as the training corpus for the Word2Vec model. Once base stations are represented as vectors, the pairwise cosine distances are calculated and used as inputs for clustering algorithms to identify regions of base stations with strong spatial interactions implied by human movements. Their findings demonstrate that this method effectively captures trajectory structures while being computationally efficient, flexible, and scalable for larger trajectory datasets. Beyond regionalization, Word2Vec models trained with CDR data have also been employed for classifying urban land use (Zhang et al., 2021) and predicting a smartphone user’s next location (Yao, Guo, et al., 2023). Besides CDR data, various other types of location trajectory data have been utilized for the Word2Vec model in different applications. Examples include using taxi trajectories to classify urban functions of road segments (Hu et al., 2021, 2023), travel diaries with GPS tracking data to predict participants’ demographic information (Solomon et al., 2018), and migration trajectories of scientists to uncover latent structural patterns in scientific mobility (Murray et al., 2023). Despite the diversity of data types and application domains in these studies, the context of a location is consistently determined by the locations preceding and following it along movement trajectories. As a result, the generated geo-embeddings capture spatial relationships that extend beyond the static spatial proximity. This dynamic context enables a more comprehensive representation of spatial interactions, reflecting unique mobility patterns specific to a given geographical region.
Interpretation and evaluation of (geo-)embeddings
The embeddings generated by Word2Vec have demonstrated strong performance in various downstream tasks. However, directly visualizing and interpreting these vectors remains challenging. The difficulty arises because the latent space often consists of a large number of dimensions where each dimension lacks a direct correspondence to interpretable measures such as word lengths or spatial distances. Hence assessing the effectiveness of these embeddings in capturing the original features of words or locations requires additional techniques, such as dimensionality reduction and interpretability analysis.
In natural language processing, studies often leverage linguistic knowledge to interpret the word vectors generated by Word2Vec. A common way is to reduce the dimensionality of these vectors to two or three dimensions, enabling visualization with corresponding word labels (Smilkov et al., 2016). This visualization allows for an intuitive examination of whether the relative positions of vectors in the embedding space reflect semantic relationships, such as the proximity of synonyms and the separation of antonyms. Two widely used techniques for dimensionality reductions are Principal Component Analysis (Wold et al., 1987) and t-distributed stochastic neighbor embedding (Van der Maaten and Hinton, 2008).
In addition to visual exploratory analysis, statistical indicators are also used to interpret and evaluate the generated embedding in either intrinsic or extrinsic ways (Schnabel et al., 2015). The intrinsic way measures how well the original inputs and generated vectors are in accordance with each other based on features such as relatedness, analogy, categorization, and selection preference. For example, relatedness measures the Spearman or Pearson correlation between the similarity of vectors and human judgments on how similar the two words are. There are a few existing datasets that store word similarities manually labeled by humans for this task, including Simlex-999 (Hill et al., 2015) and WordSim-353 (Finkelstein et al., 2001). Another example feature is analogy reasoning, which attempts to find x based on the relationship “a is to b, as x is to c” (Mikolov et al., 2013). For example, “Berlin is to Germany, as Paris is to France.” for the relationship between a country and its capital city. Compared to the intrinsic way focusing on features of the generated vectors, the extrinsic way evaluates the effectiveness of the generated vectors in downstream tasks, such as accuracy in text classification (Lilleberg et al., 2015).
Moreover, recent studies have started to interpret embeddings by explicitly verifying the relationship between the concrete semantics of words and their vector representation derived from language models. One such framework defines poles of a semantic axis using pairs of opposite words and analytically positions other words along this axis, with their relative locations indicating the degree to which they exhibit a specific semantic property (An et al., 2018; Kozlowski et al., 2019). For example, if the semantic axis is defined by the poles “rich” and “poor”, other words can be placed along this axis by comparing their geo-embeddings with the embeddings of words “rich” and “poor” in the latent space, allowing researchers to infer the relative wealth-related meaning of each word. This approach provides a concise yet effective way to map high-dimensional word vectors onto interpretable semantic dimensions relevant to specific research questions. A second approach, known as probing, has become a key technique for interpreting and analyzing deep neural network models in natural language processing (Alain, 2016; Belinkov, 2022). This method applies a simple predictive model to the activations of a neural network to estimate certain linguistic or spatial properties. For example, studies have trained linear regression probes to predict spatial coordinates from the vector representation of place names (Gurnee and Tegmark, 2023). Notably, high predictive performance on out-of-sample data suggests that embeddings obtained from language models may decode specific semantic information, further demonstrating their interpretability and potential applications.
While processing geospatial data, only a limited number of studies have evaluated geo-embedding using intrinsic approaches to explore the implications of the generated vectors. Studies using POIs have assessed geo-embeddings’ quality by comparing them with manually labeled POI categories, examining whether Word2Vec embeddings can effectively capture categorical distinctions (Yan et al., 2017). Besides the categories of POIs, studies have also investigated whether embeddings preserve hierarchical structures among POIs evaluating their ability to reflect semantic and functional relationships within the urban environments (Yan et al., 2017). Unlike POI data, the original representations of locations along trajectories vary largely in form and scale, including geographic coordinates, grid-based representation, service areas of cellular base stations, administrative divisions, and census geographic units. Additionally, these location representations often lack explicit semantic labels like POI categories, making it challenging to apply intrinsic methods directly. To our knowledge, the only study that has attempted to interpret trajectory-based geo-embeddings in a structured manner focused on shared affiliation trajectories and scientific mobility of academics, rather than the movement trajectories of people in geographic space (Murray et al., 2023).
This study aims to address this gap in research on interpreting trajectory-based geo-embeddings. Specifically, we evaluate whether geo-embeddings derived from human mobility trajectories can effectively capture the connection between a given location and all other locations visited along people’s daily movements. To illustrate our approach, we present a case study that demonstrates our overall framework, followed by a detailed comparison and evaluation of the results in the subsequent sections.
Study area and data
The case study area in this research covers the Twin Cities metropolitan area and its surrounding regions in Minnesota, U.S., including 19 counties and 939 census tracts. The human mobility dataset is sourced from PlaceIQ and gathered through various mobile application publishers and software development kits (SDK). The dataset encapsulates 100,000 to 250,000 unique devices per day, predominantly mobile phones, which cover 3% to 5% of the total population across the study area. PlaceIQ data stores the event-based cluster of positioning data in the form of visits, each recording the unique device identifier, the geographic coordinates, and the Unix timestamp of the visit. Trip data collected by devices with at least one visit within the study area between April 13, 2021 and April 19, 2021 are used in this work to generate geo-embeddings, which includes 211,655 devices with 15,043,368 visits. Figure 1 presents visits per square kilometer across census tracts in the study area. The patterns align well with our expectation of more visits in urban than rural areas.
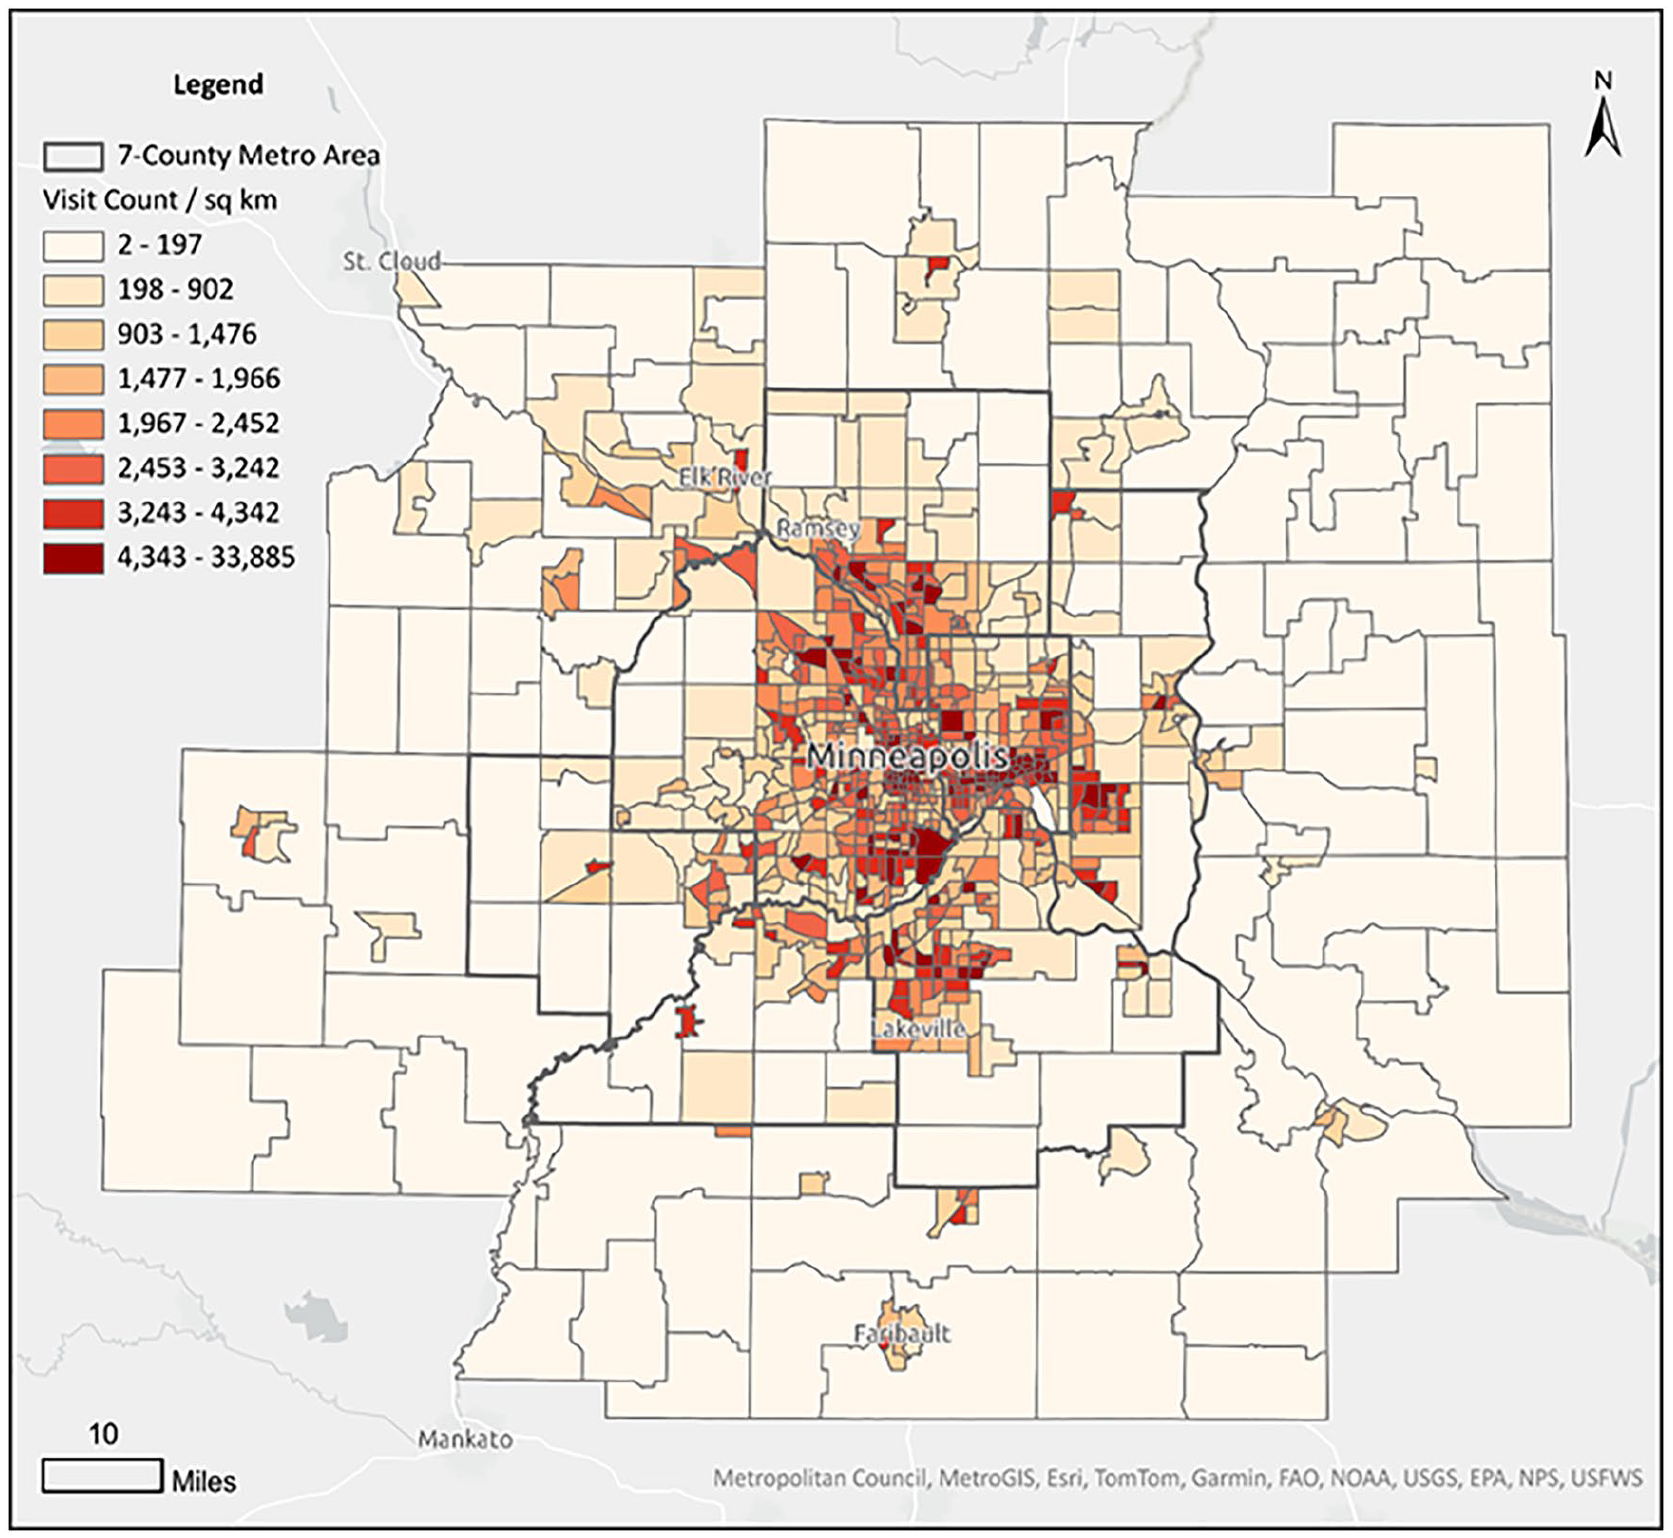
Number of visits across census tracts in the Twin Cities metropolitan area.
Methods
Figure 2 presents the framework and procedures to interpret trajectory-based geo-embeddings. To prepare the raw visitation data for the Word2Vec model and distance calculation, we first extract trips and visits to construct daily trajectories for each person (unique device) (Ma and Zhu, 2025). Then, we use census tracts as the geographic units to aggregate the spatial locations of visits, trip origins, and trip destinations. We chose census tracts as the spatial unit for this study because they are the smallest units with sufficient PlaceIQ records and easily accessible sociodemographic census data.
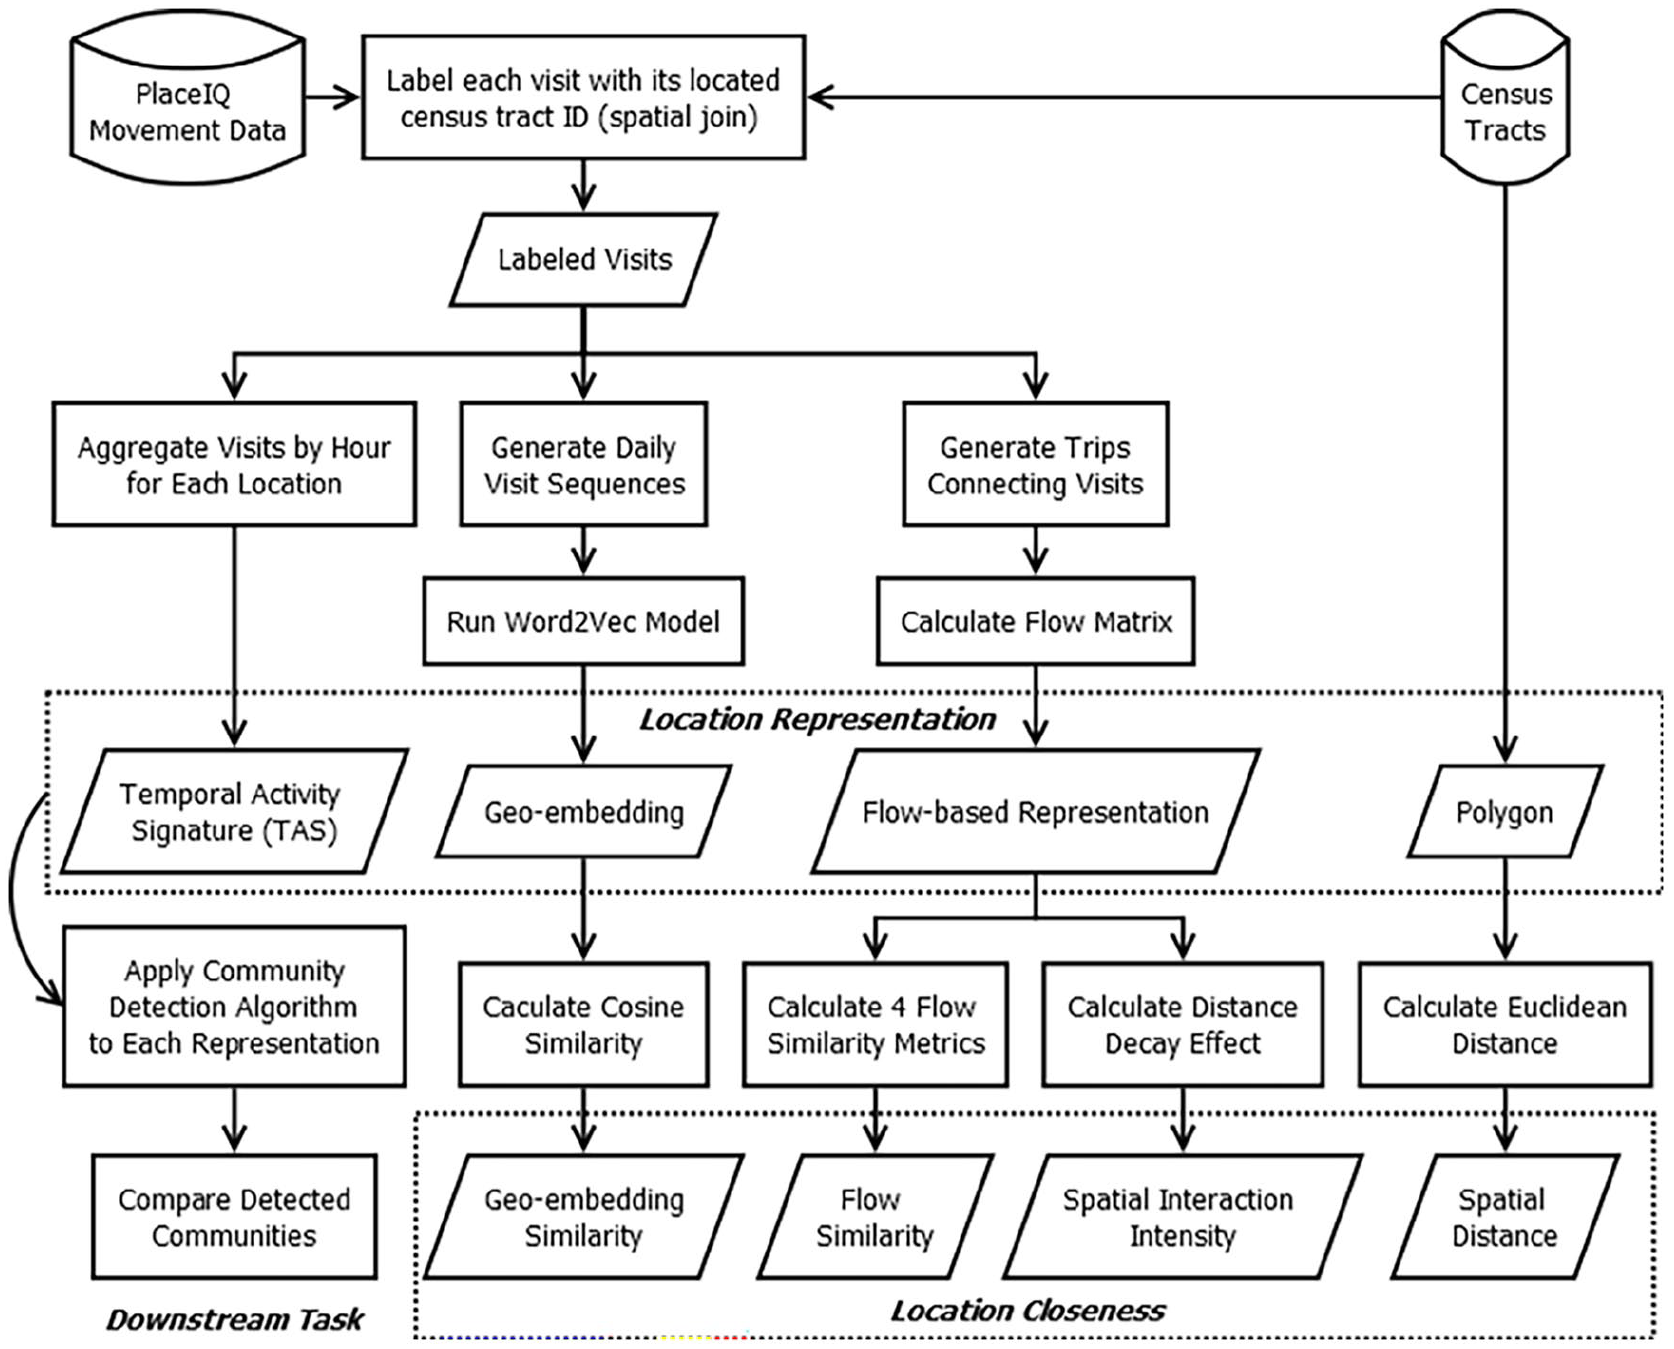
Framework to evaluate the effectiveness of geo-embeddings in evaluating location closeness.
To comprehensively evaluate whether geo-embeddings can capture the connections of locations along people’s daily trajectories, we calculate and consider several variants of location representations including the geo-embeddings and several metrics of (dis)similarity between two locations:
- First, we generate geo-embeddings of census tracts using the Word2Vec model and calculate the cosine similarity of each pair of geo-embeddings.
- Second, we consider the distance decay effect and create two metrics, the Euclidean distance and the spatial interaction intensity based on the gravity-based model of spatial interactions. The two metrics measure the distance (or spatial impedance) between each pair of census tracts.
- Third, we define the flow-based representation of each census tract based on all trips from it to other census tracts. We calculate four metrics widely used to compare the simulated and actual distribution of flows among locations. Using Spearman correlation coefficients, we compare each metric with the cosine similarity of geo-embeddings.
- Last, we derive temporal activity signatures (TAS) of census tracts based on the temporal profiles of all visitations within each census tract. Since census tracts with similar TASs are not necessarily close to each other, we do not directly compare TASs. Instead, we use the TASs of all census tracts as inputs for the downstream community detection task and compare the result with those using geo-embeddings and flow-based representation.
The rest of this section presents each of the above methods in detail.
Geo-embedding and cosine similarity
First, visits are grouped by the person (unique device) and calendar day. Therefore, each group corresponds to a daily trajectory that stores the ordered list of visited activity locations. We view each daily trajectory as a sentence and visits along it as words. Each visit is labeled by the identifier of the census tract in which it is located, so each daily trajectory is transformed into an ordered list of census tract IDs. This allows us to generate geo-embedding of each census tract in the context of daily trips and activities. In total, we obtain 1,164,350 sentences, which are then fed into the Word2Vec model to obtain the geo-embeddings of 939 census tracts.
To train a Word2Vec model on the location trajectory data from PlaceIQ, we use the existing algorithm implementation provided by the Python package gensim (Rehurek and Sojka, 2011). Based on previous studies, we set the dimensionality of the word vectors as 100, the maximum distance between the current and predicted word within a sentence as one, and the minimum frequency as 10 (Hu et al., 2021; Murray et al., 2023; Zhang et al., 2021). We adopt the cosine similarity to compare two embeddings in the same latent space based on their angular distance (Mikolov et al., 2013). The cosine similarity takes value from −1 to 1, with greater values indicating smaller angles between two vectors and hence more similar vectors.
Geo-embedding similarity and spatial interaction intensity
The cosine similarity between census tracts obtained by Word2Vec is abstract and difficult to interpret. Inspired by previous research (Murray et al., 2023), we compare the cosine similarity of two geo-embeddings with the spatial interactions between the corresponding census tracts to examine whether census tracts with more similar geo-embeddings have more interactions and are better connected. First, considering that census tracts closer together have less spatial impedance and higher interaction potentials, we calculate the Euclidean distance as the most common spatial distance used to study spatial interactions.
Second, considering that the Euclidean distance may not accurately reflect the actual spatial impedance, we derive the spatial interaction intensity to capture distance decay effects. We choose the gravity model which assumes that the flow between two locations is positively related to their mass and negatively related to their distance. Analytically, it can be defined as:
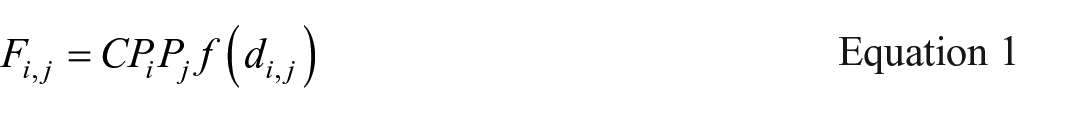
In this study,
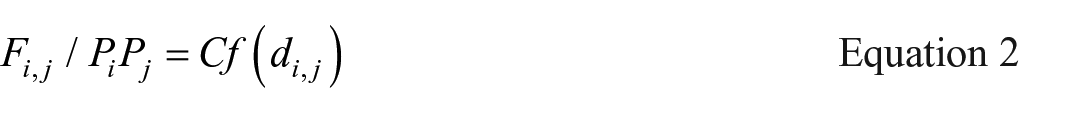
where
To compare the cosine similarity with the Euclidean distance and spatial interaction intensity, we computed Spearman correlation coefficients among them. A significant coefficient can indicate a strong linear relationship between two metrics, and we can use one metric to interpret the other. For instance, if the correlation coefficient between the Euclidean distance and cosine similarity is significantly negative, larger cosine similarity would have a shorter distance, which suggests that geo-embeddings can capture spatial distances between census tracts.
Geo-embedding and flow-based representations
The Word2Vec model obtains word embeddings based on the contextual semantics of the words in the training corpus. For words with similar contexts, their embeddings generated by Word2Vec will also be close to each other in the latent space. For trajectory data, when we set the training window as one, the contextual semantics of a location are locations with trips from or to that location. Therefore, locations with similar embeddings should have flow patterns similar to those of other locations. To confirm this intuition, we derive the flow-based representation of each census tract as a vector, in which each element corresponds to the total number of trips from the census tracts
To measure the similarity of flow-based representations, we adopt the common metric used to evaluate the performance of traffic flow generation models. Specifically, we calculate four metrics for each pair of census tracts
Temporal activity signature and community detection
In addition to the distances and volumes of flows among census tracts, we also consider the temporal distribution of flows across 24 hours of a day and derive each census tract’s temporal activity signature (TAS). Considering locations with similar TASs are not necessarily close to each other, we compare geo-embeddings and TASs by using them as inputs for the downstream learning tasks and comparing the learning results.
We choose community detection as the downstream learning task, which is the process of discovering intrinsically connected communities in a network (Fortunato, 2010). Specifically, we adopt the Louvain community discovery algorithm, a graph-based algorithm that aims to group nodes in the network into communities, so that nodes within each community are well-connected and relatively distant to nodes in other communities (Blondel et al., 2008). To achieve this goal, the Louvain algorithm aims to optimize the modularity of community division by measuring the density of edges within communities in relation to the density of edges among communities. The modularity typically takes values between −1 and 1. If the modularity equals zero, the network partition would be no better than what would be expected by random chance. A higher positive value suggests that the intra-community edge density is higher than expected by random chance and therefore a clear community structure. In contrast, a negative value is often interpreted as a lack of clear community structure.
To apply the Louvain algorithm, we treat each census tract as a node of the network and define the edge length as the cosine similarity of the vector-based representations of two census tracts. We consider three vector-based representations of census tracts: (1) the geo-embedding generated by the Word2Vec model, (2) the TAS calculated as the total number of visits within each hour of a day (Wu et al., 2020), and (3) the flow-based representation discussed in the next subsection. We apply the Louvain community discovery algorithm to three representations and compare their modularity to examine their performance regarding capturing connections among census tracts.
Geo-embedding and sociodemographic characteristics
This study applies the SemAxis method to investigate relationships between geo-embeddings of census tracts and their sociodemographic characteristics (An et al., 2018; Murray et al., 2023). Specifically, to assess whether geo-embeddings capture racial composition, we analyze the proportion of non-Hispanic whites across census tracts. Given
Compute the average vectors of the white-dominated census tracts
Compute the average vector for other-races-dominated census tracts
Define the semantic axis as the difference between these two average vectors:

Calculate the score of a census tract

A higher cosine similarity suggests a smaller angular distance between
To assess whether trajectory-based geo-embeddings capture racial composition information, we compute Spearman’s rank correlation coefficient between the semantic axis scores of all census tracts and their corresponding proportions of non-Hispanic whites from the census data. A significant Spearman’s correlation would indicate that trajectory-based geo-embeddings encode racial demographic patterns in the study area.
Beyond racial composition, this method can also be applied to examine the relationships between geo-embeddings and other sociodemographic characteristics such as median household income, as well as land use patterns including mixed land use and employment. Insights from these analyses can help determine how spatial mobility patterns reflect sociodemographic characteristics and land use structure.
Results and findings
Geo-embedding and spatial interaction intensity
After generating geo-embeddings of census tracts using the Word2Vec model, we first compare the cosine similarities of geo-embeddings with the Euclidean distances and spatial interaction intensity between corresponding census tracts (see ‘Geo-embedding and flow-based representations’). As presented in Table 1, for census tracts with more similar geo-embeddings, their spatial distance tends to be smaller and their spatial interaction intensity tends to be stronger. This suggests that the geo-embeddings generated by Word2Vec can capture the distance decay effect on spatial interactions among places. Specifically, for two geo-embeddings closer in the latent space, the corresponding two census tracts are closer to each other and have more trips between them compared to trips between them and other census tracts.
Spearman correlation coefficient among cosine distance, spatial distance, and spatial interaction intensity of the census tract.
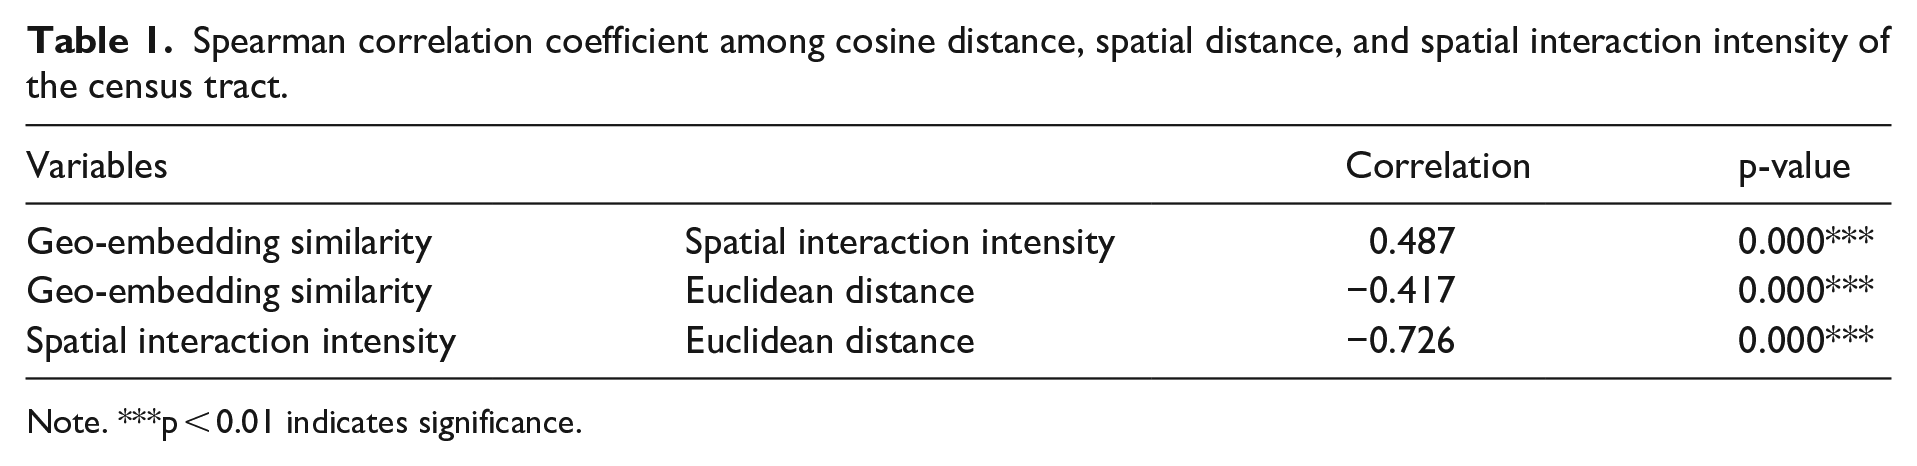
Note. ***p < 0.01 indicates significance.
Further, we visually compare the distributions of the three metrics using histograms. For easier comparisons, we adjust the original metric using the Min-Max scaler so they fall within the range of 0 to 1. In Figure 3, the univariate histograms along the diagonal present the distributions of three scaled metrics, and the other three subgraphs are bivariate histograms that present the joint frequency distributions of metric pairs. Visual comparisons are consistent with the Spearman correlation coefficient: the cosine similarity of two geo-embeddings is positively correlated with the spatial interaction intensity between the corresponding two census tracts and negatively correlated with the Euclidean distance between those two census tracts. Results in this section suggest that Word2Vec geo-embeddings can capture the level of interactions among census tracts very well.
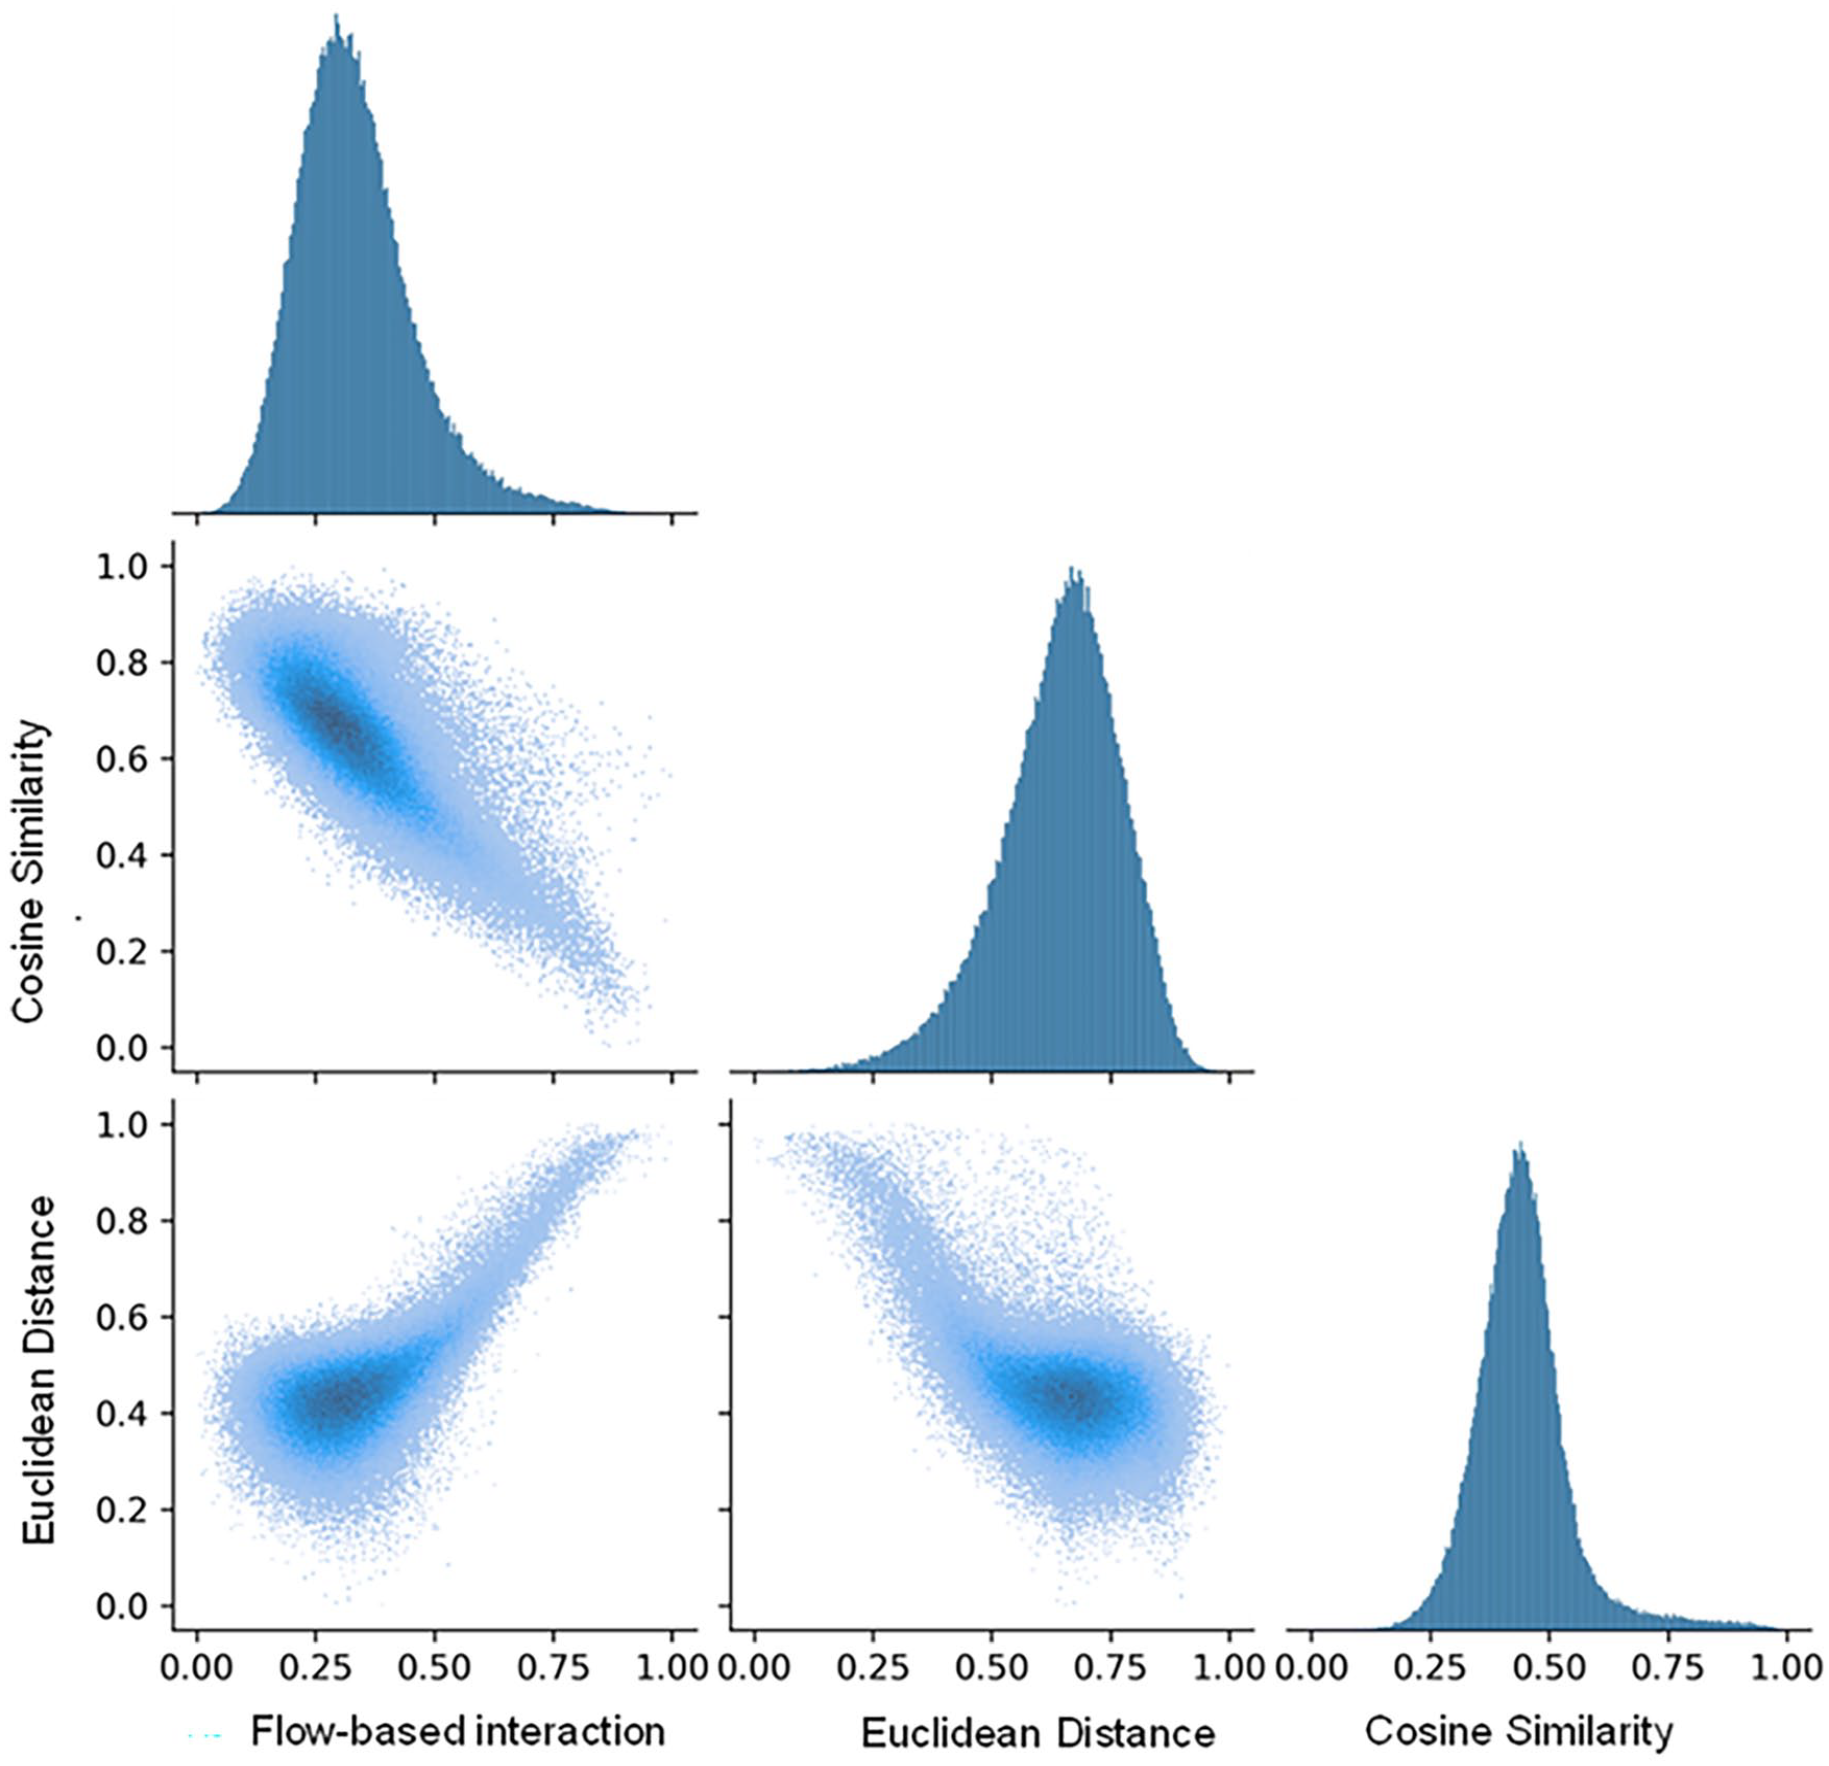
Frequency distributions of the geo-embedding similarities, Euclidean distances, and spatial interaction intensities between census tracts.
Besides statistically comparing the above three indicators between all pairs of census tracts, we select three representative census tracts and visually compare the geo-embedding similarities, Euclidean distances, and spatial interaction intensities between each selected census tract with all other census tracts in the study area. Each row in Table 2 presents the comparison results for one selected census tract, whose centroid is visualized as a red dot. Census tracts in darker green have relatively more similar geo-embeddings, shorter Euclidean distances, and higher spatial interaction intensities. For spatial interaction intensity, census tracts with no interactions/flows with the selected tract are in white.
Correlation between flow similarity and geo-embedding similarity.
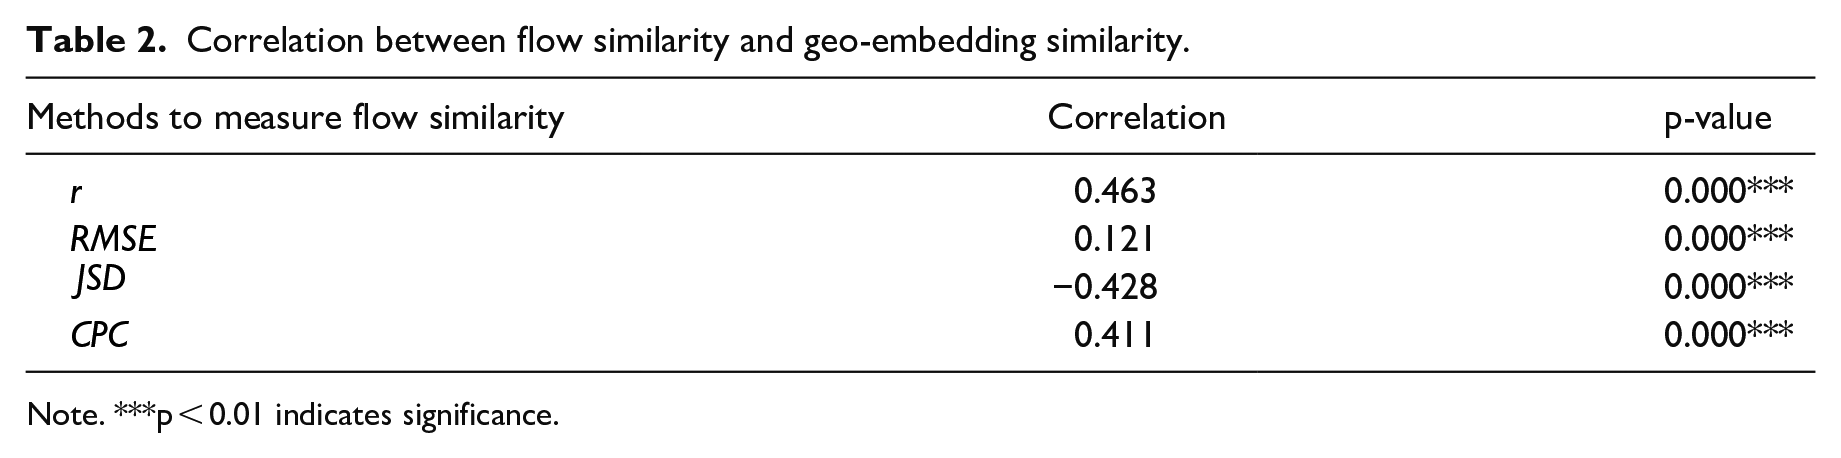
Note. ***p < 0.01 indicates significance.
The first row presents results for Plymouth, a suburban neighborhood about 10 miles west of downtown Minneapolis. The average household income in Plymouth in 2024 is $168,837, higher than the state average. Plymouth residents are primarily White, non-Hispanic (about 75%), and Asian (about 11%). As shown in Figure 4, the three metrics align well with each other for census tracts surrounding the selected census tract in Plymouth. Specifically, tracts with more similar geo-embeddings have shorter Euclidean distances and higher spatial interaction intensity. This suggests that geo-embeddings can capture the impact of spatial distances on location closeness and interaction intensity between places quite well.
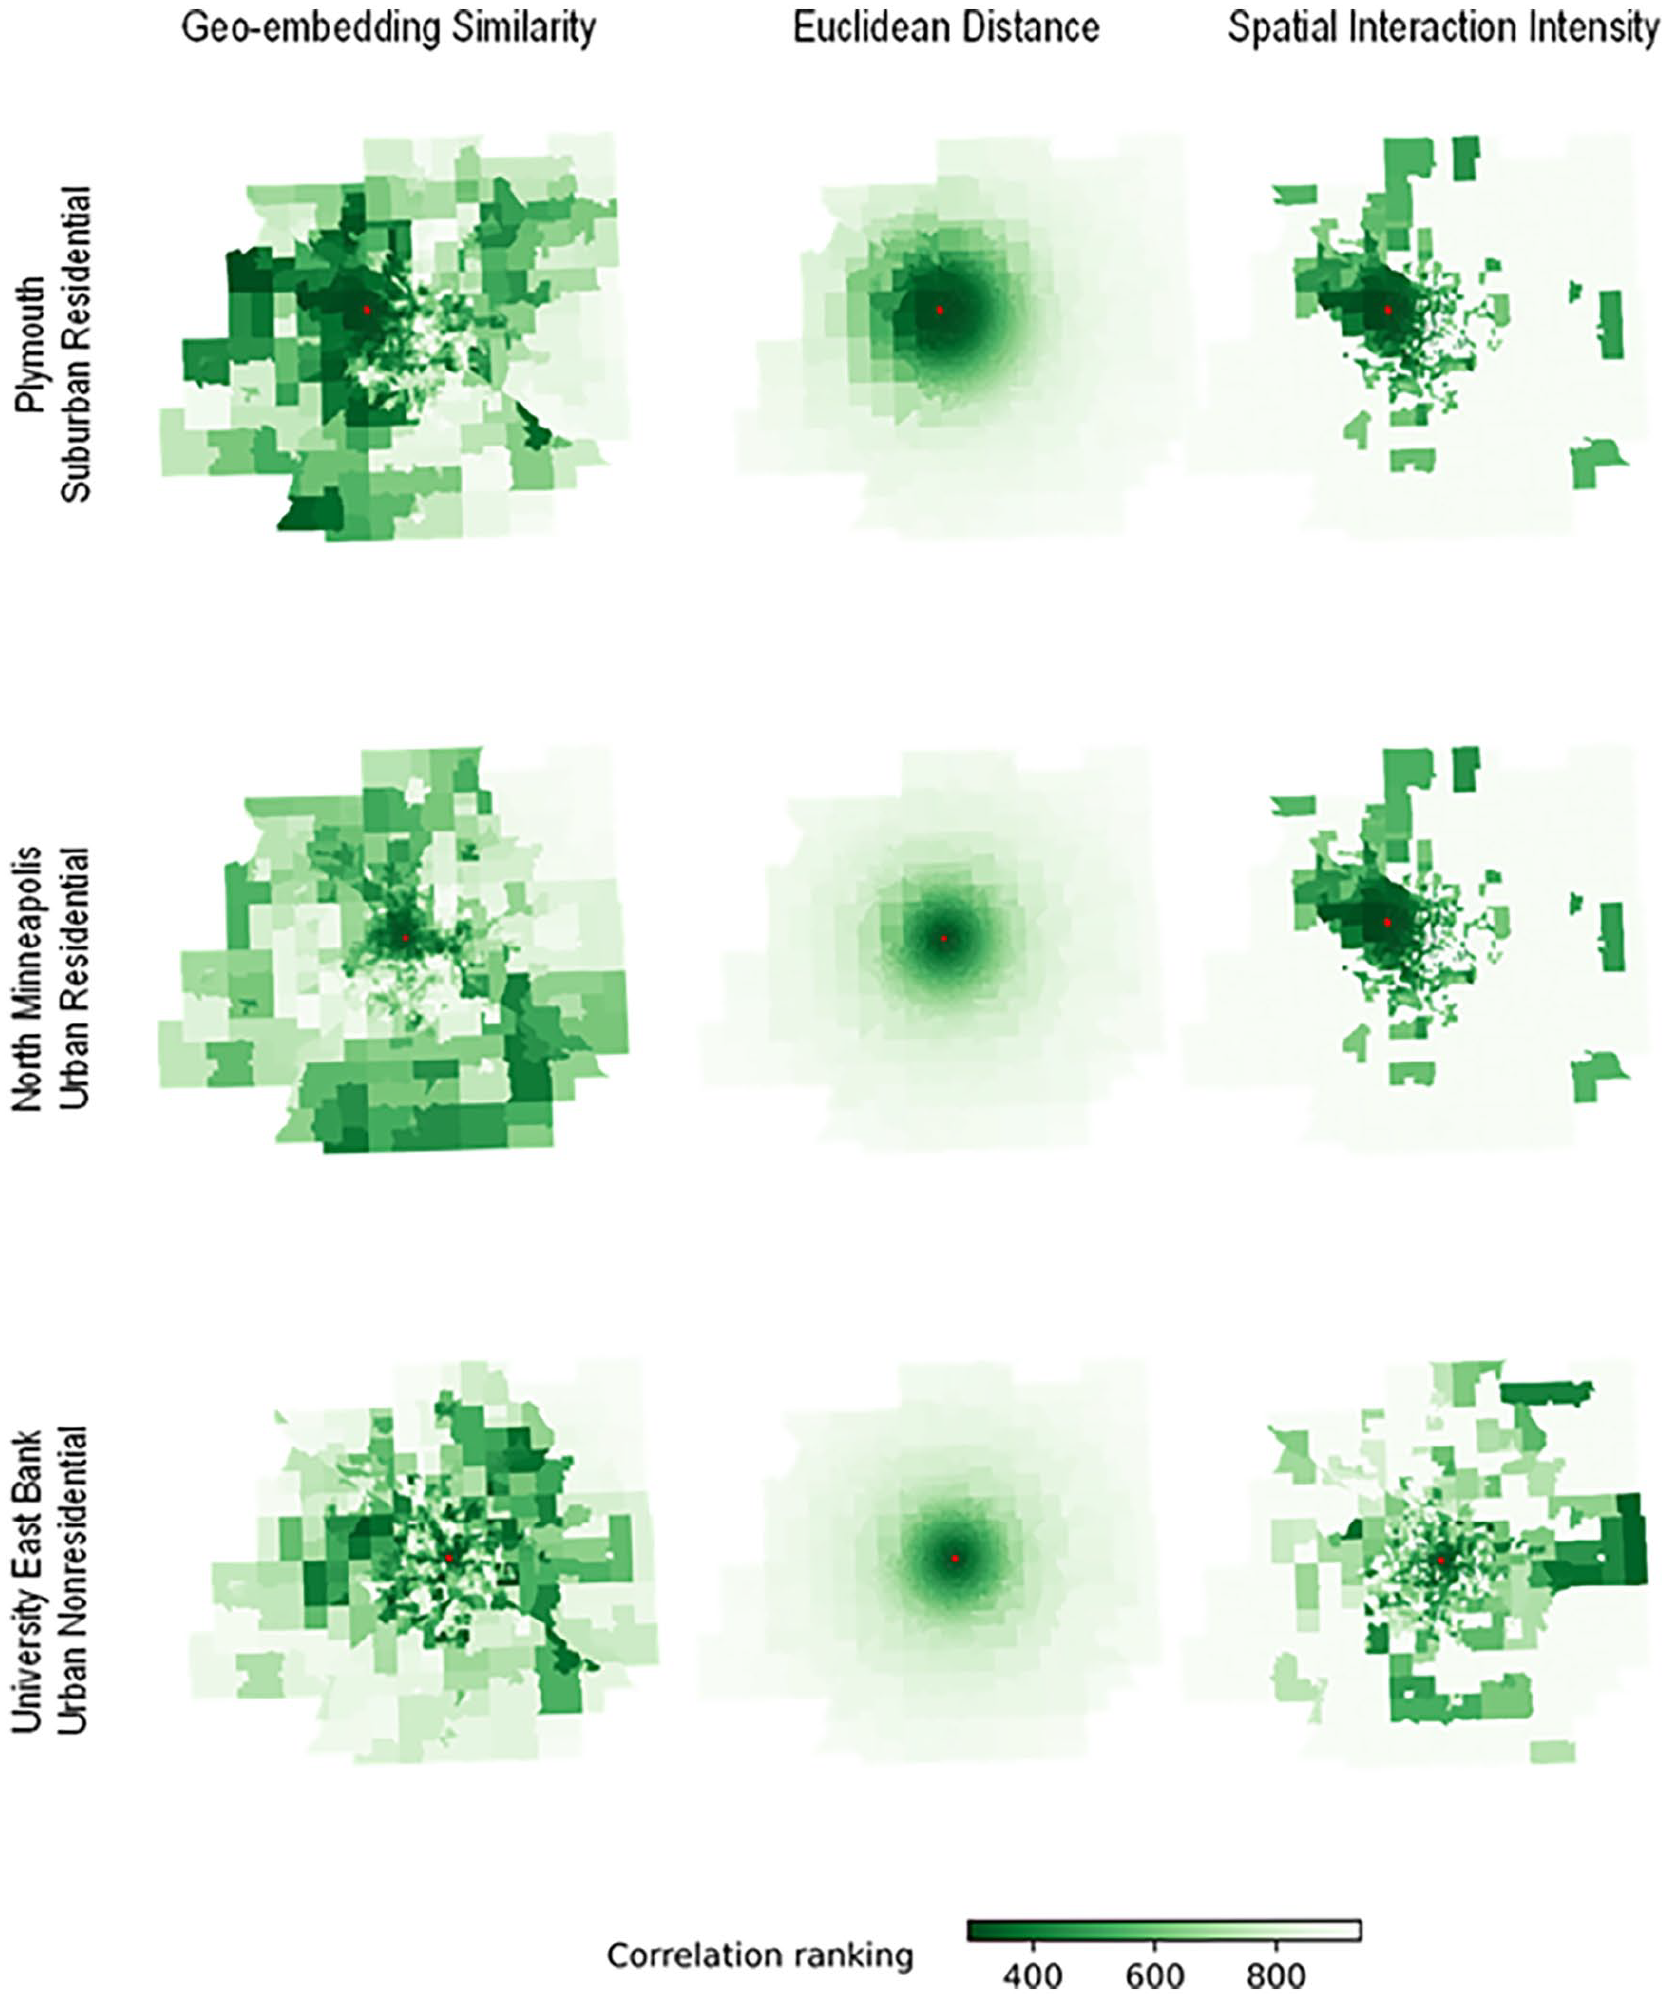
The geo-embedding similarities, Euclidean distances, and spatial interaction intensities between a selected census tract and other census tracts.
The second row presents results for North Minneapolis, an urban neighborhood toward the north of downtown Minneapolis, which has a quite different racial makeup from Plymouth. Only 22% of residents in North Minneapolis are White, or non-Hispanic, while about 50% are black and 10% are Hispanic or Latino. As for household income, over 50% of households have income less than $50,000 and most of the people are under the poverty level. Compared to the census tract in Plymouth, the selected census tract in North Minneapolis interacts with fewer census tracts (see census tracts in white in the second row, the third column in Table 2). This pattern is captured by geo-embeddings as nearby census tracts with very similar geo-embeddings (in dark green) have a much smaller spatial range for the selected tract in North Minneapolis than in Plymouth.
The third row presents results for the selected census tract located in the East Bank of the University of Minnesota, Twin Cities campus, which is located beside downtown Minneapolis. Compared to the previous two census tracts, this census tract is not primarily residential and has quite diverse land uses. Therefore, the spatial interaction intensities have quite different spatial patterns from the Euclidean distances. Further, census tracts with interactions and connections with the select tract in East Bank have a much larger spatial range than in Plymouth and North Minneapolis. This suggests that the geo-embeddings can capture the impacts of mixed land use on location closeness and spatial interactions beyond the Euclidean distance.
Geo-embedding and flow-based representation
We continue to derive the flow-based representations of census tracts and calculate the pairwise similarities between flow-based representations using four metrics (see ‘ Geo-embedding and flow-based representations’). As shown in Table 2, the Pearson correlation (
Temporal activity signature and community detection
After deriving the temporal activity signature (TAS), we apply the Louvain community discovery algorithm using geo-embeddings generated by Word2Vec, flow-based representations, and TASs as the inputs. In addition to geo-embeddings with a window size of one, we also examine how the modularity and the number of detected communities change as the window size of the Word2Vec model increases. As Figure 5 shows, the modularity increases as the window size increases and becomes relatively stable after reaching the size of eight; and the number of communities jumps between four and five for window sizes ranging from 1 to 20. Therefore, we choose eight as the window size to generate geo-embeddings.
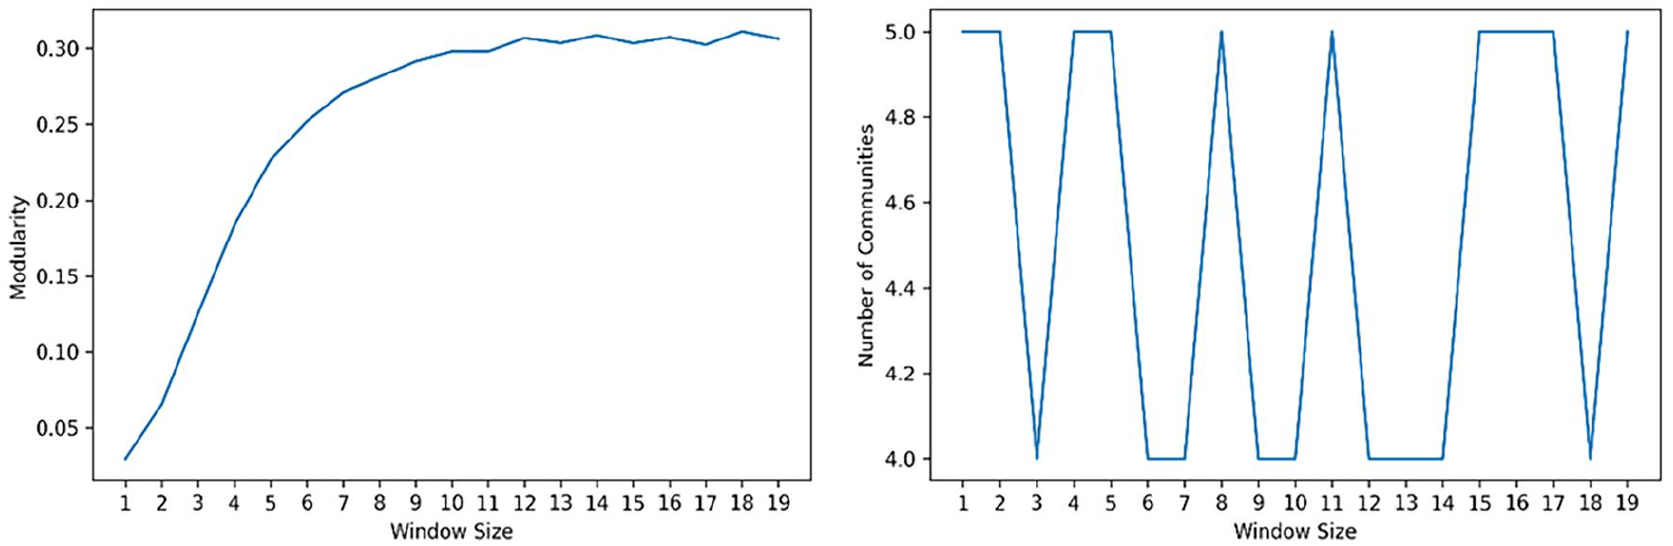
The impact of window size used in Word2Vec on the modularity (left) and the number of detected communities (right).
Table 3 presents the number and spatial distribution of communities detected using three different location representations, which highlight the distinct characteristics and suitable applications of each representation. The results derived from trajectory-based geo-embeddings divide census tracts into five large, spatially continuous communities – East, South, West, North, and downtown Minneapolis – demonstrating a clear directional structure. This suggests that these geo-embeddings effectively capture spatial coherence and regional connectivity, making them well-suited for describing the general morphology of a geographical region.
Detected community using geo-embeddings, flow-based representations, and temporal activity signatures of census tracts as inputs.
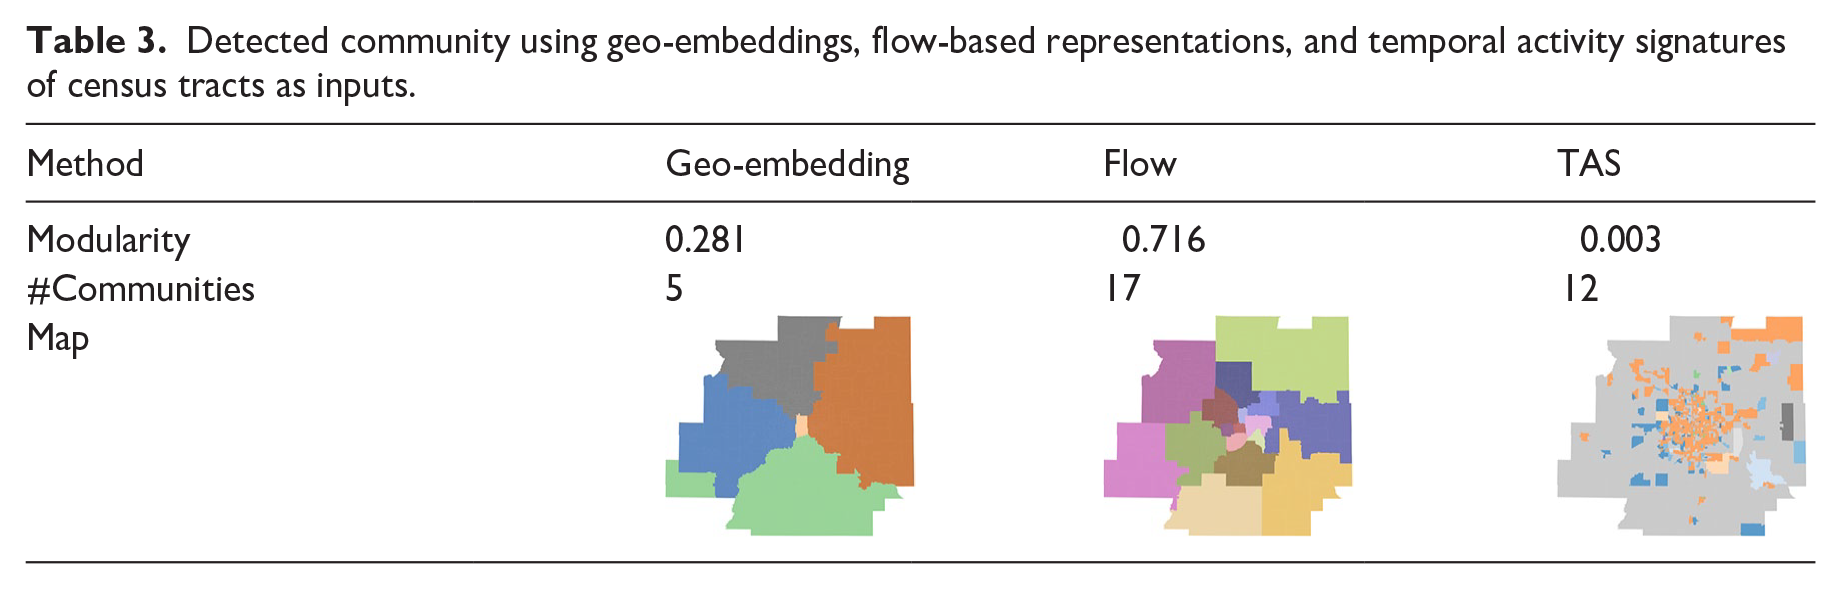
In contrast, the flow-based representation tends to produce smaller spatially continuous communities. This is likely because the flow-based representation is defined using direct trips rather than linked trips within people’s daily schedules. As a result, census tracts connected through two chained trips are not considered to be interacting with each other. This means the detected community structure does not contain knowledge about trip-chaining behavior. For instance, if a person stops at a grocery store on the way home from work, the flow-based representation does not capture the indirect relationship between the work and home locations. Consequently, the census tracts where homes, grocery stores, and workplaces are located are less likely to be merged into a larger community. That said, the flow-based representation is more efficient than geo-embedding when the objective is to analyze movement flows between location pairs, making it well-suited for applications such as traffic volume prediction in transportation modeling.
Compared to the geo-embeddings and flow-based representations, the communities detected using TAS appear scattered and spatially discontinuous. This is likely because this approach considers only the distribution of activity intensity at individual locations throughout the day. It does not account for spatial relationships or connections between locations, which may limit its ability to capture cohesive regional structures and movement patterns.
Geo-embedding and sociodemographic characteristics
We continue to assess whether and how geo-embeddings can capture sociodemographic features of census tracts using the SemAxis method described under ‘Geo-embedding and sociodemographic characteristics’. Figure 6 presents the results for median household income. The left subplot displays the spatial distribution of median household income based on census data, where census tracts with lower median household income are yellow and census tracts with higher income are dark brown. The right subplot illustrates the income semantic extracted from the geo-embedding using SemAxis (An et al., 2018; Kozlowski et al., 2019). The negative pole, the bottom of the color bar in yellow, is defined by the average geo-embedding of the ten census tracts with the lowest median household income. The positive pole on the top of the color bar is in brown, corresponding to the ten census tracts with the highest income. In practice, the number of spatial units on the end of the spectrum could be flexibly chosen according to different stakeholders or planning purposes. The colors of census tracts are determined by their SemAxis scores, computed as their cosine similarities with the axis defined by the two poles, so census tracts with similar geo-embeddings as the negative pole (i.e., low-income census tracts) are colored yellow, whereas those with similar geo-embeddings as the positive pole are colored dark brown. By comparing the two subplots, we observe similar spatial patterns to some degree, such as concentrations of yellow census tracts in downtown Minneapolis and Saint Paul, suggesting the geo-embeddings can capture low-income areas in downtown areas. We apply the same method to examine whether trajectory-based geo-embeddings can capture the racial composition and present the results in Figure 7. A similar pattern is found in the percentage of the non-white population, with a higher percentage of non-white people in downtown areas and a higher percentage of white, non-Hispanic people in the suburbs.
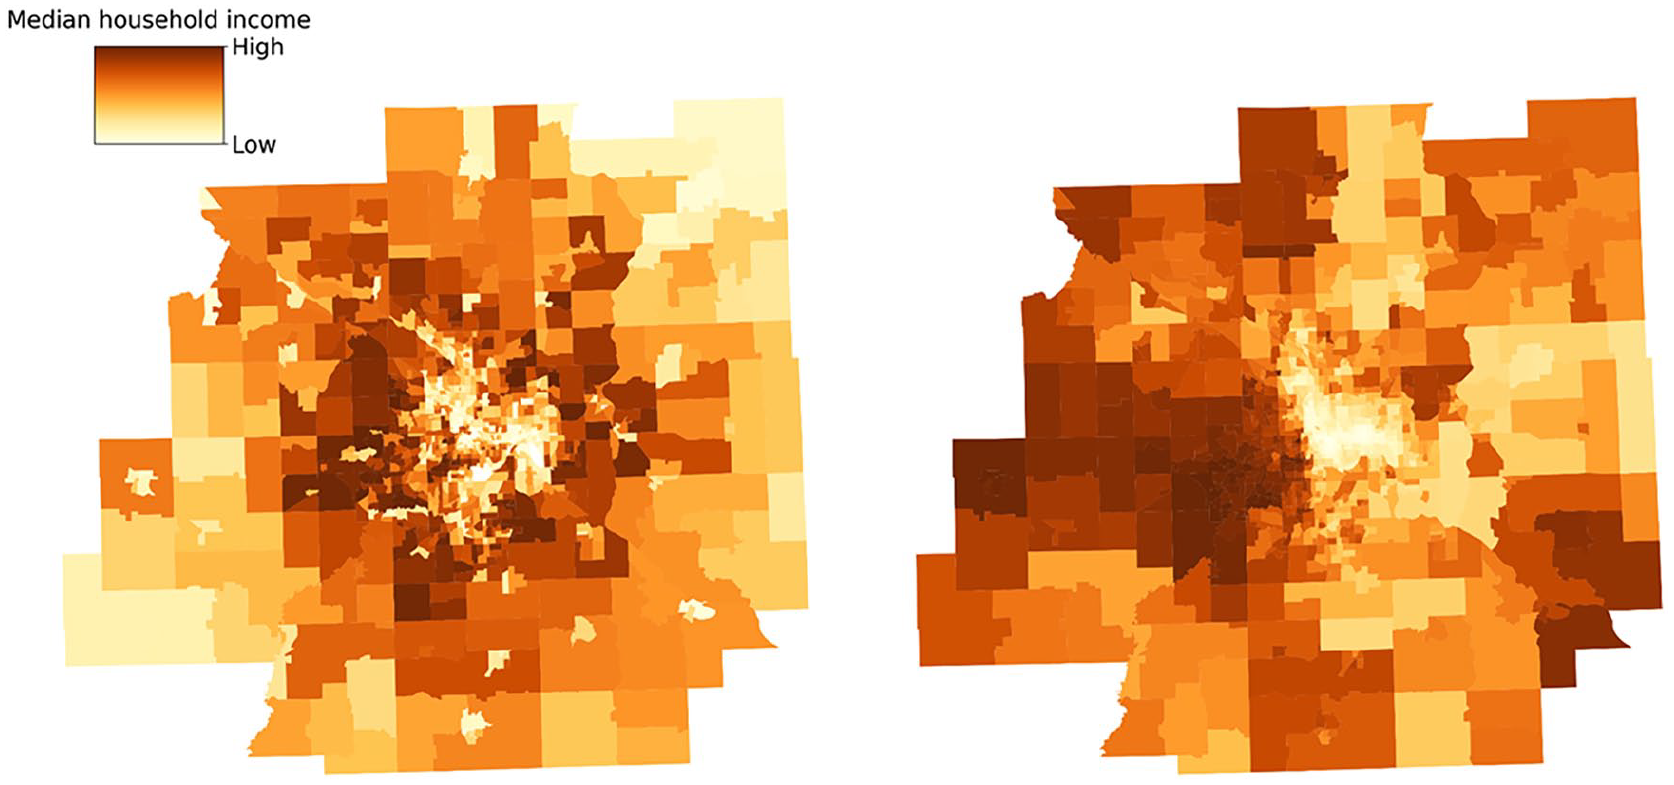
The spatial distribution of median household income from census data (left) and geo-embedding (right).
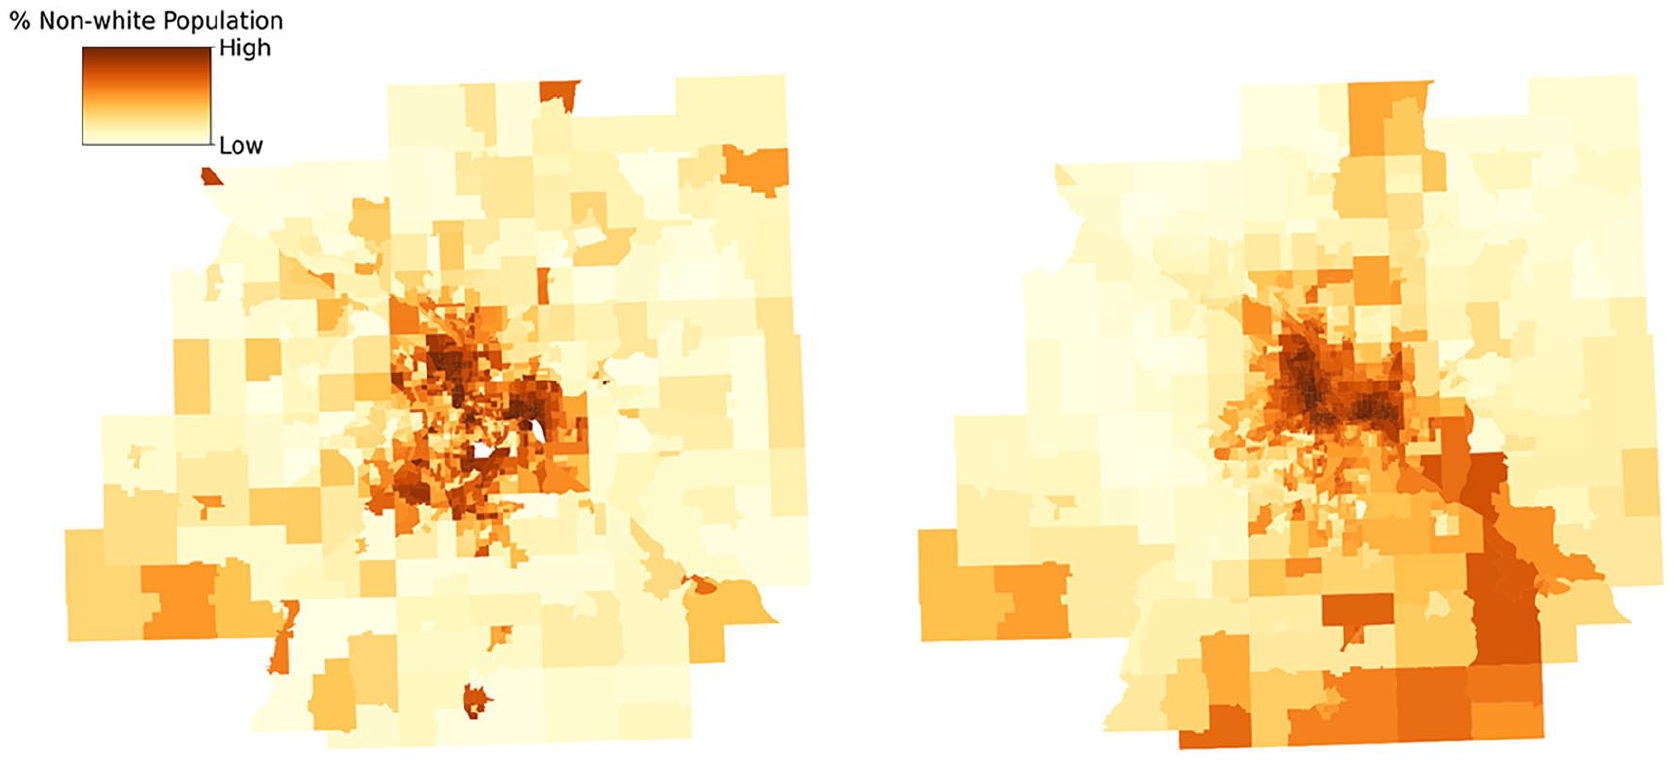
The spatial distribution of percent of non-white population from census data (left) and geo-embedding (right).
To quantitatively compare the spatial patterns of sociodemographic attributes and geo-embeddings, we compute the Spearman correlation between the original census attributes and the derived SemAxis scores. The results for the income and racial semantics are 0.51 and 0.54, respectively, both with significant p-values. These findings underscore the potential of using trajectory-based geo-embeddings in capturing and describing spatial patterns of sociodemographic characteristics within a geographic region, even in the presence of limited information. By leveraging mobility trajectory data collected over various time periods, these geo-embeddings can provide timely and dynamic insights into urban and sociodemographic changes, offering a valuable complement to traditional census data. This capability makes them particularly useful for applications in urban planning, transportation modeling, and other domains, where real-time data are essential for informed decision-making.
Conclusions and discussion
This paper investigates whether geo-embeddings generated by human movement trajectories can capture the roles of a geographical location in facilitating people’s daily trips and activity participation. Specifically, we examine whether locations with similar geo-embeddings have similar movement flows from and to other places. We also examine whether geo-embeddings can be used in downstream tasks such as community detection and understanding sociodemographic disparities. Using movement trajectories collected in Twin Cities metropolitan areas as a study case, we found that geo-embeddings derived from movement data can capture the intensity of spatial interactions among locations beyond just the effect of spatial distance.
A direct extension of our work is to integrate time while constructing location sequences from movement trajectories, which may potentially capture temporal movement patterns. For instance, if we label a location in the morning and at night differently, a trip from location A to location B in the morning and at night could be differentiated. This would overcome the limited ability of the Word2Vec model to capture the directionality of the movement and lead to novel insights into the intrinsic, complex relationship between spatial locations and places.
We can also examine how the choice of spatial units would affects the results. The current study uses data collected in one week, so we choose census tracts as the spatial unit to ensure a sufficient number of observations for each unit and to align well with the common units used by spatial interaction models. Since the general purpose of the census data collection is to help the government and communities in making decisions, the census tract and other similar spatial units have similar numbers of residents with relatively homogeneous socio-economic backgrounds and are confined by administration such as county boundaries. The inherent characteristics of these spatial units, therefore, may hinder the discovery of places and location relationships that are not associated with population and administrative boundaries. One possible solution is to use regular tessellations such as grids and hexagons, which may provide new insights and delineate places that may not necessarily align with the administrative boundaries.
Finally, since we are using the census tract as the spatial unit, it would be worthwhile to examine how geo-embeddings derived from movement trajectories could reflect the sociodemographic background of residence, land-use patterns, and other interrelated factors. Since this paper focuses on the role of location in facilitating human movements, we do not include such analysis. However, it would be worthwhile to extend the interactions beyond the intensity to other dimensions such as social segregations and land-use entropy, and use similar approaches to study whether and how well the geo-embeddings can capture those location characteristics.
Footnotes
Declaration of conflicting interests
The author(s) declared no potential conflicts of interest with respect to the research, authorship, and/or publication of this article.
Funding
The author(s) disclosed receipt of the following financial support for the research, authorship, and/or publication of this article: This work is partially funded by the CTS Seed Fund, Minnesota Department of Transportation (CON000000106169), the DSI Medium/Large Seed Grant, Data Science Initiatives, University of Minnesota (DSI-MLSG-0403204131), and the CURA Faculty Interactive Research Program Grant, University of Minnesota (1801-10964-21584-5672018).