
Abstract
The themes of cities and the types of attractions they offer significantly influence visitors’ decisions to explore specific destinations. However, systematic research on the competitive and cooperative (coopetition) relationships between thematic and non-thematic urban attractions remains scarce. This study analyzes the spatial patterns of coopetition relationships between thematic and non-thematic attractions in three Chinese tourist cities—Chengdu, Dalian, and Shenyang—during the 2020 National Day, based on pedestrian trajectory data provided by a service operator. By leveraging network analysis, geographic metrics, and a quantitative modeling approach, this paper introduces a novel framework that integrates network analysis with motif analysis to examine the interaction patterns between attractions. Specifically, the Fruchterman–Reingold algorithm is utilized to establish an analytical framework for thematic and non-thematic interactions among urban attractions. The results reveal both similarities and differences in the coopetition relationships of urban attractions. Across the cities studied, thematic attractions exhibit a strong tendency to cluster, while the competition among non-thematic attractions is more evenly distributed. The study is helpful to dynamically abstract the coopetition relationships and support the sustainable decision-making for urban tourism management.
Keywords
Introduction
Themes are not only the core appeal of urban tourism but also play a critical role in enhancing a city’s tourism image and visitor satisfaction (Song and Wang, 2024). However, the influence of thematic attractions on surrounding attractions is twofold. They can promote overall cooperation, creating unique competitive advantages, or, conversely, they may compete with non-thematic attractions, potentially hindering the sustainable development of urban tourism (Du et al., 2023). Thus, understanding the coopetition relationships between thematic and non-thematic attractions is crucial for optimizing urban tourism products and services.
In practice, many urban thematic tourism projects face challenges such as redundant theme positioning, insufficient depth of experience, and lack of cultural substance, leading to weak market competitiveness and low visitor satisfaction (Huang et al., 2024). To address these issues, systematic research is needed to provide theoretical support for the unique positioning and in-depth development of urban thematic tourism. However, existing studies primarily focus on macro-level destination competition or the spatial structures of urban tourism (Zhang et al., 2023), with limited attention to the micro-level coopetition dynamics between thematic and non-thematic attractions. Moreover, the implications of these relationships for urban tourism resource allocation and visitor behavior patterns remain underexplored.
This study centers on the coopetition relationships among urban attractions, aiming to uncover interaction patterns and resource allocation mechanisms at the micro level from the perspective of visitor flows. The research is grounded in constructing an attraction network based on visitor behavior, analyzing local connections and influences between attractions, and exploring how these coopetition relationships manifest in visitor movement patterns.
This study offers two key innovations: (1) A comprehensive modeling approach was developed, combining motif and network analyses to explore coopetition among attractions. By constructing interaction networks with attractions as nodes and visitor flows as edges, and integrating geographic and behavioral metrics such as Geographic Linkage Rate and Nearest Neighbor Index, this method quantitatively examines micro-level relationships. This approach moves beyond traditional applications of motif analysis, revealing unique patterns of resource competition and cooperation, thereby providing both theoretical insights and practical strategies for optimizing urban tourism resource allocation. (2) An analytical framework using the Fruchterman–Reingold algorithm, categorizing attractions into thematic and non-thematic types to identify interaction patterns. This framework advances understanding of coopetition mechanisms, addressing research gaps and supporting sustainable urban tourism development.
Literature review
Tourism coopetition relationships
The spatial coopetition relationships among neighboring tourism destinations focus on the interplay of competition and cooperation within the same region as destinations compete for tourists (Zhang et al., 2021). Unlike studies in economic geography, which explore location-based coopetition, the spatial dynamics in tourism require consideration of the unique, immovable nature of tourism resources (Liu et al., 2018). While industrial products can be relocated, tourism attractions are inherently fixed (Wang and Song, 2024). Furthermore, aggregation theories in commercial geography are grounded in consumer travel behavior on a micro scale, whereas spatial coopetition relationships in tourism networks are built on meso- and macro-level tourist behaviors (Jiang et al., 2024a). The theoretical foundation of these relationships stems from the positive and negative effects of neighboring destinations (Chen and Bao, 1988), supplemented by three relational types: complementary, substitutive, and unrelated (Zhang, 1989).
Research into tourism coopetition relationships spans both theoretical developments and empirical applications. From a theoretical perspective, foundational theories such as interspecies relationships theory (Kaplan and Denno, 2007), symbiosis theory (Wu and Gu, 2004), self-organization theory (Liang et al., 2004), and resource dependence theory (Qin, 2024) have been integrated to illuminate the dynamics of coopetition. Scholars have further refined conceptual frameworks, delineating cooperation from collaboration and coordination by analyzing temporal stages and goal-oriented attributes (Castaner and Oliveira, 2020). Cooperation has also been conceptualized as a dynamic process involving simultaneous cooperation, competition, and conflict, with actor-network theory offering insights into the emergence of these dynamics (Nguyen et al., 2022). Empirical studies have primarily examined destinations (Grauslund and Hammershoy, 2021; Kirillova and Park, 2020), supply chains (Fong and Hong, 2021; Sharma and Nicolau, 2019), and platforms (Bahar and Nenonen, 2020; Vinogradov and Leick, 2020).
Despite progress, gaps remain in defining and quantifying coopetition relationships. While quantitative approaches employing mathematical models and statistical methods have elucidated key mechanisms and factors, their inherent limitations highlight the need for qualitative methods to fully capture the complexities of tourism coopetition.
Urban tourism themes
Tourism consumption has transitioned from mass tourism to a postmodern paradigm, prioritizing visitor-centered, immersive experiences within idealized mixed-use environments (Zhang et al., 2021). Within this context, urban tourism spatial design has shifted from emphasizing physical arrangements to prioritizing thematic and experiential dimensions (Yousaf and Fan, 2020). Theme parks have catalyzed this evolution, extending thematic concepts into other domains such as themed bars, restaurants, shopping malls, and entire urban environments (Wu, 2020).
Themes act as competitive identifiers for urban destinations, enhancing their attractiveness. Research in this area includes both vertical explorations, such as the role of local cuisine in reinforcing regional identity (Forleo and Benedetto, 2020) and the influence of cultural parks on urban appeal (Yuan and Marzuki, 2024), and horizontal comparisons, such as thematic distinctions between Oaxaca, Mexico, and Málaga, Spain (Hernandez and Barrera, 2023). Comparative studies also address the historical and capital status of cities in the Northern and Southern Hemispheres, contributing to discussions on the representation of Southern Hemisphere capitals in global tourism literature (Rogerson and Rogerson, 2022).
Travel space modeling has become an essential method for understanding the interaction patterns of theme attractions (Xia, 2010). Techniques such as GPS data analysis, mobile signaling data, and network analysis enable researchers to map tourist flows and preferences (Sila, 2016; Yuan and Raubal, 2016). Quantitative studies further reveal the spatial distribution of theme attractions and their correlation with visitor behavior, providing insights into optimizing the tourism experience (Qi and Du, 2013; Shih, 2006).
Nevertheless, challenges remain, including insufficient research on distinctions between thematic and non-thematic attractions and limited attention to micro-attractions. Future research should integrate technological innovations and policy-making to advance the study of urban tourism themes.
Attraction matching patterns
Attraction pairing models play a crucial role in shaping tourists’ travel decisions and optimizing urban tourism resource efficiency (Li et al., 2024). Thoughtful combinations of attractions enhance visitor satisfaction, increase revenue, and bolster a city’s visibility (Xie et al., 2024a). While traditional planning relied on geographic and cultural factors, modern models emphasize functional complementarity, interaction dynamics, and tourist flow optimization (Chen et al., 2023). Strategic attraction pairings significantly influence competitiveness and visitor experience, highlighting the importance of in-depth analyses of pairing mechanisms for sustainable tourism development (Xie et al., 2024b).
The interplay between competition and cooperation among attractions directly impacts pairing models. Competition drives improvements in service quality, while cooperation enhances collective appeal by creating integrated visitor flow networks. The coexistence of these dynamics fosters “coopetition” relationships, boosting the efficiency of urban tourism systems (Liu et al., 2022). A well-structured pairing model not only enhances visitor experiences but also minimizes ineffective competition, contributing to a destination’s overall attractiveness (Yang et al., 2024).
Advancements in smart tourism and big data technologies have elevated attraction pairing models to new levels. Data-driven approaches, such as real-time analysis of tourist flows and service capacities, allow cities to dynamically optimize attraction relationships and improve visitor satisfaction (Fan et al., 2023; Jiang et al., 2024b). Future efforts could integrate theme attractions into core commercial areas to extend tourists’ stays and maximize economic and social benefits (Zhou et al., 2024).
Data and methods
Data
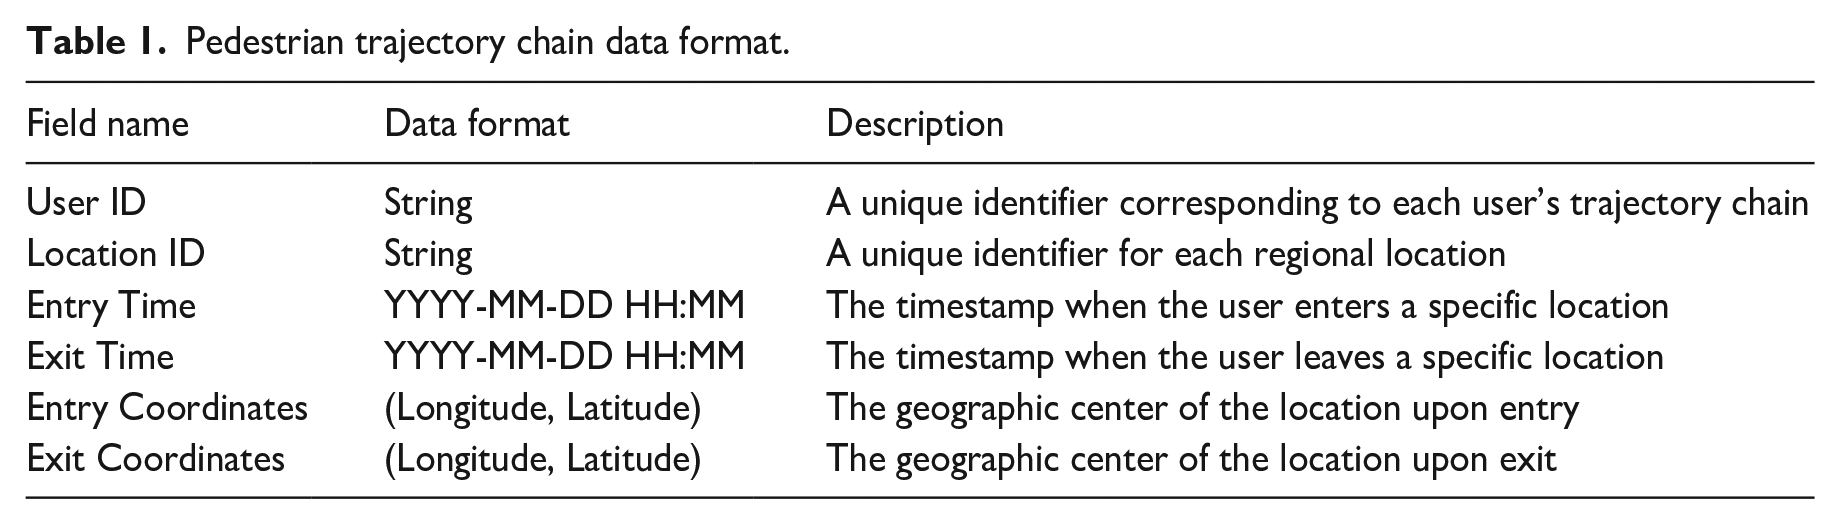
The data used in this study, due to a privacy protection agreement, cannot disclose the name of the data provider. The dataset was supplied by a major operator and includes pedestrian trajectory chains from 00:00 October 1 to 24:00 October 7, 2020. Each trajectory corresponds to a unique user ID and records the user’s time of entry and exit from a specific location (Table 1). The dataset, stored in CSV format, comprises a total of 58.52 million records across three cities over seven days.
Pedestrian trajectory chain data format.
Methods
The technical framework of this study (Figure 1) is structured into three main steps: (1) constructing the tourism network for the study area; (2) identifying the competition and cooperation relationships among attractions; and (3) analyzing the spatial distribution patterns of these relationships and the pairing models of attractions.
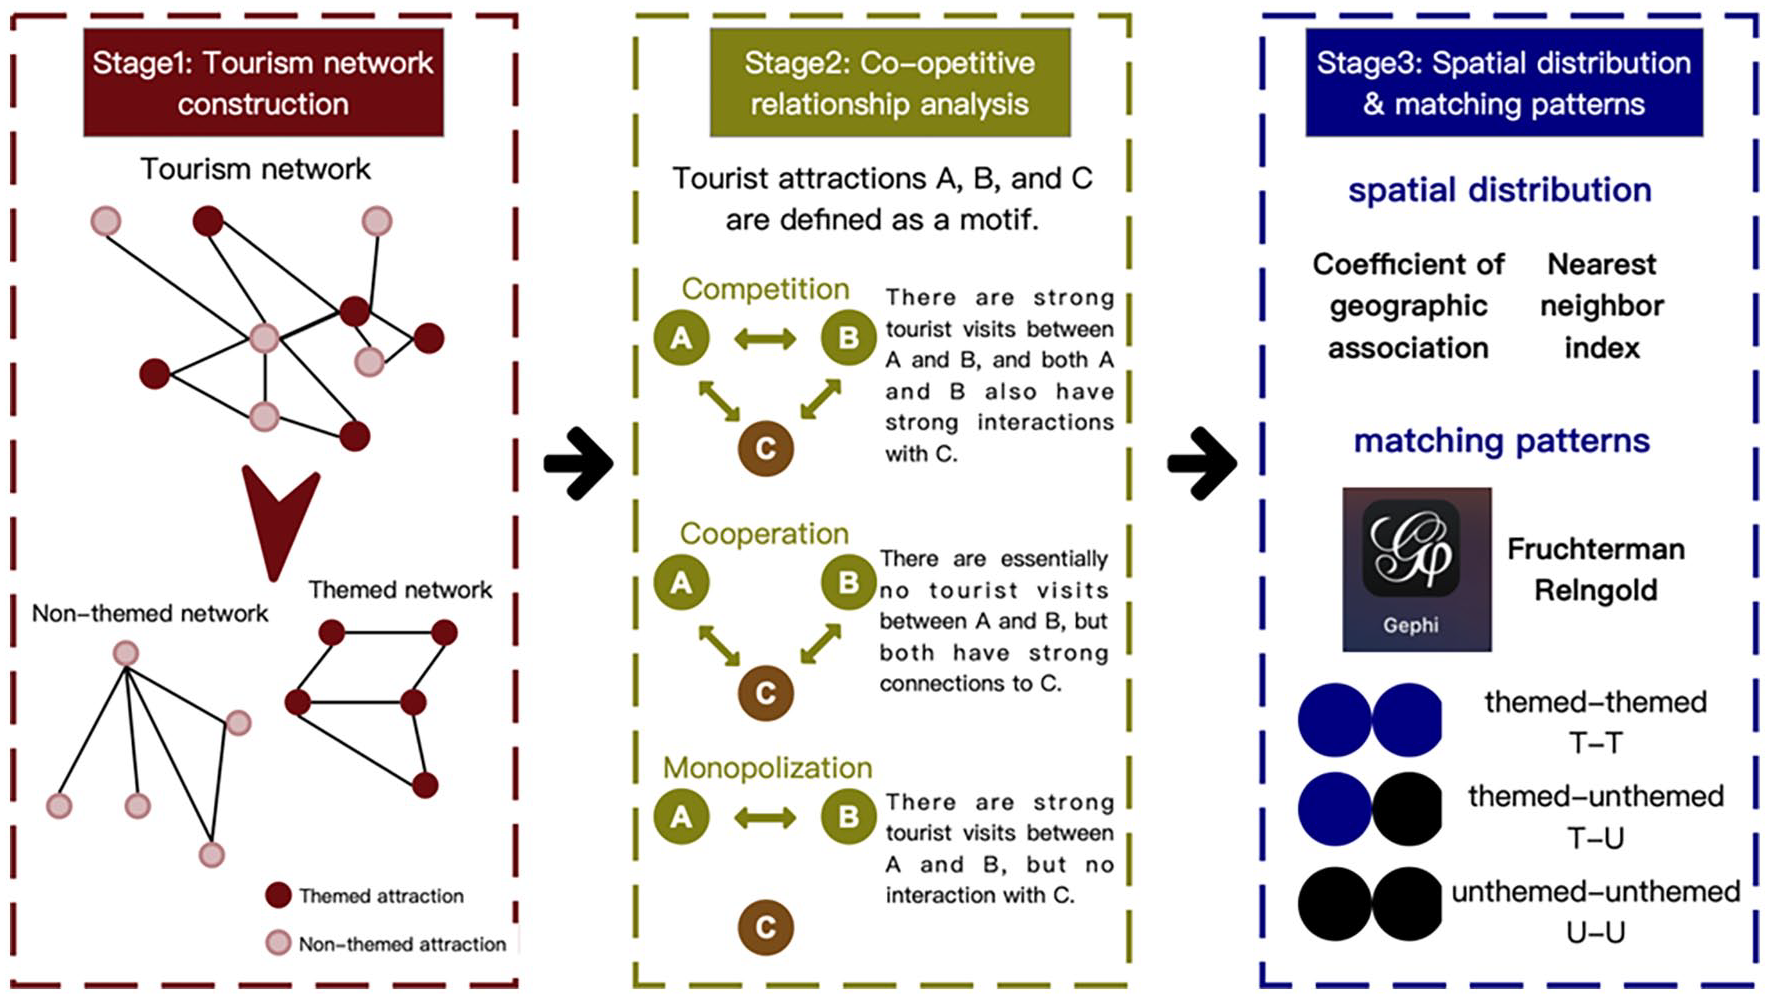
The research framework.
Construction of the tourism network
This study focuses on three cities: Chengdu, Dalian, and Shenyang, selected based on their distinct geographic and urban characteristics. Dalian represents a coastal city, Chengdu an inland city, and Shenyang lies geographically between the two, with a mix of historical and modern attractions. This diverse selection ensures that the methodology can accommodate different urban contexts, validating its robustness and generalizability. The results suggest that this approach can be extended to other cities in China and beyond, providing a flexible framework for studying tourism networks across varying urban and cultural settings.
The data cleaning and tourism network construction involved the following steps:
Filtering: Time and location data were filtered to retain only tourist attractions where the dwell time exceeded 30 minutes, producing a refined visitor trajectory chain dataset. Time and location data were filtered to retain only tourist attractions where the dwell time exceeded 30 minutes, producing a refined visitor trajectory chain dataset. Stays shorter than 30 minutes, such as 2 minutes, were excluded from the analysis because such brief visits are typically transient, such as walking past or briefly stopping at a location without engaging in meaningful activities. This threshold ensures that the dataset captures only purposeful visits, such as exploring or experiencing the attraction, which are critical for analyzing tourist behavior and coopetition dynamics.
Node and edge definition: Tourist attractions were defined as nodes, visit trajectories as edges, and the number of visits as edge weights to construct the urban tourism network.
Thematic categorization: We recognize that the division of attractions into thematic and non-thematic categories, while based on standardized classifications (e.g., AMap categories), may introduce bias in the spatial analysis. This is due to the inherent subjectivity in defining urban themes and the possibility of emphasizing certain attractions over others. To address this, both thematic and non-thematic networks were analyzed separately, and the methodology was designed to minimize subjectivity by considering publicly available urban planning data and cultural contexts.
Determination of coopetition relationships
In the tourism network, the concept of motifs was used to identify cooperative and competitive relationships. Motifs, first introduced by Milo (2002), represent patterns of interconnected nodes in complex networks that occur significantly more frequently than in random networks. These reveal the structural design principles of networks and their fundamental components. Gao later extended this concept by incorporating node and edge weights to explain motif functionality within networks (Gao and Peng, 2022).
In this study, if tourist attractions A, B, and C form a motif (a triadic pattern in the network), their coopetitive relationships are defined as follows:
Cooperation: If there is strong visitor flow between A and B, as well as significant interaction with C, then A, B, and C exhibit a cooperative relationship.
Monopoly: If there is strong visitor flow between A and B but no interaction with C, the strong connection between A and B monopolizes C.
Competition: If there is minimal visitor flow between A and B, but both are strongly connected to C, the strong interactions between A and C, and B and C, create a competitive relationship between A and B.
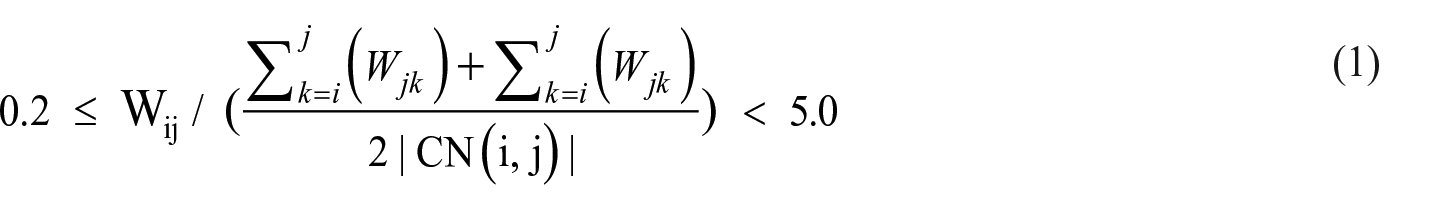
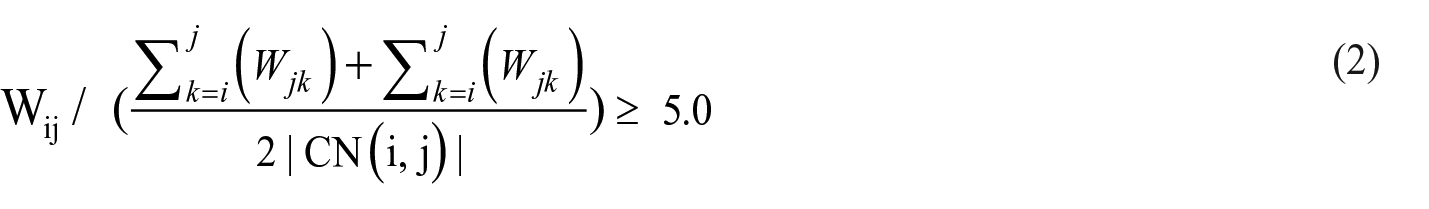
Here, Wij denotes the edge weight between attractions i and j, CN (i, j) represents their common neighbors, | CN (i, j) | is the number of such neighbors. A range of (0.2, 5.0) was used to determine Wij, aligning with the average weight of regular neighbors.
Spatial distribution and matching patterns
In the tourism network, nodes represent urban tourist attractions, while edges reflect visitor interactions between attractions. Edge weights indicate the frequency of these interactions. Using metrics such as the geographic connection ratio and nearest neighbor index, cooperative, competitive, and monopolistic relationships were mapped to the spatial distribution of attractions, revealing the spatial connections of coopetitive relationships.
Geographic linkage rate: This measures the degree of spatial correlation between coopetitive relationships and attraction distribution (Fang et al., 2019). L ∈ (0,100); higher L values indicate stronger spatial correlation.
where n represents the relationship type (limited to cooperation, competition, and monopoly in this study, hence n = 3). Si is the ratio of motifs of type i to all motifs in the city, while Pi is the ratio of type i motifs in thematic/non-thematic attractions to all motifs.
Nearest neighbor index: This is the ratio of the observed nearest neighbor distance to the expected distance, quantifying the spatial distribution of attractions (Liang and Xiao, 2018). R∈[0,1): clustered distribution; R = 1: random distribution; R∈(1,∞): uniform distribution.


where D is the theoretical nearest neighbor distance, n is the number of attractions, A is the city area, and
Using Gephi for network analysis, matching patterns were identified with algorithms such as Force Atlas, Fruchterman–Reingold, Yifan Hu, and Open Ord. Considering the study’s urban attractions (200–400 nodes, representing a medium-sized network), the Fruchterman–Reingold algorithm was selected to visualize and analyze pairing patterns among thematic-thematic (T-T), thematic-non-thematic (T-U), and non-thematic-non-thematic (U-U) attractions.
Results
Attraction coopetition relationships
Since 2018, Chengdu has been developing as a park city, while Dalian and Shenyang are classic marine and cultural tourism destinations, respectively. Urban attractions are categorized into themed and non-themed types (Table 2).
Classification of thematic and non-thematic attractions.
All attractions were included in the analysis to construct urban tourism networks. Figure 2 shows the proportion of cooperative, competitive, and monopolistic relationships. In all three cities, competitive relationships dominate, followed by cooperative relationships, with monopolistic relationships being the least common. However, differences exist: Chengdu and Dalian exhibit over 80% competitive relationships, whereas Shenyang shows only 64.79%. In terms of cooperative relationships, Shenyang reaches over 30%, while Chengdu and Dalian remain around 15%. This indicates stronger cooperation and interaction among attractions in Shenyang, while Chengdu and Dalian exhibit more intense competition.
Motif statistics of urban tourism network competition and cooperation.
Further, separate tourism networks for themed and non-themed attractions were constructed. Table 3 presents the cooperative, competitive, and monopolistic relationship statistics. For competitive relationships, themed attractions in Chengdu and Shenyang account for a lower proportion (76%, 59%) than non-themed attractions (88%, 67%), while in Dalian, themed attractions (87%) exceed non-themed ones (80%). This indicates fiercer competition among themed attractions in Dalian.
Statistics of urban thematic and non-thematic network motifs.
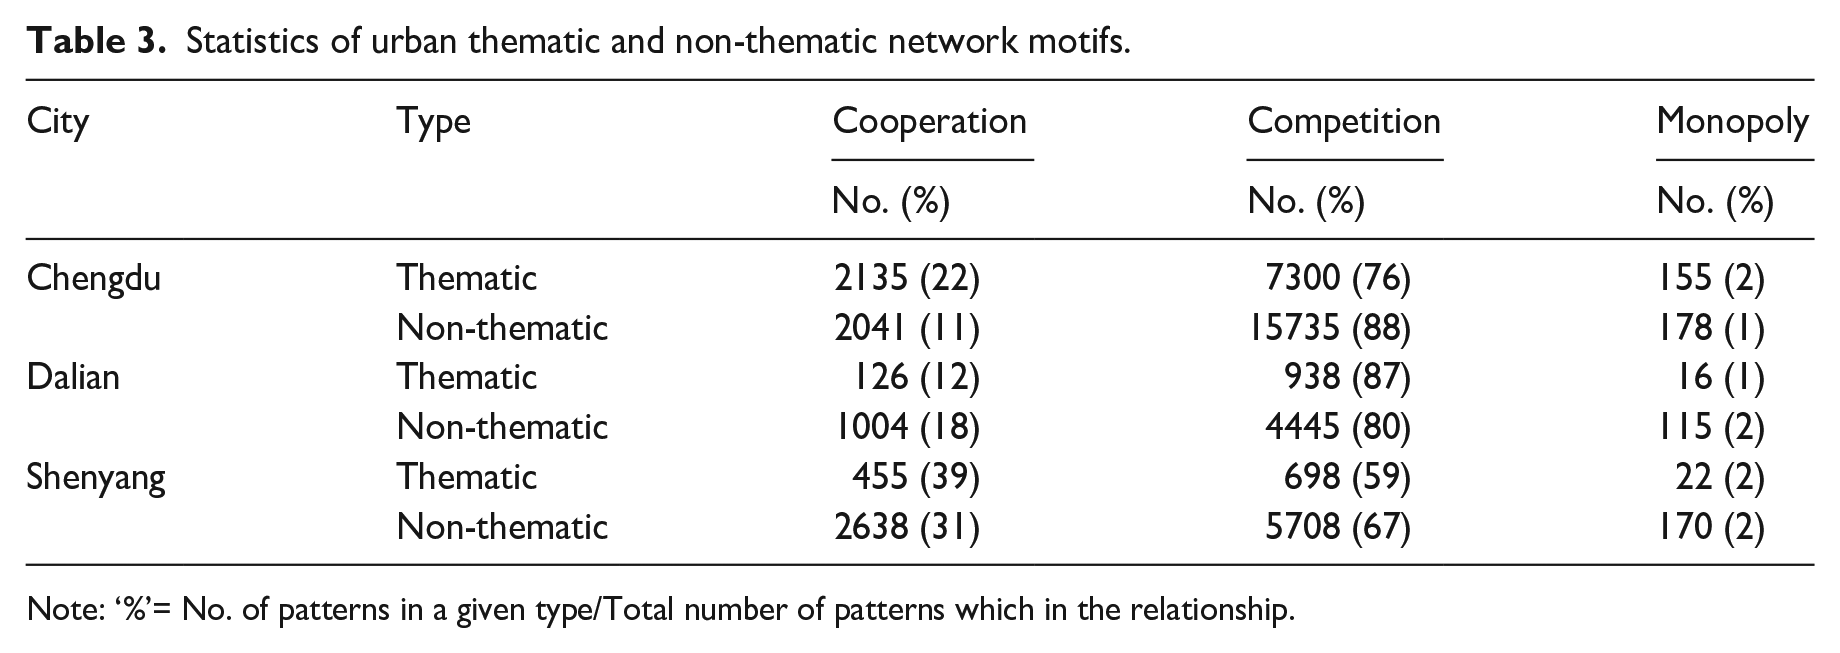
Note: ‘%’= No. of patterns in a given type/Total number of patterns which in the relationship.
In summary, competition dominates the relationships among attractions in Chengdu, Dalian, and Shenyang, followed by cooperation, with monopolistic relationships being weak. However, Shenyang demonstrates closer cooperation and stronger visitor interaction among attractions, while Chengdu and Dalian are more competition-driven. Furthermore, themed attractions in Dalian show the strongest competitive relationships, whereas non-themed attractions are more competitive in Chengdu and Shenyang.
Geospatial distribution patterns
Using Equation (4), the geographic linkage rates (L values) for Chengdu, Dalian, and Shenyang were calculated as 99.53%, 99.57%, and 99.64%, respectively, indicating a strong correlation between coopetitive relationships and spatial distribution.
Figure 3 shows the nearest neighbor index results for themed and non-themed attractions in the three cities. All R-values exceed 1, indicating a uniform spatial distribution of attractions. The R-values for themed attractions are consistently lower than those for non-themed attractions, reflecting a more significant spatial clustering tendency of coopetitive relationships among themed attractions. In all three cities, the smallest R-value corresponds to monopolistic relationships among themed attractions, while the largest R-value corresponds to competitive relationships among non-themed attractions. This suggests a stronger spatial clustering tendency for monopolistic relationships among themed attractions and a more uniform spatial distribution of competitive relationships among non-themed attractions.
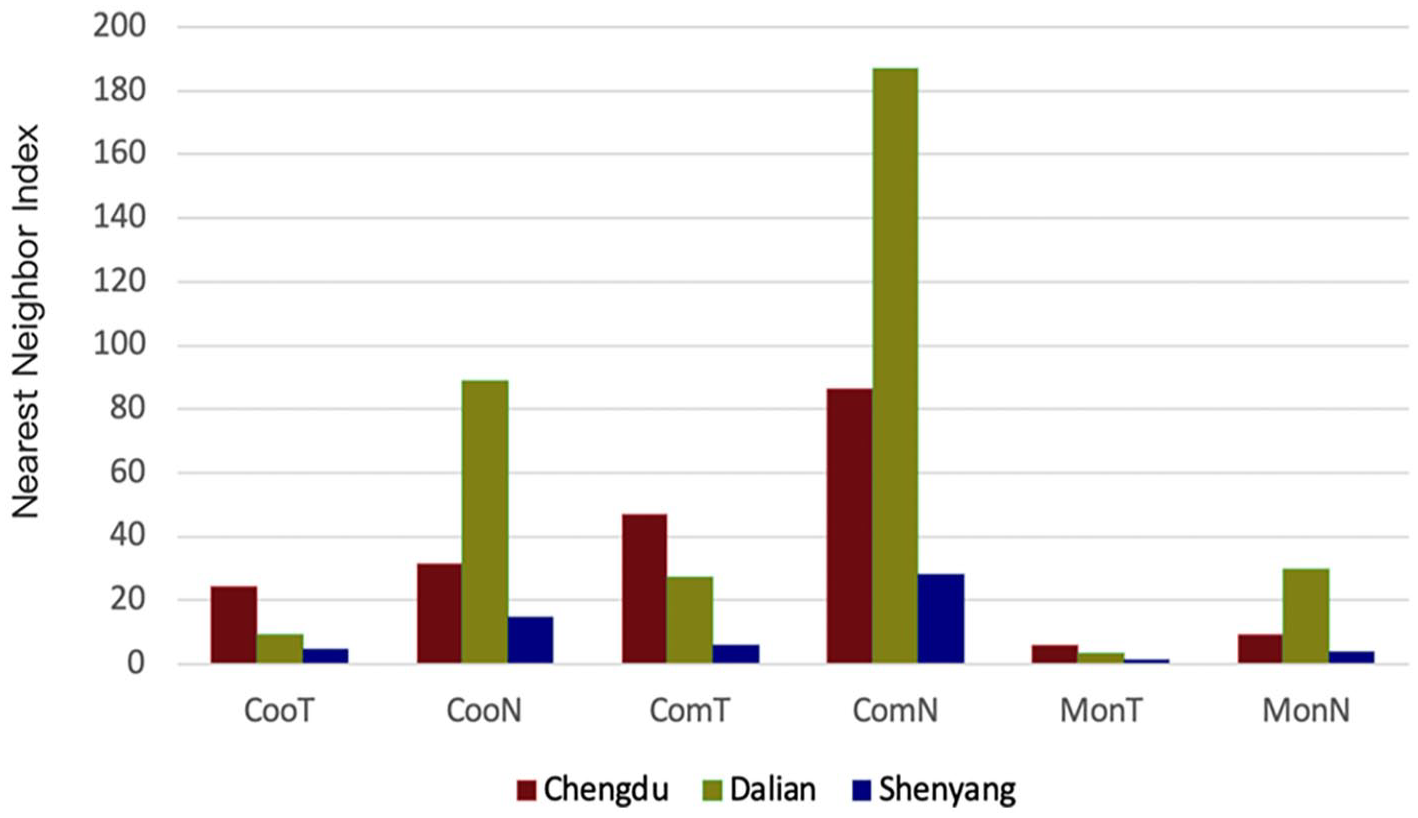
City theme/non-theme attraction nearest neighbor index.
The average nearest neighbor index values for all attractions, themed attractions, and non-themed attractions in each city are shown in Table 4. Chengdu exhibits the highest overall nearest neighbor index (34.11), while Shenyang has the lowest (9.78), indicating a more even distribution of attractions in Chengdu. For themed attractions, Chengdu again scores highest (25.79), and Shenyang scores lowest (3.96), highlighting Chengdu’s well-developed park system and evenly distributed park-related attractions. For non-themed attractions, Dalian achieves a significantly higher nearest neighbor index (101.87) than Chengdu and Shenyang, demonstrating its rich diversity of non-marine resources, such as parks and recreational areas, and a multi-centered urban layout with evenly distributed non-themed attractions.
The nearest neighbor index.
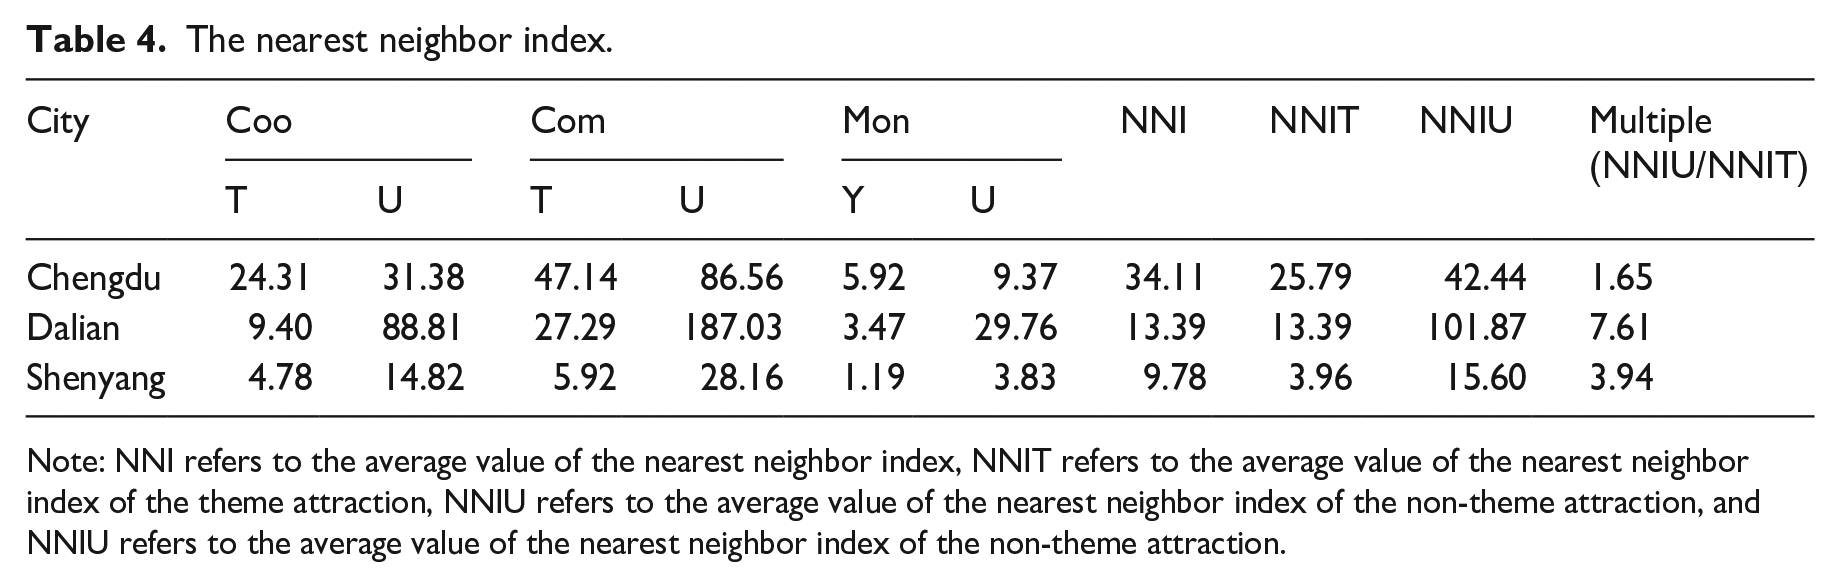
Note: NNI refers to the average value of the nearest neighbor index, NNIT refers to the average value of the nearest neighbor index of the theme attraction, NNIU refers to the average value of the nearest neighbor index of the non-theme attraction, and NNIU refers to the average value of the nearest neighbor index of the non-theme attraction.
Urban tourism networks were mapped to geographic space by treating network nodes as attractions and edges as visitor flows between them. In Chengdu, attractions are densely distributed in central urban districts, such as Wuhou, Jinjiang, Jinniu, and Qingyang, with some renowned attractions located in peripheral areas, including Qionglai, Jianyang, and Longquanshan (Figure 4). Popular attractions like People’s Park, Kuanzhai Alley, and Daci Temple are closely situated, reinforcing visitor flows and forming clusters with strong monopolistic relationships (Figure 5e and f). Under competitive relationships, non-themed attractions exhibit a ring-shaped spatial distribution extending outward compared to themed attractions (Figure 5c and d).
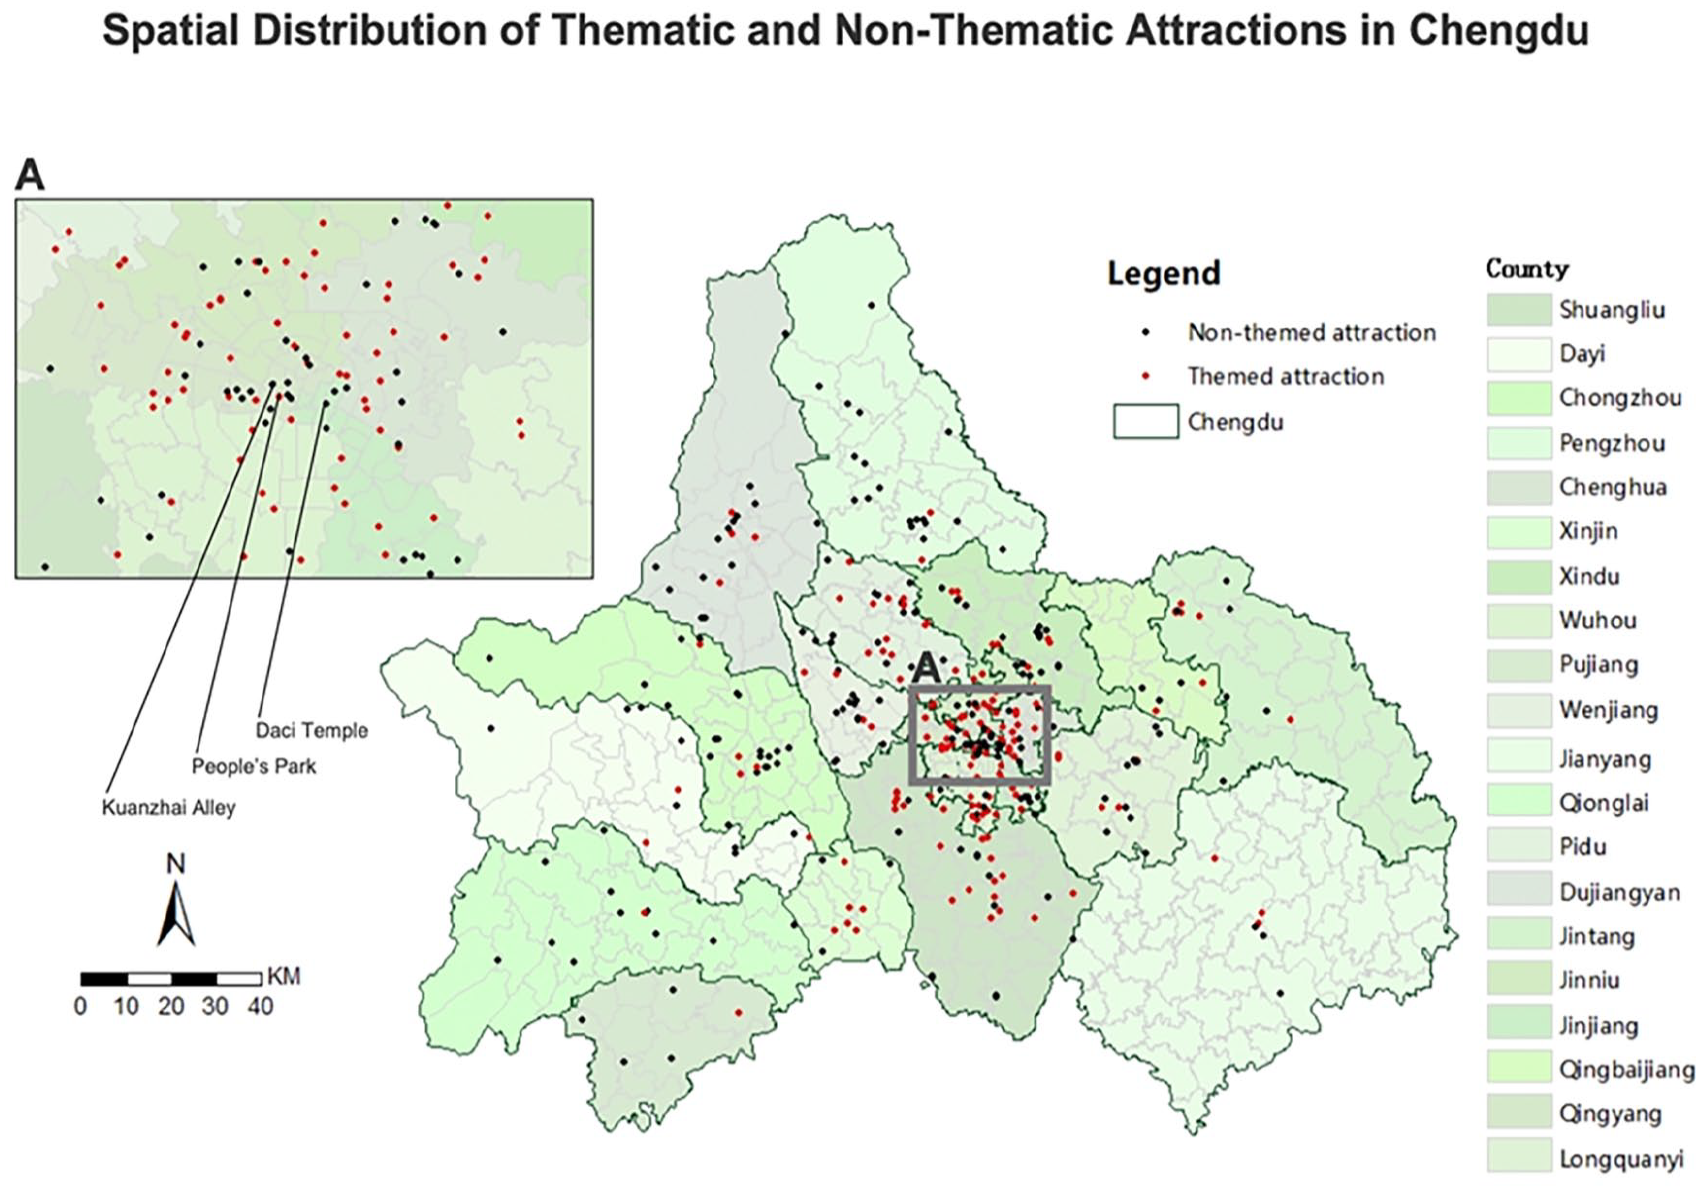
Spatial distribution of thematic and non-thematic attractions in Chengdu.
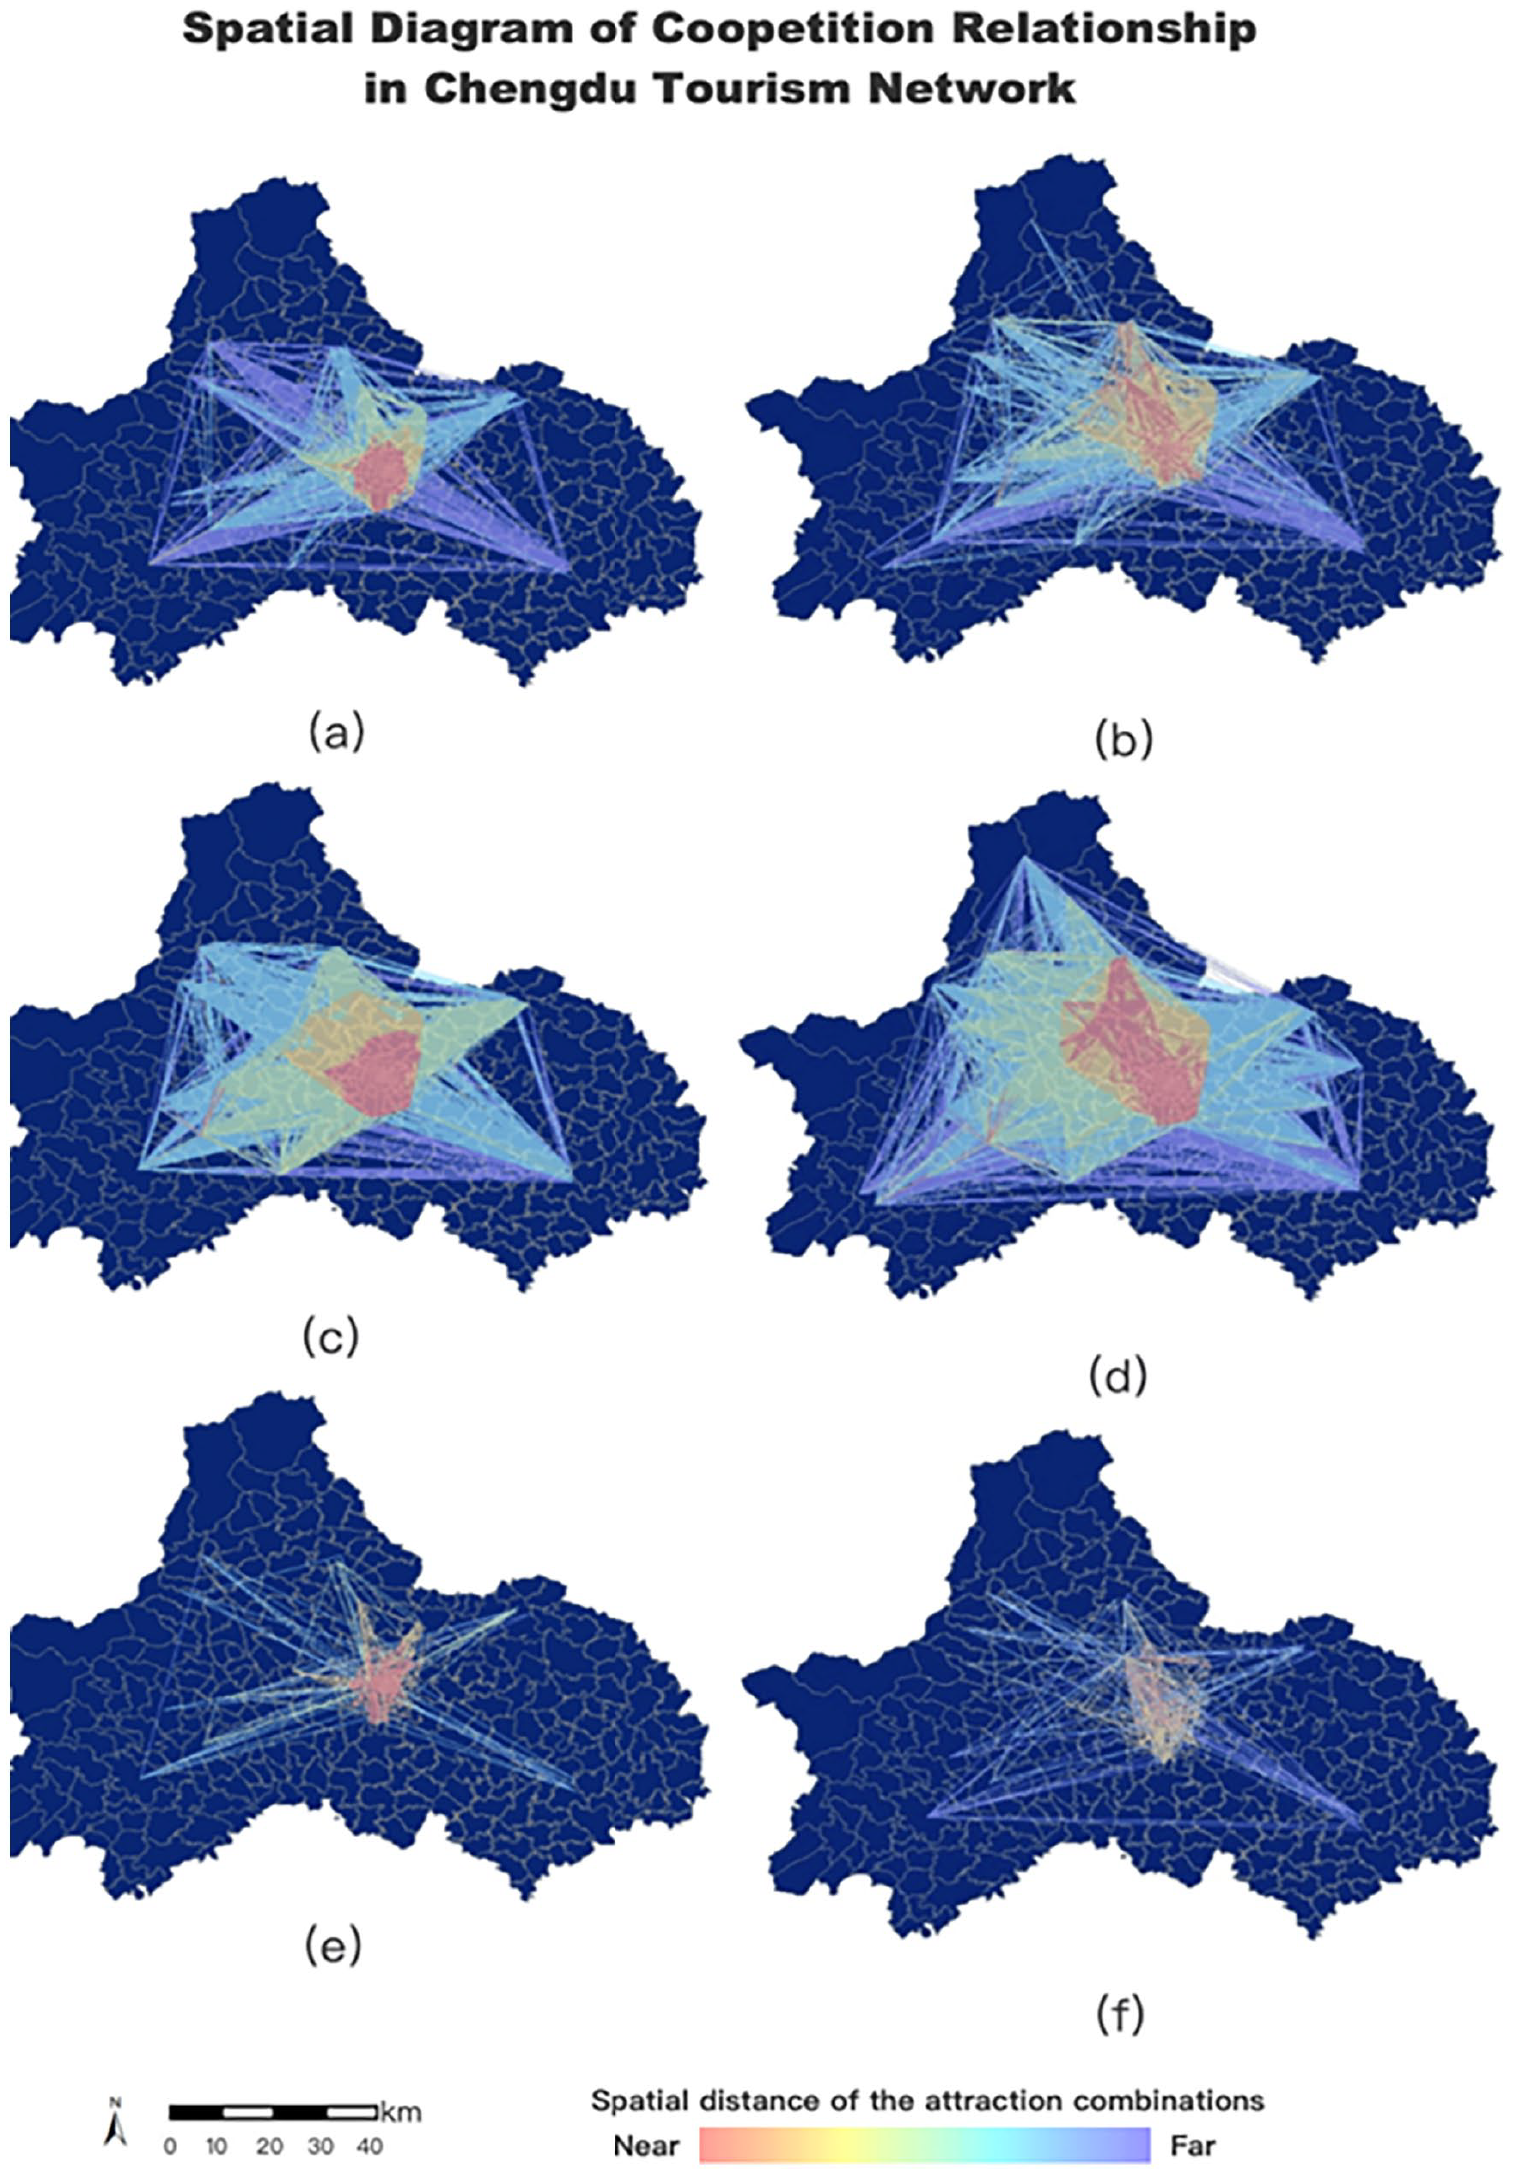
Spatial diagram of competition and cooperation relationship in Chengdu tourism network: (a), (c), and (e) represent the cooperation, competition, and monopoly relationships among themed attractions, respectively, while (b), (d), and (f) depict the cooperation, competition, and monopoly relationships among non-themed attractions.
In Dalian, tourism resources are primarily concentrated in the southwestern districts, such as Shahekou, Lushunkou, and Ganjingzi (Figure 6). While themed attractions like Dalian Western Suburbs National Forest Park and Malan River Sports Park span large areas, they are relatively close spatially, forming a cluster of popular destinations in the city’s southwestern corner (Figure 7e and f). Competitive relationships show themed attractions radiating outward toward Wafangdian and Zhuanghe, while non-themed attractions exhibit a more localized distribution (Figure 7c and d).
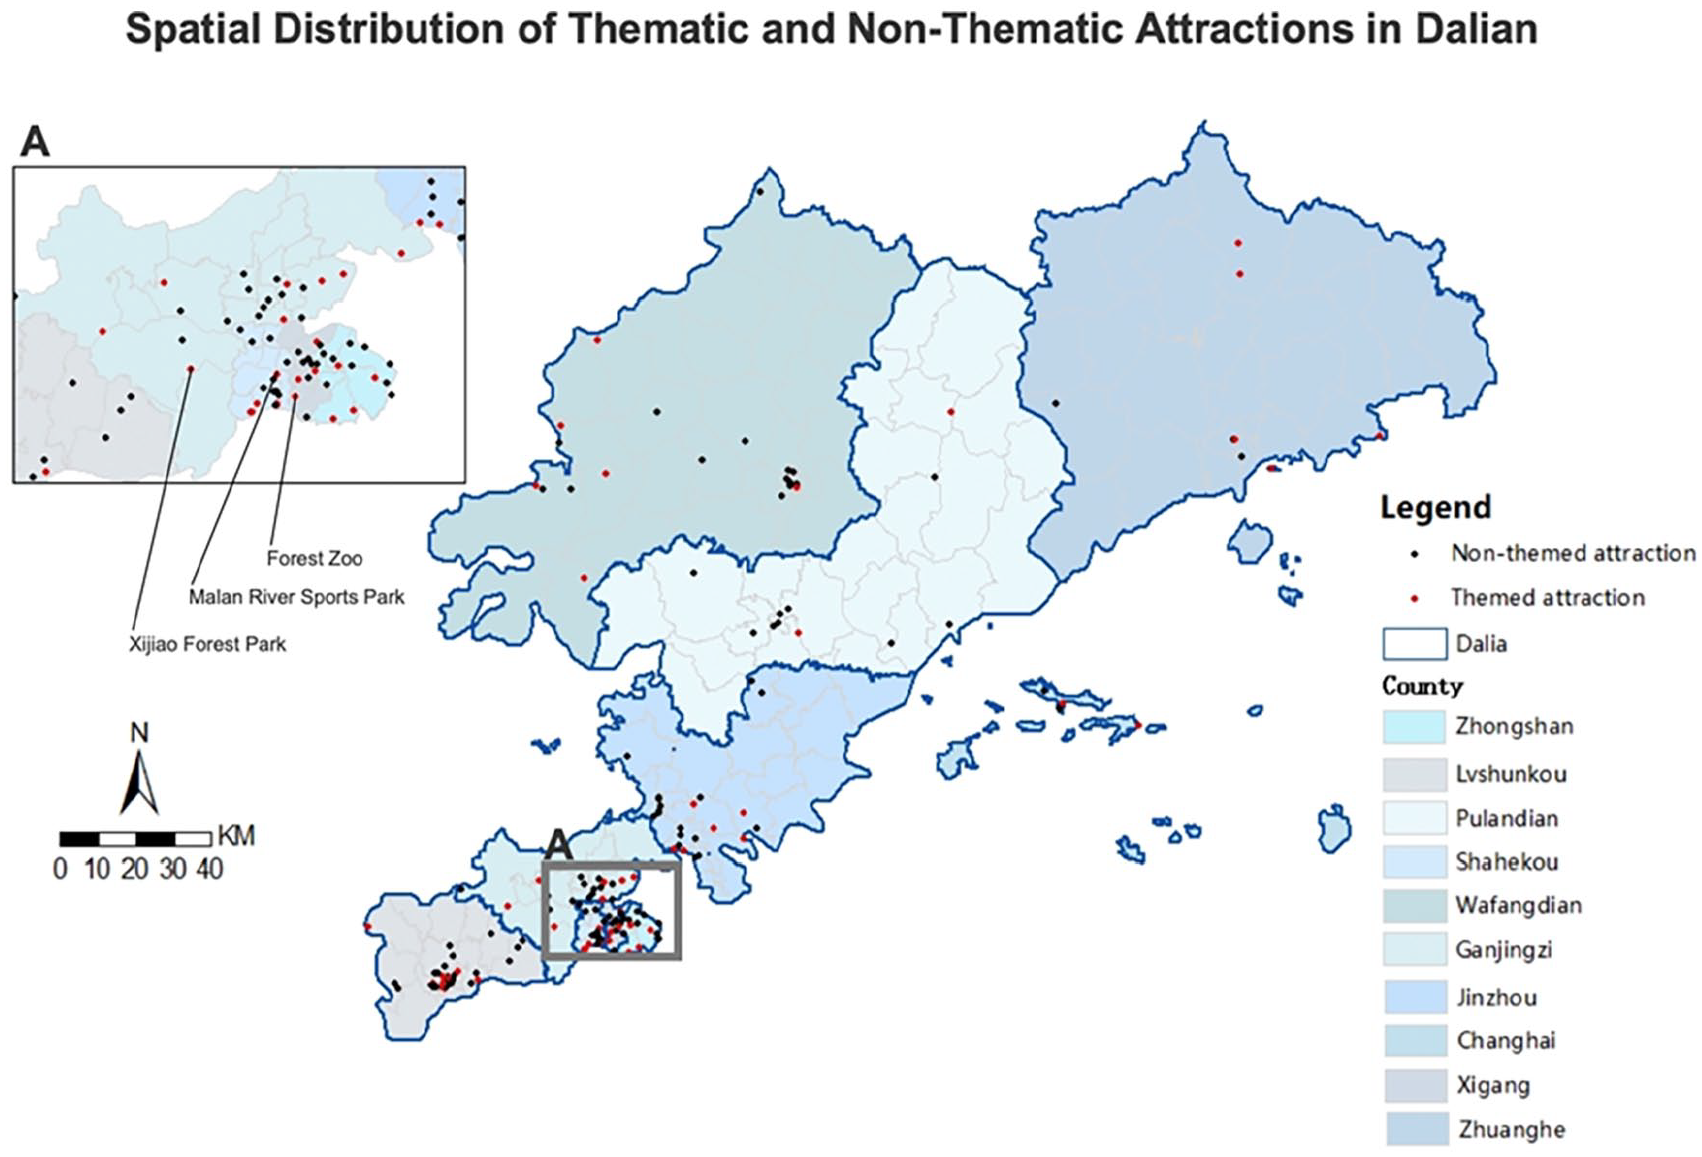
Spatial distribution of thematic and non-thematic attractions in Dalian.
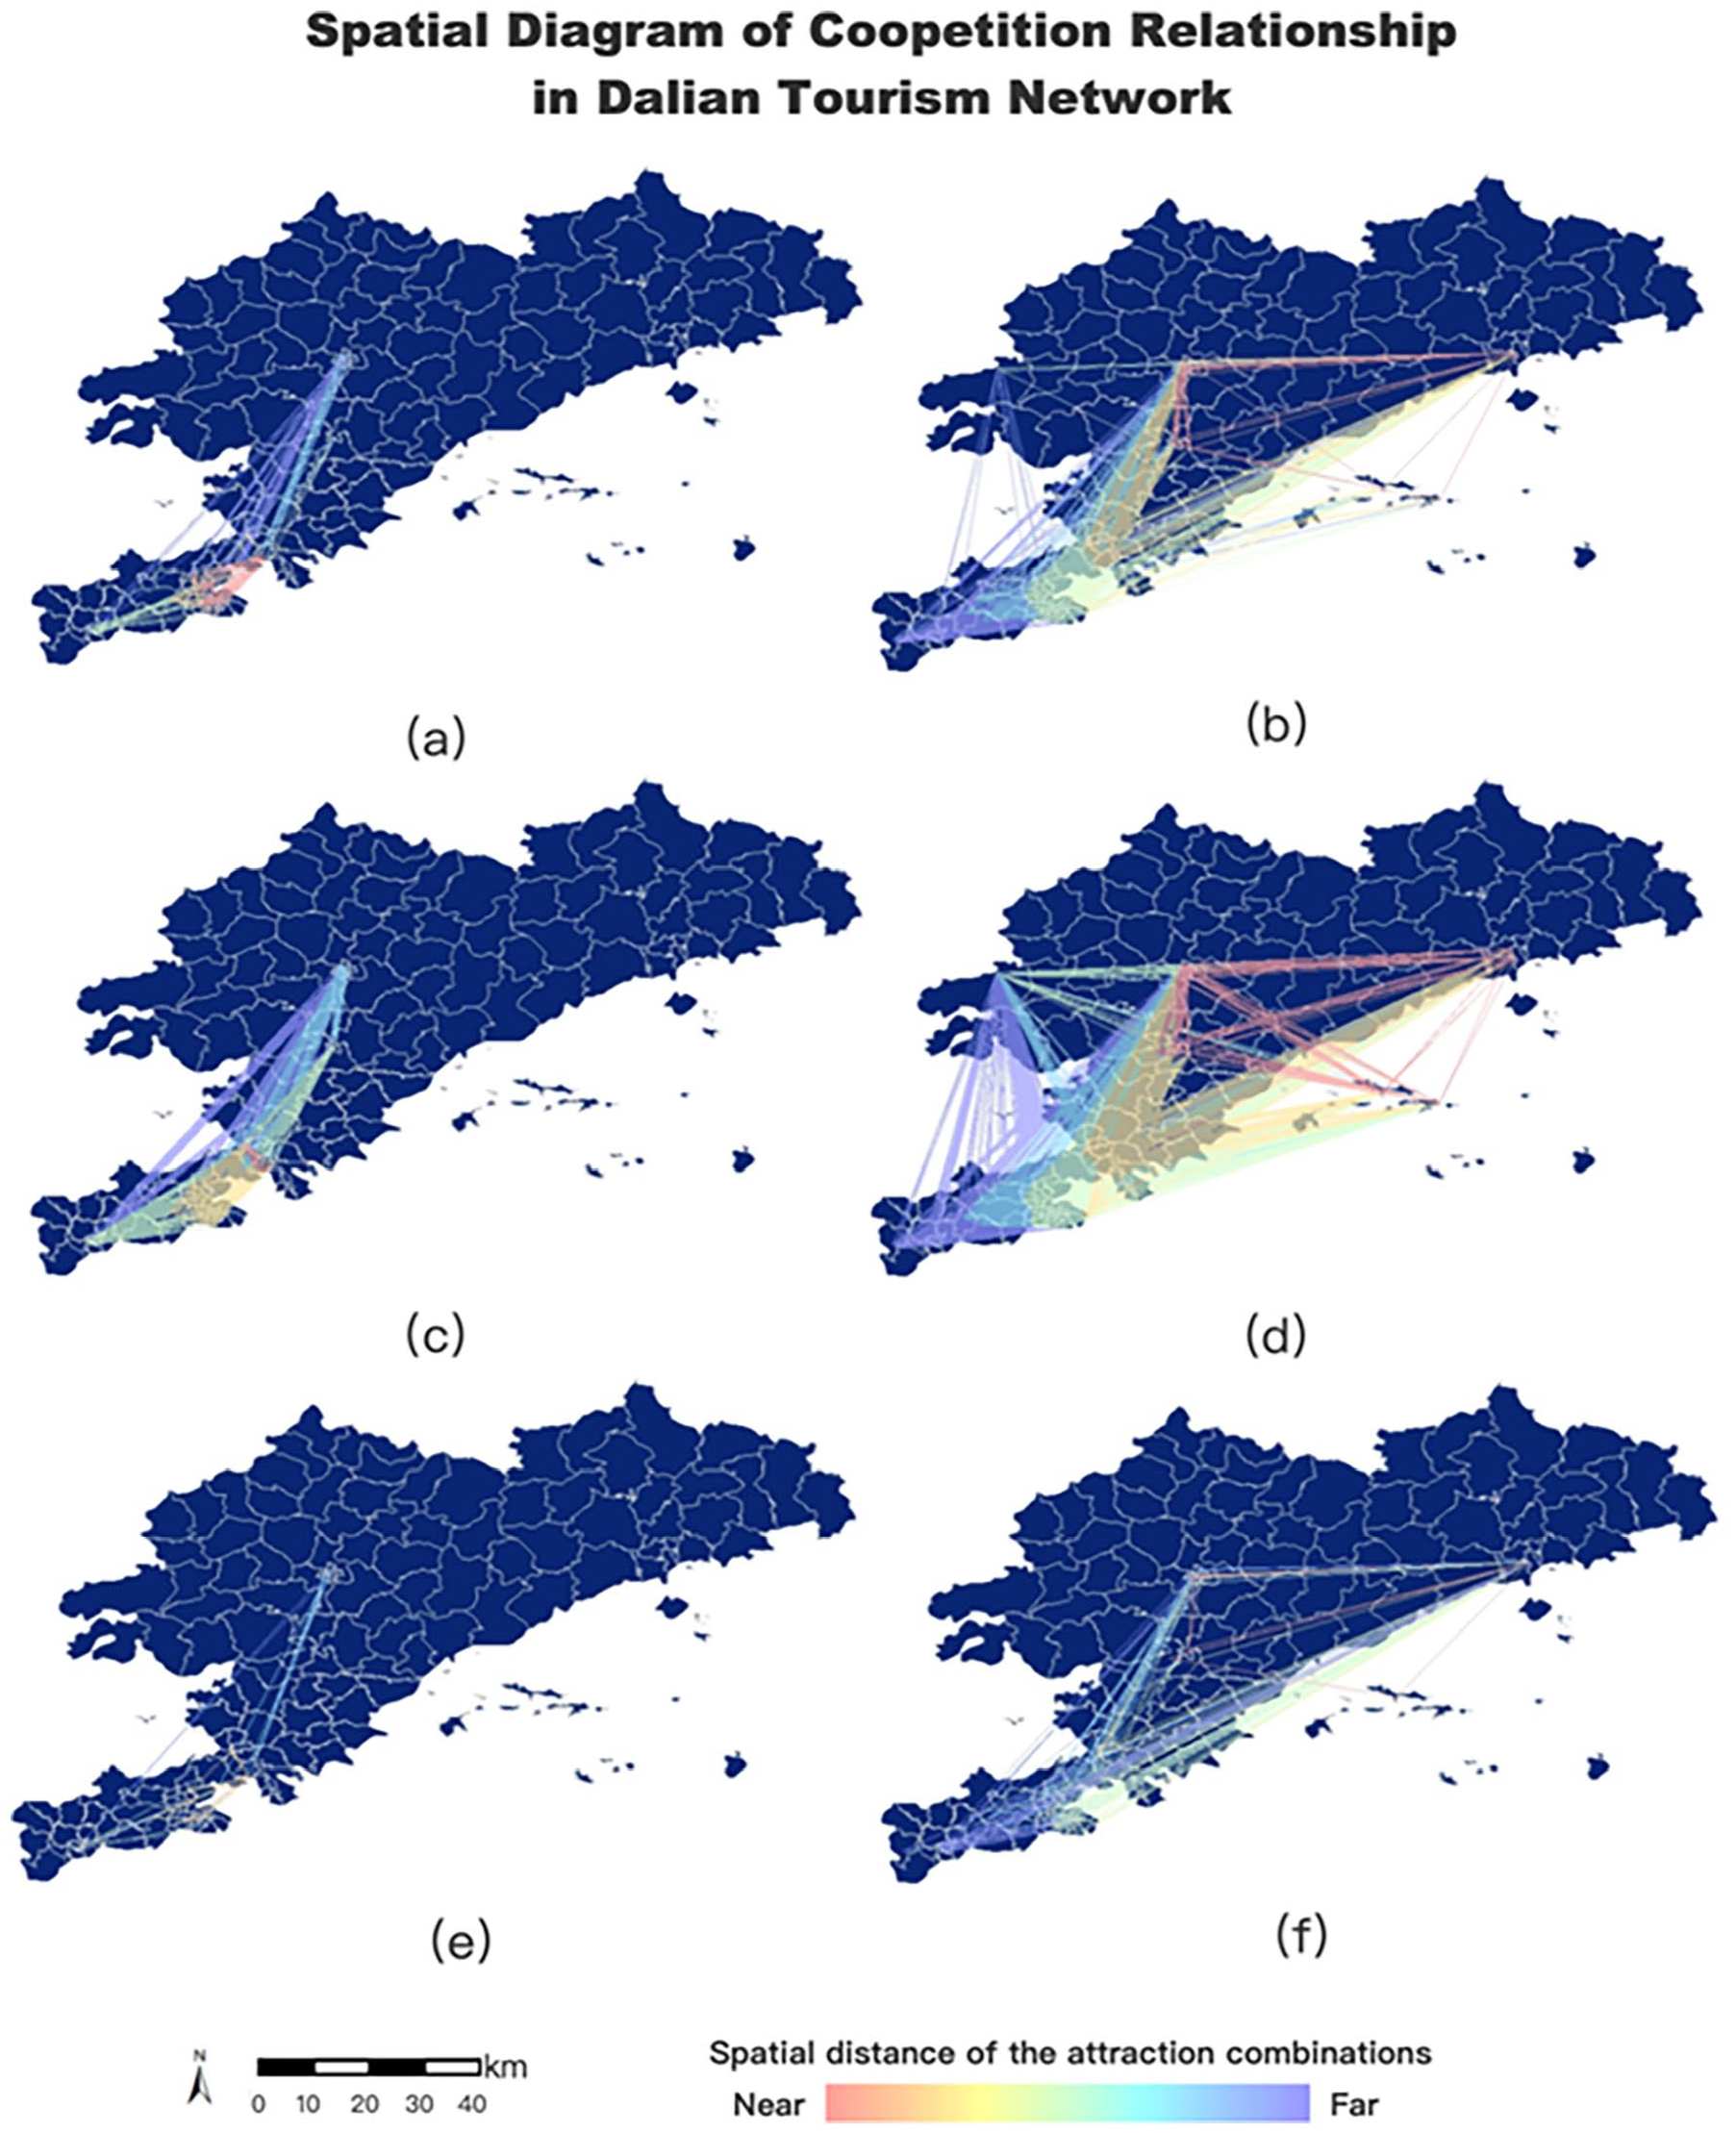
Spatial diagram of competition and cooperation relationship in Dalian tourism network: (a), (c), and (e) represent the cooperation, competition, and monopoly relationships among themed attractions, respectively, while (b), (d), and (f) depict the cooperation, competition, and monopoly relationships among non-themed attractions.
In Shenyang, attractions are concentrated in central districts, such as Huanggu, Heping, Tiexi, and Yuhong (Figure 8). For themed attractions, sites like Liaoning Industrial Exhibition Hall and Shenyang Imperial Palace Museum are spatially close, fostering visitor clusters with monopolistic relationships. For non-themed attractions, popular destinations like Wulihe Park and Nanhu Park also stand out (Figure 9e and f). Competitive relationships show themed attractions extending westward in a strip pattern compared to non-themed attractions (Figure 9c and d).
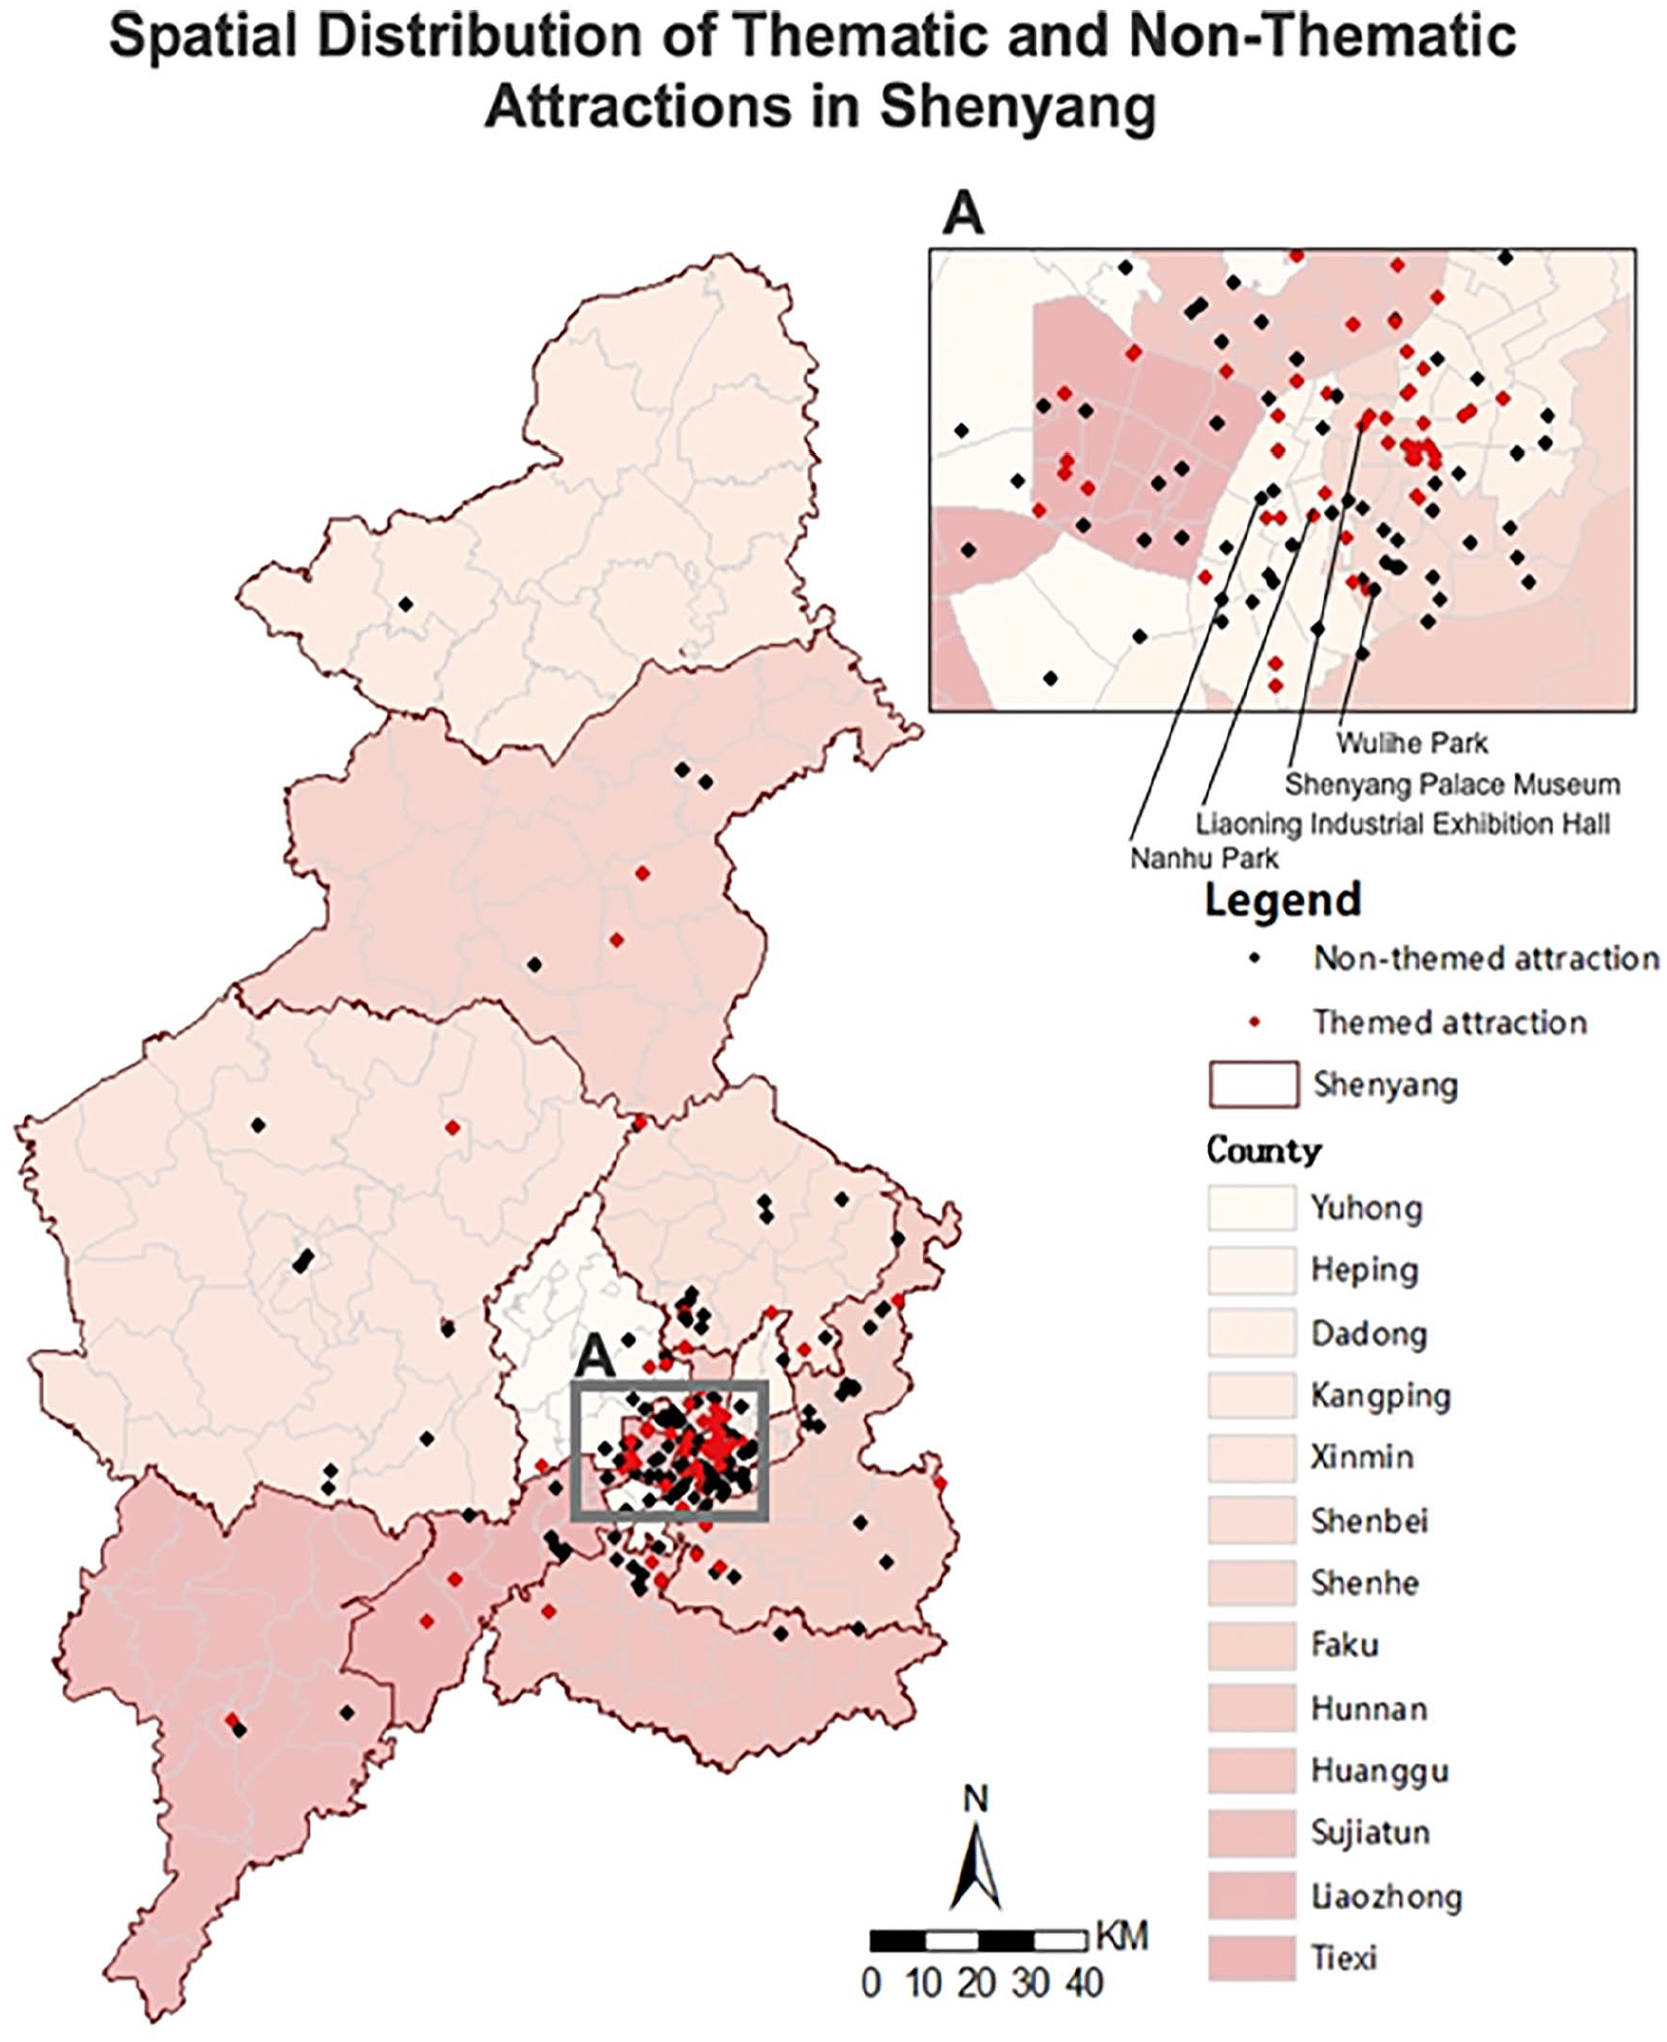
Spatial distribution of thematic and non-thematic attractions in Shenyang.
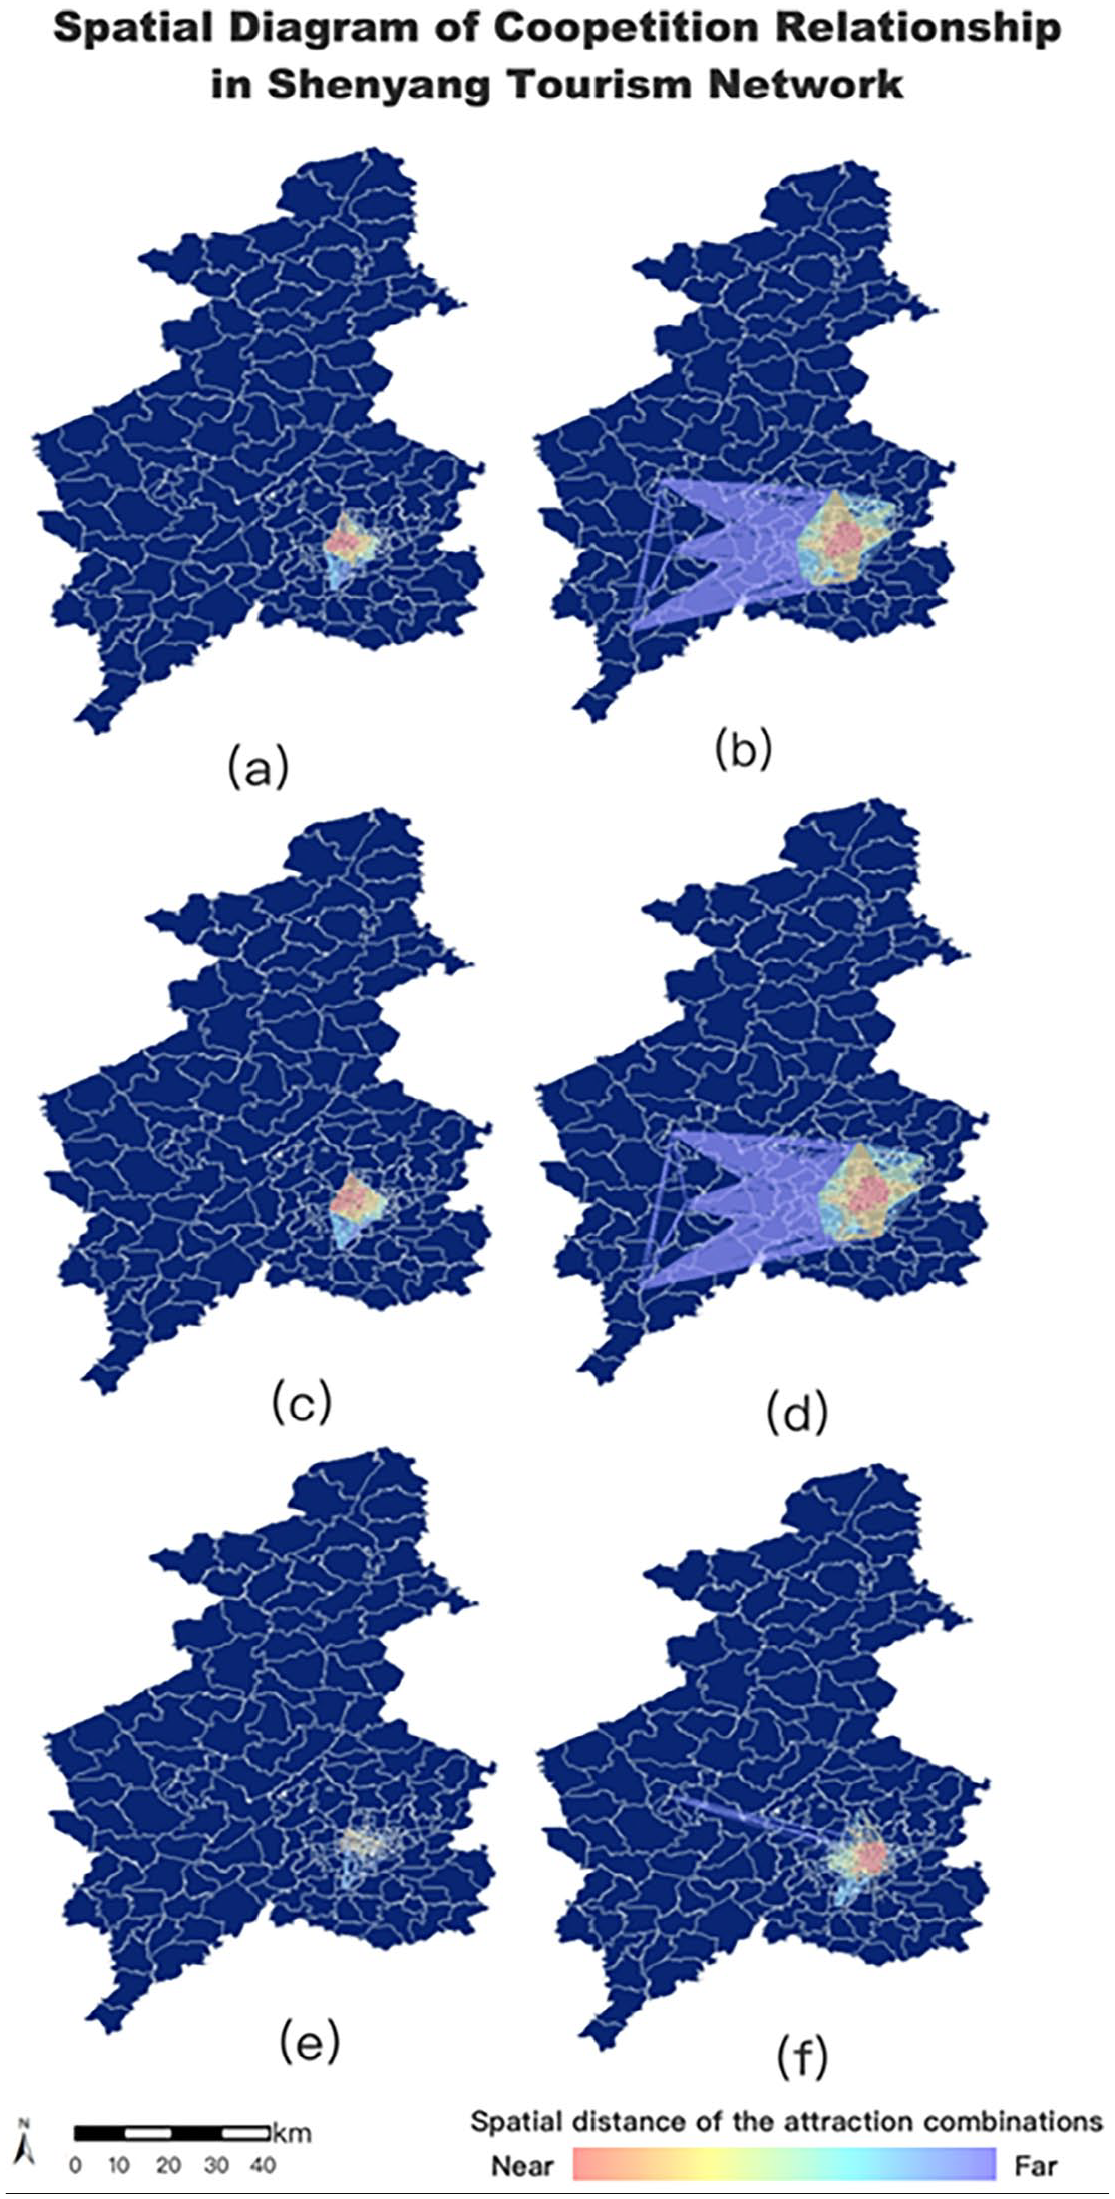
Spatial diagram of competition and cooperation relationship in Shenyang tourism network: (a), (c), and (e) represent the cooperation, competition, and monopoly relationships among themed attractions, respectively, while (b), (d), and (f) depict the cooperation, competition, and monopoly relationships among non-themed attractions.
The spatial distribution of coopetitive relationships aligns closely with attraction locations. Chengdu demonstrates a balanced development of themed and non-themed attractions, with comparable spatial distributions. Dalian and Shenyang, however, exhibit stronger clustering of themed attractions and more concentrated tourism resources. Additionally, themed attractions’ cooperative, competitive, and monopolistic relationships primarily occur in central urban districts, while non-themed attractions expand outward following the city’s spatial structure (e.g., Chengdu’s ring-shaped, Dalian’s radial, and Shenyang’s strip patterns).
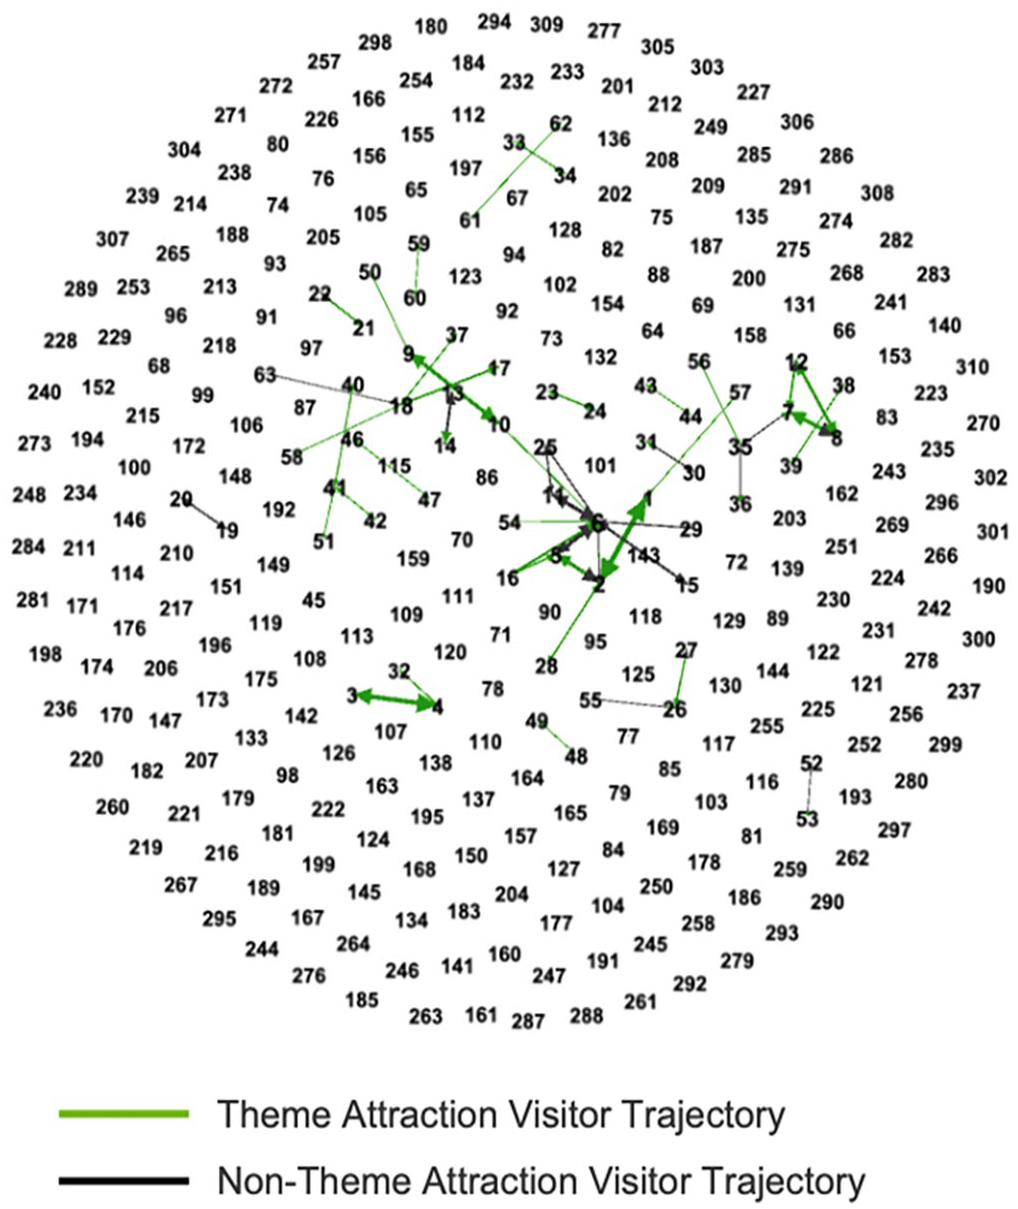
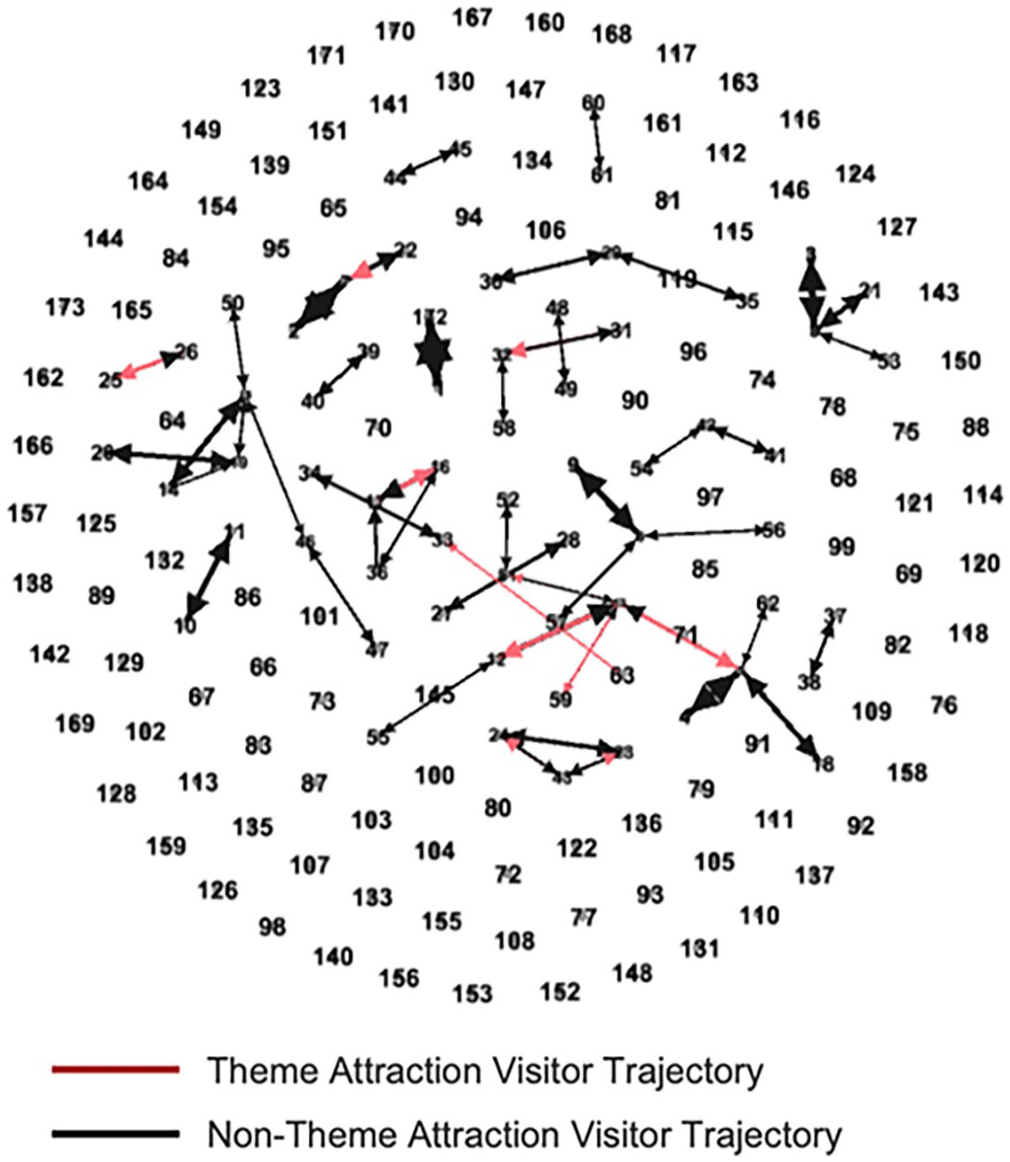
Using Gephi, urban tourism networks for Chengdu, Dalian, and Shenyang were analyzed by retaining strong interaction edges (visitor flows exceeding 10,000) and applying the Fruchterman–Reingold layout algorithm with default parameters. In Chengdu, four core clusters were identified (Figure 10), including T-U clusters like People’s Park-Aoshan Park-Kuanzhai Alley-Ancient Dasheng Temple and UPARK-Tiexiang Temple-Dayuan Central Park, and T-T clusters like Haibin Park-Chengdu Zoo and Xuanhua Gate-Yulei Mountain Park. In Dalian, four core clusters emerged (Figure 11), including T-U clusters like Dalian Western Suburbs National Forest Park-Malan River Sports Park-Dalian Forest Zoo and Yingchun Park-People’s Procuratorate Museum, and T-T clusters like Jiexin Park-Xishan Park and Potaishan Park-Sports Park-Coastal Park. In Shenyang, three core clusters were found (Figure 12), including T-U clusters like Youth Park-Old Dragon Mouth Liquor Museum, T-T clusters like Dafasi Temple-Nanyunhe Belt Park, and U-U clusters like Huguo Yanshou Temple-Bayi Park-Shenyang Xinle Ruins Museum.
Fruchterman–Reingold layout results for theme/non-theme attractions in Chengdu.
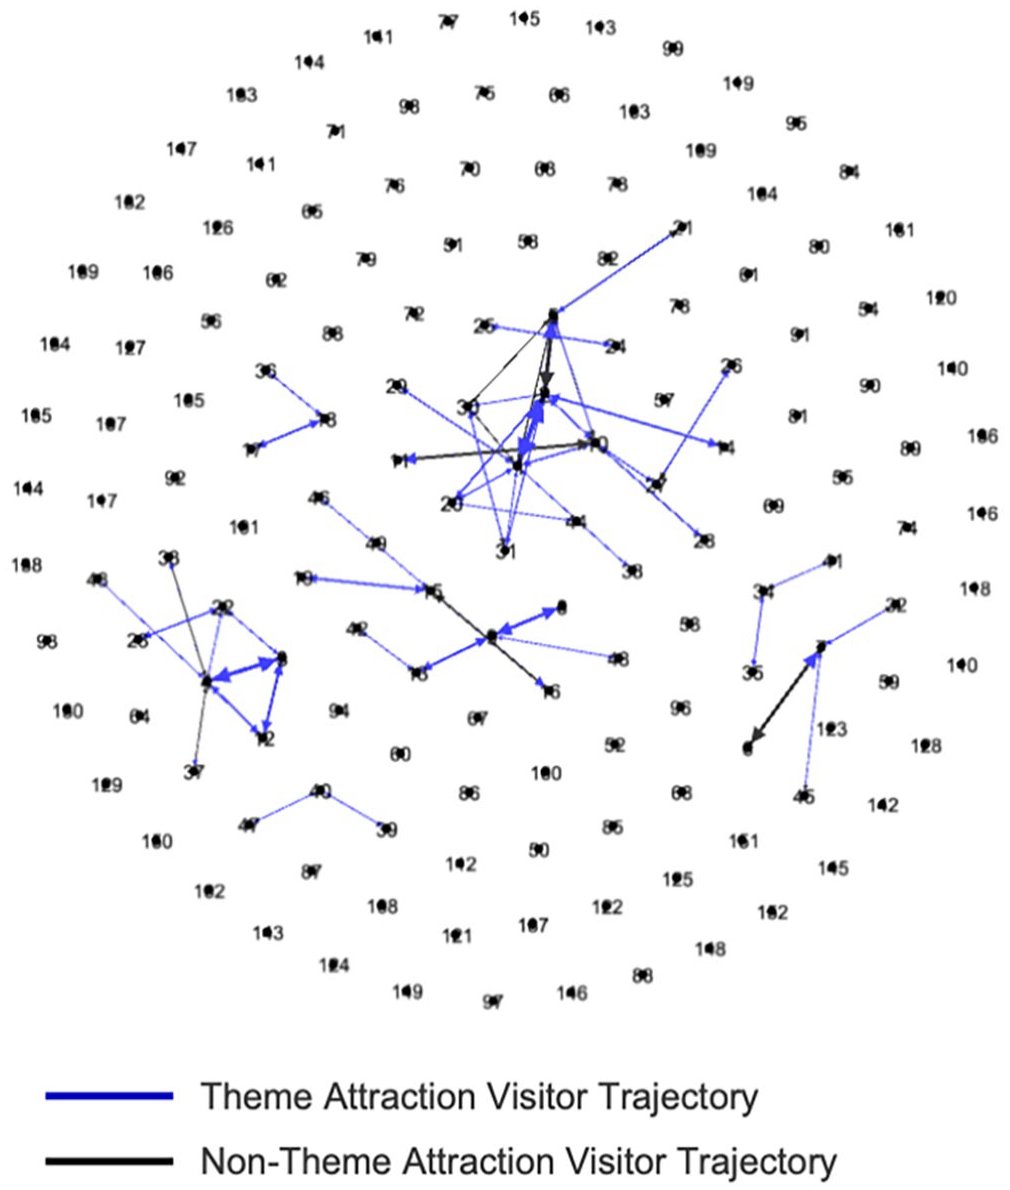
Fruchterman–Reingold layout results for theme/non-theme attractions in Dalian.
Fruchterman–Reingold layout results for theme/non-theme attractions in Shenyang.
Chengdu and Dalian exhibit clear core clusters dominated by T-T and T-U modes, with fewer U-U interactions. In contrast, Shenyang shows more dispersed visitor distribution, with stronger interaction among non-themed attractions, leading to the coexistence of T-T, T-U, and U-U modes. Node sizes represent visitor volume, and edge thickness indicates visitor interaction frequency. Chengdu and Dalian show balanced node-to-edge ratios, while Shenyang demonstrates imbalance, as attractions like Shenyang Expo Park attract high visitor volumes but lack strong connections to surrounding sites. Conversely, parks like Wanliutang Park gain more visitors through stronger interactions with nearby attractions.
Conclusions
This study constructed a tourism network based on tourist trajectory chains, first identifying competitive and cooperative relationships with reference to the concept of motifs, and then analyzing spatial distribution and interaction patterns using GIS parameters and Gephi software. The main conclusions are as follows:
The coopetition relationships among urban tourist attractions exhibit both similarities and differences. In Chengdu, Dalian, and Shenyang, competitive relationships among tourist attractions dominate, followed by cooperative relationships, while monopolistic relationships are relatively weak. This suggests that tourist attractions in these three cities primarily exist in a competitive state during tourist flows, with fewer instances of cooperation or monopoly. Variations in coopetition dynamics reflect not only the unique spatial layouts of tourism resources in each city but also broader systemic factors, such as the clustering of attractions, visitor flow distribution, and the balance between thematic and non-thematic resources. For example, Shenyang demonstrates strong inter-site collaboration due to compact urban planning and cohesive visitor movement patterns, while Chengdu and Dalian reveal more competitive dynamics, particularly among non-thematic attractions. These insights underline the importance of tailored strategies for resource management and collaboration, focusing on optimizing attraction differentiation and addressing specific developmental needs in each city.
The coopetition relationships and spatial distribution of tourist attractions across cities share common characteristics. Themed attractions tend to exhibit strong clustering, while non-themed attractions display a more even distribution of competitive relationships. In all three cities, the cooperative, competitive, and monopolistic relationships of themed attractions are generally concentrated in central urban areas, whereas non-themed attractions expand outward along the urban periphery. Despite differences in attraction layouts and visitor interaction patterns, the pairing patterns of themed and non-themed attractions, as well as the associated tourist flow dynamics, exhibit certain regularities.
Based on the characteristics of tourism resource layouts in Chengdu, Dalian, and Shenyang, the following management recommendations are proposed for each city:
Chengdu: It is recommended to optimize the interaction network among non-themed attractions, strengthen the driving effect of themed attractions, and establish a multi-tiered, circular tourism network. While the distribution of themed and non-themed attractions in Chengdu is relatively balanced, non-themed attractions exhibit significant competitive relationships. Efforts should focus on enhancing interactions among non-themed attractions through cultural, historical, and culinary-themed events to reduce inefficient competition. Additionally, leveraging the driving effect of core attraction clusters, a themed-to-non-themed (T-U) pairing model should be developed to optimize tourist flow management. Given the circular distribution of attractions, the transportation network between core urban and suburban attractions should be improved to create a seamless, multi-tiered tourism system.
Dalian: To enhance the competitiveness of non-themed attractions, the promotion and development of integrated cross-attraction itineraries are recommended. For instance, a combined “marine culture + ecological park + historic district” experience could be introduced. Optimizing transportation support for the radial attraction layout is also essential, improving accessibility between central urban areas and peripheral attractions. Multi-stop tourist routes should be developed to create a closed-loop tourist flow effect. Furthermore, while maintaining the city’s marine resource advantages, cultural and historical themes could be further explored to provide diversified tourism experiences, such as introducing nighttime tourism products and festival activities to extend visitor stay durations.
Shenyang: Enhancing coordination among attractions is suggested, particularly by incorporating isolated attractions into broader interaction networks through improved planning and transportation. For example, combined itineraries like “historical culture + ecological attractions” could be developed. To enhance the appeal of themed attractions, immersive and interactive experience projects should be introduced, alongside diversified exhibitions to attract a wider range of visitors. Given the prominent U-U (non-themed-to-non-themed) interaction pattern among non-themed attractions, infrastructure improvements, service quality optimization, and the integration of thematic elements are recommended to strengthen the competitiveness of these attractions. This would promote a balanced allocation of resources, better distribute tourist flows, and ultimately optimize the overall attraction layout and visitor experience.
This study emphasizes the local characteristics of coopetition relationships within tourist attraction networks, focusing on micro-level interactions based on visitor flows. However, global relationships, such as cross-attraction dependencies, network-wide influences, and interregional connections, remain underexplored. Additionally, factors such as tourist perceptions, preferences, user backgrounds, and urban cultural contexts were not included in this analysis due to data limitations. Future research could integrate these broader dimensions, combining multidimensional datasets and advanced modeling approaches to analyze both local and global coopetition patterns in tourism networks more comprehensively.
In summary, the analysis framework appears highly feasible and adaptable for application to other sources of tourists’ digital footprint data and in different case study locations. Further research could involve integrating multiple sources of tourism mobility data, such as traveler traffic data, travel spending data, social media, and travel review data, to delve deeper into the competitiveness of themed attractions on a global scale and to compare variations between countries and regions. Additionally, longitudinal data could be utilized to capture the dynamic evolution of city-scale spatial coopetition relationships between themed and non-themed attractions, thereby examining the potential impacts of varying tourism policies on these relationships.
Footnotes
Appendix
Shenyang tourist attractions names and corresponding numbers.
| Id | Label |
|---|---|
| 兴华公园 | 1 |
| 宋雨桂艺术馆 | 10 |
| 沈水湾公园 | 100 |
| 地坤湖公园 | 101 |
| 青杨林公园 | 102 |
| 七星公园开阳园 | 103 |
| 冬青游园 | 104 |
| 抚近门 | 105 |
| 奉达公园 | 106 |
| 沈阳科学宫 | 107 |
| 科普公园 | 108 |
| 塔西园 | 109 |
| 和众人口文化公园 | 11 |
| 慈恩寺 | 110 |
| 抗美援朝烈士陵园 | 111 |
| 沈水幸福公园 | 112 |
| 沈阳铁路陈列馆 | 113 |
| 辽宁省博物馆 | 114 |
| 浑南新城中央公园 | 115 |
| 沈阳西湖风景区 | 116 |
| 沈阳仙子湖 | 117 |
| 北塔 | 118 |
| 白塔公园 | 119 |
| 青年公园 | 12 |
| 东塔园 | 120 |
| 沈阳市群众艺术馆 | 121 |
| 宗教活动场所法轮寺 | 122 |
| 蒲河国家湿地公园 | 123 |
| 烈士塔公园 | 124 |
| 喜园婚礼文化主题公园 | 125 |
| 沈阳航空博物馆 | 126 |
| 益格清水湾体育 | 127 |
| 新城公园 | 128 |
| 北斗公园 | 129 |
| 辽宁工业展览馆 | 13 |
| 浑河西峡谷生态公园 | 130 |
| 翠园 | 131 |
| 沈阳世博园 | 132 |
| 中国工业博物馆 | 133 |
| 基督造化教堂 | 134 |
| 浑河堡教会 | 135 |
| 回龙岗革命公墓 | 136 |
| 天后宫 | 137 |
| 沈阳市蓬瀛宫 | 138 |
| 细河悠谷公园 | 139 |
| 皇姑清真寺 | 14 |
| 杨宇霆公馆旧址 | 140 |
| 界园 | 141 |
| 和平公园 | 142 |
| 沈采公园 | 143 |
| 瑞丰园 | 144 |
| 沈阳怪坡风景区 | 145 |
| 远大湿地公园 | 146 |
| 沈阳三农博览园 | 147 |
| 沈阳东陵公园 | 148 |
| 二龙山 | 149 |
| 碧塘公园 | 15 |
| 东湖公园 | 150 |
| 长胜公园 | 151 |
| 三皇庙遗址 | 152 |
| 沈阳国家森林公园 | 153 |
| 沙岭基督教堂 | 154 |
| 蒲河大溪地公园 | 155 |
| 沈阳市纪念林 | 156 |
| 爱新觉罗皇家博物馆 | 157 |
| 龙泉古园 | 158 |
| 沈阳市城市规划展览馆 | 159 |
| 怀远门 | 16 |
| 盛京驿站文化古城 | 160 |
| 七星山 | 161 |
| 森林湖 | 162 |
| 大清寺 | 163 |
| 辽滨塔 | 164 |
| 小鲸鱼岛 | 165 |
| 欧园会议中心 | 166 |
| 陨石山森林公园 | 167 |
| 五龙山 | 168 |
| 华夏饮食文化博物馆 | 169 |
| 沈阳故宫博物馆 | 17 |
| 张强镇公园 | 170 |
| 鹭岛湖生态风景区 | 171 |
| 康乐园 | 172 |
| 新蒲岛公园 | 173 |
| 金昌镐寓所旧址 | 18 |
| 克俭公园 | 19 |
| 仙女湖公园 | 2 |
| 护国延寿寺 | 20 |
| 劳动公园 | 21 |
| 工人村生活馆 | 22 |
| 大法寺 | 23 |
| 枫露公园 | 24 |
| 淮河公园 | 25 |
| 皇姑屯事件历史博物馆 | 26 |
| 八一公园 | 27 |
| 辽宁总站 | 28 |
| 铁西区森林公园 | 29 |
| 河畔公园 | 3 |
| 建设公园 | 30 |
| 产业金融博物馆 | 31 |
| 中山公园 | 32 |
| 沈海园 | 33 |
| 沈阳二战盟军战俘营旧址 | 34 |
| 铁西清真寺 | 35 |
| 太清宫 | 36 |
| 保利方溪湖公园 | 37 |
| 沈阳市于洪溪水报恩寺 | 38 |
| 沈阳市万柳塘公园 | 39 |
| 龙王庙公园 | 4 |
| 万泉公园 | 40 |
| 沈阳市砂山基督教教堂 | 41 |
| 罗士圈生态公园 | 42 |
| 沈阳大学自然博物馆 | 43 |
| 环卫工人公园 | 44 |
| 黄海公园 | 45 |
| 北陵公园 | 46 |
| 沈阳新乐遗址博物馆 | 47 |
| 阅香湖公园 | 48 |
| 丁香湖 | 49 |
| 南湖公园 | 5 |
| 百鸟双拥园 | 50 |
| 南运河带状公园 | 51 |
| 领事馆绿地 | 52 |
| 金山公园 | 53 |
| 长白岛森林公园 | 54 |
| 皂角园 | 55 |
| 天坛园 | 56 |
| 南塔公园 | 57 |
| 体育公园 | 58 |
| 鲁迅儿童公园 | 59 |
| 五里河公园 | 6 |
| 潢南河带状公园 | 60 |
| 湖滨公园 | 61 |
| 东北解放纪念碑 | 62 |
| 老龙口酒博物馆 | 63 |
| 长青公园 | 64 |
| 劳模园 | 65 |
| 南中园 | 66 |
| 浑南市民公园 | 67 |
| 张氏帅府博物馆 | 68 |
| 鲁迅公园 | 69 |
| 劳动公园(卫工南街) | 7 |
| 浑河晚渡公园 | 70 |
| 方家栏公园 | 71 |
| 东新园 | 72 |
| 中国审判日本战犯法庭旧址陈列馆 | 73 |
| 于洪怒江公园 | 74 |
| 周恩来同志少年读书旧址 | 75 |
| 龙潭荷花湖度假公园 | 76 |
| 沈阳鸟岛 | 77 |
| 砂山公园 | 78 |
| 沈阳皇姑首府基督教堂 | 79 |
| 迎春湖 | 8 |
| 南清真寺 | 80 |
| 沈阳国际展览中心 | 81 |
| 浑河森林公园 | 82 |
| 沈河园 | 83 |
| 九一八历史博物馆 | 84 |
| 皇姑英雄公园 | 85 |
| 和睦公园 | 86 |
| 舍利塔滩地公园 | 87 |
| 七星海世界主题乐园 | 88 |
| 沈阳方特欢乐世界 | 89 |
| 奥林匹克生态公园 | 9 |
| 云峰园 | 90 |
| 大佛寺 | 91 |
| 沈阳劳动模范纪念馆 | 92 |
| 七星公园玉衡园 | 93 |
| 和泰公园 | 94 |
| 滑翔公园 | 95 |
| 腾飞公园 | 96 |
| 辽宁古生物博物馆 | 97 |
| 沈阳市园林植物标本公园 | 98 |
| 大东公园 | 99 |
Declaration of conflicting interests
The author(s) declared no potential conflicts of interest with respect to the research, authorship, and/or publication of this article.
Funding
The author(s) disclosed receipt of the following financial support for the research, authorship, and/or publication of this article: This work was supported by the National Natural Science Foundation of China (Grant No. 42371411).