
Abstract
The post-pandemic era presents dual challenges for urban recovery: overcoming its impacts and shaping a new socio-economic pattern. Promoting urban recovery through non-pharmaceutical intervention is crucial. This study examines the impacts of built environment on urban socio-economic recovery in Metropolitan Nagoya in the post-pandemic period. Here we find that the geographical weighted random forest (GWRF) model has a better performance on urban recovery in central districts (kappa value is 67 ± 18%) compared to the peripheral areas in Nagoya, Japan. The balance of jobs and housing pre-pandemic emerges as crucial factor in urban recovery, especially in the low recovery level area. Moreover, accessibility to secondary roads notably promotes urban recovery in central area, while this factor also introduces the risk of lower recovery levels. By integrating nonlinear and spatial methodology, this study offers policymakers crucial insights into how different built environment can impact urban socio-economic recovery and environmental sustainability as the pandemic becoming frequently.
Keywords
Introduction
The outbreak of the novel coronavirus (COVID-19) unexpectedly disrupted global economic and social progress, especially in densely populated major cities (Wang et al., 2022). To address the urgent needs of epidemic control, many cities implemented strict measures such as lockdowns and work stoppages, which played a crucial role in containing the rapid and widespread spread of the virus. Consequently, these epidemic control policies undoubtedly led to a significant reduction in social and economic activities, culminating in urban decline. As the WTO declared that COVID-19 no longer constitutes a public health emergency of international concern, governments have initiated economic and social recovery plans for the post-pandemic period. Given that cities are typically hotspots for COVID-19 infections due to their high concentration of population and economic activities, urban recovery has become a key element of society’s overall recovery. The post-COVID-19 recovery of cities should be assessed by studying the impact of various factors related to COVID-19 transmission and closely linked to the urban built environment.
Existing studies have mostly focused on the impact of the built environment on the spread of pandemic, but the built environment is equally crucial for urban recovery in the post-pandemic pandemic. The enduring interaction between the built environment and infectious diseases has been evident since the beginning of urbanization, making the urban built environment a key determinant of urban recovery, especially after the devastation caused by pandemics (Frumkin, 2021). The urban built environment influences the city’s recovery from COVID-19 to varying degrees. These built environment factors include the distribution of parks, the distribution of public transportation facilities, the number of campuses, the density of residential land use, land use, open space, and sports and recreational facilities (Keenan, 2020). Existing studies have largely focused on the relationship between spatial characteristics and post-pandemic urban recovery. For example, Ma et al. (2023) find that suburban regions with lower population densities have achieved a higher degree of recovery when compared to central areas. There is a correlation between nightlife and commercial activities and a higher level of recovery (Ma et al., 2021). Areas with many non-residential buildings recover more slowly. For areas with high levels of socio-economic activity, more large parks and open spaces facilitate urban recovery (Dong et al., 2022), while transportation services have unequal contributions to urban recovery (Li et al., 2023). Expanding research on the built environment’s impact on post-epidemic urban recovery is essential, which can provide targeted non-pharmaceutical interventions during both the epidemic transmission and recovery phases, thereby enhancing urban resilience more precisely.
As for factors used to explain the urban recovery during the COVID-19 pandemic, government support, land use, socio-economic indicators, and urbanization levels are often used (Chu et al., 2021; Dueñas et al., 2021; Xu et al., 2021). However, urban environments are complex systems that benefit from a broader range of variables. For example, research highlighting the importance of green space accessibility in London after the COVID-19 pandemic pointed out its role in alleviating psychological distress (Lee and Lee, 2021). Additionally, studies in Northeast China have shown the significance of industrial ratios and governance efficacy in regional economic resurgence (Hu et al., 2022). These findings emphasize the need for a more comprehensive perspective that includes built environment factors alongside economic and demographic components.
Advances in machine learning offer robust alternatives for uncovering latent patterns in complex datasets, which are widely used in urban studies. Techniques like random forests and support vector machines (Nandam and Patel, 2021; Niu et al., 2020) have proven effective in various contexts. Moreover, deep learning has gained traction for tasks like urban growth modeling and land use classification, utilizing methods such as artificial neural networks and convolutional neural networks (Maithani, 2009; Vali et al., 2020). Despite their predictive capabilities, many machine learning models still neglect geo-related variables, particularly spatial heterogeneity, and dependence. Spatial dependence refers to the interrelations between observations within geographic spaces, suggesting that proximity usually implies greater correlation (Smith and LeSage, 2004). Spatial heterogeneity captures variations at different locations, often stemming from natural processes and human activities (Grimm et al., 2000). These overlookings can lead to diminished accuracy in models, underscoring the need for their integration in quantitative urban analysis.
In this study, we used a combination of mobility data and multi-source spatial data to conduct a comprehensive analysis investigating the impact of the built environment on urban socio-economic recovery post-pandemic. To address concerns of spatial heterogeneity, we employed the GWRF approach and investigated how these effects vary across different thresholds. By doing so, our study aims to provide valuable insights into the fine-grained intervention of the built environment that promotes urban recovery from pandemics as a strategy for improving urban resilience.
Data and methods
Study area
Our research focuses on the whole Nagoya City in Japan, as shown in Figure 1. Nagoya is the fourth most populous city proper, with a population of 2.3 million in 2020, and the principal city of the Chukyo metropolitan area, which is the third most populous metropolitan area in Japan. We selected the period after the lifting of the national state of emergency declaration and compared it with the same period in 2019 as the baseline. Specifically, the Nagoya government declared a state of emergency for the first time to prevent the further spread of COVID-19 from April 10, 2020. This declaration led to zero daily infections in Nagoya on May 15, 2020, lasting for 23 days. In this study, the period from May 26 (Tuesday) to June 1 (Monday), 2020, was selected to represent a recovery phase, marking the first week after the lifting of the emergency declaration with no new reported infections. For comparison, the period from May 28 (Tuesday) to June 3 (Monday), 2019, was chosen to represent the pre-COVID-19 baseline.
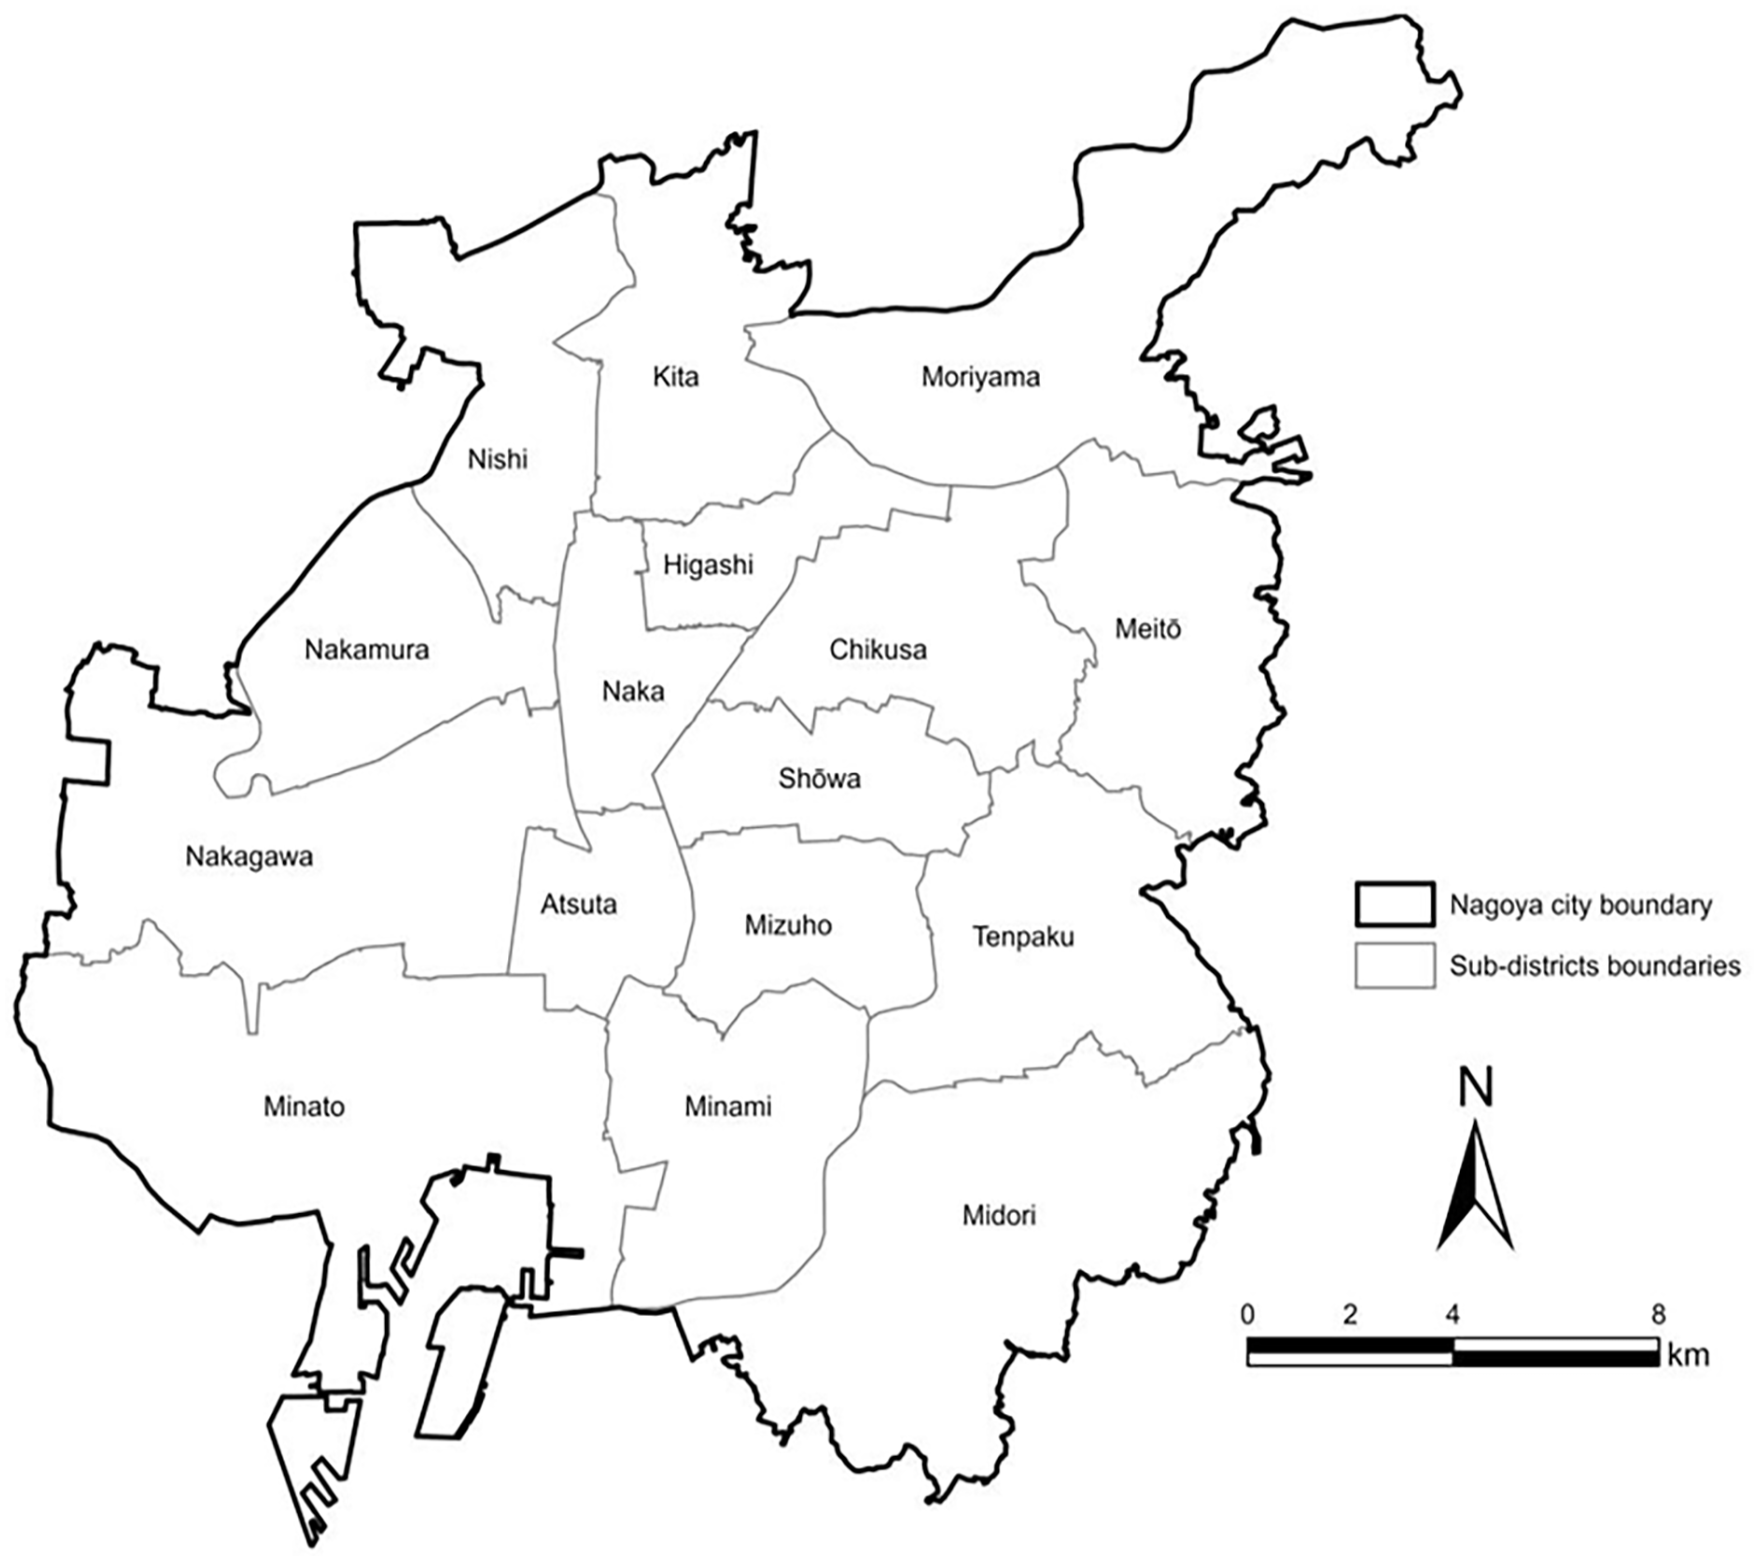
Distribution of Nagoya City districts.
Research data
Research methods
Here URi represents the urban recovery condition in the
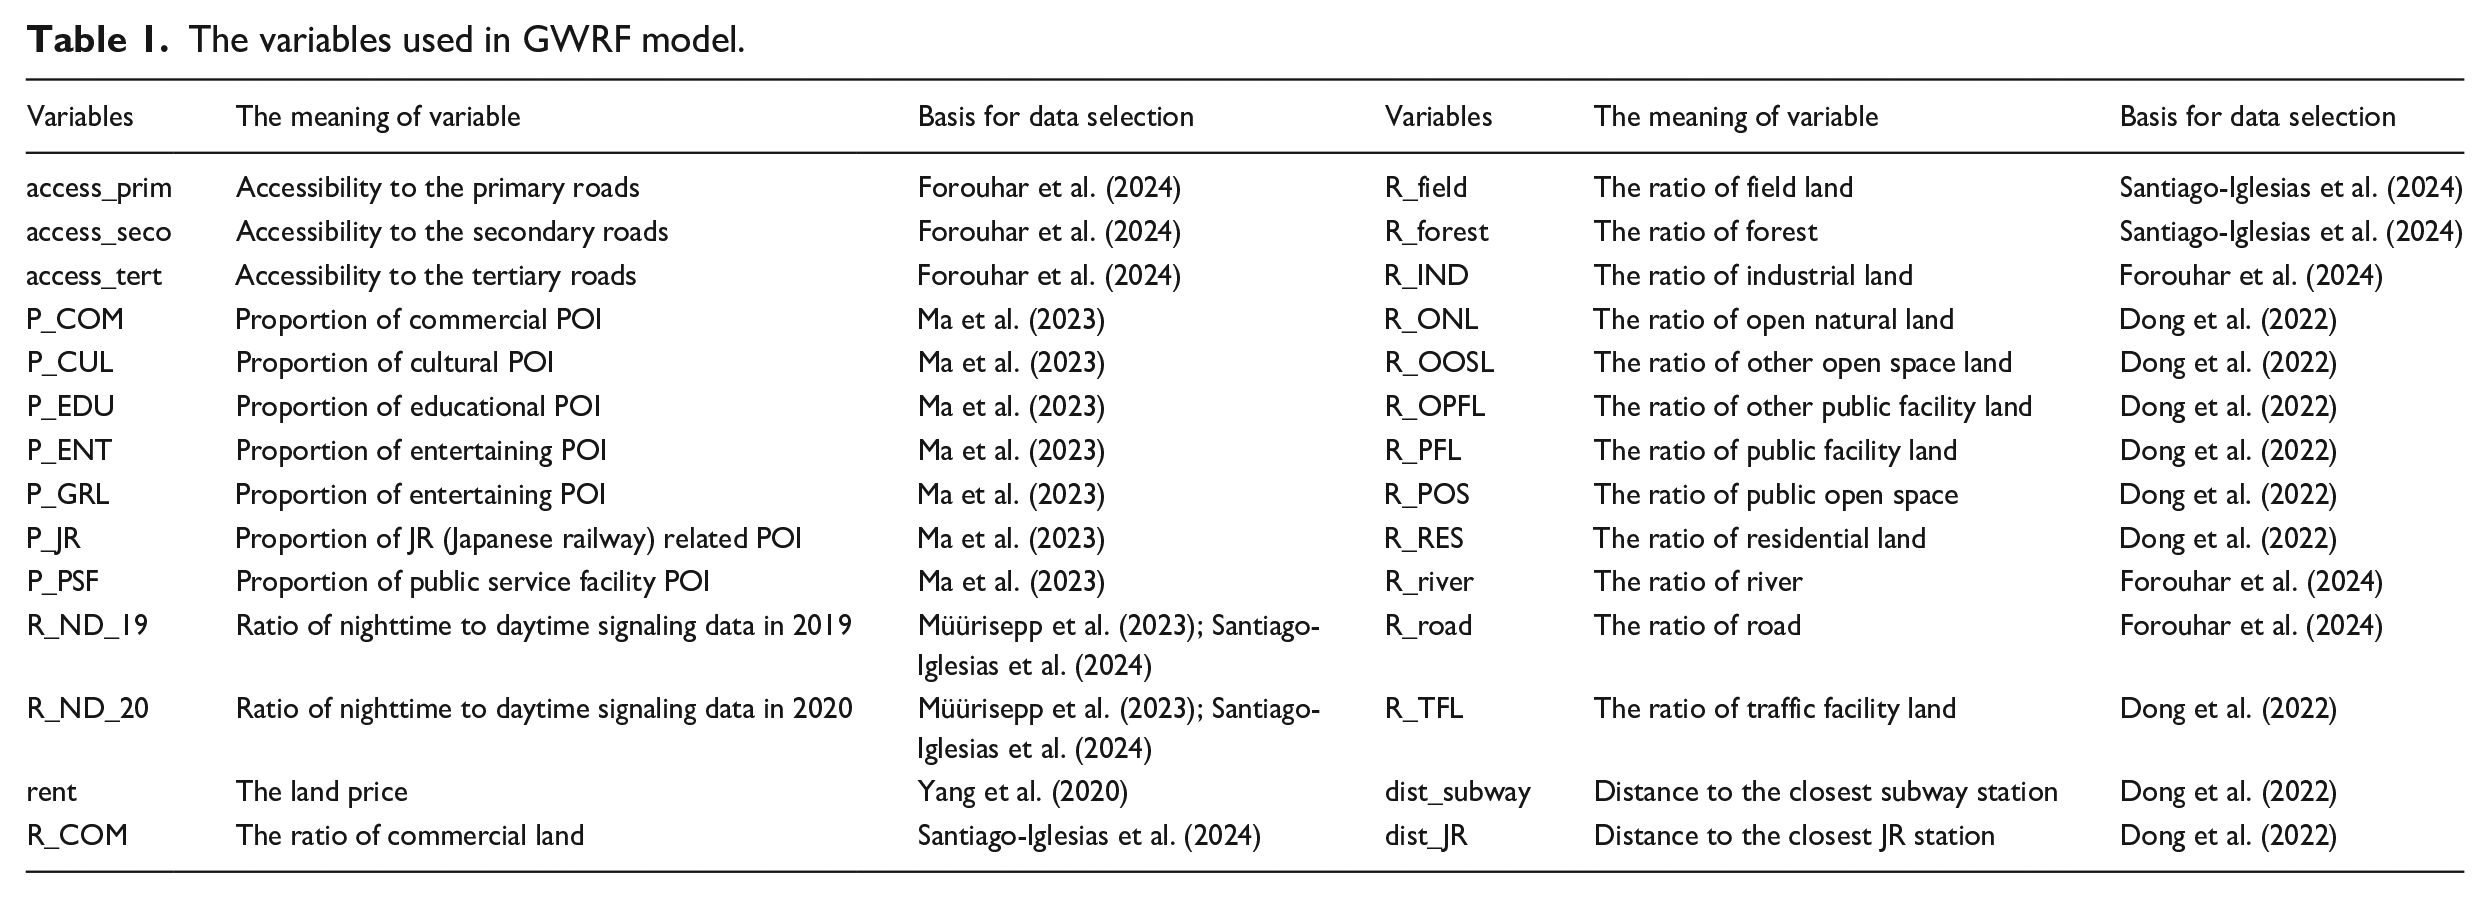
The variables used in GWRF model.
Results
The performance of GWRF
In the GWRF model, we systematically investigated the impact of varying the model’s bandwidth on predictive accuracy. This exploration involved tuning the bandwidth parameter to delineate the optimal size for the range of local sub-model learning. Each GWRF model underwent training with bandwidth values ranging from 0 to 1200 in increments of 50. The resulting box plots of kappa coefficients for each model, presented in Figure 2, revealed insightful patterns.
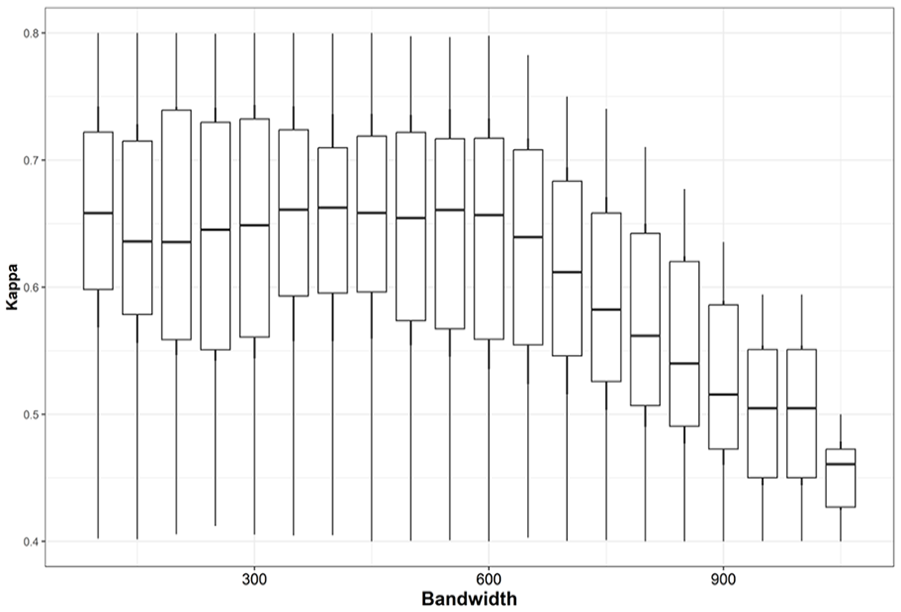
Box plot of the variation of kappa coefficient with bandwidth.
Initially, a discernible decreasing trend in the kappa coefficient was observed as the bandwidth increased from 0 to 200. However, beyond a bandwidth of 200, there was a subsequent upswing in the kappa coefficient, reaching a local peak at a bandwidth of 400. As the bandwidth surpassed 400, the kappa coefficient exhibited slight fluctuations with increasing bandwidth, eventually demonstrating a pronounced downward trajectory after surpassing 600. Notably, within the bandwidth range of 1000 to 1500, the model’s kappa coefficients displayed a cliff-like decrease.
In the context of enlarging the bandwidth of the GWRF model, which essentially expands the learning range of the local model, the observed drop in the kappa coefficient beyond a bandwidth of 600 and the cliff-like decrease around the 1000 bandwidth mark suggested that data outside a certain range surrounding the local unit might exert a negative influence on the training of the local sub-model. This implication raises the possibility that units situated beyond the spatial range are relatively weakly connected to the local unit.
Given that an increase in bandwidth resulted in an approximately linear increase in computation (Georganos et al., 2021), and considering that model accuracy did not exhibit a significant enhancement beyond a bandwidth larger than 400, we opted to proceed with the model configured with a bandwidth of 400 for the subsequent discussion. With a suitable bandwidth in place, we proceeded to visualize the spatial distribution of the kappa coefficient for the model, as illustrated in Figure 3.
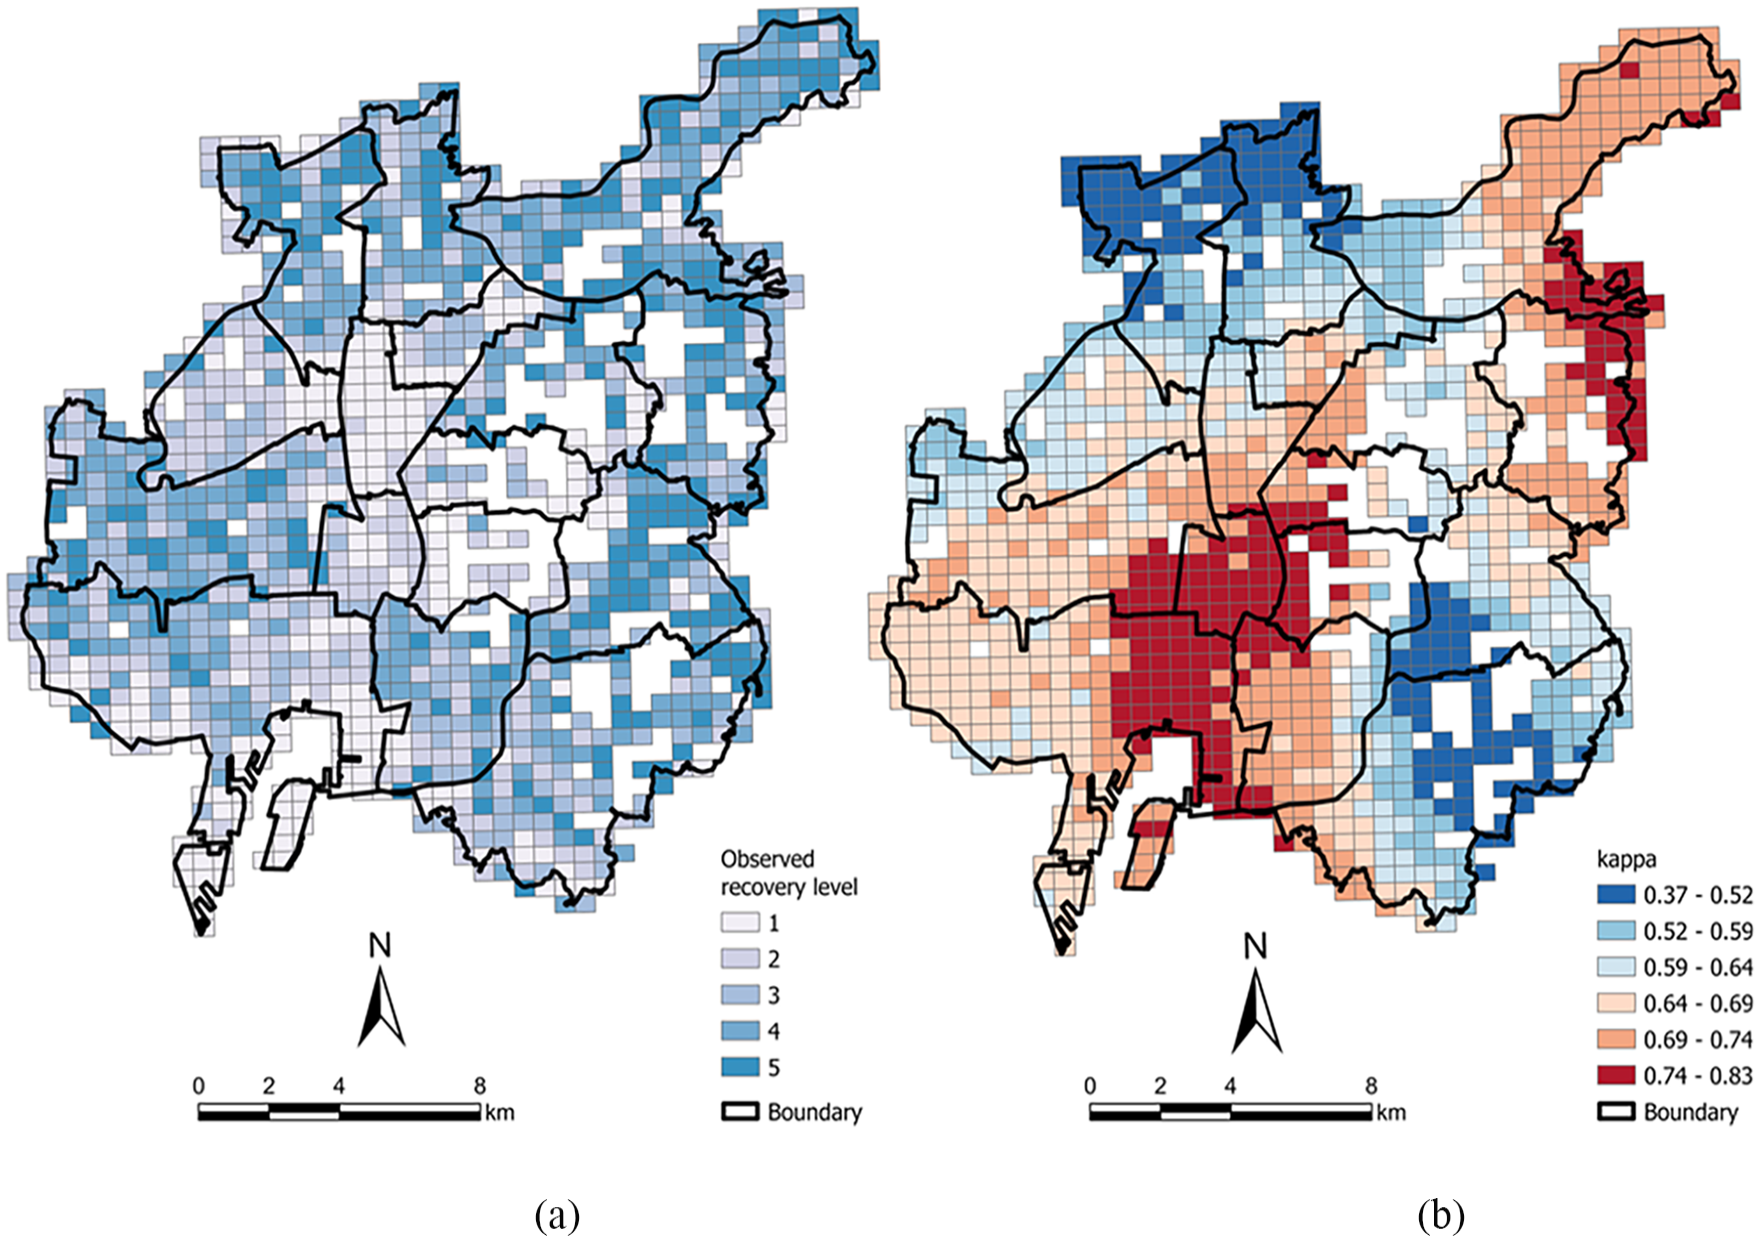
Geographical distribution of observed recovery levels (a) and model accuracy (b).
Observing the spatial patterns, it is evident that in the Midori District (kappa value range 38 ± 14%) and Tenpaku District (kappa value range 37 ± 14%), situated in the southeast part of the city, as well as in the Kita District (kappa value range 24 ± 14%) and Nishi District (kappa value range 22 ± 14%), located in the northwest part of the city, the model’s predictions exhibited lower accuracy, ranging from fair to moderate. Conversely, in other areas of the city, the model demonstrated a relatively high level of predictive accuracy. Notably, in the Atsutaku District, positioned at the center of the region, the model’s predictions exhibited the highest consistency with the actual situation.
Visualizing and analyzing feature importance
To present the distribution of feature importance at the global scale, we generated radar plots depicting the mean values of feature importance for each sub-model, categorized by urban recovery levels. In terms of land-use patterns, shown in Figure 4a, it was evident that, in general, the effects of features on different levels of recovery did not exhibit significant differences. For nearly all features, the impact on lower recovery levels was slightly higher than that on higher recovery levels, with the influence reducing as recovery levels increase. Nonetheless, there were substantial variations in the importance attributed to each distinct feature. The plot highlighted the vital role of field land (R_field) in determining recovery levels, whereas nature lands (R_forest, R_ONL, R_river) exhibited comparatively lower significance in the decision-making process for recovery outcomes.
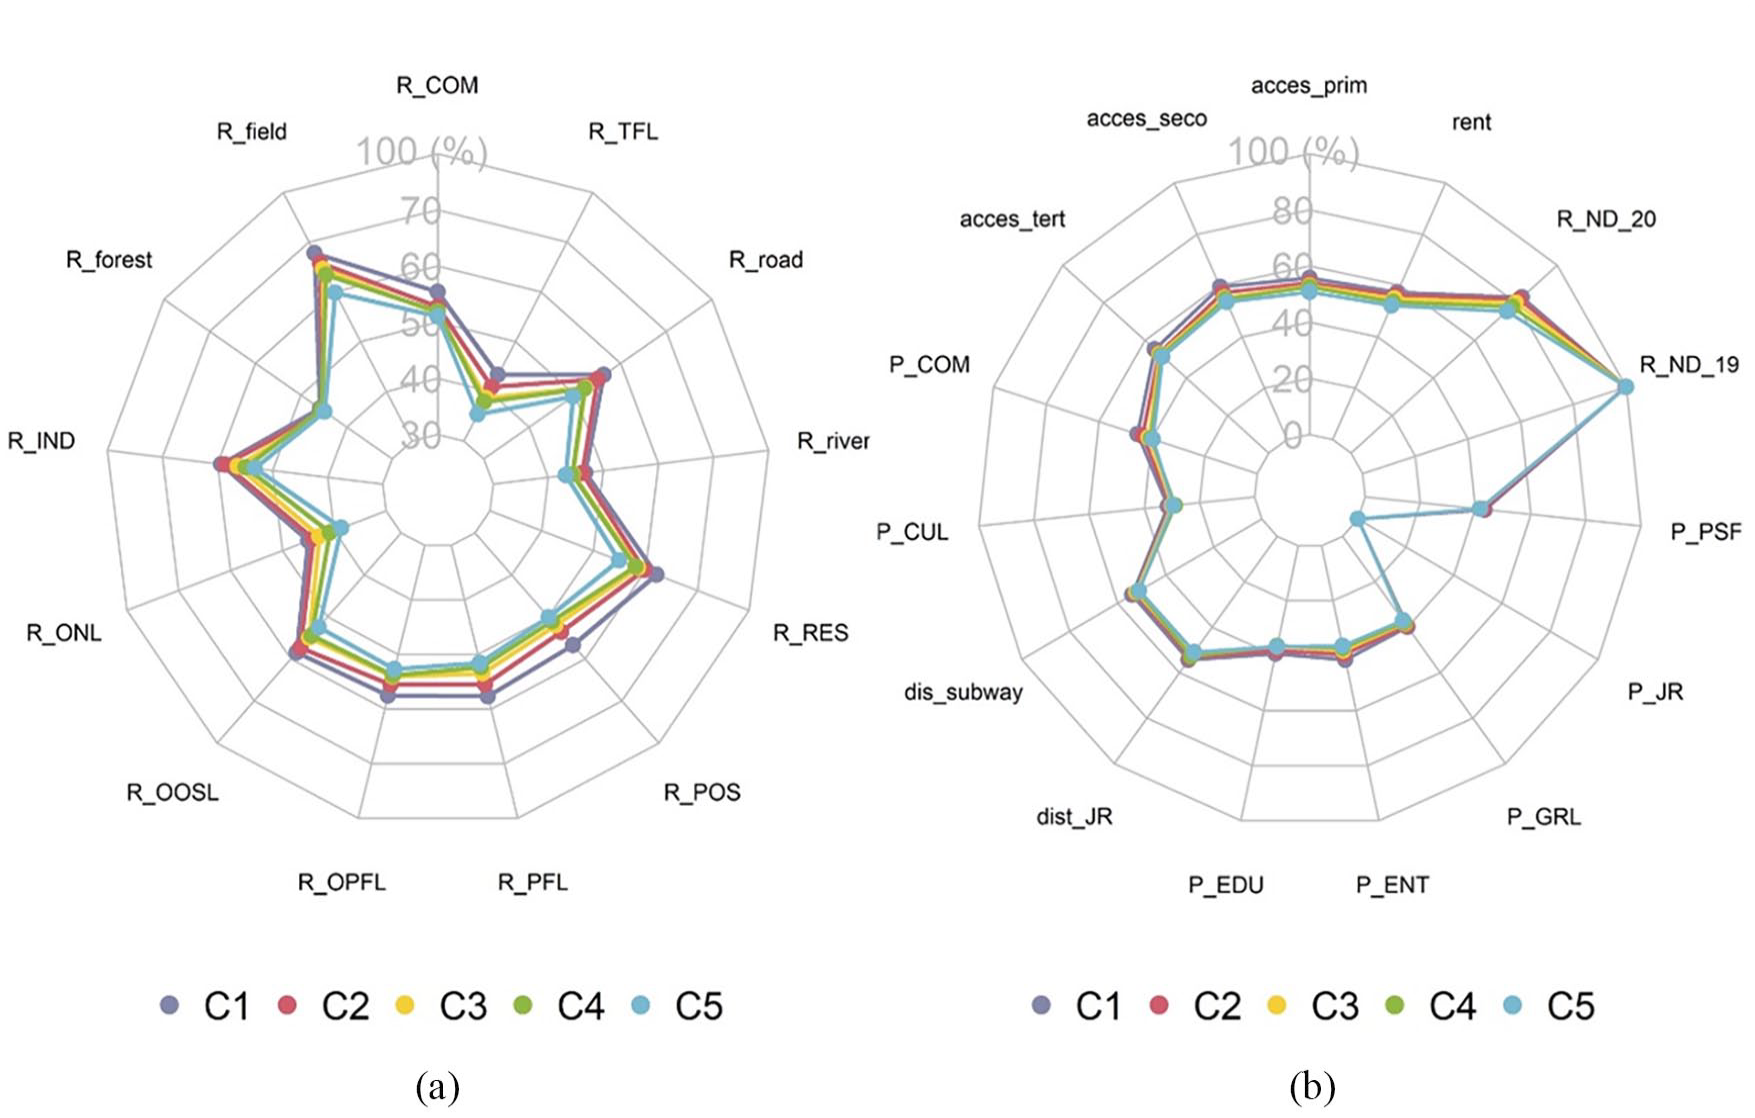
Radar plot for feature importance: (a) feature related to land use type; (b) other type of features. C1 to C5 refer to the recovery level, from the lowest to the highest.
Regarding features excluding land-use patterns, as illustrated in Figure 4b, the influencing pattern of variables on different recovery levels largely remained consistent. However, the gap between the effects of variables on distinct recovery levels diminished further. Notably, the ratio of nighttime to daytime mobile phone signaling data (R_ND_19, R_ND_20) distinctly stood out, especially the ratio data in 2019, exhibiting nearly the highest impact on every recovery level. Additionally, it was evident that the influence of traffic conditions (access_prim, access_seco, access_tert, dist_subway, dist_JR) should not be underestimated, with the accessibility of secondary roads (access_seco) ranking third after R_ND_19 and R_ND_20.
Subsequently, we mapped the spatial distribution of variable importance for four key features: R_ND_19, R_ND_20, R_field, and access_seco, given their prominence. Focusing on R_ND_19, as depicted in Figure 5a, high values of feature importance were clustered around the northeast, east, and middle parts of the city. Notably, this feature exerted a more significant impact on the highest recovery level, although the importance value exhibited a wider range of variability. The distribution of R_ND_19 displayed positive skewness, with data widely spread along the positive axis. This suggested that the influence from the feature importance was relatively decentralized. However, in districts such as Meitō (importance value range 0.99 ± 0.71) and Moriyama (importance value range 0.74 ± 0.84), where the average feature importance was notably higher, the job-housing balance emerged as a vital factor in promoting urban recovery.
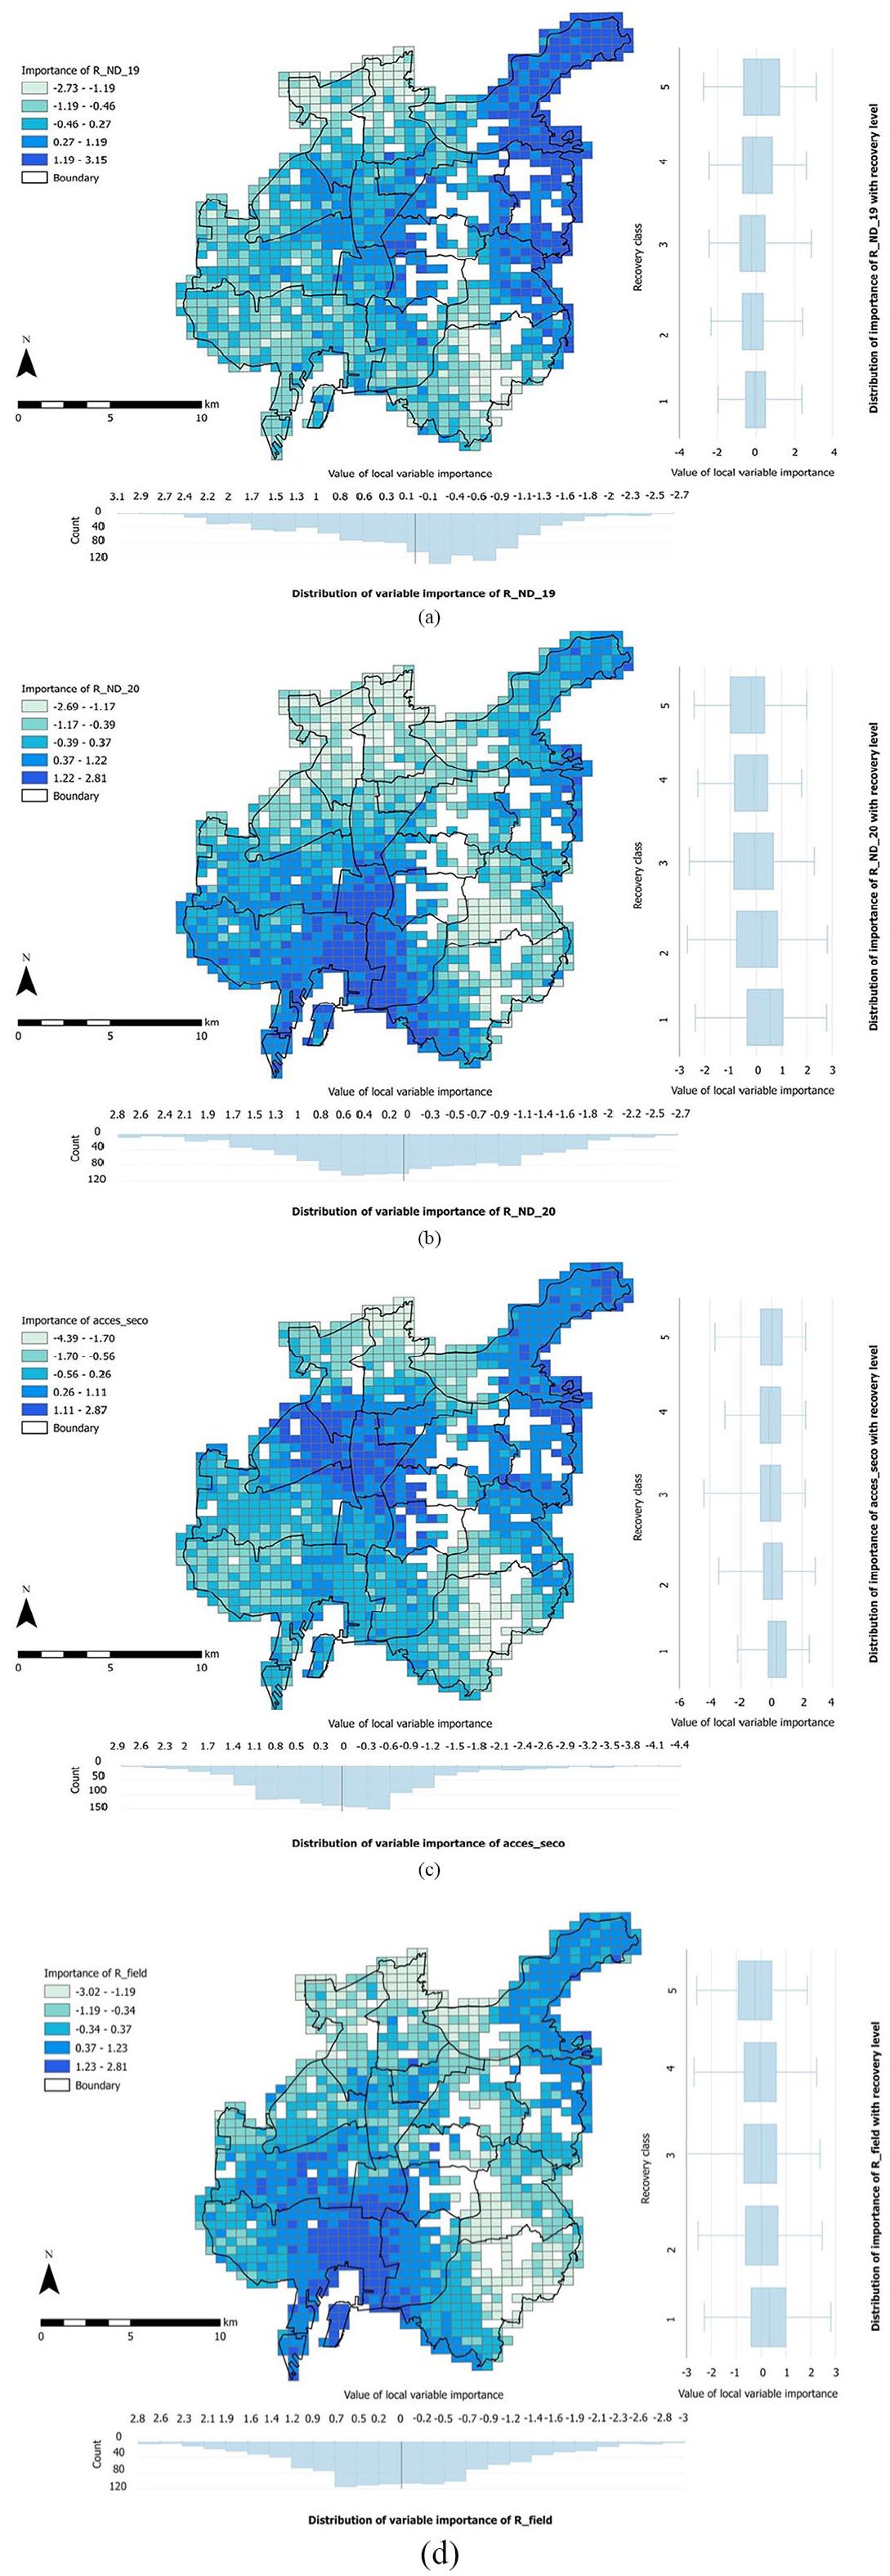
Spatial distribution of feature importance: (a) R_ND_19; (b) R_ND_20; (c) acces_seco; (d) R_field.
As for R_ND_20, as shown in Figure 5b, the region with high importance values centered around the north, southwest, and south parts of the city, with the highest values concentrated in the south. Notably, the impact of R_ND_20 was more pronounced in predicting lower recovery levels. In contrast to R_ND_19, the distribution of feature importance for R_ND_20 displayed a clear characteristic of negative skewness, indicating that although R_ND_20 had a broader spatial impact on urban recovery than R_ND_19, there were locations, such as the Kita District (importance value range 0.95 ± 0.65), where the feature had a very low impact that should be considered separately. the spatial distribution of R_ND_20 and its effect on different recovery levels markedly differed from R_ND_19. This unexpected divergence raised the possibility of spatial-temporal heterogeneity in the impact of job-housing balance. In districts like Minami (importance value of R_ND_20 range 0.81 ± 0.70, importance value of R_ND_19 range −0.17 ± 0.45) and Minato (importance value of R_ND_20 range 0.71 ± 0.63, importance value of R_ND_19 range −0.41 ± 0.38), the pre-COVID-19 job-housing condition exerted the dominant impact on recovery. However, in districts such as Moriyama (importance value of R_ND_20 range −0.07 ± 0.55, importance value of R_ND_19 range 0.74 ± 0.84), the post-COVID-19 job-housing condition played the decisive role. Despite the overall larger impact of the pre-COVID-19 job-housing condition, the job-housing condition in the post-COVID-19 period had more potential for management. Therefore, greater attention should be directed towards districts such as Moriyama, where the effect of R_ND_19 was relatively marginal, while R_ND_20 took dominance in influencing the recovery level.
In terms of acces_seco, which referred to the accessibility to secondary roads, the region with the highest importance values predominantly concentrated in the central part of the city. Additionally, in the northeastern and eastern parts of the city, the feature exhibited elevated importance values, as shown in Figure 5c. The distribution of feature importance displayed a characteristic of negative skewness, with a small portion of the data widely distributed on the negative axis. This distribution suggested that, at the overall urban level, enhancing accessibility to roads can significantly influence urban recovery, with some exceptions that cannot be neglected. Interestingly, the region where importance value came highest is also the heart of the city area with a large population and high land rent, which showed that the traffic condition should be more highly valued and carefully managed, especially in an area with concentrated population and economic activity.
As for the percentage of field land in land use (R_field, shown in Figure 5d), it can be seen that regions with high importance values were concentrated in the southern and northeastern parts of the city, where field land constituted a relatively small proportion of the land use pattern. Conversely, in the southeastern and western areas of the region, where field land was more prevalent, the impact of this feature was adversely attenuated. This feature exhibited a more pronounced impact on lower recovery levels, indicating that field land held substantial potential to enhance urban recovery, particularly in regions with lower recovery levels.
The nonlinear relationship between the most important built environment and urban recovery
In order to gain a deeper understanding of mechanisms by which features affect recovery levels, we plotted the partial dependencies for the four features with the highest importance values: R_ND_19, R_ND_20, R_field, and access_seco, which illustrated how the predicted probability of each recovery level changed as the feature values varied. According to the Figure 6a, the recovery level exhibited high sensitivity to the R_ND_19 value when it varied around 3. Specifically, the predicted probability of recovery level 2 overwhelmingly dominated when the value was close to but lower than 3. After the value exceeded 3, the predicted probabilities of recovery levels 4 and 5 dramatically increased, accompanied by a decline in the predicted probabilities of levels 1, 2, and 3. Notably, recovery level 5 became dominant after the feature value reached 5. Notably, when the feature value was lower than 1, the recovery level 1 took an absolute dominance, and after the feature value exceeded 2, the dominant level was replaced by level 2. This result suggested that in situations where there was a jobs-housing mismatch, and there were more jobs than available housing in the locality, the locality was much more likely to experience poor recovery. However, when the housing function of the place predominated, with the number of housing units significantly exceeding four times the number of jobs, the jobs-housing mismatch became beneficial to urban recovery.
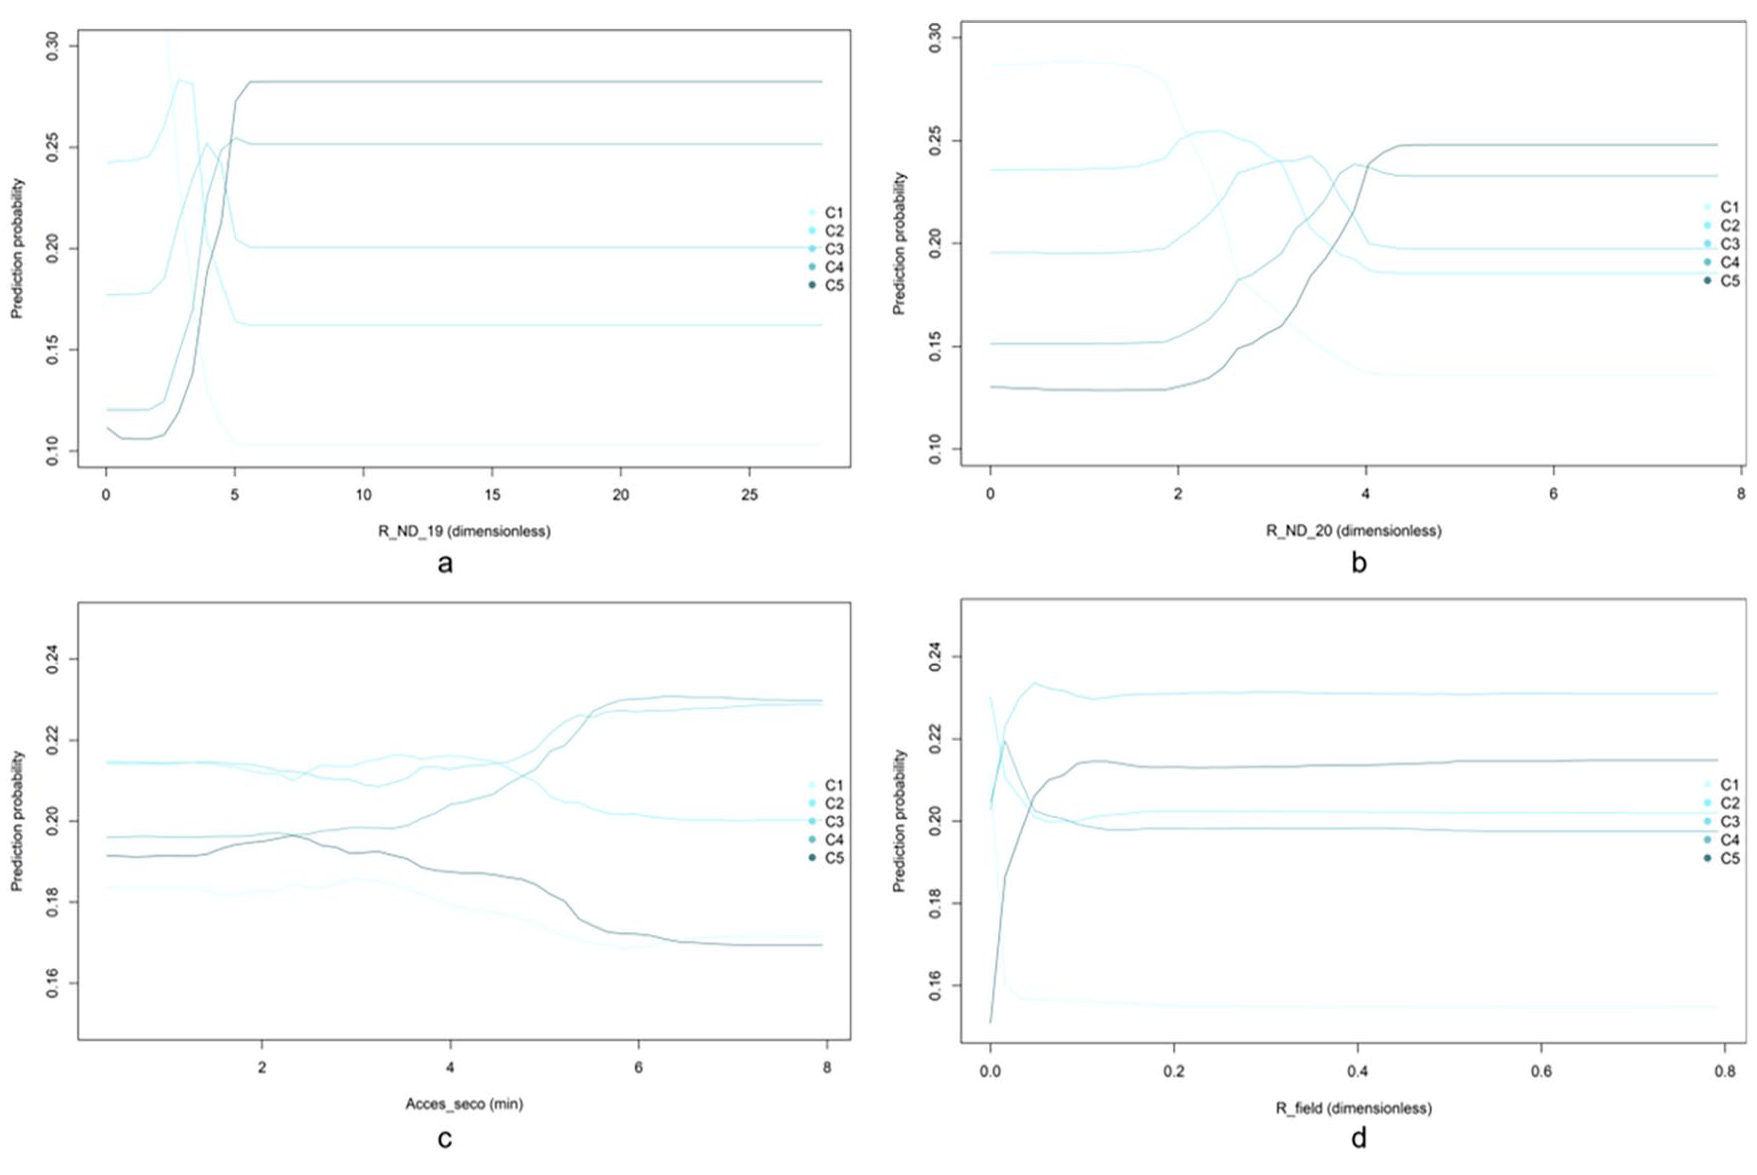
Partial dependency plot of the four features with highest importance value: (a) R_ND_19; (b) R_ND_20; (c) Acces_seco; (d) R_field. Darker colors represented higher levels of urban recovery.
The partial dependency of R_ND_20, as shown in Figure 6b, was similar to that of R_ND_19; however, recovery levels appeared to be more sensitive to R_ND_19. When the feature value was less than 2, the recovery level 1 took the dominant status. After the feature value exceeded 2, the predicted probability of level 1 decreased dramatically, while the predicted probabilities of levels 2, 3, 4, and 5 began to rise. Level 2, level 3, and level 4 reached their peak around a feature value of 2.5, 3.5 and 4 respectively, when they briefly dominated before decreasing. The predicted probability of level 5 then took continuous dominance soon after the feature value exceeded 4. The pattern of the partial dependency of R_ND_20 resembled that of R_ND_19: the effect of jobs-housing mismatch had a characteristic of duality; when the jobs predominated, the impact was negative and when the housing was significantly dominant with number of housing units being more than four times the number of jobs, the impact turned to be beneficial, implying that more attention should be paid on the construction of urban residential function.
For acces_seco, the predicted probability of both the highest and lowest recovery levels (level1 and level5) was remained relatively low as the feature value changed. As the accessibility increased and the feature value lowered to a point when the value was less than the threshold of around 4, the gap between the predicted probability of all recovery levels decreased: both the probability of the highest and lowest recovery level (level 5 and level 1) as well as level 2 increased, and the predicted probability of level 3 and level 4 dramatically decreased from a co-dominant position, as shown in Figure 6c. This pattern of partial dependency showed that although the improvement of accessibility to the secondary road could have a significant contribution to the highest recovery level (level 5), there could also be an increasing risk of presenting the lowest recovery level (level 1), and notably the accessibility of the level of recovery with dominant prediction probability decreased from level 3 and level 4 to level 2 and level 3 with the feature value increasing, showed a decreasing trend in the level of recovery, implying that the decision to build roads to improve road accessibility should be taken after careful consideration, as the risks to urban recovery caused by the dense road network should not be ignored.
Regarding the feature of R_field, shown in Figure 6d, the threshold of the feature value is very near to 0. When the feature value was very close to 0, recovery level 2 dominated. After feature value exceeding the threshold, the predicted probability of level 3 and level 5 sharply increased, with the predicted probability of level 1, level 2, and level 4 decreasing dramatically. Recovery level 3 soon took dominant status after the feature value exceeding the threshold. This close-to-zero threshold indicated that the key factor influencing the impact of field land was whether there was any field land present, rather than the quantity being large or small. In districts like Minato, where the importance of field land to urban recovery was highly valued, it would be beneficial to appropriately increase the proportion of field.
Conclusion and discussion
In the face of frequent urban disasters such as pandemics, enhancing urban resilience from the perspective of the built environment is crucial. This study employs a GWRF model and PDP analysis, accounting for spatial heterogeneity and nonlinearity, and integrates multi-source big data on the built environment, socio-economic factors, and human mobility. The research investigates the relationship between the built environment and urban recovery in the post-pandemic context. Our findings indicate that the job-housing balance significantly impacted urban recovery during the post-pandemic period, consistent with findings from metropolitan areas such as Wuhan and California (Islam and Saphores, 2023; Wu et al., 2024). While job-housing balance has been uniformly emphasized in urban studies (Zhang et al., 2022), our results reveal its heightened importance in areas with lower recovery conditions during the post-pandemic era. Secondary road accessibility had a dual impact on urban recovery patterns. While it significantly enhanced recovery performance in urban centers with high accessibility, it paradoxically contributed to minimal recovery in some regions. Additionally, field land played a critical role in promoting urban recovery in areas with higher recovery levels. While prior studies have focused on the quality of green spaces (Chen et al., 2022; Ciesielski et al., 2024; Park et al., 2020), our PDP results further demonstrate that once the ratio of field land exceeds 0.05, its influence on recovery stabilizes. Beyond this threshold, further increases in field land size contribute little additional benefit.
This study broadens the prevailing focus of existing research, which has primarily emphasized medical interventions, to include a perspective centered on built environment factors in the context of non-medical interventions. It addresses a significant gap in urban resilience research, where the role of the built environment as an intervention element has been underexplored. By considering the nonlinear and spatially heterogeneous relationships between the built environment and socio-economic recovery in the post-pandemic era, this study develops targeted policy recommendations. These strategies are tailored to the specific spatial contexts of urban units, balancing the diversity of individual units with the goal of facilitating overall urban recovery, while accounting for intrinsic attributes and surrounding neighborhood spatial relations. Our findings contribute to the theoretical understanding of urban resilience as a non-normative concept (Elmqvist et al., 2019).
This study also has several limitations. First, our research focuses exclusively on Nagoya and does not compare the recovery processes of similar international cities, limiting its ability to provide comprehensive insights into post-pandemic urban recovery strategies. Second, future studies should integrate both the initial pandemic spread and post-pandemic urban recovery to develop systematic strategies for transforming the built environment. Third, while the GWRF model employed in this study offers robust analytical capabilities, it is computationally intensive and difficult to parallelize due to its reliance on Random Forest, which poses challenges for scalability and efficiency.
Footnotes
Declaration of conflicting interests
The author(s) declared no potential conflicts of interest with respect to the research, authorship, and/or publication of this article.
Funding
The author(s) disclosed receipt of the following financial support for the research, authorship, and/or publication of this article: We are grateful for the financial support of the National Natural Science Foundation of China (NSFC), Basic Science Center Program, Multiphase Evolution in Hypergravity (No. 51988101).