
Abstract
Google Street View (GSV) and Baidu Street View (BSV) cover most of the world’s cities. However, their combined use and research application still lack a unified standard. We selected Hong Kong Special Administrative Regions of China (SAR), a region where both types of street view image (SVI) are available, as the study area. In this study, we developed an SVI collection method based on a search-oriented approach. Using an SQLite database to manage over 700,000 SVIs, we conducted comparative experiments. Deep learning methods were employed to process the data and extract visual elements from both types of SVI. We performed a comprehensive comparison of the data quality and usability of the two SVIs in terms of temporal coverage, data acquisition efficiency, acquisition repeatability, and visual element similarity. The findings indicate that BSV outperforms GSV in terms of acquisition efficiency and repeatability, while GSV shows better temporal coverage. The results also confirmed high correlations between GSV and BSV in visual elements related to buildings, greenery, and sky, with correlation coefficients (R) of 0.781, 0.664, and 0.653, respectively. The comparative framework proposed in this study provides theoretical support for geoinformation researchers utilizing SVI data for global-scale studies.
Introduction
In recent years, street view imagery (SVI) has emerged as a significant and ubiquitous source of urban spatial geographic information data. This data offers a novel approach to interpreting the complex urban built environment and urban phenomena (Marasinghe et al., 2023). Initially released by Google Maps for viewing urban landscapes and pedestrian navigation, SVI has, with the ongoing development of computer vision and artificial intelligence technologies, become a tool for large-scale, efficient urban assessment, supplanting traditional manual photographic urban surveys. Research based on SVI spans a wide range of disciplines, including spatial data infrastructure (Hosseini et al., 2022), green infrastructure (Liu et al., 2023; Zhang et al., 2023a; Zhu et al., 2023), human health (Ha et al., 2022; Yao et al., 2022; Yu et al., 2021), crime prediction (Navarrete-Hernandez et al., 2023; Xie et al., 2022; Yao et al., 2023), economic development (Kim and Woo, 2022; Liu and Liu, 2022; Zhang et al., 2023c), urban perception (Cai et al., 2023; Lu and Chen, 2024; Ma et al., 2021; Wang et al., 2022), urban climate (Ignatius et al., 2022), 3D reconstruction (Huan et al., 2022; Xu et al., 2022; Yan and Huang, 2022), land use recognition (Zhang et al., 2023b), and geographical artificial intelligence (Hu et al., 2023; Liu et al., 2024).
There are several methods for acquiring SVI.
Among all collection methods, commercial service applications overwhelmingly dominate, and this trend is expected to continue in the foreseeable future (Biljecki and Ito, 2021). Surprisingly, however, the quality of the use of commercial service SVI has not been a focus. In terms of the coverage of commercial service SVI, GSV includes cities in most significant countries worldwide, excluding China due to policy reasons. However, BSV compensates for this shortcoming. The primary research gap lies in the fact that, although numerous studies have shown interest in and attempted to combine the two types of SVI, the issue of data quality has not yet been explored from the fundamental perspective of data parameters (Biljecki et al., 2023; Kim et al., 2021).
In most SVI studies, research is often conducted using only a single type of SVI data. With the widespread use of SVI data, conducting research that simultaneously utilizes GSV and BSV has become the norm. However, a research gap exists regarding the differences in the availability and quality of these two types of data. This study aims to address and discuss several research gaps. Firstly, almost all SVI studies collect data by sending requests to map service providers using predetermined latitude and longitude coordinates, thereby obtaining the SVI data results. There is a discrepancy between the geospatial positions obtained through this method of collection and the actual latitude and longitude collected by street view vehicles. However, this discrepancy is generally considered to fall within an acceptable range. Addressing how this discrepancy affects data validity and redundancy rates for GSV and BSV with different sampling intervals is a key issue we intend to solve. Secondly, although different SVI providers maintain a consistent overall style in offering SVI services, the specific parameter values are not the same. For GSV and BSV, determining how to set specific parameters to ensure the consistency of the collected results on a global scale is also a critical issue. Specific parameters refer to aspects such as image focal length, image dimensions, scaling size, and other related settings. Thirdly, when using GSV and BSV complementarily in research, we aim to explore the extent of the differences in representing the same built environment or urban phenomena across different cities. We have identified a particular city (Hong Kong SAR, China) to address this issue. Hong Kong is special as a SAR of China, with both GSV and BSV services covered.
In this study, we comprehensively discuss the quality of GSV and BSV and propose a framework for comparing their quality-related attributes. Within this framework, we standardize the differences in collection methods, parameters, and practical applications. The framework establishes a common and formal understanding of the quality of SVI from different map providers. Using Hong Kong SAR, China, as an example, we provide a demonstration of the framework’s implementation and discuss its potential applications for comparing SVI quality and availability in practice. Within the framework, we use a lightweight SQLite database to manage over 700,000 SVI images for multiple comparative experiments, calculating parameters such as the effectiveness and repetition rate of different SVI intervals. We employ deep learning methods to extract visual elements from both types of SVI and use the Pearson correlation coefficient to measure the strength and direction of the linear relationship between GSV and BSV visual features. This approach aims to facilitate a comparative quality analysis of different SVI datasets within the same geographic location.
Literature review
Growing popularity of SVI
Research based on SVI data has become mainstream in addressing urban issues. We followed common systematic review methodologies (Ibrahim et al., 2020; Marasinghe et al., 2023) to briefly summarize recent trends in SVI development. Specifically, we searched for all recent publications on Scopus using “street view” as a keyword to retrieve papers by their titles, abstracts, and keywords. Since GSV and BSV are specific data sources in SVI research, using broad terms ensured the diversity and quantity of papers retrieved.
Since this study is not specifically a review article on SVI, our aim is to summarize the recent trends in SVI developments. Therefore, we did not filter or eliminate any search results. The review on SVI was conducted in the first half of 2024. As literature from 2024 is still being published, we set the search timeframe to cover the growth trend over the past decade (2014 to 2023). The search results included a total of 6819 papers.
For the search results, we analyzed them by time, country, and type, displaying only the top ten results to illustrate the recent developmental trends of SVI. Firstly, Figure 1a shows the time evolution of the number of SVI papers we retrieved over the past decade, indicating a steady increase in the number of studies and publications relying on SVI. Secondly, Figure 1b illustrates the presentation of retrieval results categorized by country or region. According to the bar chart, the number of research publications utilizing SVI data is significantly higher in China, the United States, and the United Kingdom compared to other countries. However, it should be noted that this does not imply that Chinese researchers do not use GSV data, nor does it suggest that researchers from other countries do not utilize BSV data. Lastly, Figure 1c displays the types of research publications, with Articles having the largest share, followed by Conference Papers and Book Chapters.
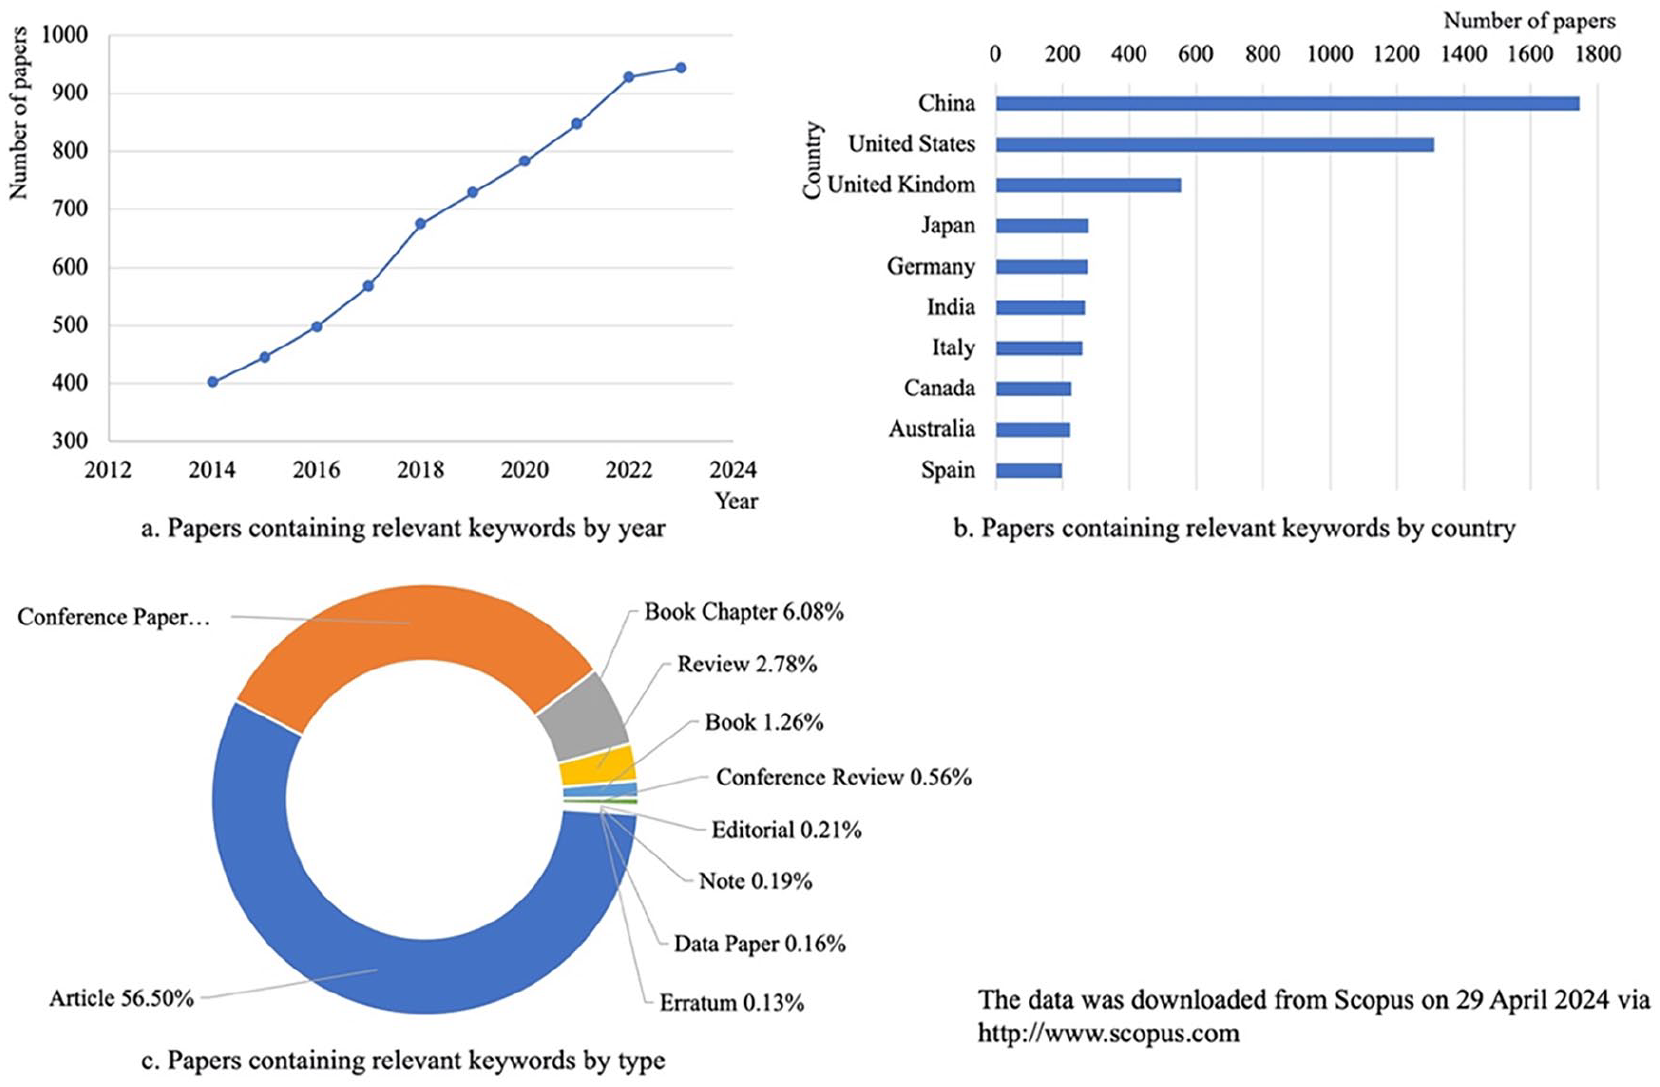
The use of SVI in urban studies has increased rapidly. The number of papers published to date (during the retrieval period of April 2024) indicates that this trend will continue to rise, surpassing that of 2023. (a) Papers containing relevant kewords by year. (b) Papers containing relevant kewords by country. (c) Papers containing relevant kewords by type.
Collection and uses of SVI
In discussing the quality of SVI, it is crucial to delve deeply into how data is “collected” and “used”. “Collecting” explains the potential sources of error during the acquisition process of SVI, whereas “using” identifies how issues with SVI quality may potentially affect the accuracy of research outcomes.
GSV is the most widely used data source in global SVI research, leveraging the popularity of Google Maps worldwide and holding further potential applications (Zhang et al., 2018a). GSV data is collected in a standardized format, utilizing a panoramic camera system mounted on vehicles that travel and collect imagery on public roads accessible by vehicles at fixed time intervals. As a result, SVI is not uniformly spaced in the database of the map provider. In areas where vehicles cannot access, such as public parks, indoor spaces, or mountainous regions, backpack camera systems carried by individuals are used to supplement road coverage with SVI (Anguelov et al., 2010). Additionally, SVI is typically collected under favorable lighting conditions during daylight and moderate weather conditions. Due to the nature of the collection method, a street is either fully covered with SVI or not at all, with no instances of partial coverage (Quinn and Alvarez León, 2019). Due to national policy reasons, Google services are not accessible in mainland China. Additionally, street view data has not been collected on a large scale using street view vehicles, and the limited street view content available is uploaded by individual users. As a result, GSV has virtually no coverage in China. However, BSV compensates for this lack in China, with a presence in 652 cities and covering over 80% of Chinese cities. The mileage of road imagery covered by BSV amounts to 2.295 million kilometers.
Researchers use SVI to describe various urban built environment characteristics and urban phenomena, such as rich urban infrastructure, assessing urban health, measuring urban perception, predicting traffic congestion, and more (Cai et al., 2023; Campbell et al., 2019; Ha et al., 2022). As the primary source of data, studies mainly achieve this by extracting relevant features from SVI, such as the proportion of buildings, sky, roads, and vegetation (Zhou et al., 2022a). These SVI features, along with image metadata (capture location, time) and other data (economic, demographic, environmental), are then used for further analysis. For example, SVI data are employed to measure building seismic resistance, height, and classification among other structural characteristics (Aravena Pelizari et al., 2021; Kang et al., 2018; Yan and Huang, 2022). In studies related to the sky element, fisheye SVI is more commonly used to measure solar glare, solar radiation, and urban climate characteristics (Li and Ratti, 2019; Li et al., 2019; Zhu and Gu, 2022). For vegetation elements, their use is more often focused on measuring the evolution of urban greening structures and their correlation with human psychological health (Ki and Lee, 2021; Li et al., 2015; Sun et al., 2021). Consequently, factors such as image pixel size, geographical spatial coverage, timeliness, and metadata availability are crucial foundations of these studies and significantly impact the validity of the research outcomes.
Data quality variability for SVI
For the image data quality of SVI, there are many aspects that merit attention. We reviewed literature of various types from past studies to aid in a more comprehensive understanding and discussion of data quality issues.
Image pixels
This characteristic is among many capture parameters. However, its importance can be considered paramount, as it directly affects the clarity of the image, hard disk storage space, and the accuracy of analysis results. In previous studies, there was no uniform standard for the image pixels of SVIs; they were set according to the data needs of the research topic. For example, in a study mapping the distribution of shade spaces from street trees in Boston, 12,153 panoramic SVIs with a resolution of 1024 × 512 were used (Li and Ratti, 2018). In a study on the walkability index, 78,168 SVIs with a resolution of 640 × 640 were employed (Ki et al., 2023). Furthermore, in a study using the built environment to predict COVID-19 cases, 164 million SVIs with a resolution of 640 × 640 were used (Szczepańska and Pietrzyk, 2020). Generally, the more SVIs used in a study, the more researchers tend to opt for images with smaller pixel dimensions, likely due to considerations of storage space.
Data collection forms
For systematic collection of SVI by map service platforms, the imagery is stored on servers in the form of panoramic images. Users can access SVI in two forms: panoramic views and perspective views. These two views have no inherent advantages or disadvantages; the choice depends on the researcher’s specific needs. Additionally, a small portion of street view images is captured and uploaded by users. Perspective views refer to images obtained by cropping and correcting panoramic images, and the image parameters can be set by adjusting the horizontal and pitch angles. The advantage of panoramic views is that they can display a complete image from the ground to the sky at a location, but compression distortion occurs at the top and bottom areas. Panoramic imagery is more often used in studies reflecting the built environment and measuring sky-related indices (Li et al., 2019; Lumnitz et al., 2021). The advantage of perspective views is that they provide a visual experience closer to that of human sight, but they partially lack in representing the complete built environment. Perspective views are more commonly used in studies measuring walkability, human perception, and other subjective human experiences (Dai et al., 2023; Rui, 2023).
Coverage
Both commercial map platforms and crowdsourcing platforms exhibit spatial coverage imbalances. In crowdsourcing platforms, because contributors upload voluntarily and without obligation, some road areas lack contributors. Furthermore, the collection behavior tends to focus on major roads (Szczepańska and Pietrzyk, 2020). For commercial map platforms, systematic and large-scale updates of SVI services also consume significant corporate manpower and financial resources. Therefore, commercial map platforms follow a strategy of prioritizing the collection of uncollected road areas and secondary updates of already collected areas.
Timelines
The temporal coverage of SVI is often overlooked, and the distribution over time usually lacks a uniform pattern. Within the same city, the distribution of time ranges can be inconsistent, often displaying jumps across years. This is attributed to the SVI collection vehicles not capturing images within the same time period (Miranda et al., 2020). In smaller cities, the corresponding frequency of SVI updates tends to be lower, making it challenging to use historical SVI for feature comparison analysis (Larkin and Hystad, 2019). Nevertheless, some researchers have recognized the potential of historical SVI, using it to measure changes in vegetation greenness between summer and winter (Han et al., 2023; Yu et al., 2022), to monitor changes in the visual quality perception of communities (Liang et al., 2023; Wang et al., 2024b), and to measure physical changes in urban areas (Naik et al., 2017).
Collection intervals
The acquisition of SVI is conducted by setting geographical coordinates to determine the collection sites and requesting access from a server. However, the setting of intervals has a significant impact on the results (Hou and Biljecki, 2022). Too large a spacing can lead to missing SVI, whereas too small a spacing can cause redundancy in SVI. A study conducted in Santa Ana, California, on the intervals and directions of GSV indicated that as the intervals increase, the variability in measured visual elements of the images also increases (Kim et al., 2021). However, studies comparing the interval measurements of BSV alone, or contrasting them with those of GSV, are currently nonexistent.
Metadata availability
The metadata of images provides additional information such as the time of capture, location, heading, and pitch, which can be used to filter out SVI that does not meet usage requirements. It is important to note that the geographic coordinates in the metadata do not coincide with those generated through road networks (Rundle et al., 2011). For example, in studies of urban forest inventories, the heading in the metadata is fundamental for determining the positions of trees (Liu et al., 2023; Rodríguez-Puerta et al., 2022; Velasquez-Camacho et al., 2023, 2024). In a study using SVI to predict the age and architectural style of buildings, the metadata of SVI also played a crucial role (Sun et al., 2022).
Legal regulations
The service terms of Google Maps Platform (Google, 2024) and Baidu Maps Platform (Baidu, 2024) outline the possibilities and limitations regarding intellectual property during the use of various aspects of maps, including SVI. In the United States, the use of GSV is permissible under the fair use principle (Copyright Act of 1973), and text and data mining are allowed, with some cases being supported in court (Kollár, 2021). The fair use of GSV service terms is an active and unresolved area of litigation (Rundle et al., 2022). In 2019, the European Union enacted new regulations on text and data mining (European Union, 2019). Directive (EU) 2019/790 Title II Article 3 permits “reproductions and extractions made by research organisations and cultural heritage institutions for the purposes of scientific research, text and data mining of works or other subject matter to which they have lawful access.” Some researchers have already suggested and called for limitations on the use of GSV (Helbich et al., 2024). However, the flexibility of usage in the future will depend on the user’s country and local regulations. As cited, Baidu authorizes the use of BSV for non-commercial purposes, with commercial use requiring a commercial license agreement with Baidu. The flexibility in the use of BSV is generally higher.
As we summarized, different SVI data exhibit differences in various aspects. The combined use of GSV and BSV data has become an inevitable trend. However, systematic comparative analysis of these two types of data is still lacking. To address this gap, we have set the following three main research objectives.
To propose a metadata-based collection method capable of obtaining the precise locations of GSV and BSV street views within the database.
To evaluate the data quality from multiple aspects, including time, space, and parameter settings, using street view data from identical locations.
To analyze the similarity between GSV and BSV in representing the same built environment, in order to demonstrate the complementarity and usability of the two types of street view data.
Study area
Distribution of street view maps across the world
Several dozen map manufacturers worldwide currently offer SVI services. For instance, GSV, BSV, Tencent Street View, Mapillary, and KartaView, among others. Mapillary and KartaView (known as Open StreetCam until November 2020) are also significant platforms providing SVI. Both are crowdsourced image platforms, where anyone can contribute to Mapillary and KartaView. Additionally, the data from these platforms are licensed under the Creative Commons Attribution ShareAlike 4.0 International License, allowing anyone to freely use it. These services are closely linked to the OpenStreetMap (OSM) project and have been used as data sources for OSM map drawing (Alvarez Leon and Quinn, 2019; Sarjakoski et al., 2016). However, for researchers seeking standardized imagery, GSV uniform image collection standards remain a preferable choice. Tencent Maps is a similar local service provided by Tencent since 2011. Although Tencent Street View also covers the entire scale of China, its data updates have ceased due to business adjustments. Thus we choose BSV as the representative for SVI data in China.
The introduction above indicates that most map service providers offer regional services covering one or several countries. Our research will focus only on those services that primarily cover the globe, leaving us with GSV and BSV as the main SVI platforms with comprehensive coverage. Therefore, our study will focus on assessing the data availability on these two platforms.
Distribution of GSV and BSV
GSV is one of the earliest and most widely available SVI services provided by map service vendors. GSV offers a comprehensive street panorama in a specified coverage area centered on designated roads, featuring a 360° horizontal and 180° vertical view, allowing users to inspect different locations on the streets of selected cities and the surrounding scenery. Users can navigate the spherical GSV using keyboard arrow keys or mouse clicks to view the imagery from various sizes, directions, and angles.
The collection of GSV imagery involves the use of photography vehicles equipped with multiple camera systems mounted on the rooftop, along with various sensors including LiDAR to gather metadata. The photos are positioned on Google Maps as spherical images and displayed against the backdrop of Google Maps satellite imagery. In areas where vehicles cannot access, such as pedestrian zones, narrow streets, and park alleys, specialized equipment like backpack cameras and snowmobiles are used to survey these confined and special roadways; otherwise, panoramic images are acquired using standardized vehicle-mounted methods. The coverage of GSV coincides with that of the Google Maps application (https://maps.google.com/). Since its launch in 2007, GSV has expanded to cover over 90 countries and has extended to indoor spaces. The majority of images offer full coverage and are taken from public roads, aside from landmarks and some unconventional locations such as the International Space Station.
BSV was launched in 2013. It is a web-based street view mapping service provided by the Baidu Maps platform, mainly available in mainland China, and represents a successful application of GSV’s experience in China. The collection and application of BSV data largely draw on the format of GSV. BSV also offers a 360° horizontal and 180° vertical street panorama, making it easy for users to access SVI on various devices. The collection of BSV also uses professional collection vehicles equipped with panoramic cameras, radar, and other hardware systems. BSV is continually updating its SVI and is also expanding into indoor spaces.
Hong Kong Special Administrative Region
The Hong Kong SAR, located along the southern coast of China and adjacent to the Pearl River Delta, comprises Hong Kong Island, Kowloon, the New Territories, and 262 surrounding islands. The land area is 1113.76 square kilometers, the sea area is 1641.21 square kilometers, and the total area is 2754.97 square kilometers. As of mid-2023, the total population was 7.4981 million, making it one of the most densely populated regions in the world. The city is renowned for its distinctive skyline and the blend of Eastern and Western cultures. Hong Kong SAR, as a major international financial center, features a highly developed market economy, modern architectural complexes, and a bustling port, all typical characteristics of a densely populated developed city.
Hong Kong SAR, as a typical large metropolis, serves as an excellent research area for evaluating the quality of SVI data. BSV and GSV are the most used mapping service tools by researchers. BSV provides detailed SVI for mainland China and some special administrative regions, including Hong Kong SAR. GSV, however, covers SVI globally except for mainland China but includes Hong Kong SAR as well. The combined use of these two platforms allows us to expand the scope of urban SVI research and compensates for the missing SVI of significant cities on individual map platforms.
Therefore, in this study, we have chosen Hong Kong SAR as our research area (Figure 2). The study aims to analyze the SVI from the two mapping platforms within the same city from identical angles and perspectives. This analysis and evaluation are used to identify differences in how the different SVI platforms study the same urban environment, assessing the usability and data quality of both types of SVI. This not only assists urban planners and researchers in better understanding and analyzing the similarities in the development processes of cities in China and other parts of the world but also provides pioneering theoretical support for large-scale global urban studies.
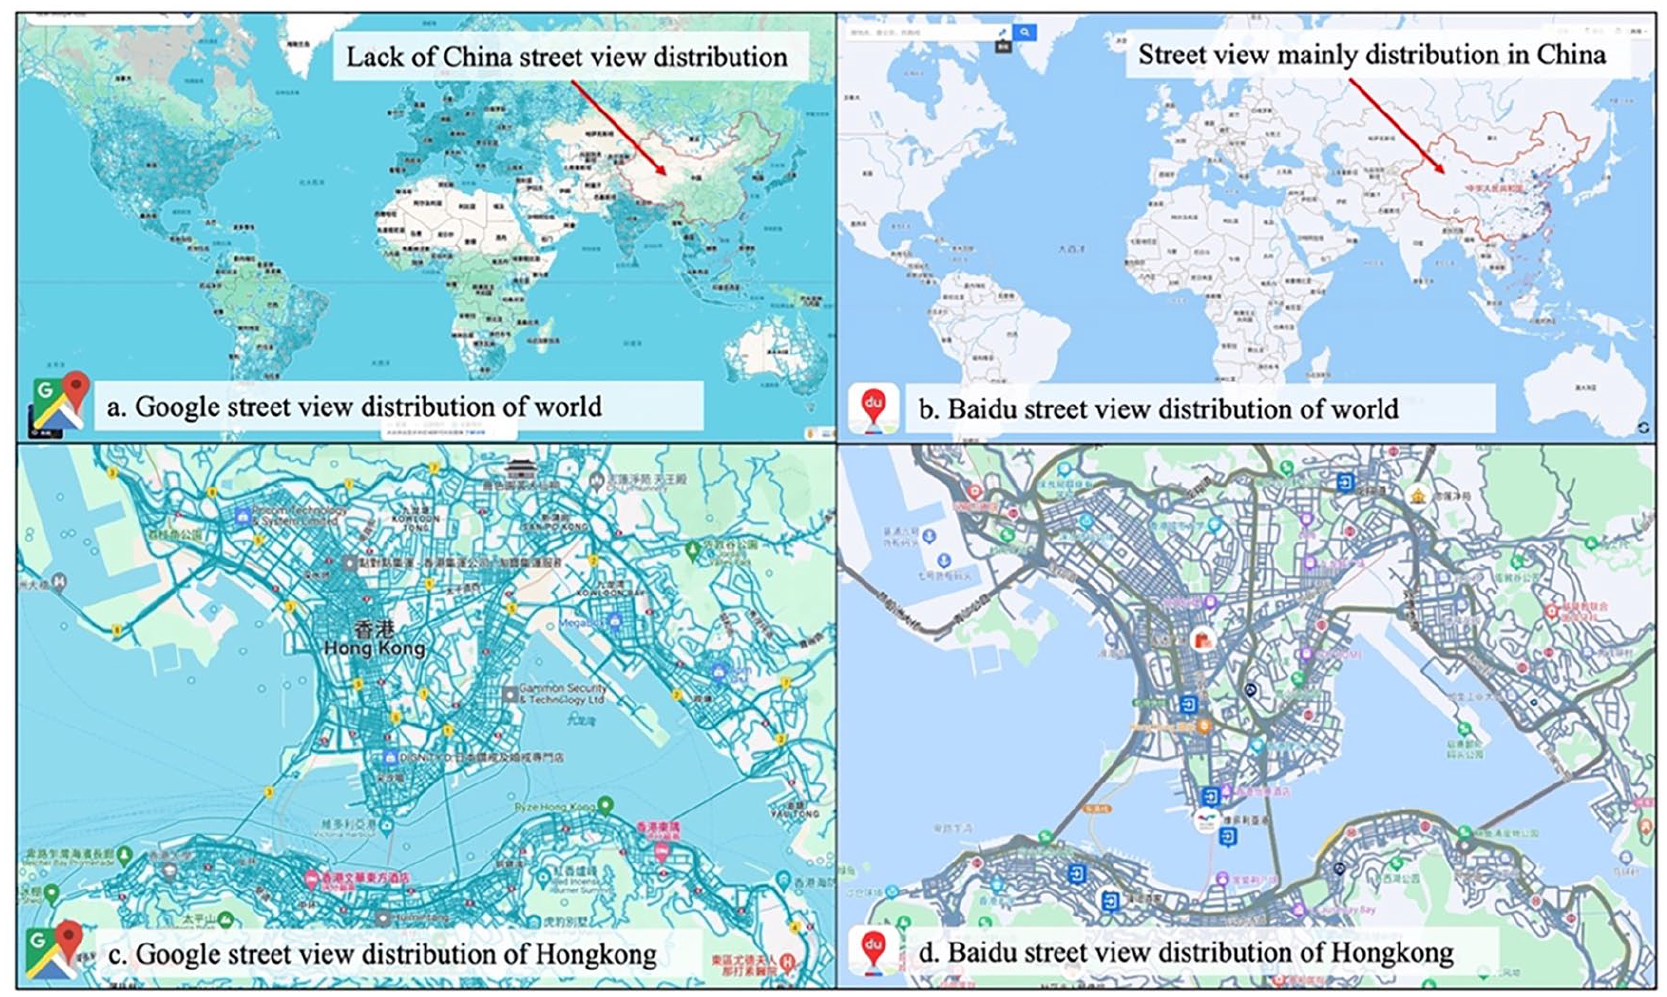
The distribution of street view map around the world. (a) GSV distribution around world. (b) BSV distribution around world. (c) GSV distribution in Hong Kong SAR. (d) BSV distribution in Hong Kong SAR. The sources of the maps in the figure are as follows: Google Maps: https://www.google.com/maps/, and Baidu Maps: https://map.baidu.com/.
Methodology
Traditional street view collection method
Researchers collection steps for GSV and BSV
Most studies employ a similar method of collection. Initially, road network data are required, with most studies sourcing this data from OpenStreetMap or other open sources. Due to limitations with the use of collection vehicles and the density of collection, SVI struggles to cover every street within the urban road network. When collecting street view data, invalid data may occur, referring to street views that have not been captured. Such uncaptured street views are typically located in remote areas or regions that are difficult for vehicles to access. Therefore, the absence of data from these areas does not significantly affect the representation of the built environment in urban settings. Thereafter, geographic information data processing platforms (such as ArcGIS, QGIS, geopandas, etc.) are used to divide the road network at fixed intervals, setting the division points as SVI collection points and calculating their geospatial positions to obtain latitude and longitude coordinates. There has been no specific reference parameter for setting collection intervals, but many studies suggest using intervals of 50 meters or 100 meters as common choices(Tang et al., 2024; Wang et al., 2022, 2024a; Zhang et al., 2024). In our results section, we discuss the settings of these intervals to ensure optimization of the collection results. Finally, the SVI points’ latitude and longitude coordinates allow for access and retrieval of SVI through the map platform’s API interface or via URLs to the map platform for data access and collection.
Traditional SVI collection method shortcomings
Firstly, there is no official reference for setting the collection intervals, nor has research provided clear indicators for this parameter. Previous studies have not identified methods using the density and distance of the source data for collection. Additionally, discrepancies often exist between the geographic coordinates of collection points set according to the road network and the actual locations where the data is collected by the vehicles. This leads to several issues:
If the interval setting is too wide, the SVI collection will be incomplete, failing to fully represent the distribution of urban streetscapes.
If the interval setting is too narrow, it results in the collection of duplicate, identical SVIs.
There is a discrepancy between the SVI’s recorded coordinates and the actual coordinates, causing errors in the geographical distribution of the analysis results.
Solutions to these problems will be provided in the following section.
Street view collection method based on metadata
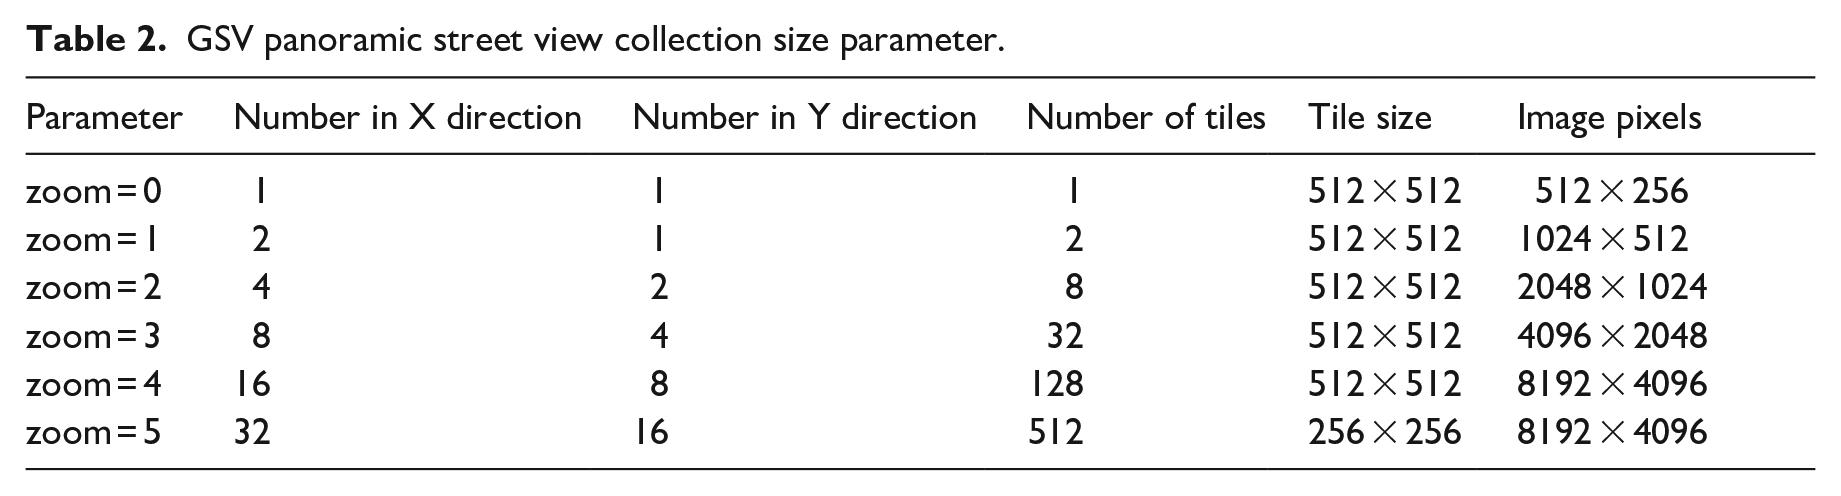
Users can access the SVI service on the Baidu or Google Maps platforms via a web browser. The metadata received by the browser contains a wealth of information, including the unique ID of the SVI associated with its latitude and longitude coordinates, allowing access to the corresponding SVI on either the Baidu or Google platforms. Additionally, the metadata includes details such as the altitude, angle, time, and azimuth of the shot. High-resolution street-view images need to be transmitted in a tiled format. During the access process, x and y coordinates represent the row and column of the tiles, respectively. Once the browser receives the tiles for the corresponding zoom level, they can be assembled to display a high-definition full panoramic image. The tile images are also accessed via the unique ID associated with the SVI location. In GSV, the highest zoom level is 5, with a total of 512 (32 × 16) image tiles, and the full panorama resolution is 8192 × 4096 pixels. In BSV, the highest zoom level is also 5, with 128 (16 × 8) image tiles, and the full panorama resolution remains 8192 × 4096 pixels.
The description above illustrates how many original details are included in the SVI metadata accessible through web pages. Based on this feature, we propose an SVI collection method that captures every SVI in urban spaces without omission. This collection method only saves the SVI metadata and does not store the corresponding SVI itself. This is beneficial for evaluating the spacing of SVI collections, providing essential data and assistance. Each SVI has a unique serial ID on the server, allowing access to the SVI via the unique ID. Requests for a single coordinate also return the ID information of adjacent SVIs on the same street. Baidu storage method retrieves the metadata through a single SVI coordinate, also obtaining the serial numbers of all adjacent SVIs on that road. If the SVI location is at an intersection, it can also obtain the serial numbers of adjacent intersection SVIs. Google, however, directly returns the serial numbers of all SVIs adjacent to the road where the SVI is located, without differentiating between roads and intersections.
We have developed a program starting at a point (longitude: 114.15739539598744, latitude: 22.283968941984877), located on a central urban area road. Accessing the Baidu and Google platforms from this starting point, we parse the metadata for adjacent SVI IDs, saving the starting position ID and adjacent position IDs. In the next cycle, we randomly select IDs from those not yet collected for metadata acquisition, checking whether the results have already been saved. This process involves extensive operations of reading, writing, deleting, and searching. The program uses a lightweight and highly reliable SQLite database for data management, as shown in Figure 3. This approach, resembling a spiderweb, gradually expands and collects all SVI metadata information with increasing iterations. This method addresses the issue of SVI omissions in traditional collection methods, although it involves a massive volume of data collection. Nevertheless, this metadata can still be used to evaluate the errors present in traditional methods. It is important to note that all SVI data collection for this study was completed by December 2023.
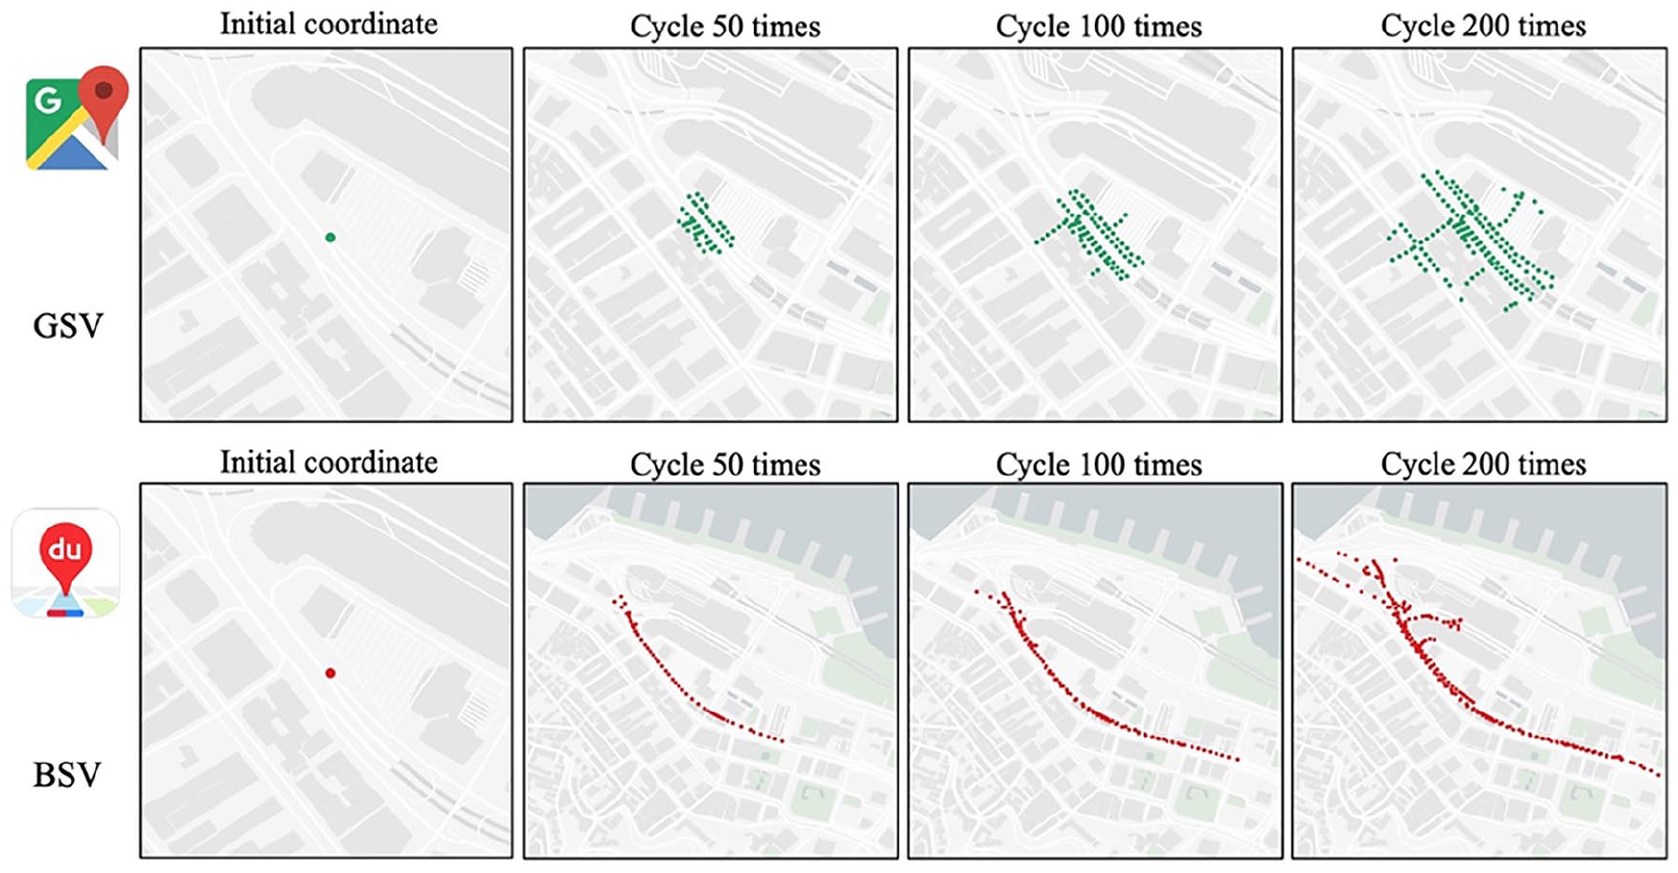
Spider-web collection method for metadata adjacent information in GSV and BSV.
Street view interpretation of urban built environment
To conduct a comparative study on the data quality and availability of GSV and BSV, it is necessary to collect data and perform matching preprocessing operations. First, SVI collection points are established at 50 meter intervals. Subsequently, GSV and BSV data are collected separately. Due to the uncertainty of SVI distribution, the distribution of SVI from the two platforms is not entirely consistent in urban streets. Finally, the collected valid data are matched one by one to ensure that each street view point has both GSV and BSV data.
In urban SVI research, a significant number of studies extract visual elements from SVI to explain various urban phenomena. Similarly, in our study, we used deep learning-based image semantic segmentation technology to extract results from GSV and BSV. We employed a deep learning model based on the ResNet101 architecture (Zhou et al., 2018), which is one of the best models for image segmentation and recognition tasks. ResNet101 is a convolutional neural network with 101 layers that can learn and predict complex environmental features from SVI. The pre-trained model used in our study has an image semantic segmentation accuracy of 80.91%, meeting the requirements for SVI visual element analysis.
To explore the similarity of visual elements in GSV and BSV, we used the Pearson correlation coefficient to measure the strength and direction of the linear relationship between the visual elements of GSV and BSV. The Pearson correlation coefficient, named after the mathematician Karl Pearson, is widely used in various fields of scientific research and data analysis, especially when there is a need to assess the possibility of a linear relationship between variables. This coefficient is commonly represented by the letter “R” and ranges between −1 and 1, where a value closer to 1 indicates a perfect positive correlation. The formula for the Pearson correlation coefficient is given by Equation (1):
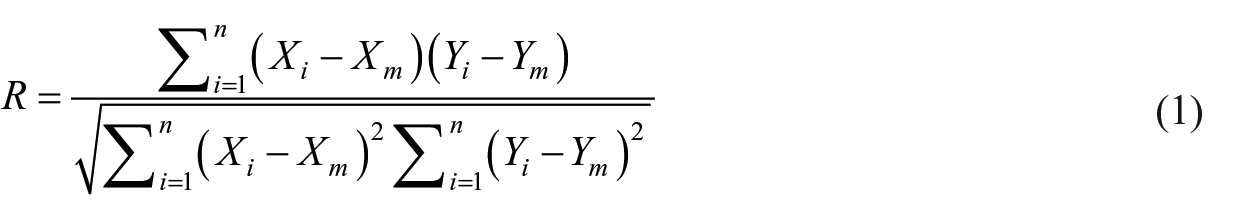
Here, Xi and Yi represent the observed values of GSV and BSV visual elements, respectively, while Xm and Ym are the mean values of the GSV and BSV visual elements, respectively.
Parameter setting for street view collection
Comparison of acquisition parameters between GSV and BSV
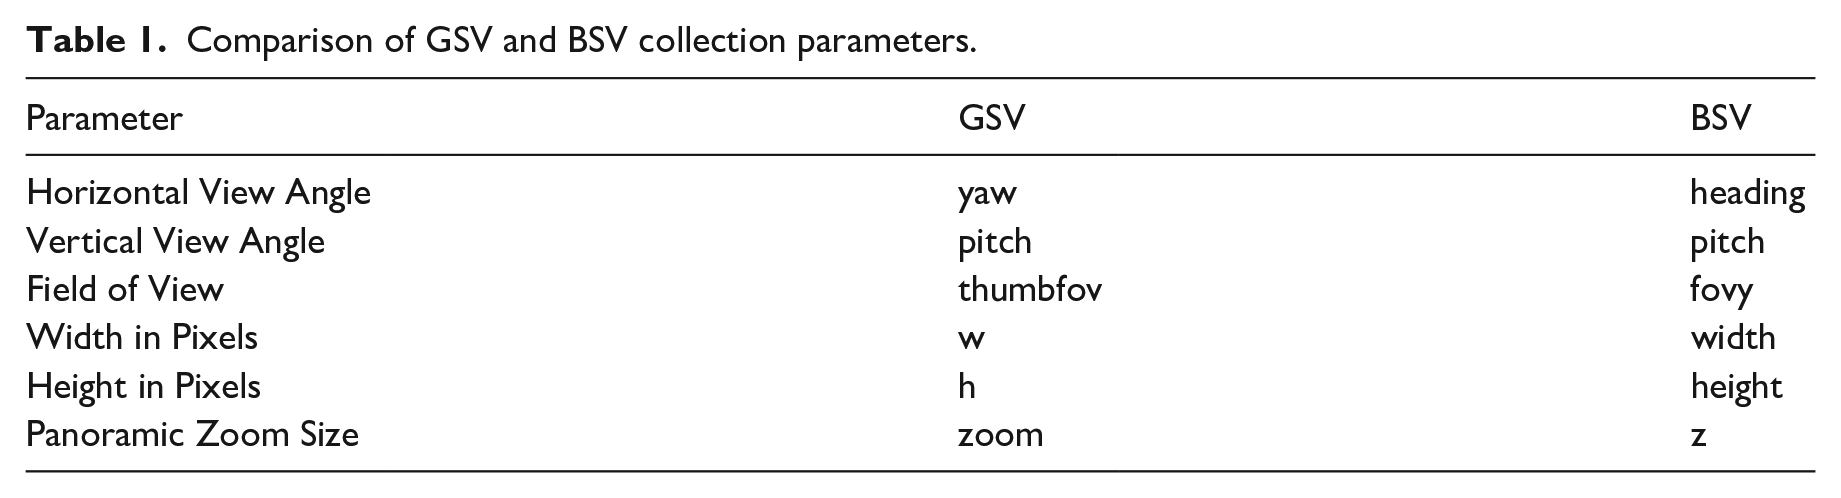
SVI is captured from a panoramic perspective, allowing views in different directions to be shot from the same location. However, during acquisition, it is possible to control the results of the returned images by setting parameters. There are two types of images: panoramic images, which are the same as the shooting format, and human-view plane images. Table 1 lists all the parameters for accessing different types of SVI. It is important to note that GSV and BSV have the same settings parameters, but the parameter names are not the same.
Comparison of GSV and BSV collection parameters.
SVI camera field of view
Previous studies have seldom discussed in detail the comparison of this specific acquisition parameter between the two platforms. By adjusting the field of view settings of the cameras on the GSV and BSV platforms, one can modify the distortion of the captured horizontal view angle. This adjustment also affects the overlap of seams when the four views are stitched together. In Figure 4, we fixed the image size at 1024 × 768 and only changed the field of view settings of the two platforms. From the comparative results, it can be observed that there are slight differences in the field of view settings between GSV and BSV. To reduce the disparity in SVI views between the two platforms, after multiple tests, we recommend setting the focal lengths to 90 for GSV and 74 for BSV as most suitable.
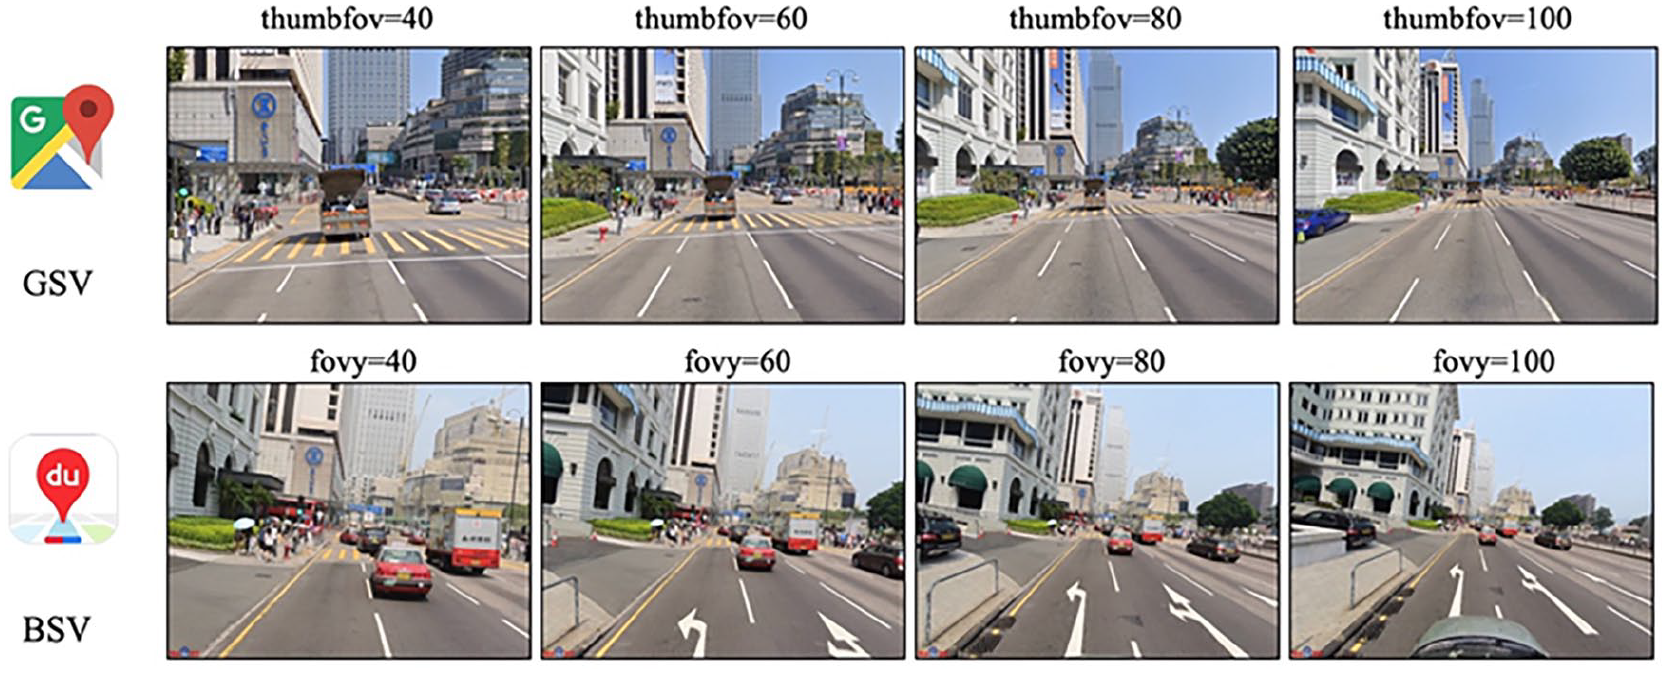
GSV and BSV settings of field of view.
SVI horizontal and vertical angles
In the capture of perspective views, it is necessary to control the horizontal view angle (this parameter is not required for panoramic images). Previous studies have typically captured views in four directions at 90-degree intervals (Chen et al., 2022; Tang et al., 2020) or in six directions at 60-degree intervals (Zhou et al., 2022a). Unlike panoramic images, which may lose parts of the sky and ground, the perspective view better reflects pedestrian perspective outcomes. This method also involves accessing data from panoramic cameras. However, due to user demands, map service providers may crop and distort panoramic images to convert them into perspectives similar to normal human viewing angles, as shown in Figure 5. For the horizontal view angle, we recommend using a 90-degree angle in four directions for acquisition. The vertical view angle should be set to 0 degrees to capture as comprehensive a view of the street as possible with minimal data.
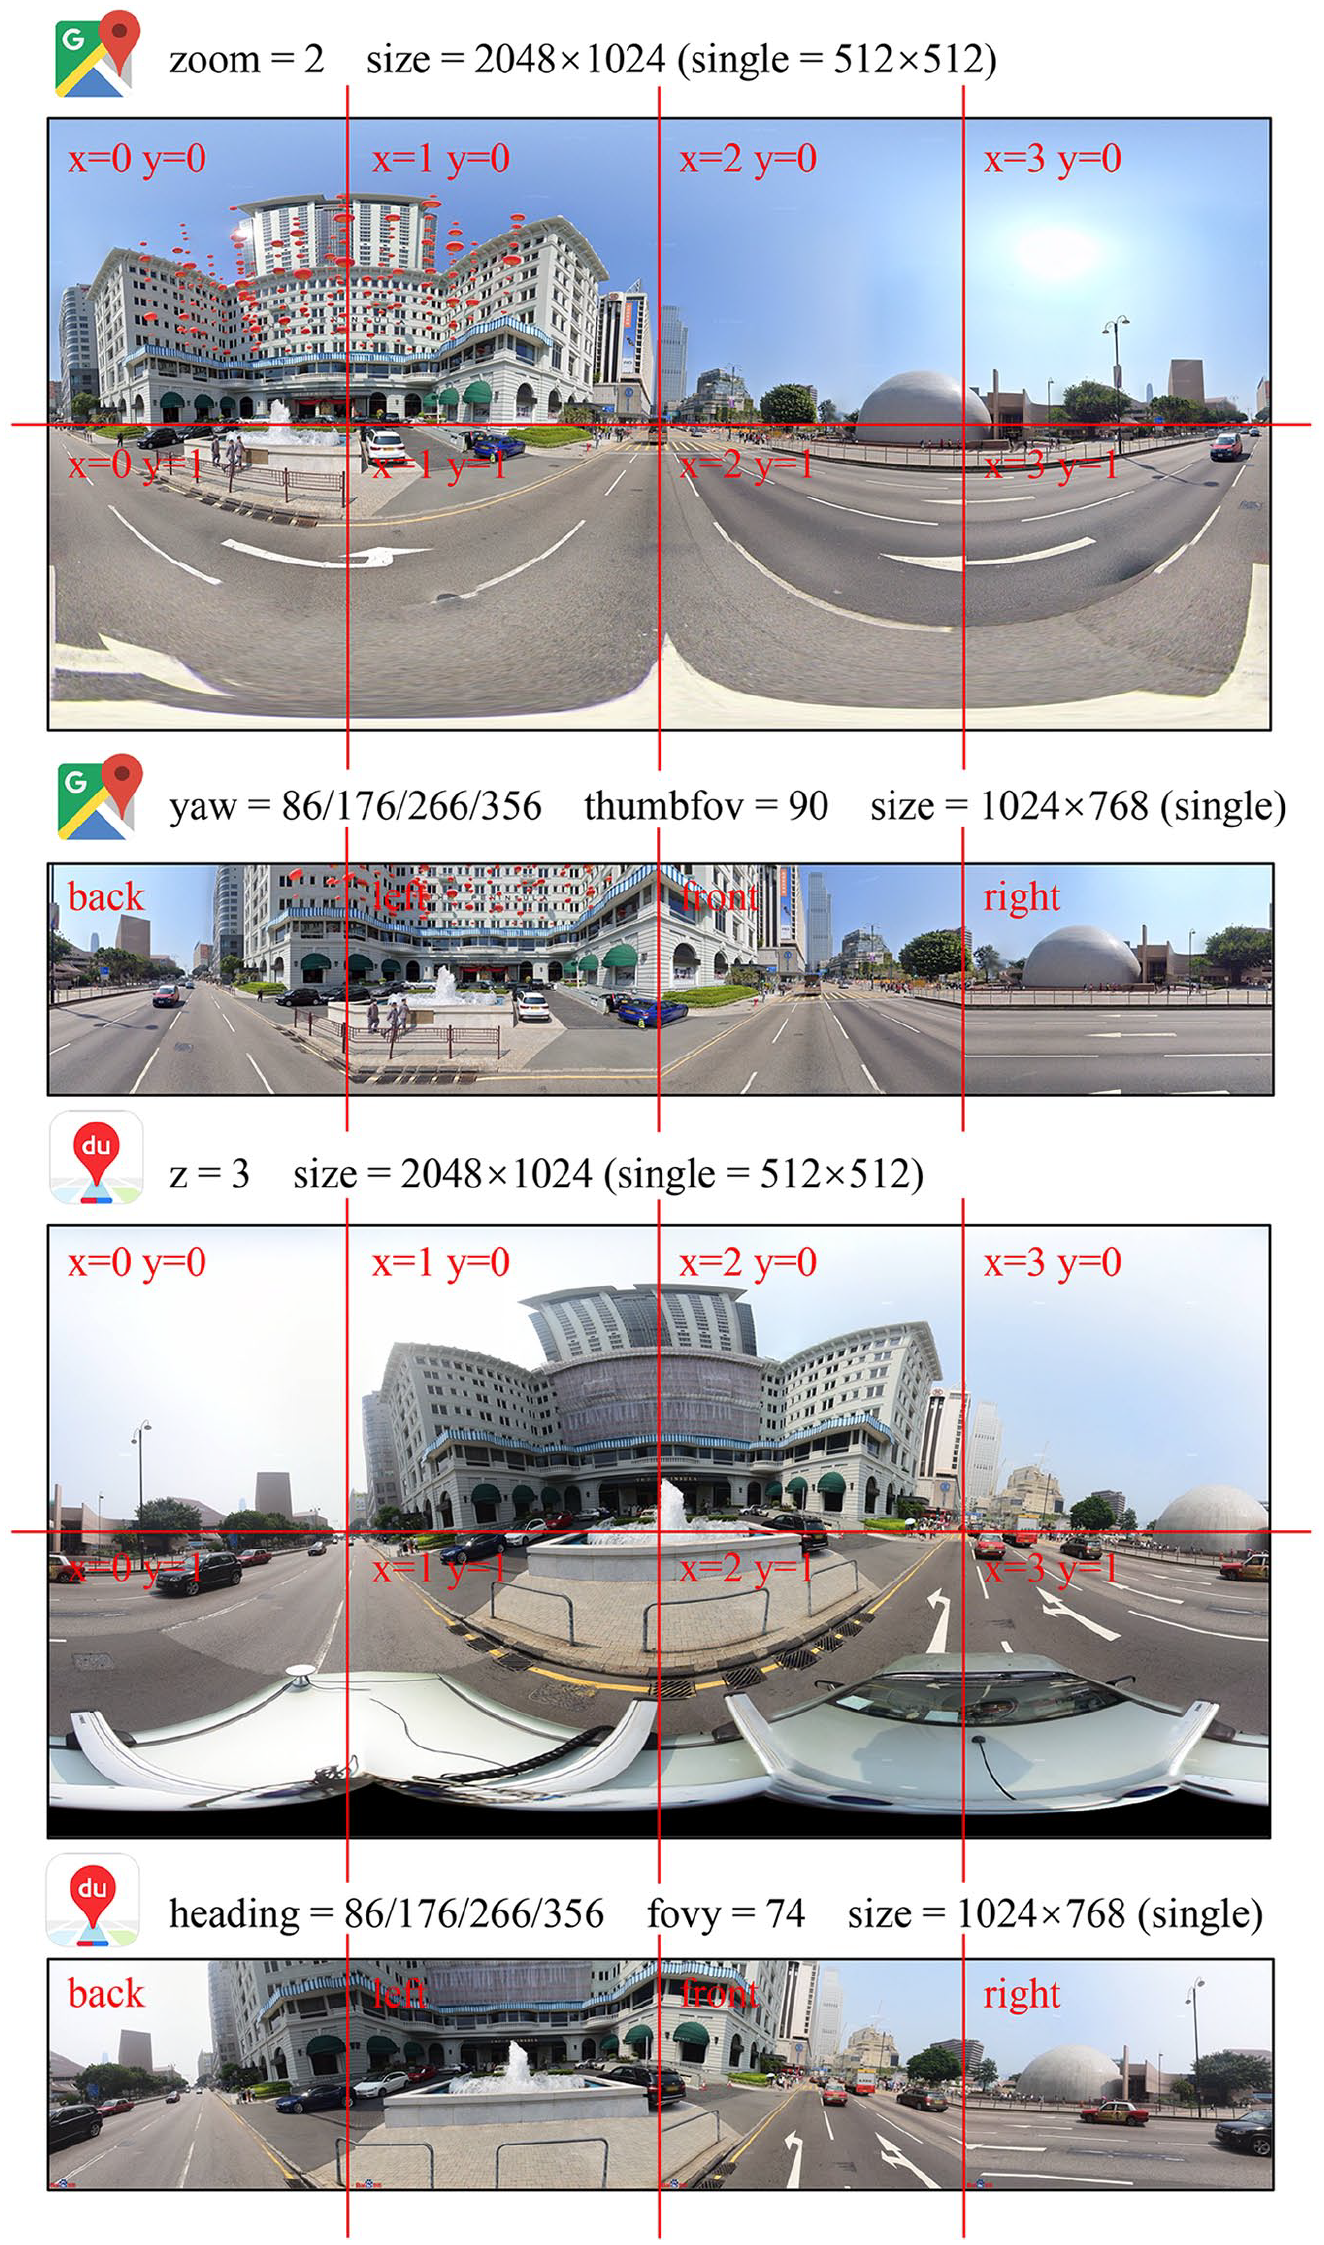
GSV and BSV panoramic views and perspective views.
SVI collection size
The collection vehicle uses a panoramic camera for data acquisition, which can comprehensively reflect the urban street space. However, when users access the service, map service platforms provide two methods for returning SVI: panoramic view SVI and perspective view SVI (Figure 5). Each type of view has its own range of image size settings.
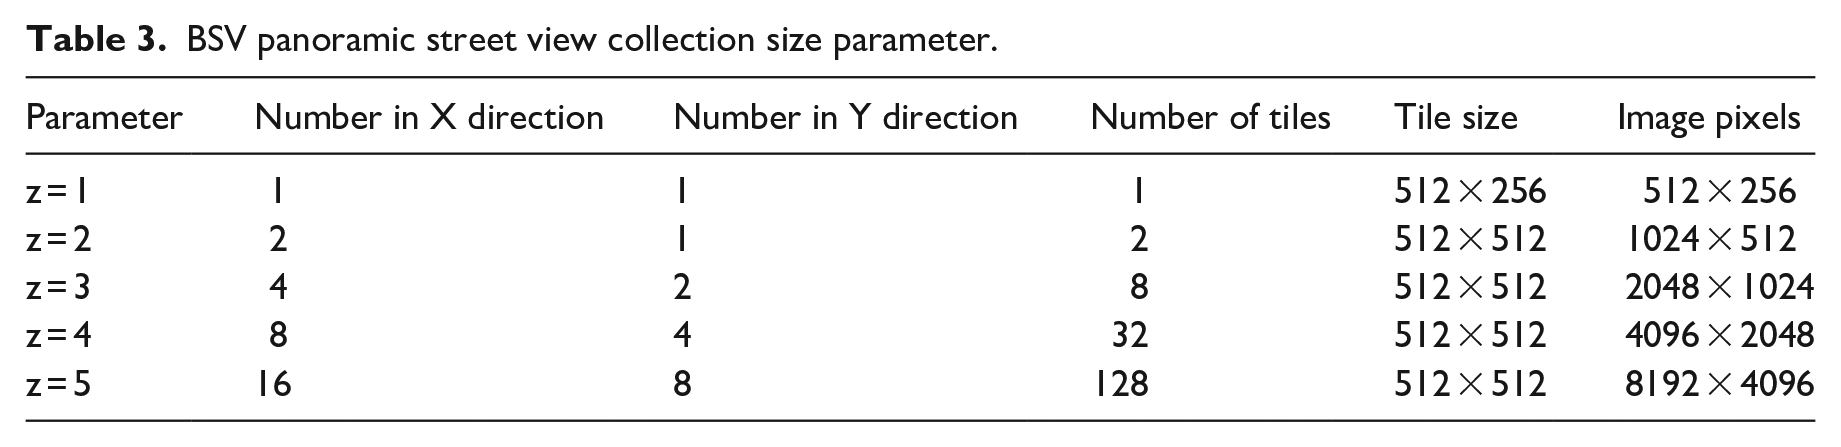
In panoramic street views, panoramas with overly large pixel dimensions cannot be transmitted in their entirety in one go. The image is instead divided and sent using tiles. These tiles are then assembled back together within the user’s browser. In both GSV and BSV, the “zoom” and “z” parameters are used respectively to control the pixel size of the SVI. At different zoom levels, the “x” and “y” parameters control the rows and columns of the tiles (Li and Ratti, 2019). In Tables 2 and 3, we have compared the SVI acquisition parameters for GSV and BSV. From these tables, we can observe that by setting appropriate parameters, we can collect panoramic images of the same size for subsequent research and analysis. Additionally, it is important to note that when the zoom size is excessively large, the disk space occupied by the SVI also increases exponentially. Therefore, we recommend using a panoramic view SVI with pixel dimensions of 1024 × 512 when studying large-scale urban areas, and a dimension of 2048 × 1024 for smaller-scale urban areas.
GSV panoramic street view collection size parameter.
BSV panoramic street view collection size parameter.
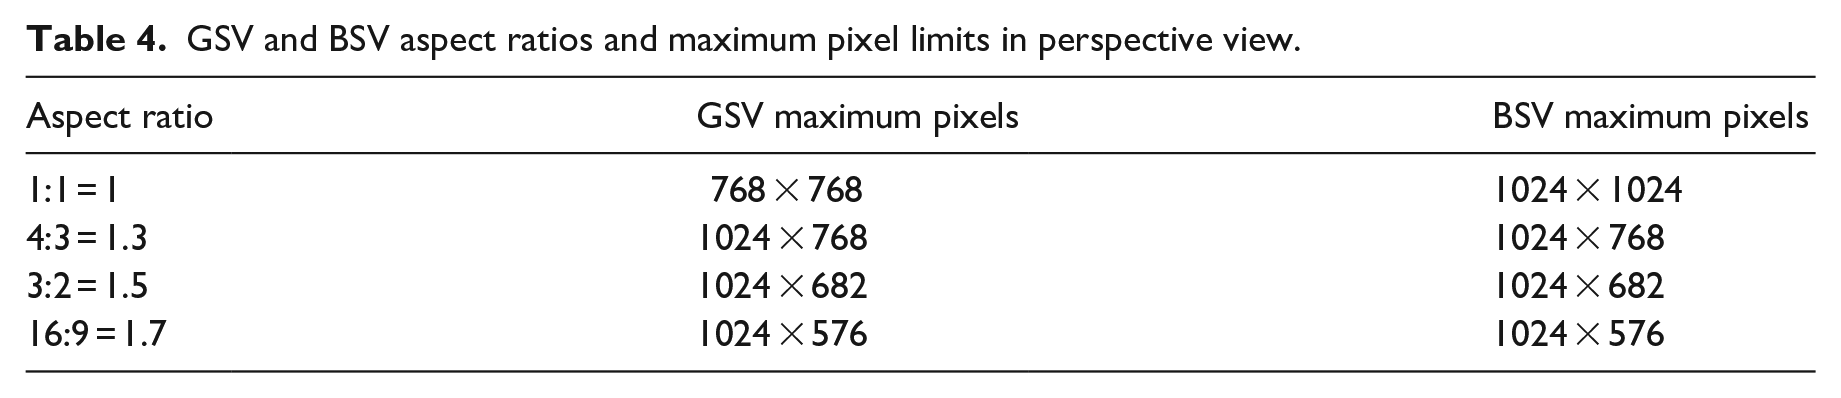
In the SVI from the perspective view, transmission occurs only once, ensuring that the size of each SVI remains manageable. However, the aspect ratio of images within the perspective view also influences the maximum pixel capacity of the image acquisition. In Figure 6 and Table 4, we compare the maximum pixel values of the SVI for GSV and BSV under different aspect ratios. For the acquisition of GSV and BSV, we recommend using a 4:3 ratio with a corresponding resolution of 1024 × 768 pixels. This ratio effectively balances the preservation of human perspective while minimizing the loss of sky details. Additionally, using the same pixel dimensions facilitates error reduction in comparative studies.
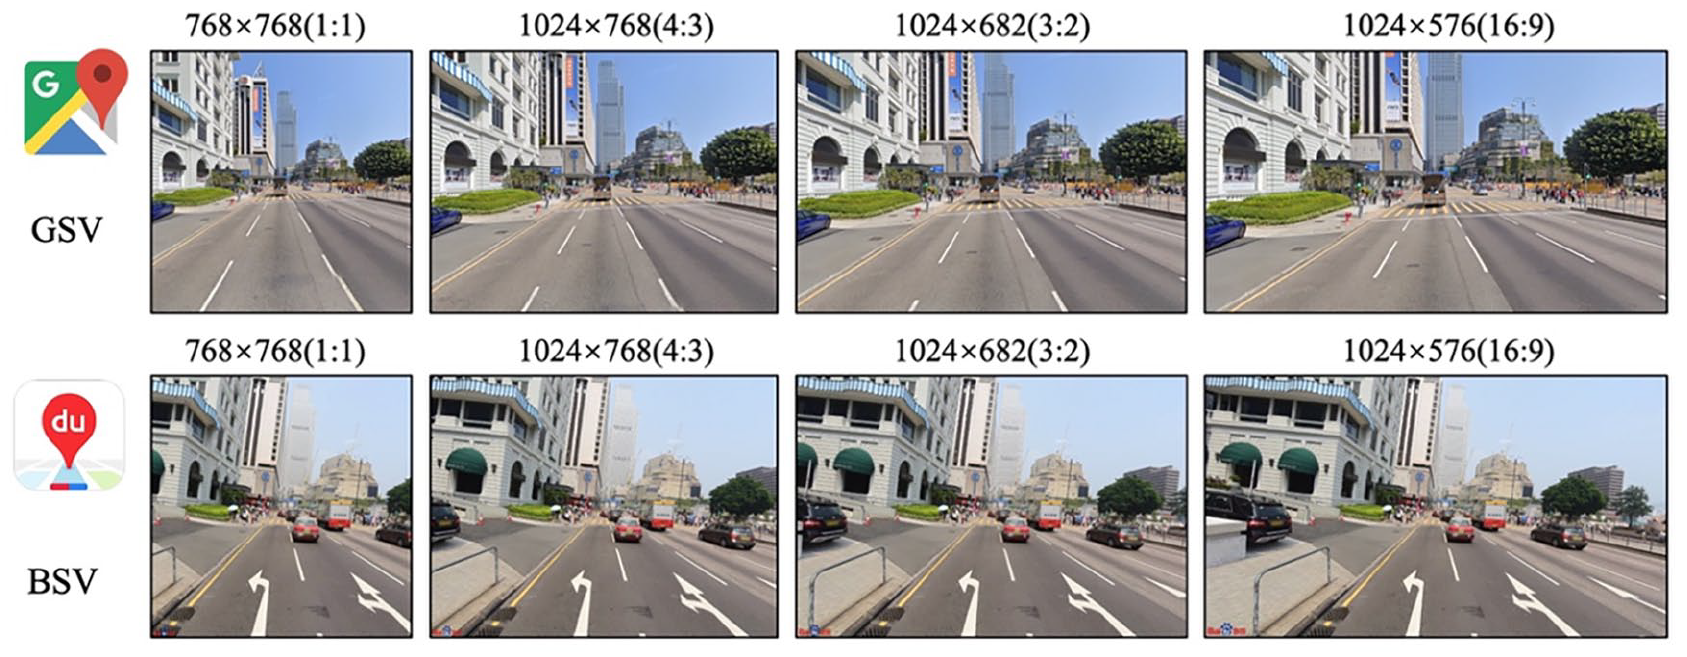
GSV and BSV aspect ratio.
GSV and BSV aspect ratios and maximum pixel limits in perspective view.
Street view collection time series
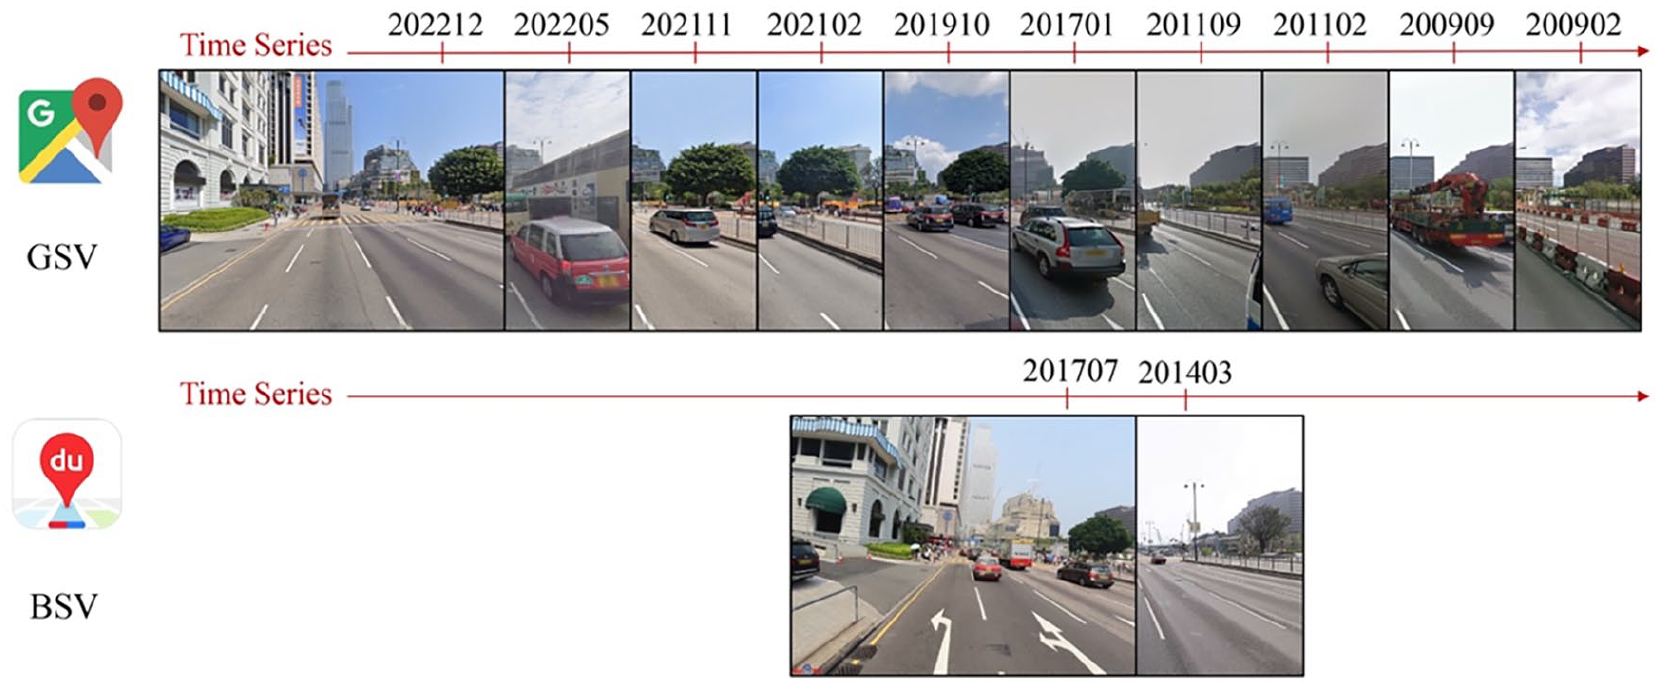
Collection vehicles will repeatedly traverse the same road over different years to gather SVI data. Users can view the SVI data from different years via a website. Both GSV and BSV feature this capability, referred to as the “Time Machine”. However, there is a difference in the completeness of the SVI time distribution. Figure 7 shows that at the same location in Hong Kong SAR, the GSV timeline is significantly more comprehensive and complete compared to the BSV timeline. GSV data traces back to February 2009, with the most recent SVI collected in December 2022, providing more than 10 years of SVI information. In contrast, the BSV street view time distribution only includes data from March 2014 and July 2017.
GSV and BSV temporal richness.
Due to the specific routing of the collection vehicles, the temporal sequence of all roads within a city is not identical. This presents a challenge for consistency when using SVI from both platforms. The analysis of the richness of the temporal sequences of GSV and BSV suggests that SVI from the same temporal position (2017) should be used for analyzing phenomena in the same city. Additionally, for conducting large-scale, multi-city studies, it may not be possible to standardize the collection years for all cities. In such cases, the guideline to follow is to select years as close as possible and preferably within the same season, such as summer, to minimize the impact of varying urban development conditions on the analysis results.
Street view collection interval and repetition rate
Traditional SVI collection methods involve the use of the OpenStreetMap platform to gather road network data, setting specific intervals to generate SVI collection points. These points are accessed through their geographical coordinates on a map server. SVI data is collected by vehicles driving on designated routes. As illustrated in Figure 8, when the mapping platform processes requests from users, it searches for nearby coordinate positions based on the input longitude and latitude, returning the SVI and its data. If two points are too close, the same SVI serial number is returned. If the points are too far apart, continuous SVI data may be missed. Thus, traditional collection methods inevitably produce errors.
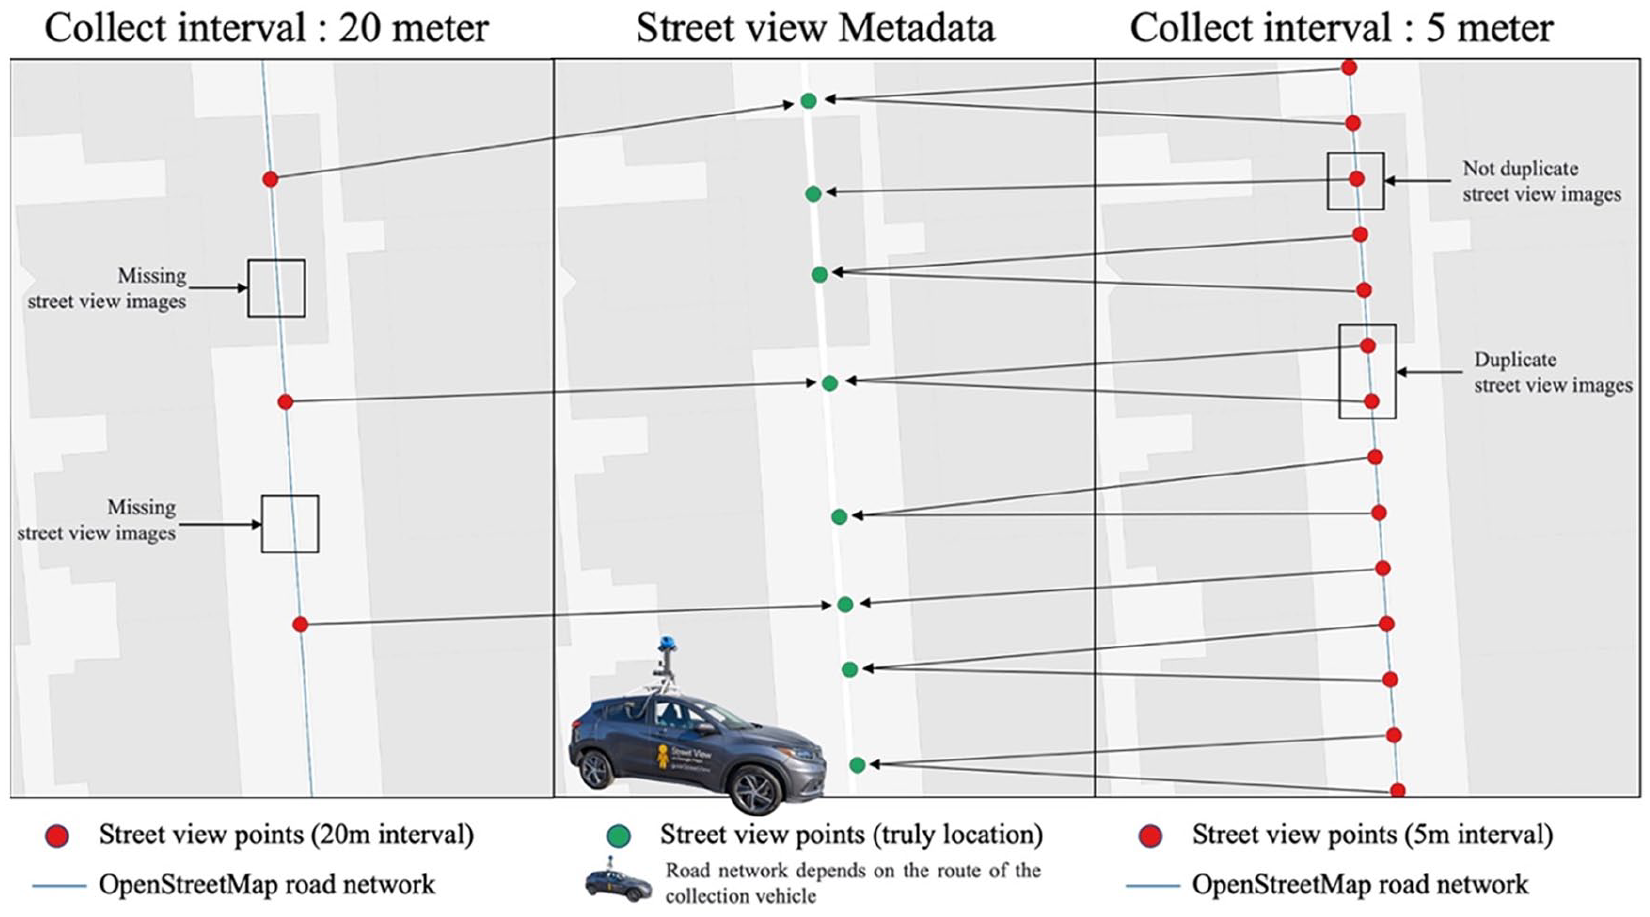
Excessively large and small collection intervals will result in the missing and duplication of SVIs.
The driving speed of the SVI collection vehicle is not fixed, thus the intervals between the collected SVI point coordinates are not entirely consistent. However, we can still calculate the optimal sampling interval parameter based on the average spacing of the latitude and longitude coordinates in the metadata. This is to ensure that the spacing set minimizes the absence and duplication of completed SVI collections as much as possible. The specific calculation method involves using the metadata SVI point coordinates to search the point coordinates generated by traditional methods. The search checks whether there are traditional method coordinates within a 50-meter radius of each metadata coordinate point. If there is no point within this radius, it is considered missing. If there is one point, it is valid. If there is more than one point, it is considered a duplicate.
Experiment and results
In our methodology, we discussed several approaches to compare the data quality and availability of GSV and BSV. Among these, the aspects most worthy of presentation and comparison in terms of availability were the temporal distribution of SVI, the effectiveness of collection intervals, and the correlation of visual element results. These correspond to the comparison of the temporal distribution, spatial distribution, and intrinsic quality of the SVI data.
Time distribution and diversity of SVI
To explore the temporal richness of GSV and BSV, we collected SVI information using traditional fixed coordinate points. We generated 365,225 SVI collection points at 50-meter intervals, collecting temporal data of SVI from both GSV and BSV in Hong Kong SAR. Regarding the number of collections, GSV gathered 1,454,634 SVI data points, while BSV gathered 391,550. GSV demonstrated a more comprehensive and dense coverage in terms of temporal richness compared to BSV. The historical coverage of SVI points was also analyzed, revealing an average of 3.98 temporal data points per location for GSV, whereas BSV averaged only 1.07. For Hong Kong SAR covered by both GSV and BSV, GSV offers a more continuous reflection of urban development.
In Figure 9, we illustrated the temporal distribution of SVI updates for both map platforms. It is observable that GSV has been continuously updating SVI over the past three years. Updates ceased for ten months at the beginning of 2020, aligning with the disruptions caused by the COVID-19 pandemic. Earlier periods, such as 2009 and 2011, saw nearly a year spent comprehensively updating Hong Kong SAR’s GSV. Contrarily, BSV’s update strategy differs, focusing heavily on updates during specific periods such as March/April 2014 and July/August 2017. Thus GSV holds a significant advantage in timeliness, while BSV demonstrates better consistency in its updates.
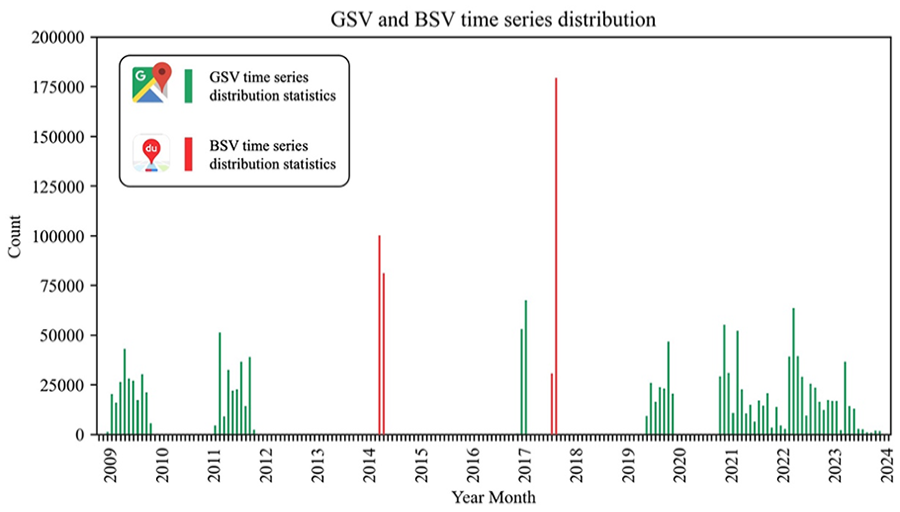
GSV and BSV time series distribution.
Validity and duplication of SVI
In the traditional methods of collecting SVI using platforms like GSV and BSV, discrepancies occur due to reliance on publicly available road network datasets, such as OpenStreetMap, which differ from the roads actually traversed by the collection vehicles. The algorithms used by map vendors expand the search latitude and longitude to return the nearest SVI within a typical range of 50 meter. This approach can lead to invalid collection points and duplicate results. In this section, we analyze the impact of different intervals on the efficiency and duplication rates. Using the metadata-based collection approach described in Section 4.2, we collected metadata from all SVI points in Hong Kong SAR for both GSV and BSV platforms as a method of simulating database access at various intervals. This technique significantly reduces redundant access, speeds up processing, and saves time. Common collection intervals set were 5, 10, 20, 30, 40, 50, 100, and 200 meters. For each interval, SVI points generated were matched against the nearest SVI information within 50 meters from the metadata database.
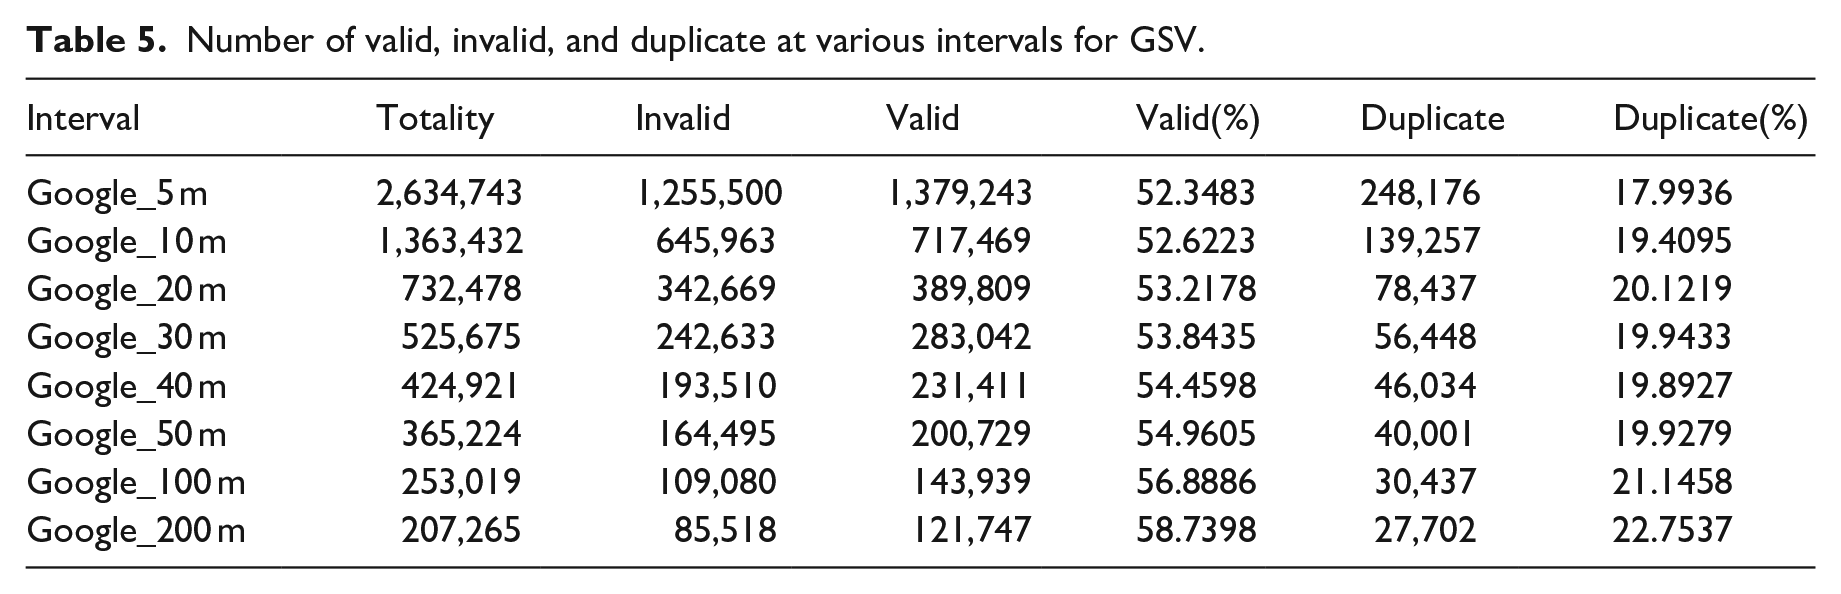
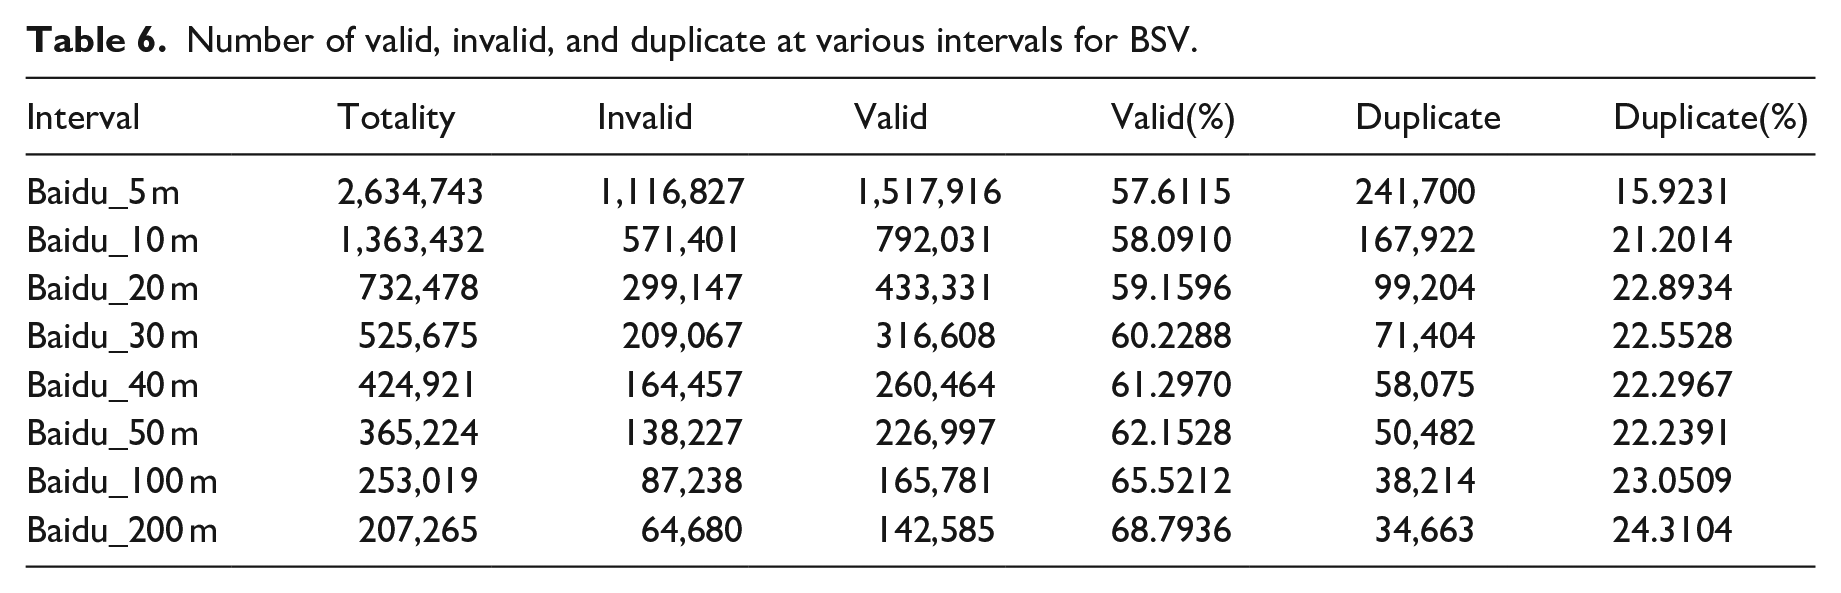
Tables 5 and 6 provide statistics on the number of SVI points generated, the number of valid SVIs and duplicate SVIs for both GSV and BSV platforms at different intervals. Figure 10 visually depicts these trends, showing that as the interval between SVI points decreases, the number of generated SVIs increases, and consequently, the proportion of valid SVIs also increases. The duplication rate gradually decreases between 20 meters and 40 meters but then increases with larger intervals. The increase in duplication rate at larger intervals is due to the proximity of SVI points being regenerated at intersecting roads, leading to overlaps. For this step, the “Generate Points Along Lines” tool in ArcGIS and the “Points along Geometry” tool in QGIS are primarily used. Both tools tend to result in duplicated points at intersections. Therefore, at the same intervals, BSV shows higher data validity and duplication rates compared to GSV. The differences in efficiency and duplication rates between the two platforms are within 10% across different sampling intervals.
Number of valid, invalid, and duplicate at various intervals for GSV.
Number of valid, invalid, and duplicate at various intervals for BSV.
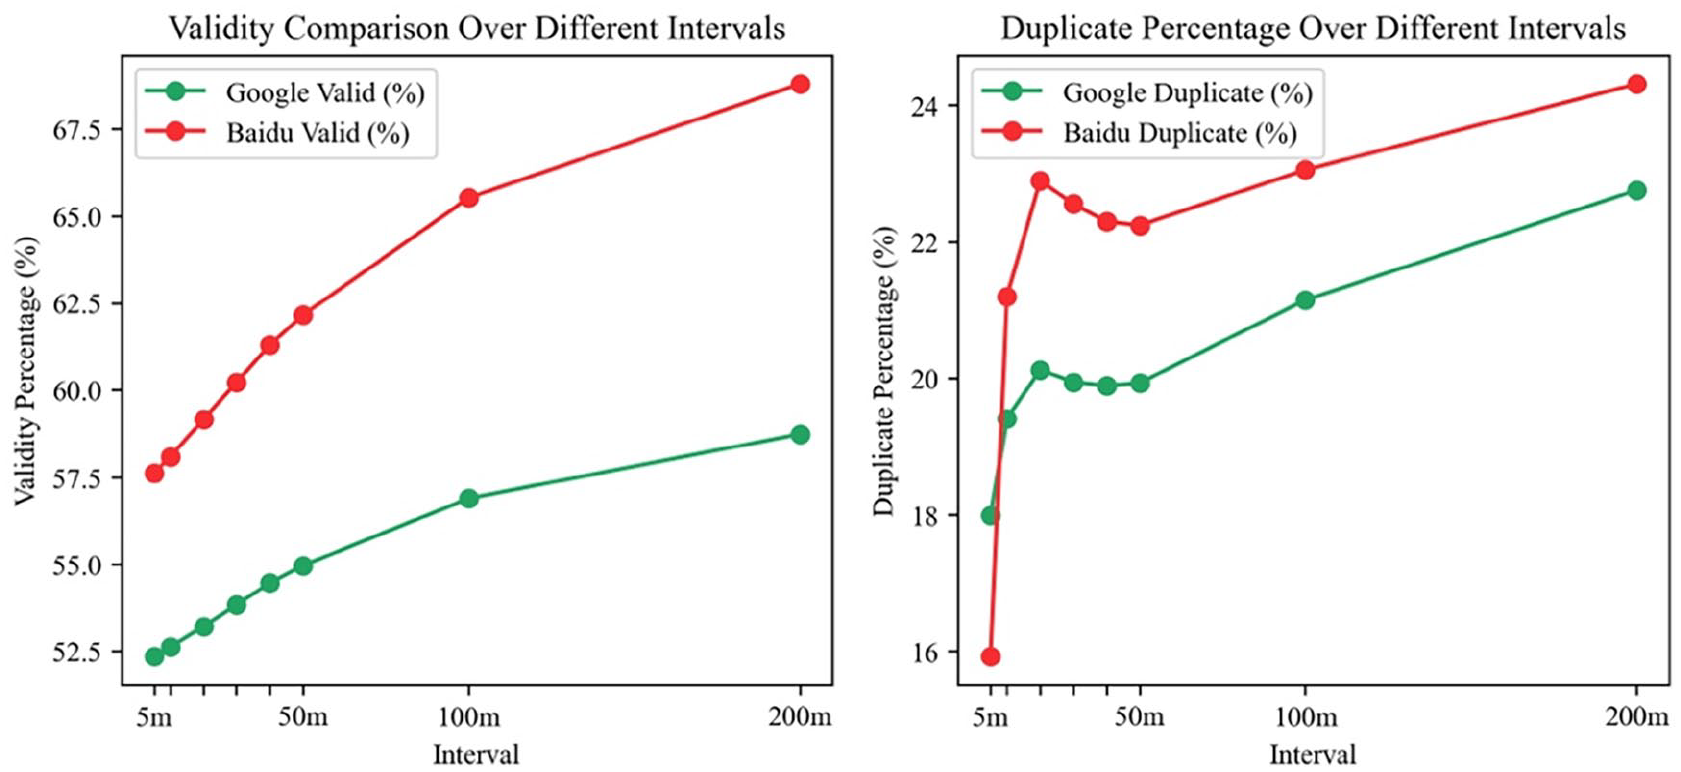
GSV and BSV validity and duplicate of collection under different intervals.
Visual element difference of SVI
In Figure 11, the relationship between the visual elements of GSV and BSV is depicted through scatter plots and correlation coefficients. For each point on the plot, the visual elements of GSV and BSV were collected and subjected to image semantic segmentation. The visual elements analyzed were Building, Greenery, and Sky. In the analysis of these three visual elements in Figure 11, the x-axis represents the GSV visual element results, and the y-axis represents the BSV visual element results.
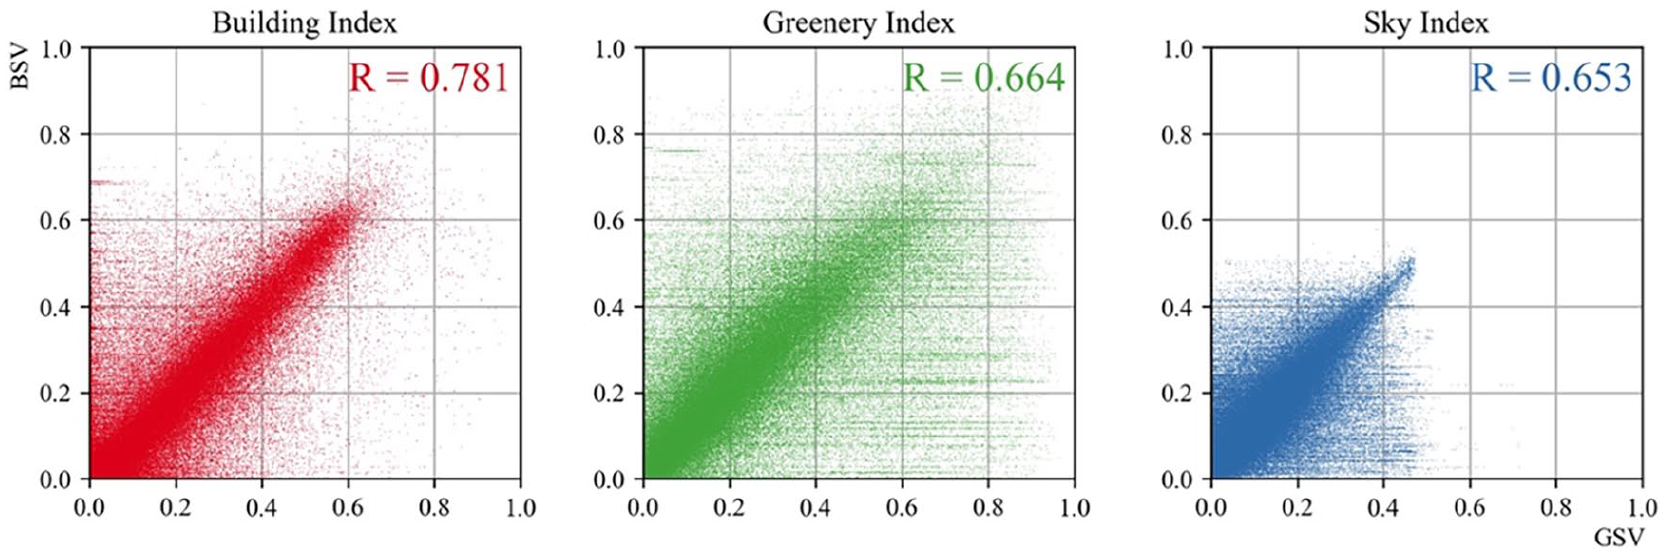
GSV and BSV visual element similarity analysis. We selected Buildings, Greenery, and Sky as the visual elements for analysis.
Several important observations were made. The overall correlation coefficients for the three visual elements are quite high, although differences exist. The strongest relationship is seen with Buildings, with a correlation coefficient R = 0.781. This is believed to be due to the fact that buildings in urban environments are the most static objects. As urbanization concludes, major changes in the skyline, such as new constructions or demolitions, are unlikely. The key finding is that the Building visual elements in GSV and BSV are very similar with the smallest error margin. Strong relationships are also seen with Greenery and Sky, with correlation coefficients of R = 0.664 and R = 0.653, respectively. This can be explained by the fact that Greenery includes complex vegetation structures such as trees, shrubs, and herbaceous plants, which are partially influenced by seasonal changes and human planting. Lastly, Sky shows a relatively weaker relationship. This is attributed to urban structures that obscure and impact the visibility of the sky, such as streetlights, buildings, and greenery.
Therefore, Figure 11 reveals a strong positive correlation between the GSV and BSV visual element results. This indicates that as the GSV visual element variables increase, the BSV visual element variables also significantly increase. There exists a significant linear relationship between the two variables. This supports our research hypothesis that, in the same locations, GSV and BSV data produce very similar analytical results.
Discussion
Complementary use of GSV and BSV
Street view data is commonly used to analyze various urban phenomena, with researchers often employing multiple different cities for comparative validation. This can include different cities within a single country or cities from different countries (Fan et al., 2023; Garrido-Valenzuela et al., 2023; Kang et al., 2021; Kim, 2023; Kruse et al., 2021; Wang et al., 2024b; Yan and Ryu, 2021; Zhang et al., 2018b; Zou and Wang, 2022). The potential application of our work lies in demonstrating the complementary roles and usability of GSV and BSV when used together to validate the same urban phenomena. Additionally, it is hoped that this will serve as a reference manual for future street view researchers.
Our research findings indicate that there are some differences between GSV and BSV. We believe these differences are primarily due to two main reasons. Firstly, the temporal factor; GSV and BSV images of the same location taken at different times can result in significant discrepancies (Stalder et al., 2024). For example, the growth of plants over different periods and the demolition and construction of buildings can lead to notable variations. Secondly, the collection tools factor; although both GSV and BSV use professional collection vehicles for street view imaging, the vehicle speed settings and shooting parameters during the image capture process significantly influence the differences observed.
Importantly, our evaluation results clearly indicate that GSV and BSV can be used complement and can, to some extent, explain urban built environment phenomena. In terms of temporal distribution, GSV has had SVI updates in the last three years and ten years ago, showing better real-time updates. BSV underwent significant updates to its data collection vehicles in 2014 and 2017, demonstrating better performance in terms of consistency. In terms of collection effectiveness, we tested different spacing parameters from 5 m to 200 m. BSV showed better effectiveness than GSV, meaning that BSV produced fewer instances of failed image collection. In terms of repeatability, we also tested spacing parameters from 5 m to 200 m. Except for the 5 m interval, BSV also had a higher repetition rate than GSV at other parameters, indicating that BSV would also collect more repetitive SVIs at the same interval. In terms of visual element differences, we selected Building, Greenery, and Sky for analysis, with Pearson correlation coefficients for GSV and BSV of 0.781, 0.664, and 0.653, respectively. This indicates that GSV and BSV data show highly similar analytical results in visual element analysis at the same geographical spatial location. This support the idea that GSV and BSV can be used in a complementary manner.
Research contribution
Over the past decade, an increasing number of scholars have attempted to use SVI to better measure the physical environment and various phenomena of our cities (Naik et al., 2014; Zhang et al., 2020; Lei et al., 2024). Data from GSV and BSV have become recognized as promising sources. However, there is almost no guidance available on the effective joint use of GSV and BSV to measure different urban landscapes. Furthermore, there is a lack of research discussing the extent to which the measurement results of these two types of data can explain the same urban built environments and phenomena. In this context, this study explores the gaps and potential uses of GSV and BSV data in multiple dimensions in a specific city (Hong Kong SAR, China):
Limitation and future works
Future research should also address some limitations. Firstly, this study discusses data usability from the parameters and visual elements level of GSV and BSV data. Although we used the same collection parameters to keep both types of SVI consistent, with the advancement of computer vision technology, using higher-precision deep learning models such as SegFormer and extracting more complex types of visual elements could help improve the quality and usability of SVI data (Xie et al., 2021). Secondly, generating point clouds from SVI to create digital 3D city models is an exciting idea (Xu et al., 2022; Zhou et al., 2022b). Finally, due to Hong Kong SAR’s unique political environment and geopolitical status, there may be implications for the collection of SVI by different mapping companies, particularly in terms of collection frequency. The internal collection strategies of mapping companies remain unknown to us. In the future, comparing typical major cities may help quantify the extent of such impacts. For instance, this could involve comparing GSV coverage between Hong Kong SAR and cities outside mainland China, as well as BSV coverage between Hong Kong SAR and cities within mainland China.
Conclusion
SVI has become a significant geospatial data resource and an essential metric in various urban environment analyses. This growth is primarily due to the development of SVI supply platforms based on map service providers, advancements in computer vision technology, and increased computational resources. Among these, GSV and BSV are the most widely used. GSV is available in the vast majority of cities worldwide, although it excludes China due to national policies, a gap that is filled by BSV. Since GSV and BSV are provided by different map service providers, there are discrepancies in their data, leading to a lack of unified standards for combined usage and research. This study is the first to comprehensively compare the data quality and usability of both types of SVI.
In this study, we developed a data collection method based on a spider-web expansion model. We defined standard parameter settings for the joint use of SVIs from different map service providers. Using an SQLite database to manage over 700,000 SVIs, we conducted comparative experiments covering almost all parameter indicators, including spacing, pixel quality, field of view, aspect ratio, and built environment elements. Our research findings are as follows: (1) We established parameter setting standards for the complementary use of SVI from different map platforms. The parameter settings refer to Tables 1 to 6. (2) We demonstrated that under different spacing conditions, BSV outperformed GSV in both collection efficiency and duplication rate, while GSV exhibited better temporal integrity than BSV. (3) We verified a high correlation between GSV and BSV in visual elements such as buildings, greenery, and sky, with correlation coefficients (R) of 0.781, 0.664, and 0.653, respectively. This study addresses the bottleneck of using GSV and BSV together, unlocking the potential of billions of SVIs and enabling street view research on a global scale with the capability of cross-comparison between different data sources.
The study highlights the applications of the two major street view services in global urban geographic information systems, revealing the potential and limitations of these platforms in such systems by conducting an in-depth comparison of GSV and BSV regarding data quality, collection methods, and data usability. It achieves a quality comparison analysis of different datasets for the same geographical locations. Future research can build upon this framework to further explore the practicality of SVI in various application scenarios, assisting GIS professionals in conducting analytical work in urban planning and geospatial fields.
Footnotes
Declaration of conflicting interests
The author(s) declared no potential conflicts of interest with respect to the research, authorship, and/or publication of this article.
Funding
The author(s) disclosed receipt of the following financial support for the research, authorship, and/or publication of this article: Supported by the Research Initiative Fund for Newly Introduced Talents of Harbin Institute of Technology, Shenzhen. 2023-2025 (#ZX20230488)