
Abstract
Trip chains, consisting of multiple interconnected trips serving different functions and/or purposes, occur commonly among urban residents. Non-metro trips (NMTs) between a pair of metro stations as parts of trip chains predominantly carried by metro systems have received little attention in the existing scholarship and practice. They contribute, however, to “Life between Stations” (LbS)—various activities engaged in by metro riders and other urban residents around or between stations. LbS affects residents’ level of satisfaction for trip chains, sense of belonging, and even overall quality of life. But for a given city, where do those NMTs occur more frequently and how long are the durations? Using the 12-weekend metro smartcard swipe records in 2019 in Hong Kong, we defined, quantified, and visualized NMTs and associated metro station pairs in a real-world setting. We found that (a) the NMTs and LbS occurred between as many as 179 metro station pairs, involving 84 out of the 95 local metro stations, (b) the NMTs and LbS varied across the station pairs and/or metro lines, and (c) commercial and densely populated areas saw more than elsewhere. These findings shed light on efforts undertaken to better understand and improve LbS of metro riders.
Introduction
The continuous movement of people between a series of destinations over some period of time on a day is regarded as a trip chain, which allows people to engage in their daily essential and non-essential activities (Thill and Thomas, 1987). For a long time, trip chains have been examined based on “small” data from sources such as surveys and trip trajectories recorded by GPS devices, which are usually a small set of samples (Primerano et al., 2007). With the advent of big data from sources such as transit smartcard swipe records and social media check-ins, they can be examined using a much larger set of samples (or even nearly the full population) and across more spatiotemporal resolutions (or even at the individual level nearly real time) (Batty, 2013).
In our empirical study, we were particularly interested in metro riders’ trip chains, especially when they involve both metro trips and non-metro trips (NMTs) between a pair of metro stations (c.f., Boarnet et al., 2017; Lucas, 2012). After alighting at one metro station, passengers not always board from the same station, but may stay outside for various activities and then alight from another station within a certain distance from the last alighting station, which forms the NMTs. We hypothesized that those NMTs contribute to “Life between Stations” (LbS)—various non-work and non-transfer activities in which metro riders engage around or between metro stations. LbS affects urban residents’ level of satisfaction for trip chains, sense of belonging, and even overall quality of life (c.f., Gehl, 2011).
More specifically, we regarded “station pairs” as two stations that produce NMTs as parts of trip chains planned and executed by metro riders. We assumed that metro riders would engage in LbS because of NMTs. To single out the most probable LbS that is not a transfer- and work-related one, we restricted the distance between the two members of a metro station pair and the duration of NMTs and related activities. The spatial and temporal thresholds for the station pairs may be city-specific, chosen with the consideration that they should allow riders to comfortably use active transportation modes, like walking or biking, to connect between stations.
With the above definitions of NMTs, LbS, and the associated station pairs, we have highlighted the non-metro part of urban residents’ trip chains predominated by metro. Although these components comprise a smaller fraction of the overall travel time and distance, it is essential for passengers to access urban facilities and engage in necessary, recreational, or social activities (Gehl, 2011). The facilities around stations attract riders for non-metro activities outside, and in turn passenger activities contribute to the vitality of station neighborhood. Yet questions arise: How are such NMTs, LbS, and station pairs spatially distributed in a specific city? And how do activity durations differ across areas within the city? Using smartcard swipe data, we took Hong Kong as an example to explore the spatial distribution of NMTs and station pairs through a preliminary visualization.
Data collection and visualization
Using the Mass Transit Railway (MTR) Cooperation’s smartcard data in 2019, we identified and visualized the above-defined station pairs, NMTs, and LbS in Hong Kong, a city where trip makers rely heavily on metro/transit services to get around. Considering Hong Kong’s context, we set temporal and spatial thresholds to identify and extract NMTs and related activities from the smartcard data. Specifically, we focused on (a) metro station pairs where their members are 2 km or less apart—which means that both walking and cycling are feasible for most if not all trip makers, and (b) the duration of NMTs plus related activities by metro riders last at most 4 hours on weekends. Choosing NMTs and related activities by metro riders on weekends reduces the probabilities that we mistakenly treat work-related activities as LbS. The amenities around and between such station pairs provide places for people’s LbS to take place.
The smartcard data on one random weekend from each month in 2019 were utilized to identify the NMTs and station pairs. The number and average duration of NMTs between all the station pairs in the whole MTR network were calculated and visualized to illustrate the spatial distribution. To address the wide variation in the number of NMTs, we applied logarithmic transformations to the data. We also plotted the distribution of the number and average duration of NMTs for adjacent station pairs along nine major metro lines, visualizing the data line by line to discern the patterns of NMTs specific to each metro line.
Findings
We found that there were 188,764,641 NMTs produced by 179 metro station pairs consisting of 84 distinct metro stations on the 12 randomly selected weekends representing each of the 12 months in 2019. Those NMTs and related activities (highly likely LbS) were conducted by 10,124,393 distinct smartcard holders who used the local metro services.
Figure 1 depicts the distribution of the station pairs, origin stations and/or destination metro stations of the NMTs, and logarithm of the number and average duration of the NMTs and related activities. Using the purple bar chart, we also plotted the alighting and boarding trips for stations with the highest ridership. Probably not surprisingly, Hong Kong’s commercial districts and densely populated areas boasted most of the station pairs and NMTs and related activities. There is a difference in the distribution of NMT numbers and durations across station pairs, with station pairs with high NMT counts not always corresponding to longer LbS, perhaps related to the activity types. The top three station pairs that saw the most and longest NMTs and related activities were: Tsim Sha Tsui-Tsim Sha Tsui East, Mong Kok-Yau Ma Tei, and Sheung Wan-Central (see the upper panel of Figure 1). In addition, there are also many NMTs at stations near the terminal of some lines, such as Tuen Mun-Siu Hong. This may be due to the insufficient facilities around the suburban stations, but the exact reasons need to be further investigated.
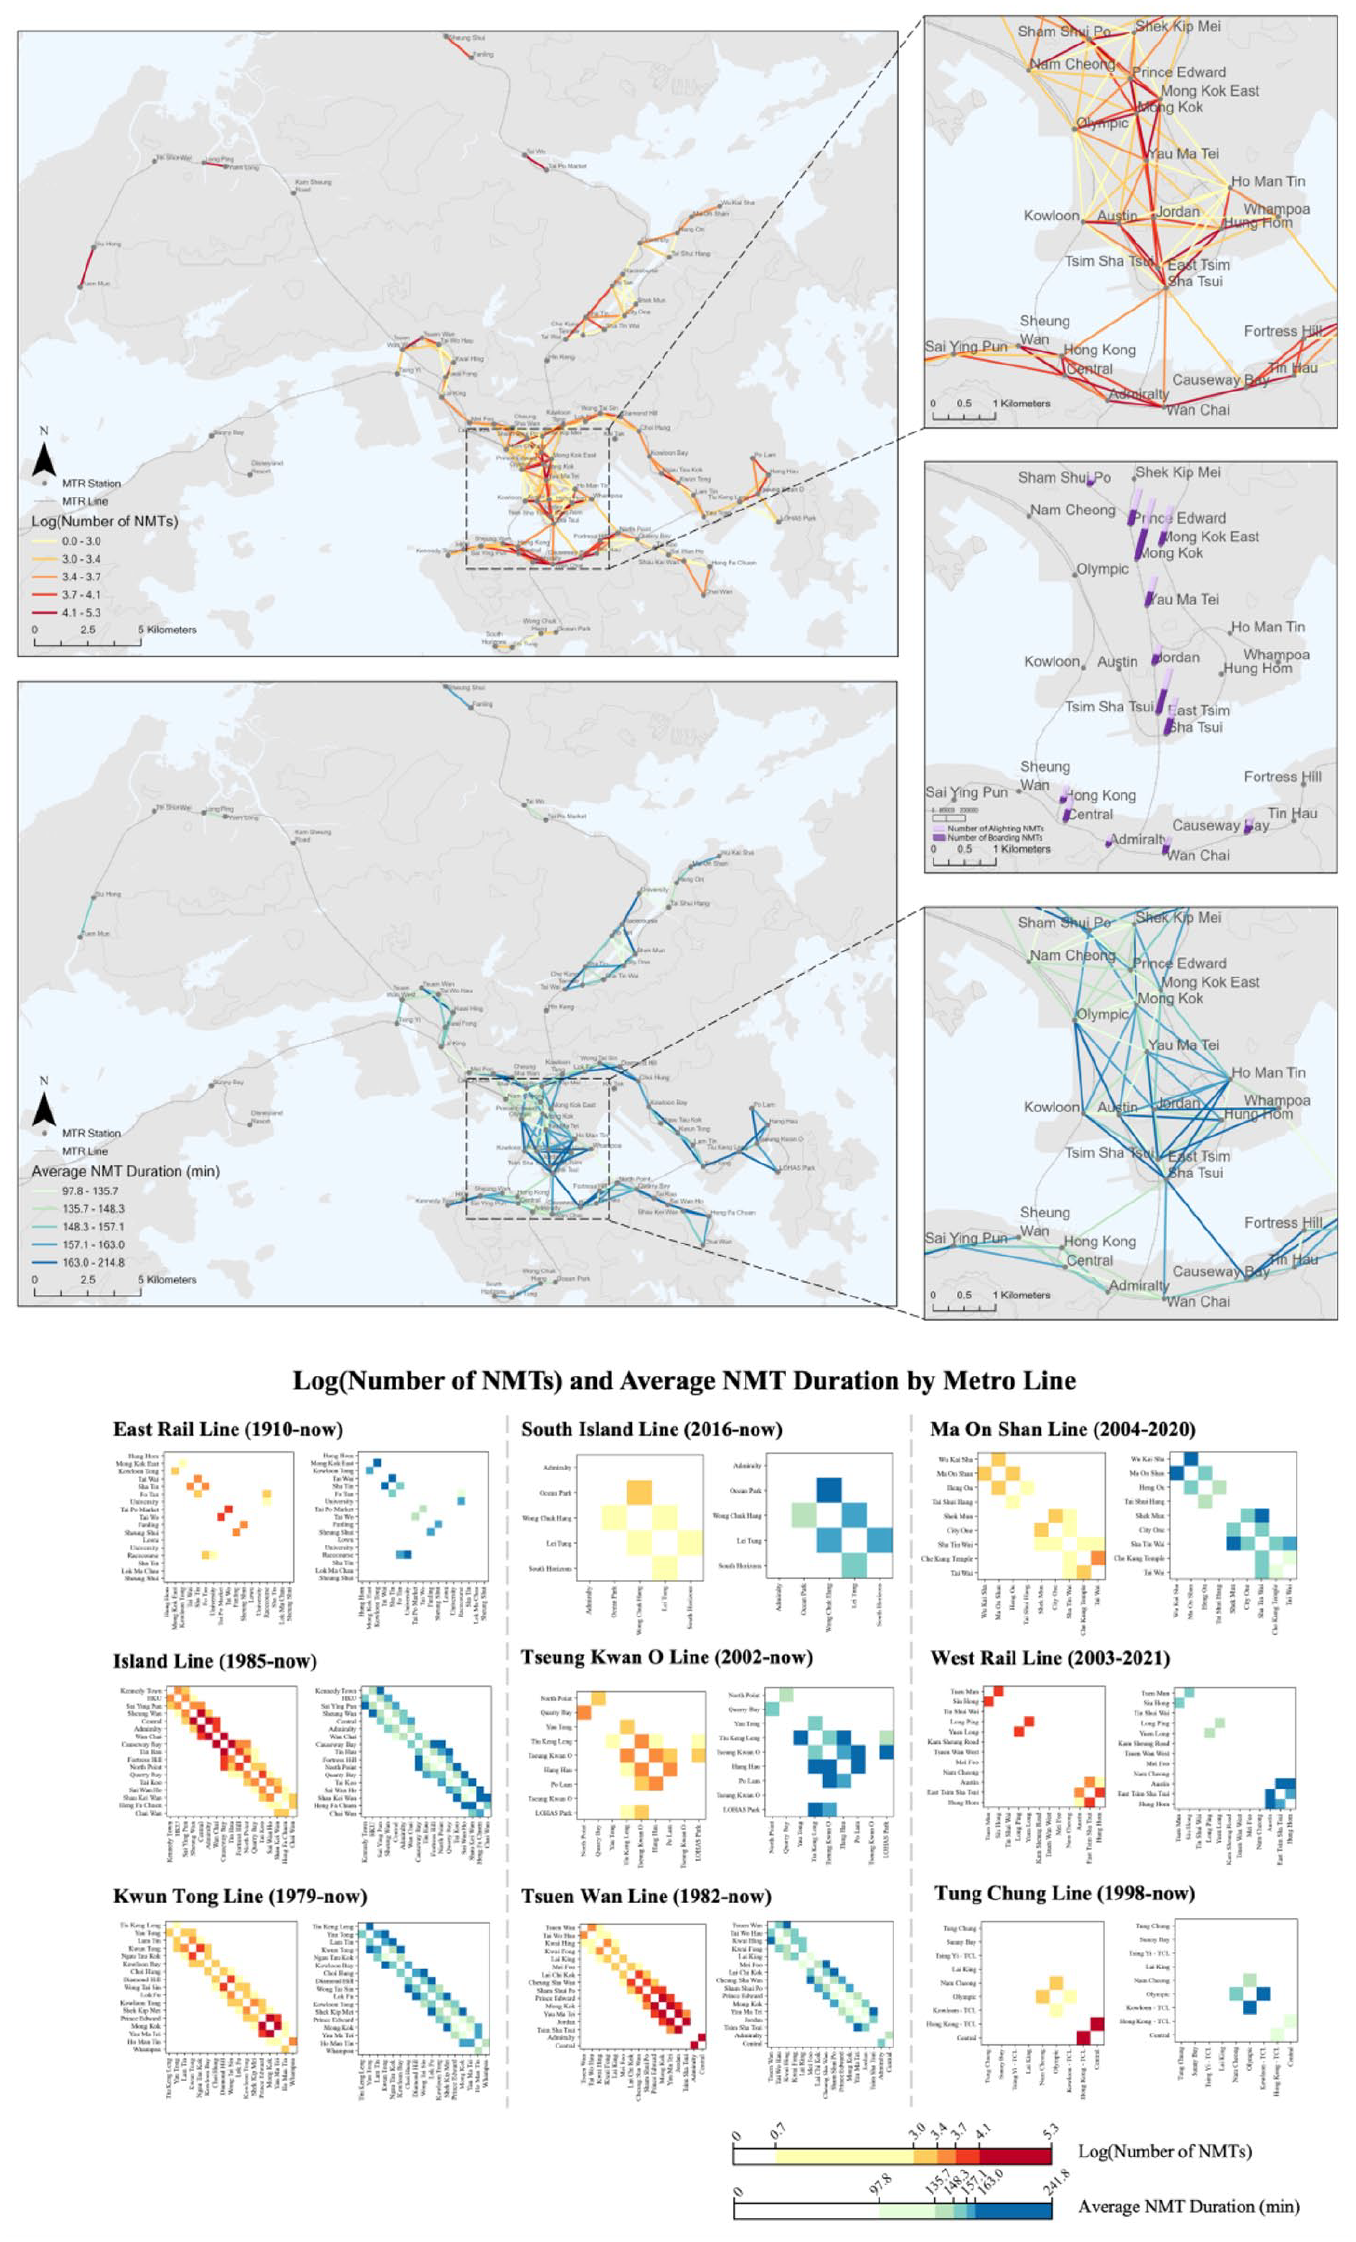
Station pairs, NMTs, and related activities in Hong Kong’s metro network.
Using heatmap plots, we further singled out the station pairs that produced the most and/or longest NMTs and related activities by line (see the lower panel of Figure 1). The Tsuen Wan and Island Lines saw more such station pairs than seven other lines. Many members of the station pairs served as both origins and destinations of NMTs and related activities. Roughly speaking, the shorter the distance between the two members in a metro station pair, the more frequently and the shorter the duration of the corresponding NMTs and related activities. There were notably differences in the number and average duration of the NMTs and related activities across the station pairs on the nine different metro lines in Hong Kong. This could imply that the LbS of metro riders (and possibly many other urban residents) varied significantly in space (and possibly across time) in the city. Without extra data, however, we don’t know what contributed to the variations and how the variations influenced different metro riders’ and urban residents’ level of satisfaction for trip chains, sense of belonging, and even overall quality of life. Further studies are thus warranted. They would shed light on efforts undertaken to better understand and improve LbS.
Footnotes
Declaration of conflicting interests
The author(s) declared no potential conflicts of interest with respect to the research, authorship, and/or publication of this article.
Funding
The author(s) disclosed receipt of the following financial support for the research, authorship, and/or publication of this article: The research underlying this paper is financially supported by, the Platform Technology Funding (URC012530226), The University of Hong Kong.
Software
Python 3.11.5; ArcGIS Pro 3.1.3.