
Abstract
Examining the relationship between the built environment and older adults’ walking behavior is of critical importance for the development of aging-friendly cities and communities. Previous studies, however, have paid limited attention to the non-linear and synergistic effects of built environment factors. To this end, based on multi-source data such as the Travel Characteristic Survey of Hong Kong and Google Street View imagery, this study integrates two advanced machine learning models—light gradient-boosting machine (LightGBM) and SHapley Additive exPlanations (SHAP)—to analyze the non-linear and synergistic effects of various built environment factors on older adults’ walking time. The results show that the effect of the built environment is largely non-linear. Critical built environment factors include access to recreational facilities and land-use mix. Access to metro and parks, however, plays a marginal role in affecting older adults’ walking. Furthermore, the synergistic effects of built environment variable pairs (e.g., access to recreational facilities and intersection density) are also identified.
Keywords
Introduction
Population aging has become a universal phenomenon and a development trend across the globe. According to the United Nations, in 2022, the proportion of people aged 65 and above in the world was 10%. This figure is expected to reach 16% in 2050. Population aging brings about formidable challenges, including the persistent deterioration of physical abilities and declining mental health attributed to decreased social engagement.
Walking is the most fundamental travel mode and physical activity, and it can be easily incorporated into daily life (Heath et al., 2012). It meets the demands of daily short-distance travel and offers a wealth of advantages in terms of low impact, physical and mental health, and high accessibility (Michel et al., 2021; Rudnicka et al., 2020). First, walking is characterized by its low-impact nature, presenting a lower risk of injury when compared with more vigorous activities such as running or skipping rope. This attribute holds particular significance for older adults, who often experience age-related joint issues and medical conditions like heart disease and hypertension. By choosing walking as a fitness activity, they can significantly reduce the risk of injury and minimize discomfort. Second, walking yields multiple physical health benefits, including improvements in cardiovascular health, preservation of muscle strength, and enhanced joint flexibility. Older adults can enhance their overall health through regular walking as an exercise regimen. For older adults, consistent walking routines can lower the risk of chronic ailments such as heart disease, diabetes, and osteoporosis (Bauman et al., 2012). Notably, the intensity of walking can be readily customized according to individual fitness levels and objectives. Older adults can embark on a comfortable and recreational pace for gentle exercise or progressively increase their walking speed and distance to achieve superior cardiovascular fitness. Third, walking has demonstrated positive effects on mental health. It can alleviate the symptoms of depression and anxiety, enhance cognitive function, and promote an overall sense of contentment (Nordbakke and Schwanen, 2014). Walking, especially community-based walking, offers abundant opportunities for social interaction and networking, which are significant for the emotional and mental health of older adults. Group walking provides a means to combat loneliness, fostering a sense of companionship. By incorporating walking into their routines, older adults can maintain independence and mobility and fulfill daily travel needs without external assistance. Finally, walking stands out for its high accessibility, requiring minimal equipment and adaptable settings. Older adults can partake in walks within their communities, local parks, shopping malls, and community centers.
While walking has been acknowledged as an advantageous mode of transportation for older adults, various factors have contributed to a decline in its prevalence. One such factor is the rapid proliferation of private automobiles (Yang et al., 2020), which has fostered an increasingly pronounced inclination toward car dependence among the general population (Huang et al., 2023). Additionally, concerns about safety during travel constitute a significant deterrent for older adults when choosing walking as their mode of transportation (Das et al., 2019; Kim and Ulfarsson, 2019; Lee, 2013). Furthermore, many developing countries have long been governed by growth-oriented urbanization strategies, paying limited attention to individual variations. This approach may result in a diminished enthusiasm for walking among people, such as older adults.
A substantial body of evidence supports that walking behavior is influenced by a combination of internal and external factors. Internal factors primarily encompass physical/mental health and socio-economic status, while external factors include built, natural, and social environments (Blanco et al., 2023; Huang et al., 2021; Wang et al., 2022). Specifically, the built environment refers to human-made constructions and alterations within the living environment. It encompasses physical infrastructure, buildings, public spaces, land use, transportation systems, and urban design (Ewing and Cervero, 2010). Numerous studies consistently highlight the significance of the built environment in promoting/hindering walking among older adults. Factors such as design, diversity, and destination accessibility emerge as common determinants (Hatamzadeh and Hosseinzadeh, 2020). In urbanized settings with elevated population/facility density and well-designed streets, older adults exhibit a heightened inclination toward walking (Patterson and Chapman, 2004; Wang and Lee, 2010). Notably, design variables, particularly those related to the availability of green spaces and park accessibility, play a pivotal role in influencing walking behavior. Kemperman and Timmermans (2014), for instance, conducted an investigation utilizing data from a national survey of the living environment in The Netherlands. Their findings revealed that the presence of high-quality green spaces is correlated with increased social interactions and enhanced walking propensity among older adults. Moreover, destination accessibility serves as a catalyst for bolstering motivation and physical activity levels among older adults in their walking endeavors (Leung et al., 2018; Stathi et al., 2012). The presence of varied facilities fosters a sense of security and benefit, promoting walking among older adults (Ewing et al., 2015; Hirsch et al., 2014). Given their potential physical limitations and reduced likelihood of traveling independently, the proximity to public transportation stations emerges as a critical determinant of older adults’ walking behavior (Yang et al., 2021a).
Recent research has studied non-linear associations between the built environment and walking behavior, which can be explained by peer effects and travel utility (Galster, 2018; Mokhtarian and Salomon, 2001). Cheng et al. (2020), drawing on data from Nanjing, China, employed machine learning models to uncover a substantial non-linear link between various variables of the built environment (e.g., population density and land-use mix) and older adults’ walking behavior. Furthermore, Eom and Cho (2015) indicated that the effect of population density reaches a saturation point when it falls within the range of 9,132–16,101 persons/km2. Christiansen et al. (2016) conducted a comprehensive comparative analysis of 14 cities worldwide, revealing a significant threshold effect of residential density on the promotion of walking. Their findings indicated that once residential density exceeds 12,000/km2, the probability of walking declines gradually. Yang et al. (2021b) confirmed that within a specific range, the green view index demonstrates a favorable impact on the inclination for walking among older adults in Hong Kong. However, beyond this range, the positive correlation ceases to persist. The above studies have rarely delved into the interaction effects between built environment variables influencing walking. Hence, it has become imperative to examine the non-linear relationship between the built environment and older adults’ walking behavior, as well as to investigate the synergistic effects among various built environment variables.
To address the aforementioned concerns and bridge the gaps present in prior research, we applied advanced machine learning techniques to a comprehensive dataset from diverse sources that encompass the socio-economic data and walking behavior records of older adults obtained from the 2011 Travel Characteristic Survey (TCS) of Hong Kong and geo-data such as imagery from Google Street View (GSV). Methodologically, we harnessed the power of the light gradient-boosting machine (LightGBM) and SHapley Additive exPlanations (SHAP) models to examine the non-linear impacts of Hong Kong’s built environment on older adults’ walking behavior. This study contributes significantly to the existing literature in two ways: (1) it pioneers the application of interpretable machine learning (or explainable artificial intelligence, XAI) models to scrutinize the intricate, non-linear relationship between built environment variables and older adults’ walking behavior, and (2) it employs the SHAP model to unveil the interpretability of the results of a machine learning model (i.e., LightGBM), elucidating the localized interaction effects among various built environmental variables.
The rest of this paper is arranged as follows. The Data section introduces the study area, TCS data, and variables. The Methodology section presents the LightGBM and the SHAP model. The Results section reports the modeling results. The Conclusions and discussion section concludes the paper.
Data
Study area
We selected Hong Kong, a special administrative region of China, as the study area. Situated in the southern part of China, Hong Kong is positioned across the sea from Macao in the west and proximate to Shenzhen in the north. Encompassing Hong Kong Island, Kowloon, the New Territories, and over 260 islands, Hong Kong spans a land area of 1,114.57 km2. Renowned as an exceptionally prosperous free port and international metropolis, Hong Kong ranks as the third-largest financial center globally. In 2022, it achieved a regional GDP of approximately 2.82 trillion Hong Kong dollars, solidifying its position as one of the wealthiest and most economically developed regions worldwide. Moreover, in 2022, Hong Kong had a total population of 7.47 million. A significant portion of this population, approximately 20.47%, comprised individuals aged 65 and above. Hong Kong holds the distinction of having the world’s highest average life expectancy, with a continual trend toward an aging demographic.
Our decision to focus on Hong Kong is grounded in two compelling rationales. Firstly, the issue of population aging in Hong Kong has become increasingly acute, necessitating urgent adaptation of the built environment to accommodate this demographic shift. Secondly, Hong Kong stands out as one of the most pedestrian-friendly cities globally. As a high-density, multi-story urban center with exceptional pedestrian infrastructure, including both aerial and underground walkways, it excels at enhancing walking comfort, reducing walking distances, and fostering conducive walking environments and public spaces.
TCS data
The TCS represents a periodic self-reported initiative undertaken by the Hong Kong government’s Transport Department. Its primary objective is to systematically gather up-to-date travel data, thereby contributing to the informed development of transportation planning and policies in the region. Conducted at intervals of approximately ten years, the TCS was administered in 1981, 1992, 2002, 2011, and 2022. The TCS serves as a crucial instrument for capturing the intricate nuances of travel characteristics in Hong Kong. The structured and multifaceted nature of TCS ensures a wealth of information across various levels, facilitating a comprehensive understanding of residents’ travel behaviors and patterns.
The TCS 2011 dataset consists of three pivotal components: the Household Interview Survey, the Stated Preference Survey, and the Hotel/Guesthouse Tourists Survey. The cornerstone of the TCS is the Household Interview Survey, wherein a meticulous process involved 101,385 individuals on normal weekdays, spanning from September 2011 to January 2012. The sampling rate for this rigorous data collection endeavor is approximately 1.5%. Aligned with the practices of many comprehensive government travel surveys, the Household Interview Survey operates on a three-tiered data collection approach, meticulously documenting information at the levels of the household and household members, and the one-day trip records of each household member.
In pursuing a nuanced understanding of older adults’ walking behavior (defined as individuals aged 65 years or above in this study), we have judiciously extracted pertinent data from the Attachment Survey 2 of the Stated Preference Survey. This specific survey provides an accurate characterization of walking behavior. It is imperative to note that this survey selectively documents trips not involving mechanized transport during the reference one-day period. It is noteworthy that other walking trips, particularly those involving transit connections such as first-mile walking and last-mile walking, are not documented in this survey.
Variables
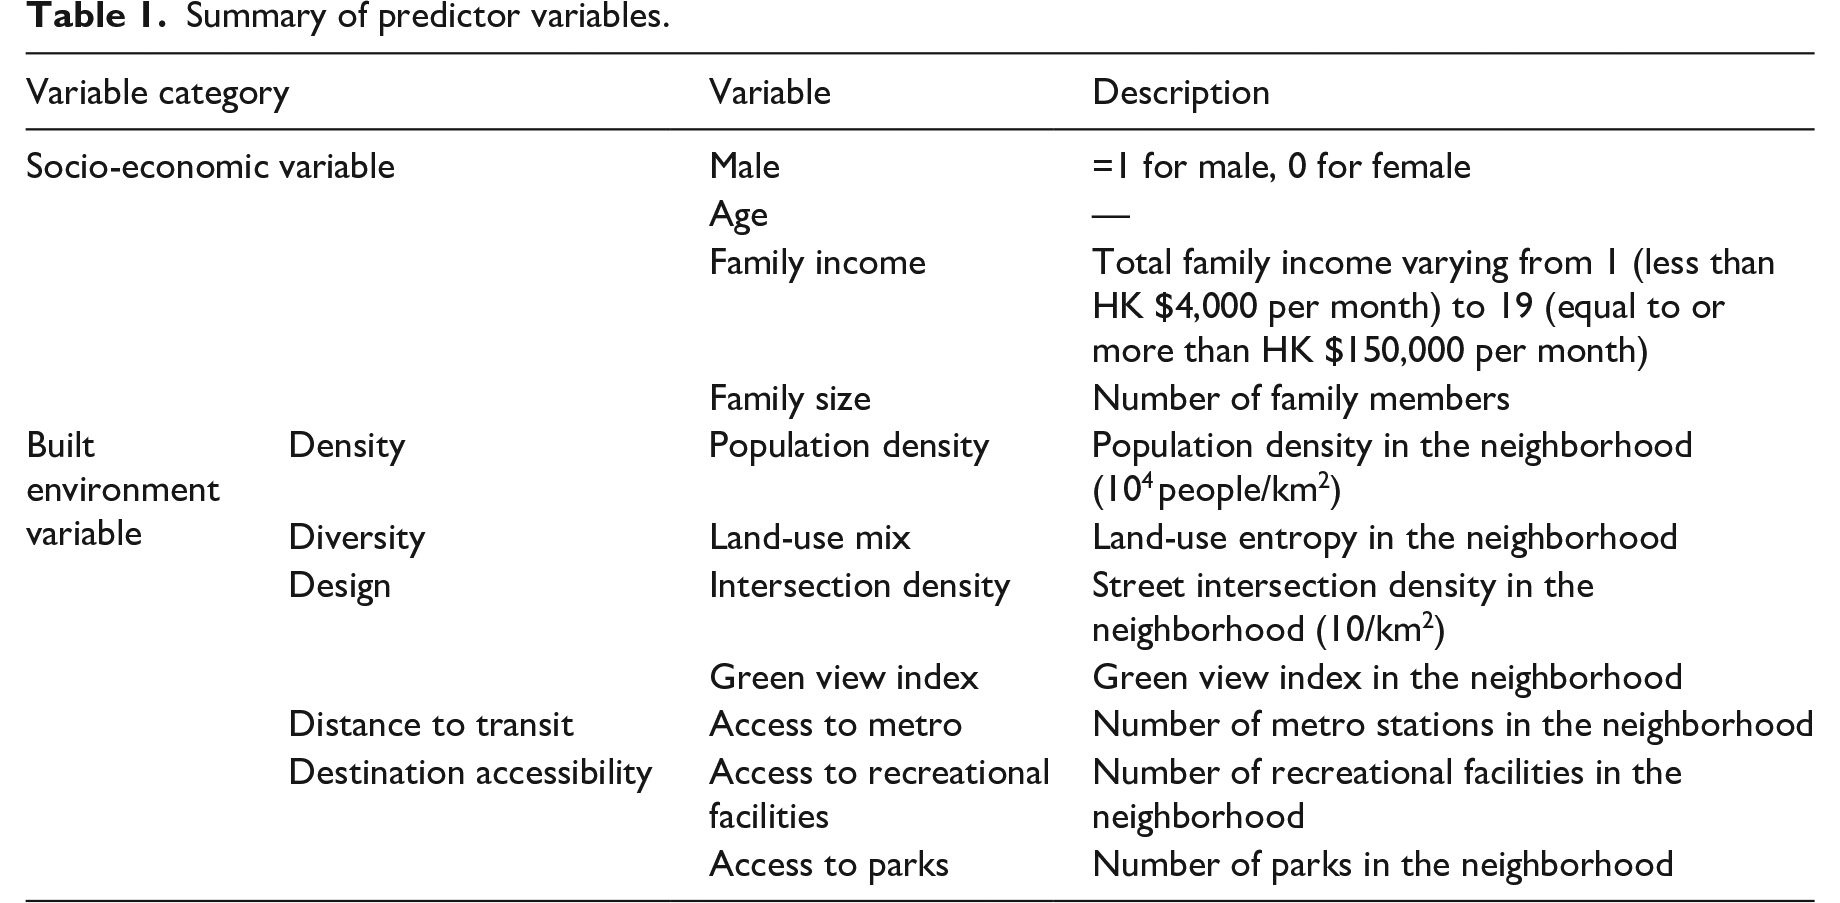
Table 1 shows the description of predictor variables. Drawing on the existing literature, we have chosen 11 variables for our study. This selection encompasses four socio-economic variables and seven built environment variables, aiming to provide a thorough and multifaceted exploration of the factors influencing older adults’ walking time. The choice of predictor variables is largely consistent with the work of Yang et al. (2021b).
Summary of predictor variables.
Notably, the evaluation of the green view index involves the utilization of Street View imagery (Li et al., 2022; Tang and Long, 2019). The green view index is computed to gauge individuals’ visual exposure to street greenery (Figure 1). This process involves several steps. Initially, the residential locations of older adults are geocoded in the ArcGIS platform. Subsequently, nearby street segments adjacent to these residential locations are automatically identified. Following this, specific GSV-generating positions are established at fixed intervals of 50 meters. Many GSV images are then retrieved. Each GSV-generating position necessitates four distinct images that collectively encompass a 360-degree panorama. To distill greenery pixels, a machine learning technique, specifically a fully convolutional neural network (more specifically, FCN-8s), is employed. This process automatically extracts greenery information from the images (Chen et al., 2022). The following formula for the green view index is then applied.

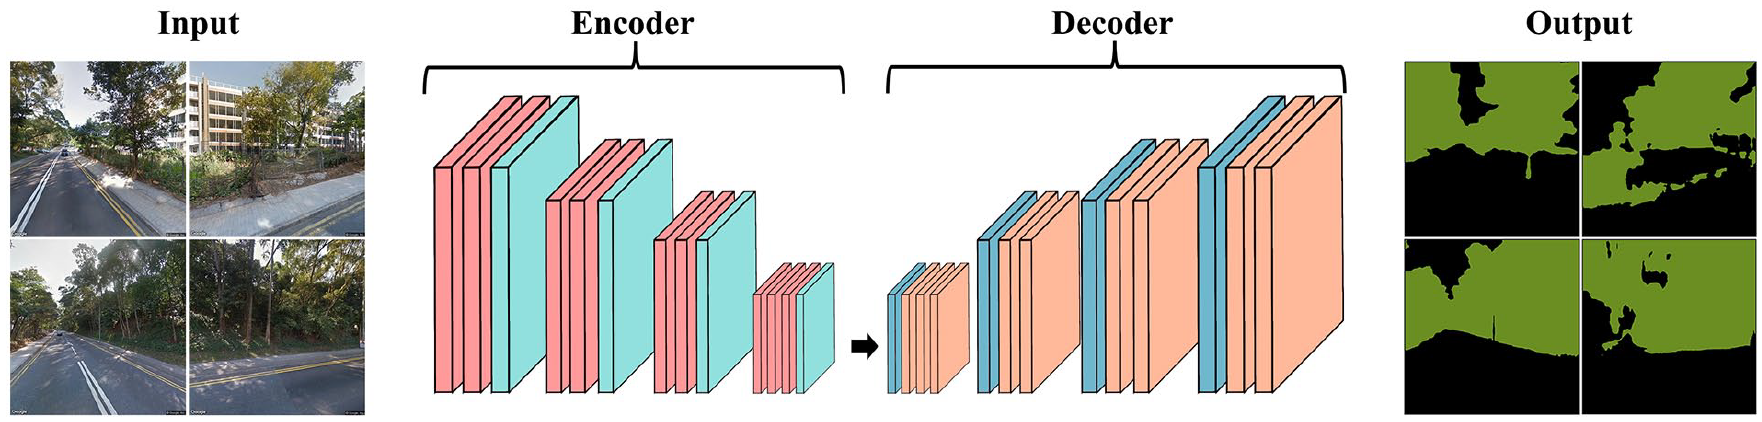
The measure of the green view index based on GSV imagery.
Methodology
LightGBM
Machine learning models, a cornerstone of artificial intelligence, play a pivotal role in many domains (Yang et al., 2023). These models encompass a diverse array of algorithms and techniques designed to extract patterns and insights from data, thereby enabling autonomous learning and decision-making. Machine learning models can be classified into three groups: (1) Supervised learning models, such as linear regression, logistic regression, support vector machine, decision tree, random forest, and neural networks. They can learn from “labeled” data to make classification and regression predictions (Liu et al., 2020). (2) Unsupervised learning models, such as k-means clustering, hierarchical clustering, principal component analysis, autoencoders, Gaussian mixture models, and DBSCAN (Density-Based Spatial Clustering of Applications with Noise). They can uncover hidden patterns within “unlabeled” data, facilitating tasks such as segmentation and anomaly detection. (3) Reinforcement learning models, such as Q-learning, deep Q-networks, policy gradient methods, actor-critic methods, deep deterministic policy gradient, and proximal policy optimization. They can learn through trial and error to optimize decision-making processes in dynamic environments.
Developed by Ke et al. (2017), LightGBM is a relatively new but highly powerful supervised learning model using the gradient-boosting framework with two novel techniques: gradient-based one-side sampling (handling a significant volume of data instances) and exclusive feature bundling (handling a considerable number of features or variables). At the core of LightGBM’s efficacy is its innovative approach to tree-based learning (Chen et al., 2023). Unlike traditional gradient-boosting algorithms that grow trees level-wise (depth-first), LightGBM adopts a leaf-wise (best-first) strategy (Figure 2). This feature means that instead of growing the tree by expanding the deepest level first, LightGBM grows the tree by choosing the leaf it believes will yield the largest decrease in loss (maximum delta loss), resulting in a more efficient and faster training process. This approach reduces the number of nodes in the tree, enhancing memory usage and computational speed. Additionally, LightGBM introduces the concept of histogram-based learning, where it bins continuous feature values into discrete bins to accelerate the training process further. The use of histograms enables LightGBM to reduce memory requirements and computation time significantly. The innovative tree-growing strategy makes it particularly well-suited for scenarios with large datasets and complex feature spaces. In the realm of finance, healthcare, transport, or any domain requiring robust predictive modeling, LightGBM stands out as a high-performance solution for practitioners seeking both speed and accuracy in their machine learning tasks (Al Daoud, 2019).
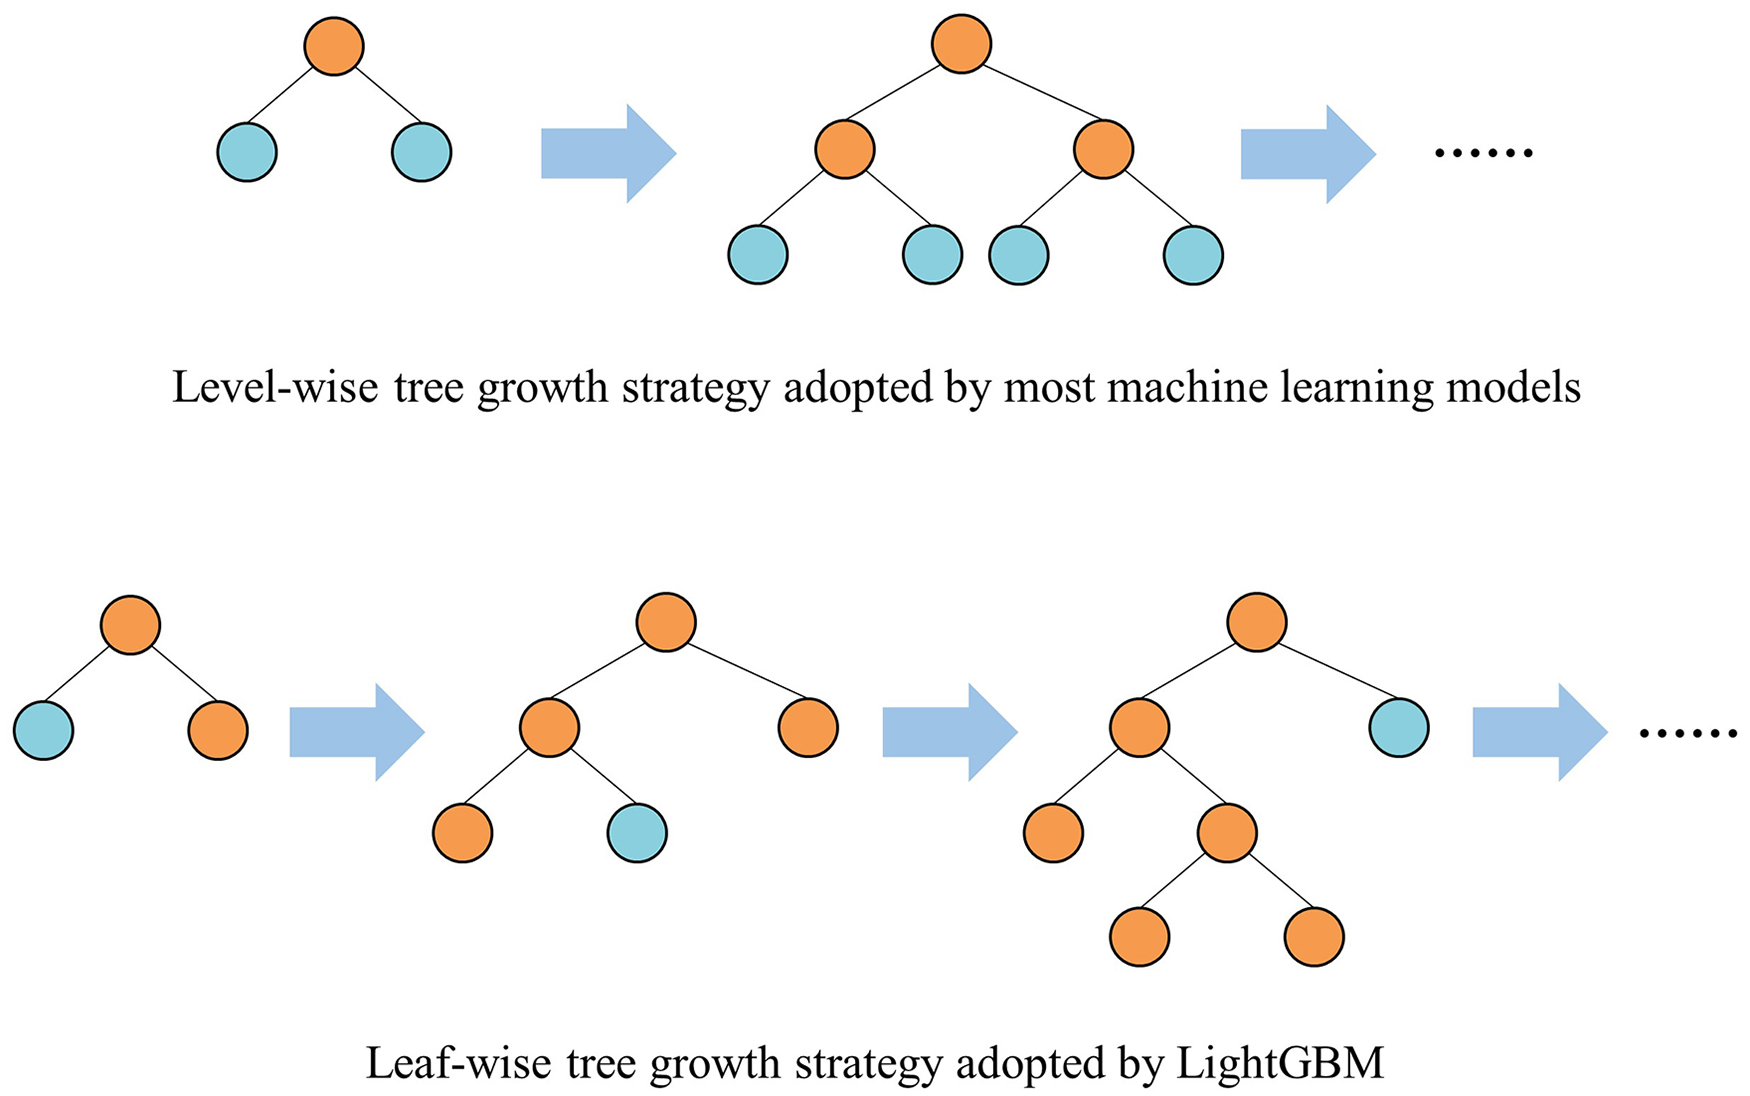
Comparison of level-wise and leaf-wise tree growth strategies.
SHAP
In the realm of machine learning, where complex models often operate as black boxes, understanding the decision-making processes has recently become a great concern. SHAP emerges as a transformative force in the landscape of model interpretability. Grounded in cooperative game theory principles, particularly Shapley values (or SHAP values), SHAP provides a comprehensive framework to illuminate the intricate mechanisms of black-box models. Originating in 1953, Shapley values were designed to fairly distribute the contributions of individuals in a coalition, offering a principled approach to sharing a value among participants (Shapley, 1953). SHAP extends this concept to the allocation of predictive power among the features (“players”) of a model, answering the fundamental question of each feature’s contribution to a specific prediction (“game”).
The significance of SHAP lies in its model-agnostic nature, applicable across a diverse array of machine learning algorithms, including tree-based models and neural networks. This universality renders SHAP indispensable in scenarios where the opacity of models raises concerns about trustworthiness and fairness. SHAP enhances global interpretability through summary plots, providing a holistic understanding of feature importance across all predictions. For example, the SHAP summary plot offers a comprehensive overview of the average magnitude and direction of each feature’s impact.
The true strength of SHAP lies in its ability to provide local interpretability, explaining the prediction of a specific instance and fostering transparency and trust in the model’s capabilities. The Tree SHAP (TreeExplainer) algorithm further enhances computational efficiency, particularly for tree-based models, by leveraging their inherent structure and the properties of Shapley values (Lundberg et al., 2020). SHAP’s utility extends beyond conventional feature importance and partial dependence plots, capturing complex relationships through SHAP dependence plots that illustrate how two features jointly influence the predicted variable. SHAP contributes significantly to the responsible development and deployment of machine learning technologies, unraveling the mysteries within the black box and empowering stakeholders to make informed and ethically sound decisions.
The Shapley value (Lundberg et al., 2020),
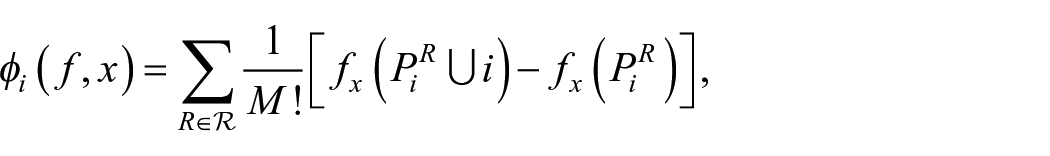
where ℛ represents the collection of all feature orderings, signifies the set of features preceding feature i in ordering R, and M denotes the total number of input features for the model.
Results
The existence of multi-collinearity leads to challenges in distinguishing the individual effects of various predictor variables on the predicted variable. To identify the potential existence of multi-collinearity, a pairwise correlation analysis is conducted. The results of this correlation analysis are shown in Figure 3, indicating that there is no discernible existence of multi-collinearity in this research. This outcome suggests that each predictor variable contributes unique information and does not duplicate the information provided by other predictor variables. Consequently, the absence of multi-collinearity enhances the interpretability and accuracy of the machine learning analysis, reinforcing the validity of the study’s findings and the credibility of the relationships between the predictor and predicted variables.
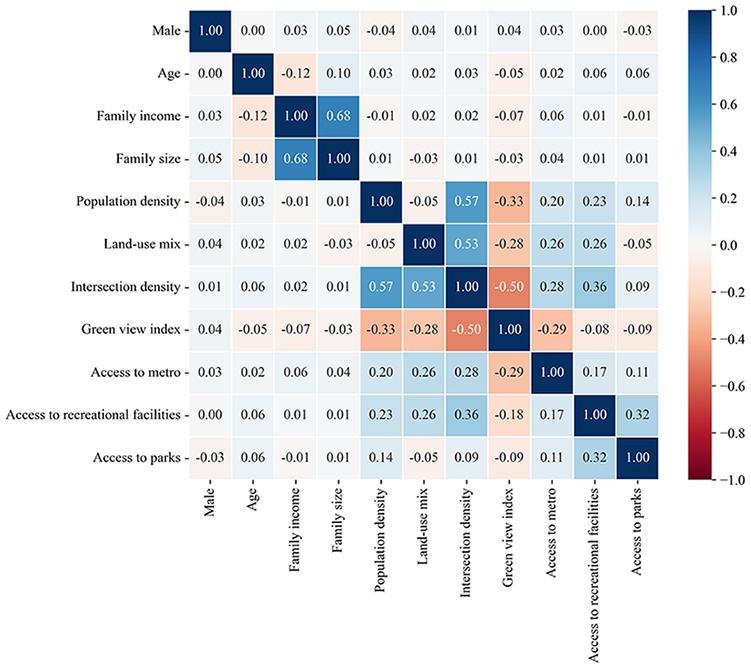
Correlation matrix of predictor variables.
Feature importance
Figure 4(a) presents feature importance rankings, with greater importance signifying a more substantial contribution to older adults’ walking time. The feature importance is calculated by averaging the absolute values of Shapley values for each predictor variable among all observations. Collectively, the built environment variables account for approximately 70% of the variance in older adults’ walking time. Notably, access to recreational facilities emerges as the most influential factor in the model’s predictions, followed by the land-use mix and intersection density. The preeminent role of access to recreational facilities is underscored by its direct impact on the availability of venues for older adults to engage in social interactions and activities. High access to recreational facilities can serve as a potent motivator for increased walking among older adults. Moreover, the land-use mix ranks second in importance, primarily due to its capacity to offer a diverse array of services and amenities within walking distance, thus encouraging older adults to walk for their daily needs and access essential services. Additionally, intersection density is also a pivotal built environment determinant of older adults’ walking time. Elevated intersection density translates to blocks that are more conducive to walking, characterized by shorter block lengths and enhanced pedestrian infrastructure, thereby rendering walking both easier and safer for older adults. In addition, family income levels exert a discernible influence on walking behavior. Higher-income individuals may have greater access to private transportation options such as cars, leading them to rely less on walking as a means of transportation. They might also live in areas with better driving conditions, making walking less necessary for daily activities. Last but not least, the green view index enhances the overall walking experience and fosters participation in outdoor sports activities among older adults. Notably, the importance of access to parks was relatively minor.
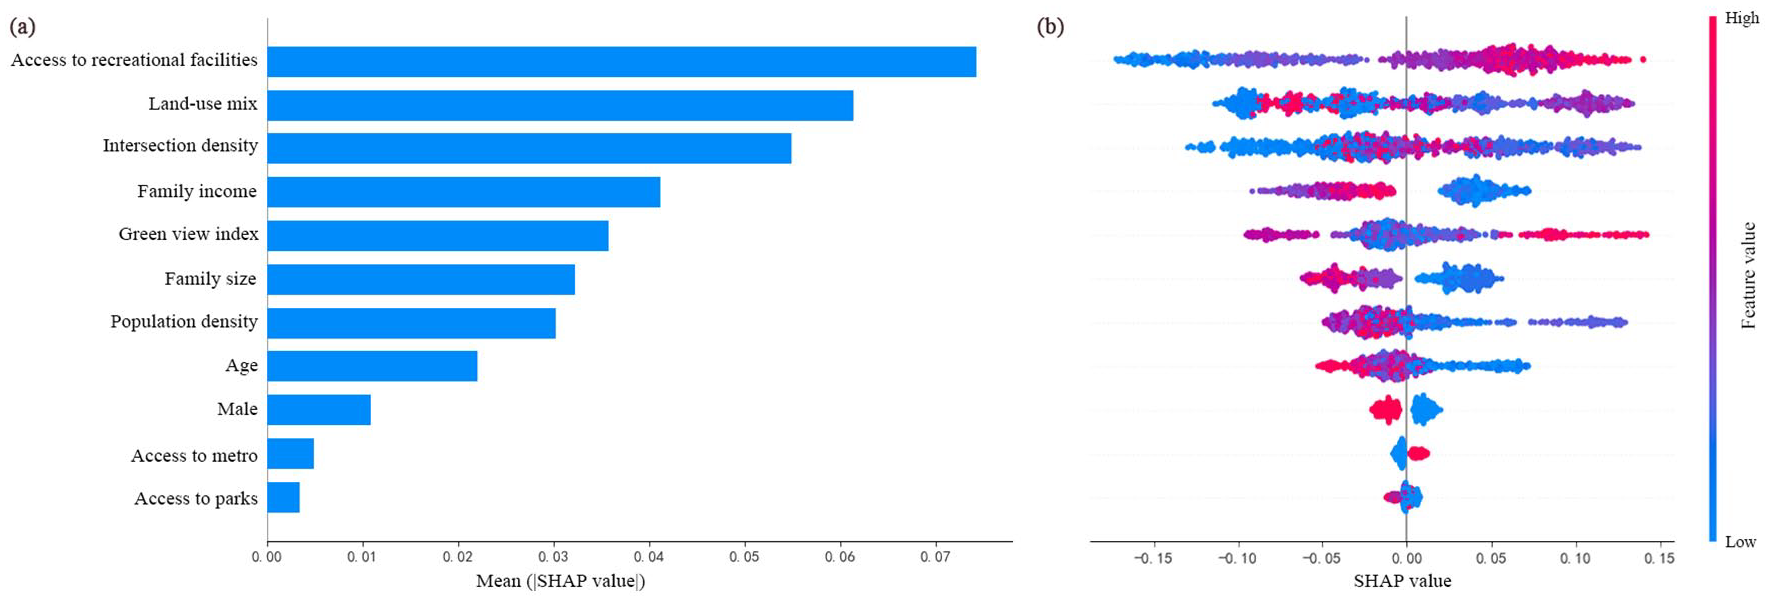
Feature importance and a SHAP summary plot.
Figure 4(b) presents a SHAP summary plot, which aggregates SHAP values across all instances in the dataset to provide a global view of feature importance. Data points situated to the right of the central line represent positive SHAP values, signifying that the feature values at these points enhance the model’s predictions compared with the average prediction. Conversely, negative SHAP values indicate that these data points exert a negative effect on the model’s prediction results (Yang et al., 2024). Furthermore, the length of the horizontal bars associated with each feature conveys additional insights. For instance, considering the green view index, it is evident that high values are primarily concentrated on the right side, whereas low values are predominantly situated on the left side. This observed pattern signifies a positive correlation between the green view index and older adults’ walking time. Additionally, the green view index displays a longer right tail and a shorter left tail, implying that a high green view index substantially promotes walking among older adults, while a low green view index modestly inhibits walking.
Non-linear effects of built environment and socio-economic variables on walking time
We generated local dependence plots of variables, which offer a visual means to elucidate the connection between individual features and the model’s predictions for specific data points. These plots enable us to assess whether a feature exerts a linear or non-linear influence on predictions and whether any inflection points or thresholds exist within the relationship. Figure 5 presents the local dependence plots for the top five important variables.
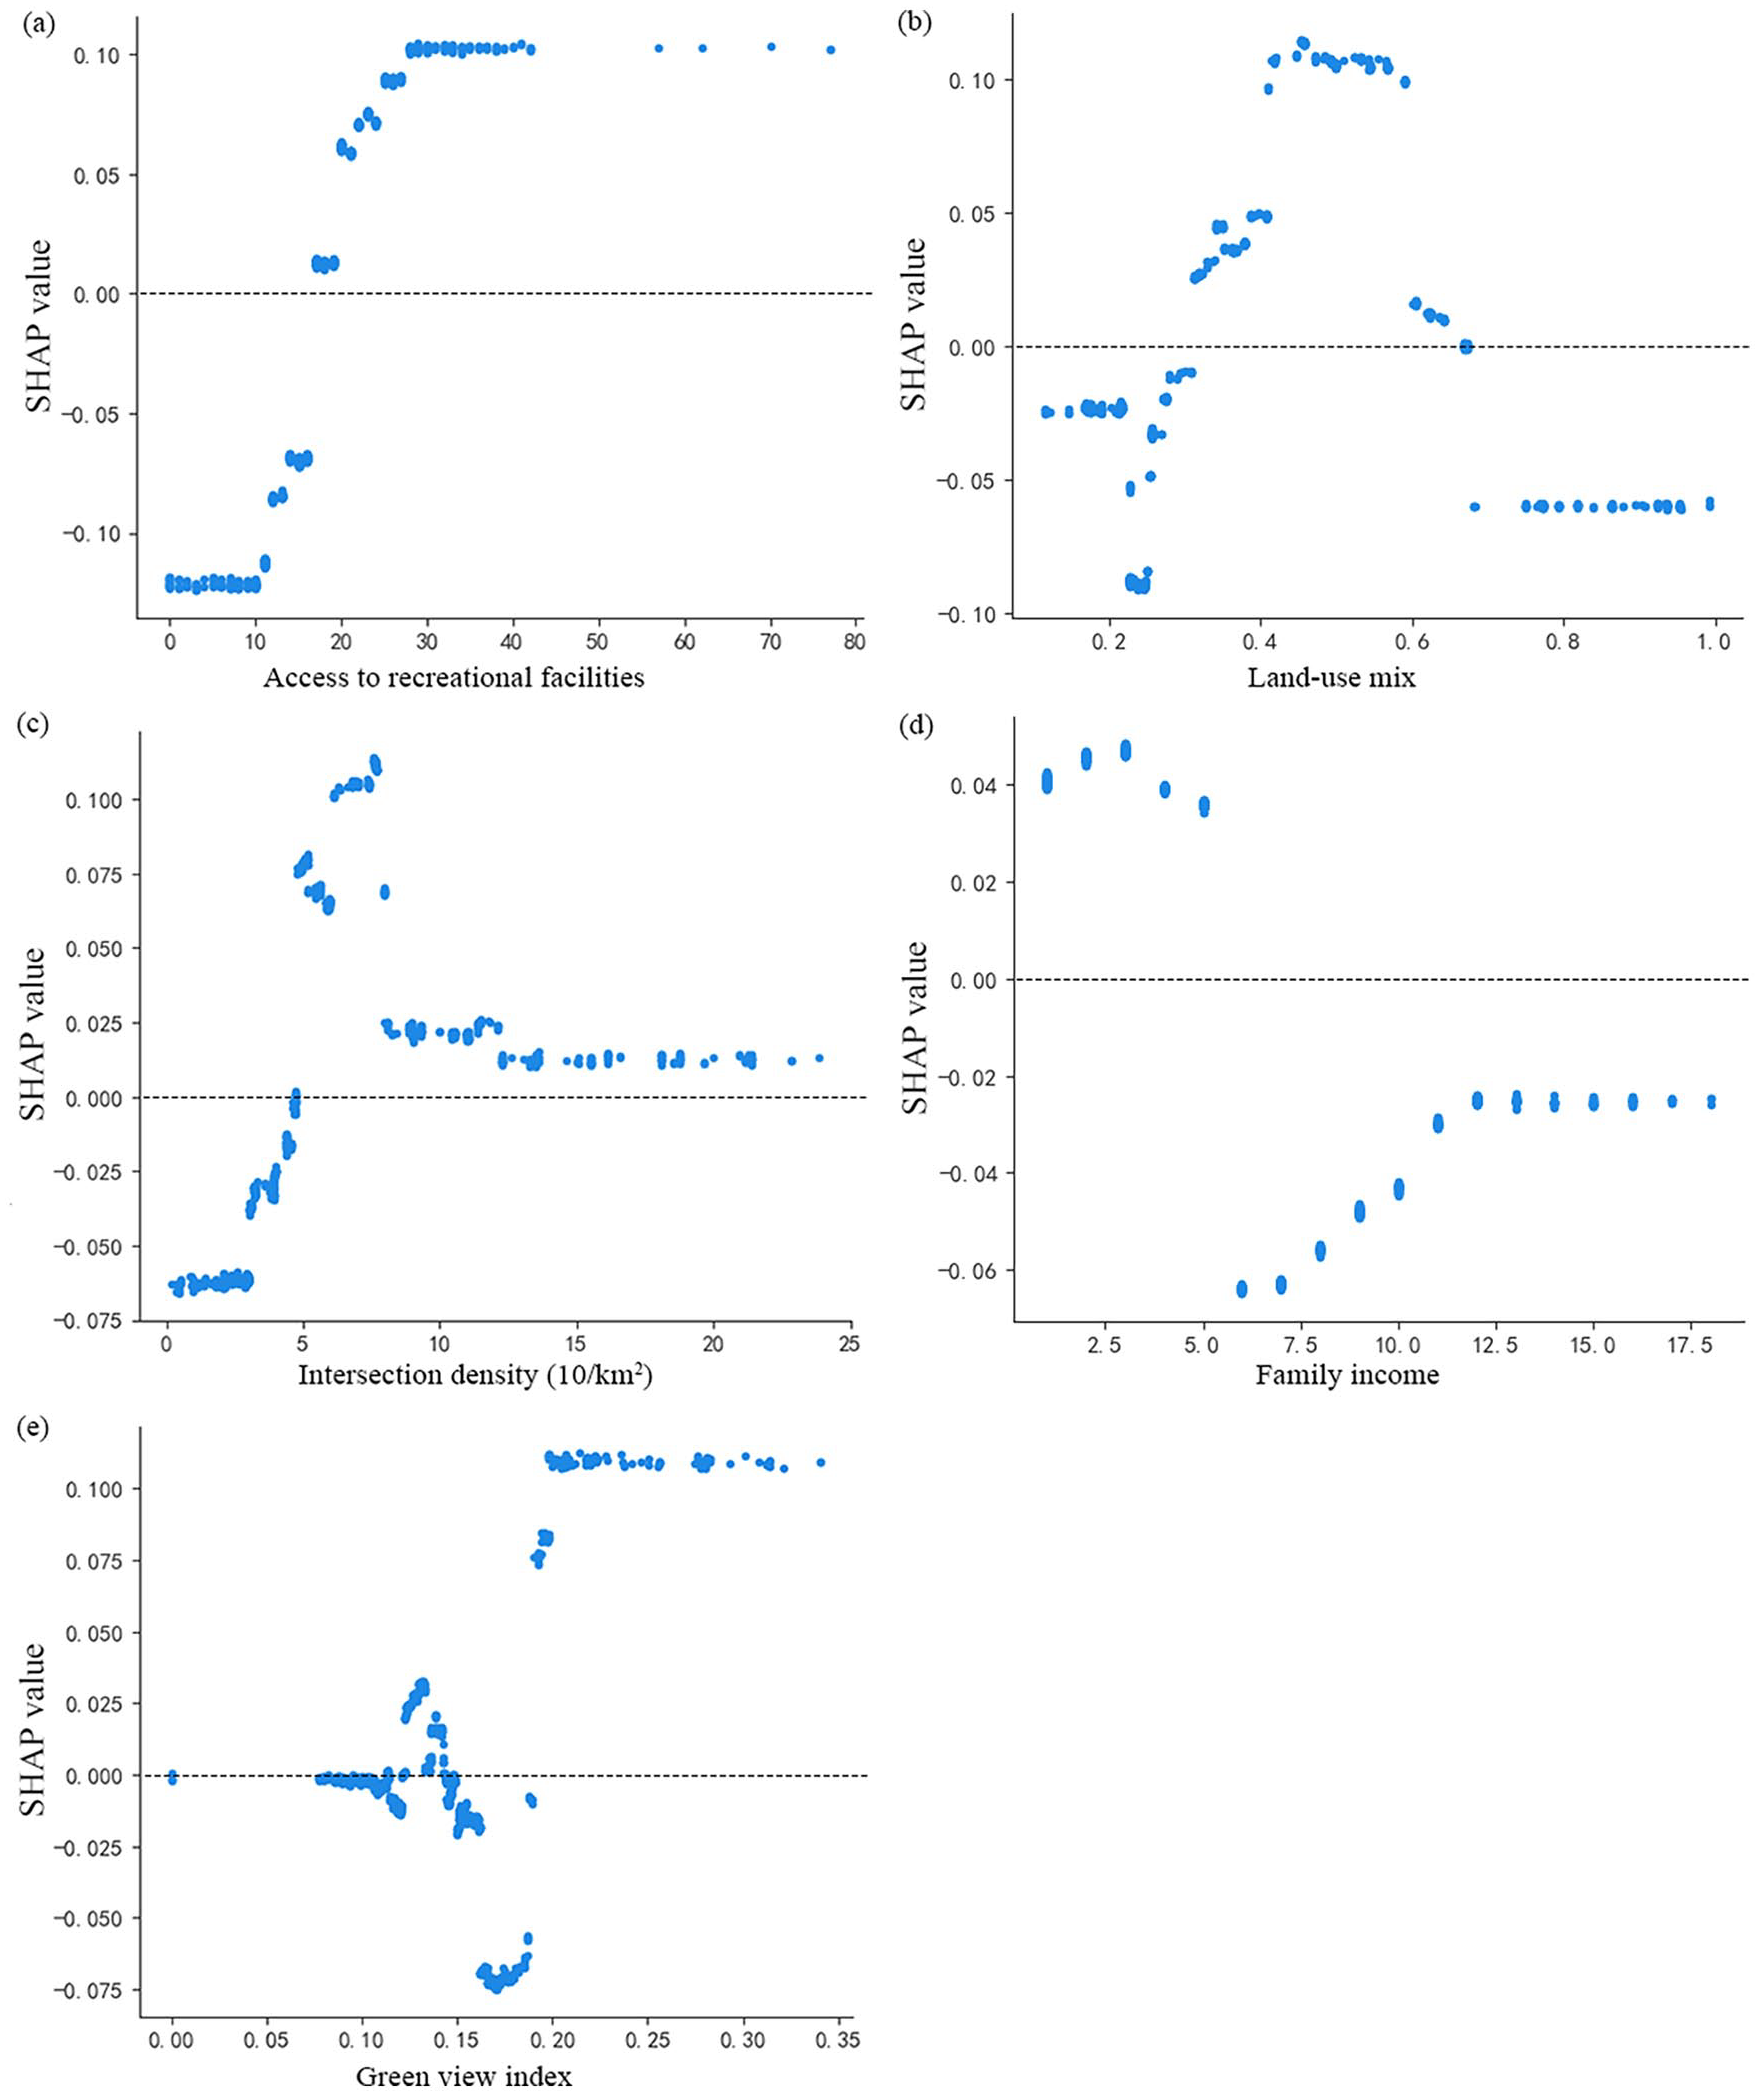
Non-linear effects of variables on walking time.
Figure 5(a) illustrates the main effects of access to recreational facilities on walking time. When access to recreational facilities falls below 20, it exerts an adverse effect on walking time among older adults. Areas with fewer recreational facilities are less attractive for older adults. As access to recreational facilities increases, the surrounding environment becomes more conducive to socializing, sports activities, and entertainment, thereby serving as a factor that encourages more walking. Notably, when access to recreational facilities surpasses 30, its SHAP value ceases to exhibit further increments (stable at 0.1). This finding indicates that additional enhancements after 30 have a marginal impact on walking time. That is to say, further improvements are unlikely to bring about significant alterations in walking time.
Figure 5(b) presents the local dependence plot concerning the land-use mix, revealing a notable non-linear relationship with walking time. Specifically, the impact of the land-use mix on walking time follows an inverted U-shaped pattern. When the land-use mix falls below 0.30, its SHAP value is negative. As the land-use mix increases from 0.30 to 0.65, its SHAP value consistently remains above 0. In essence, the land-use mix exhibits a positive influence on walking within this range. However, this promoting effect experiences an initial enhancement followed by a gradual weakening. When the land-use mix exceeds 0.65, its SHAP value turns negative again. This observation aligns with logical reasoning for several reasons. Firstly, in locales characterized by very low land-use mix, the types of available destinations and services within walking distance remain limited, impeding walking activity. Secondly, as the land-use mix increases, the diversity of accessible destinations (e.g., shops, parks, and restaurants) expands, offering a broader array of choices that can motivate older adults to engage in walking. Lastly, when the land-use mix becomes excessively high, it may lead to overcrowding, traffic congestion, and high building density, resulting in an unenjoyable and unsafe walking environment. Therefore, adverse impacts on walking in areas with extremely high land-use mix are expected.
Figure 5(c) shows the main effects of intersection density on walking time among older adults. Notably, when the intersection density falls below 50/km2, its SHAP value is negative, which means that this variable adversely affects older adults’ inclination to engage in walking. When the intersection density surpasses 50/km2, its SHAP value is positive and continues to increase until it peaks at the intersection density of 80/km2. This phenomenon can be attributed to the fact that a high intersection density gives older adults more opportunities to navigate through the urban environment, thereby bolstering walking. This initial increase in density has a positive impact on walking. At an optimal density level, a delicate equilibrium is achieved between older adults’ mobility and traffic flow. Areas with a moderate density of intersections ensure pedestrian accessibility while maintaining efficient traffic flow, fostering the most favorable conditions for walking. However, when the intersection density exceeds 120/km2, its SHAP value remains a positive constant. The continued escalation of intersection density beyond this optimal threshold may culminate in traffic-related pressures, prolonged wait times for older adults at intersections, and increased noise from traffic congestion. These factors collectively detract from the overall walking experience.
Figure 5(d) presents the local dependence plot illustrating the relationship between monthly family income and older adults’ walking behavior. Notably, when the monthly family income is low, its SHAP value is positive, indicating a positive impact on walking. However, if it is high, the SHAP value turns negative. This observation aligns closely with the prevailing reality in Hong Kong. Older adults from higher-income families may reside in areas farther away from the city center. These areas may feature a heightened likelihood of utilizing automobiles for transportation. Conversely, older adults with lower family incomes tend to rely more heavily on walking to fulfill their travel needs.
Figure 5(e) illustrates the main effects of the green view index on older adults’ walking behavior. When this index is below 0.2, its SHAP value is mostly negative, indicating a dampening effect on older adults’ propensity to engage in walking. When the green view index exceeds 0.2, its SHAP value is positive. This observation aligns with logical reasoning. A higher green view index signifies an environment characterized by the increased presence of greenery and natural landscapes around one’s residence. Such surroundings make walking more appealing and aesthetically pleasing. Green spaces, in particular, offer shade and relief from direct sunlight, enhancing the overall comfort of walking. Moreover, these green areas often serve as focal points for social interaction and community engagement. Older adults are more inclined to walk in such verdant spaces, providing opportunities to forge new friendships, partake in group activities, and savor the benefits of social interaction during their walks.
Interaction effects of variables
We analyzed local interaction effects among all variables and identified the pair of variables exhibiting the largest interaction. As depicted in Figure 6, we selected two variable pairs for further investigation.
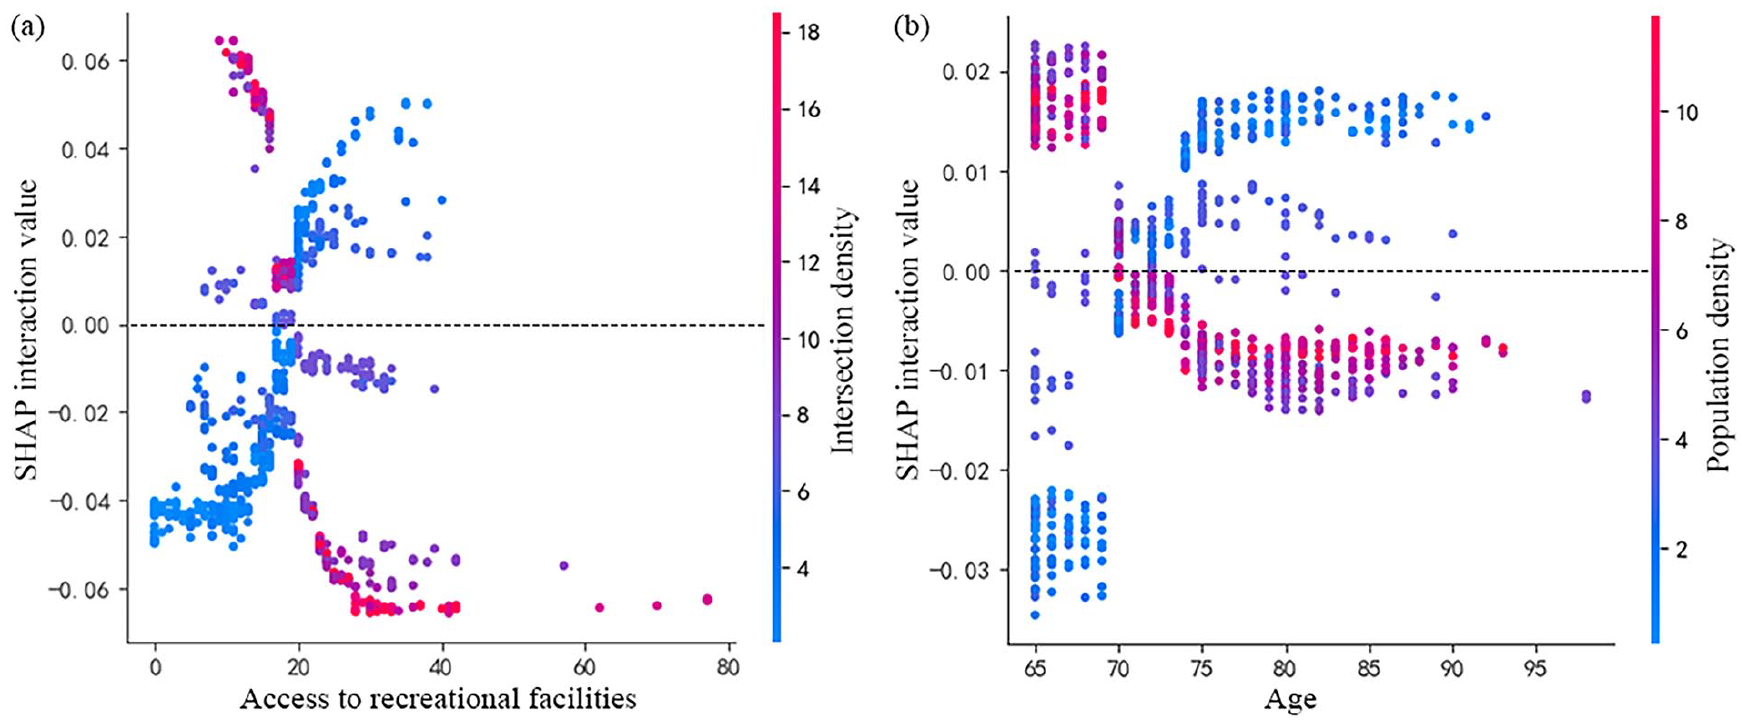
Local interaction effects of variables.
Figure 6(a) indicates that the local interaction effects between access to recreational facilities and intersection density are the most substantial. The horizontal axis and the vertical color bar correspond to the values of access to recreational facilities and intersection density, respectively, while the vertical axis represents the SHAP interaction value for both variables. Notably, when intersection density is high (low) and access to recreational facilities is low (high), these two variables exhibit synergistic effects.
Figure 6(b) presents the local interaction effects between age and population density. The synergy between these factors is obvious when population density exceeds 60,000 persons/km2 and the age of older adults is below 70 years. This finding is logical. In locales characterized by high population density, there tend to be heightened concentrations of destinations, services, and amenities readily accessible on foot. Such convenience acts as a catalyst, particularly for older adults under 70 who often do not have physical limitations, spurring them to engage in more frequent pedestrian activities, including shopping, dining, and recreational pursuits.
Conclusions and discussion
The global phenomenon of aging is undergoing rapid intensification, presenting myriad challenges and opportunities for societies worldwide. With an aging population and increased life expectancy, addressing older adults’ unique needs and well-being has grown ever more pressing. Amidst the multifaceted challenges posed by an aging population, a particularly salient area that merits our collective attention and concerted efforts is the impact of the built environment on the active travel behaviors of older adults. In this study, we used interpretable machine learning techniques and multi-source data to elucidate the non-linear and synergistic effects of various built environment factor on older adults’ walking time. Our study underscores several key findings: (1) the built environment accounts for approximately 70% of the variance in older adults’ walking time; (2) notably, access to recreational facilities and the land-use mix emerge as the two most pivotal built environment variables shaping older adults’ walking behavior; and (3) importantly, our analysis unveils a synergistic interplay among predictor variables (e.g., access to recreational facilities and intersection density, and age and population density).
The machine learning model of LightGBM employed in this study abstains from assuming specific functional forms for the relationships among variables. It can capture intricate non-linear associations between the predictor and predicted variables and is more dependable in the revelation of complex relationships. To facilitate a transparent and interpretable comprehension of the factors influencing model predictions, we have harnessed an interpretable machine learning model, namely SHAP. These models provide an avenue for grasping the nuances of the connections between built environment variables and older adults’ walking behavior. More importantly, they facilitate the exploration of interactions among variables. This study deviates from previous studies on elderly walking behavior due to its identification of synergistic effects between variables. Traditional black-box machine learning models may inadvertently overlook these intricate insights, underscoring the value of our chosen approach (LightGBM + SHAP).
This study carries significant practical implications. Firstly, it shows the importance ranking of built environment variables. Notably, access to recreational facilities emerges as the foremost influencer of older adults’ walking time. Consequently, relevant government departments can focus on constructing or refurbishing recreational facilities like recreational facilities and community centers in areas with concentrations of older adults. This should be accompanied by the establishment of accessible pathways to enhance access to recreational facilities. Similarly, initiatives should aim to improve the land-use mix and green view index, both of which exhibit positive associations with older adults’ walking behavior. These aspects warrant particular attention from authorities dedicated to fostering an aging-friendly society and environment. Secondly, the recognition of the non-linear impact of the built environment on older adults’ walking paves the way for more nuanced intervention strategies. Our research delineates effective ranges for bolstering access to recreational facilities, land-use mix, and intersection density. Beyond these thresholds, the influence of these factors tends to plateau, potentially leading to resource allocation inefficiencies. It is worth noting that excessively high or low land-use mix can diminish older adults’ motivation to walk. Excessive levels may result in congestion, noise, and safety concerns, while very low levels may limit destination and service diversity. Thirdly, the insights from the SHAP model furnish optimal parameter range combinations for built environment variables. Armed with an understanding of these parameter values and their synergistic effects, policymakers can establish precise improvement targets for each variable, aiding in the formulation of well-informed decisions for enhancing the urban environment.
Although there are many intriguing findings in this study, it is essential to acknowledge certain limitations that may inspire future research endeavors. First and foremost, the utilization of cross-sectional data in this study confines our analysis to establish correlations between the built environment and older adults’ walking behavior without permitting the establishment of causal relationships. Longitudinal data or experimental designs could offer valuable insights into causality. Secondly, the present unavailability of detailed TCS 2022 data necessitates our reliance on the TCS 2011 dataset, which may not reflect up-to-date travel characteristics of Hong Kong. Using the latest TCS 2022 data is recommended in the future. Thirdly, TCS 2011 data constrains our ability to consider the potential influence of additional factors (e.g., weather conditions, traffic volume, personal preferences) on older adults’ walking behavior. Further research should aim to encompass a more comprehensive array of variables to attain a holistic understanding of the complex phenomenon. Furthermore, the inherent limitations of self-reported travel time by respondents may introduce inaccuracies when compared with more precise GPS tracking data. Future investigations could seek to collect granular, firsthand data, including personal characteristics, real-time weather conditions, and GPS tracking, to enhance the accuracy of analyses. Lastly, while the methodologies and insights from this study can serve as valuable references for other cities, the application of optimal thresholds for each built environment variable may prove challenging across diverse urban contexts. Consequently, future research encompassing comparative studies across multiple cities can yield more universally applicable findings, offering valuable guidance for urban planning and policy implementation.
Footnotes
Acknowledgements
The authors are grateful to the reviewers for their constructive comments.
Declaration of conflicting interests
The author(s) declared no potential conflicts of interest with respect to the research, authorship, and/or publication of this article.
Funding
The author(s) disclosed receipt of the following financial support for the research, authorship, and/or publication of this article: This study was supported by the National Natural Science Foundation of China (No. 52278080).