
Abstract
Encouraging cycling, one of the urban non-motorized transport modes, has been well recognized as an environment-friendly way that alleviates urban traffic congestions and solves the first/last mile issue. However, concerns about the efficiency and safety of urban cycling have been widely made by urban planners due to the unclear right-of-way and discontinuous non-motorized corridor for cycling. This study uses the dynamic location data of the Meituan Bike (formerly Mobike) in the Hi-tech Park area of Shenzhen to analyze the spatial-temporal variations of bikeshare use, aiming at identifying the traffic corridors of cycling. Combined with agent-based modeling technique and social force model, this research proposes a new approach of simulating the urban non-motorized traffic, and hence provides valuable insights for building bicycle lanes for cycling corridors. The results show that (1) the usage of bike sharing during weekdays is 2.5 times that on weekdays, and the cycling corridors are usually the main and secondary roads that are in the vicinity of the metro stations; (2) adding bicycle lanes can reduce the traffic density of the non-motorized volume by 6% in an overall, and save the travel time of cyclists and pedestrians by 6.4% and 3.7%, respectively.
Introduction
With the emergence of growing traffic congestion, pollution, and noise related to motorized traffic, non-motorized transport modes (i.e., walking and cycling) are regarded as an important solution to change the current urban transport from a car-oriented to a railway + slow traffic pattern (National Association of City Transportation Officials [NACTO], 2013; Rietveld, 2001). Non-motorized transport, particularly cycling transport, has salient advantages of convenience, flexibility, and environmental friendliness per se, as well as providing leisure and active exercise opportunities to travelers (Wang and Deng, 2022). It has an important role in public transport connections, as it is irreplaceable by other traffic modes (Liang et al., 2016; Lundberg and Weber, 2014). The trend of cycling in many cities has been U-shaped throughout its development process. Bike riding becomes better recognized and prevailing especially when the use of shared bicycles mushrooms (Conrow et al., 2018; Guo et al., 2021). The number of cities that introduced bike share programs has increased sharply from a sprinkling at the end of the 1990s to more than 800 in 2015, with more than 900,000 shared bikes equipped (Meddin and DeMaio, 2022). Recently, dockless (floating) bike share has become prevalent since its first operation in 2016, acting as a catalyst for globally promoting bike share development. Particularly in China, the number of shared bikes has increased to over 23 million within a few years (Guo et al., 2022).
Although bike sharing provides high convenience and efficiency to cyclists (Hirsch et al., 2019; Mooney et al., 2019), its attractiveness is curbed by the relative lags in the construction of cycling facilities. The current riding facilities and urban space can hardly meet the huge demands and rapid increases of docked and dockless bike sharing, and it is difficult to coordinate the rights of way between riding and walking in this respect (Guo and He, 2021a, 2021b; Hauf and Douma, 2019). Sidewalks along most roads are used for the non-motorized demands of walking and cycling, but this space has been frequently occupied by roadside parking (Rubie et al., 2020). In the meantime, non-motorized vehicles including private and shared bicycles disorderly assemble in the motor vehicle lanes, and the tense traffic flows negatively interplay with each other (Wang, 2020). The mixing of bicycles with motor vehicles and pedestrians affects road traffic orders and reduces road capacity, which might induce certain traffic accidents (Klassen et al., 2014). Therefore, the bicycle-related infrastructure construction and the improvement of non-motorized transport system are urgently desired, for overall social and environmental promotions (De Chardon, 2019).
Traffic simulation, as a vital instrument for evaluating and optimizing traffic systems, has drawn increasing academic attentions (Bazghandi, 2012). Traffic simulation is a novel and well-developed technology to reproduce the temporal and spatial changes in traffic flows (Maerivoet and Moor, 2005). In recent years, numerous transportation research has applied simulation technology in terms of prediction and analysis of traveling choices, demands, route planning and distinctive travel situations (Du et al., 2021; Małecki et al., 2022; Nourinejad et al., 2014; Pel et al., 2012; Zhou et al., 2009; Pel et al., 2012; Nourinejad et al., 2014). For example, Zhou et al. (2009) used Markov process theory to model the trip trajectories, driving directions, and behavioral conflicts of individuals, followed by establishing a microscopic model of mixed traffic flow of cars, bicycles, and pedestrians; Lu et al. (2018) utilized spatial agent-based models to simulate the interactions between passengers and transport modes, resulting in a successful reflection of travelers’ behavior choices in a passenger transportation market. Wei and Ying (2011) used cellular automata (CA) model to simulate the speed and characteristics of bicycle flows on road sections, to evaluate the impact of numerous lanes on the cycling capacity; Małecki (2018) developed a mathematical model on the basis of CA and agent-based modeling technology to describes on-street parking dynamics, and simulate the impact of such parking on traffic flow, speed, and travel time. These studies on simulation technology in non-motorized systems are commonly based on CA models, but with limited literatures focused on the impact of setting specific bicycle lanes. Moreover, the models are usually built either for pedestrians or cyclists, instead of both parties. Lately, Jin et al. (2022) developed an integrated simulation framework with an enhanced k-means clustering method and an Ant Colony Optimization algorithm; however, it was applied in a complex and enormous city-scale bike sharing system.
Compared with CA model and other adapted simulations, agent-based modeling is a bottom-up computational model to understand the behavior of a system and what governs its outcomes by simulating the actions and interactions of autonomous agents, while in CA it was general rules (Grimm and Railsback, 2013). In recent years, it has become an important tool, helping decision makers to make choices based on crowd behaviors. Agent-based modeling has been shown its usefulness as a tool for experimenting with strategies for economy (Farmer and Foley, 2009), road traffic (Huang and Hu, 2018), emergency evacuations (Cotfas et al., 2022), public health (Krivorotko et al., 2022), etc.
Thus, this study aims to propose a new approach that applies agent-based modeling and social force model, to simulate the urban non-motorized traffic. It is based on the big data of bike sharing, deriving from a case study on Nanshan District of Shenzhen, China. As showed in the flowchart of Figure 1, the study first identifies the cycling corridors through open data of Meituan bike, one of the most popular dockless bike sharing programs in China, followed by applying the agent-based modeling to simulate the cycling and walking behavior collectively under the framework of social force model. Under the environment of the AnyLogic platform, this study constructs the multi-agents of cyclists and pedestrians at the micro level so as to simulate the operation state of urban non-motorized traffic. Finally, the study elucidates the necessity of adding extra cycling lanes in the current road system. By comparing the simulation results and current situation, we use the indices of traffic density and travel time to explore the impacts of constructing cycling lanes on the current non-motorized traffic service capacities. The results of this study could provide a scientific and reliable basis for building bicycle lanes to improve the non-motorized transport, under the worldwide background of cycling renaissance.
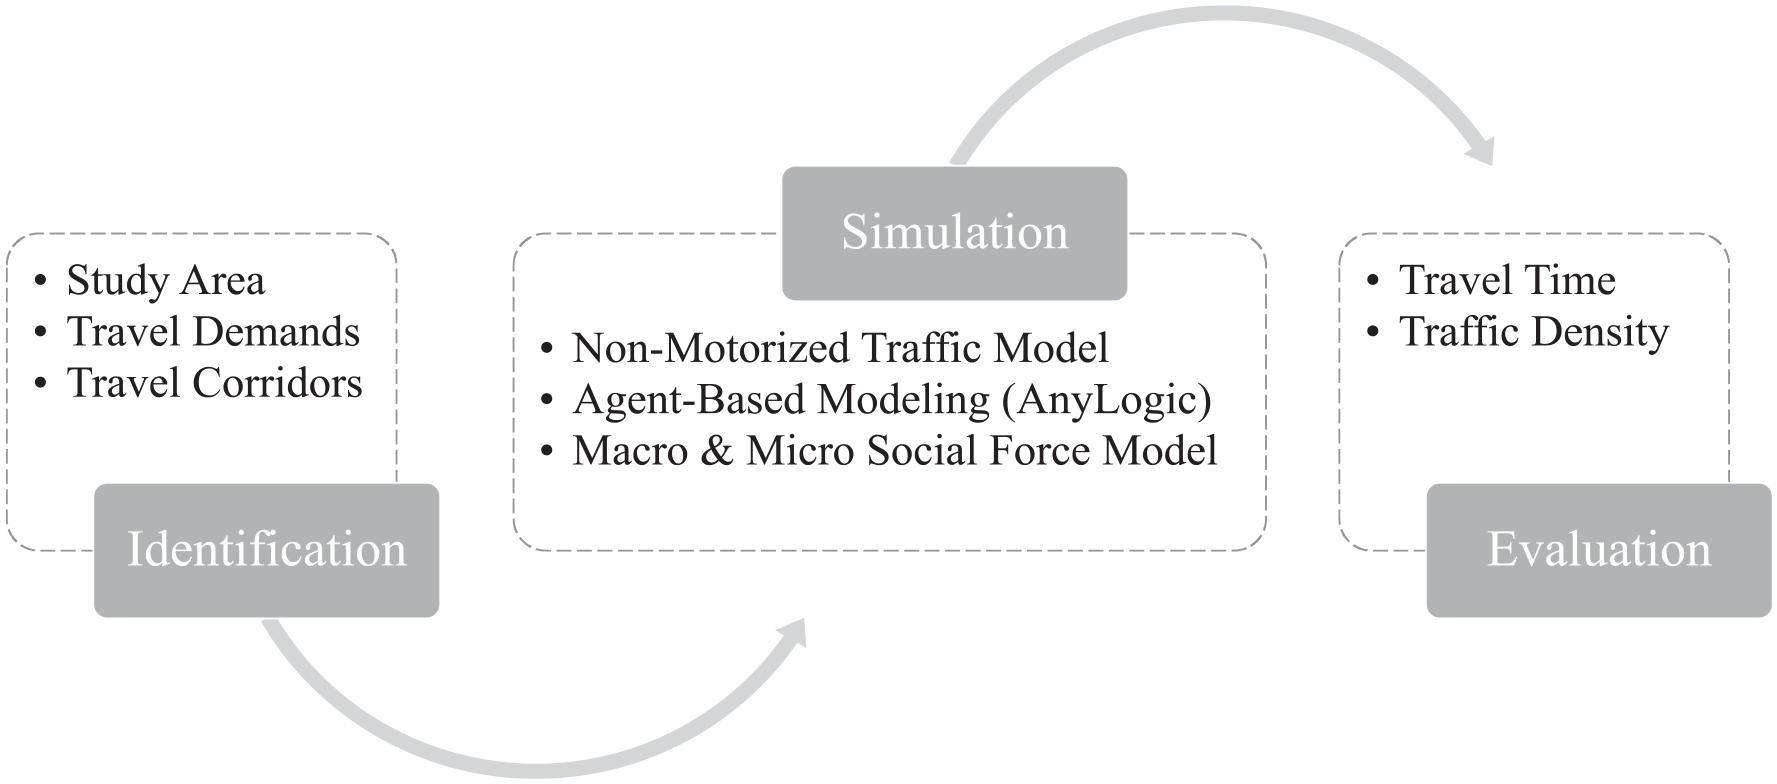
The research flowchart.
Identification of the cycling corridors
Data collection
In this paper, the data was web-crawled from the mobile app of Meituan bike (formerly known as Mobike), one of the most commonly used bike share programs in Shenzhen, China. The case areas were specified in the middle and south zones of Hi-tech Park of Nanshan District (Figure 2), which are full of commuting trips by various of travel modes, particularly cycling and walking. The study area is 8.94 km2 with employment density of approximately 13,000 per km2, showing as the job center of Shenzhen. According to the research by Tu et al. (2019) and Guo et al. (2021), it shows that the High-tech Park is the hot spot of the bikeshare region, which is attributed to the social-built environment characteristics in this areas. For example, High-tech Park has a cluster of various high-tech and finance companies, commercial facilities, governments, and entertainment activities, with an acceptable commuting time due to the relatively low housing rent. This phenomenon leads to spatial commuting tides across the city on weekdays, which derives from the large demand for bikeshare use.
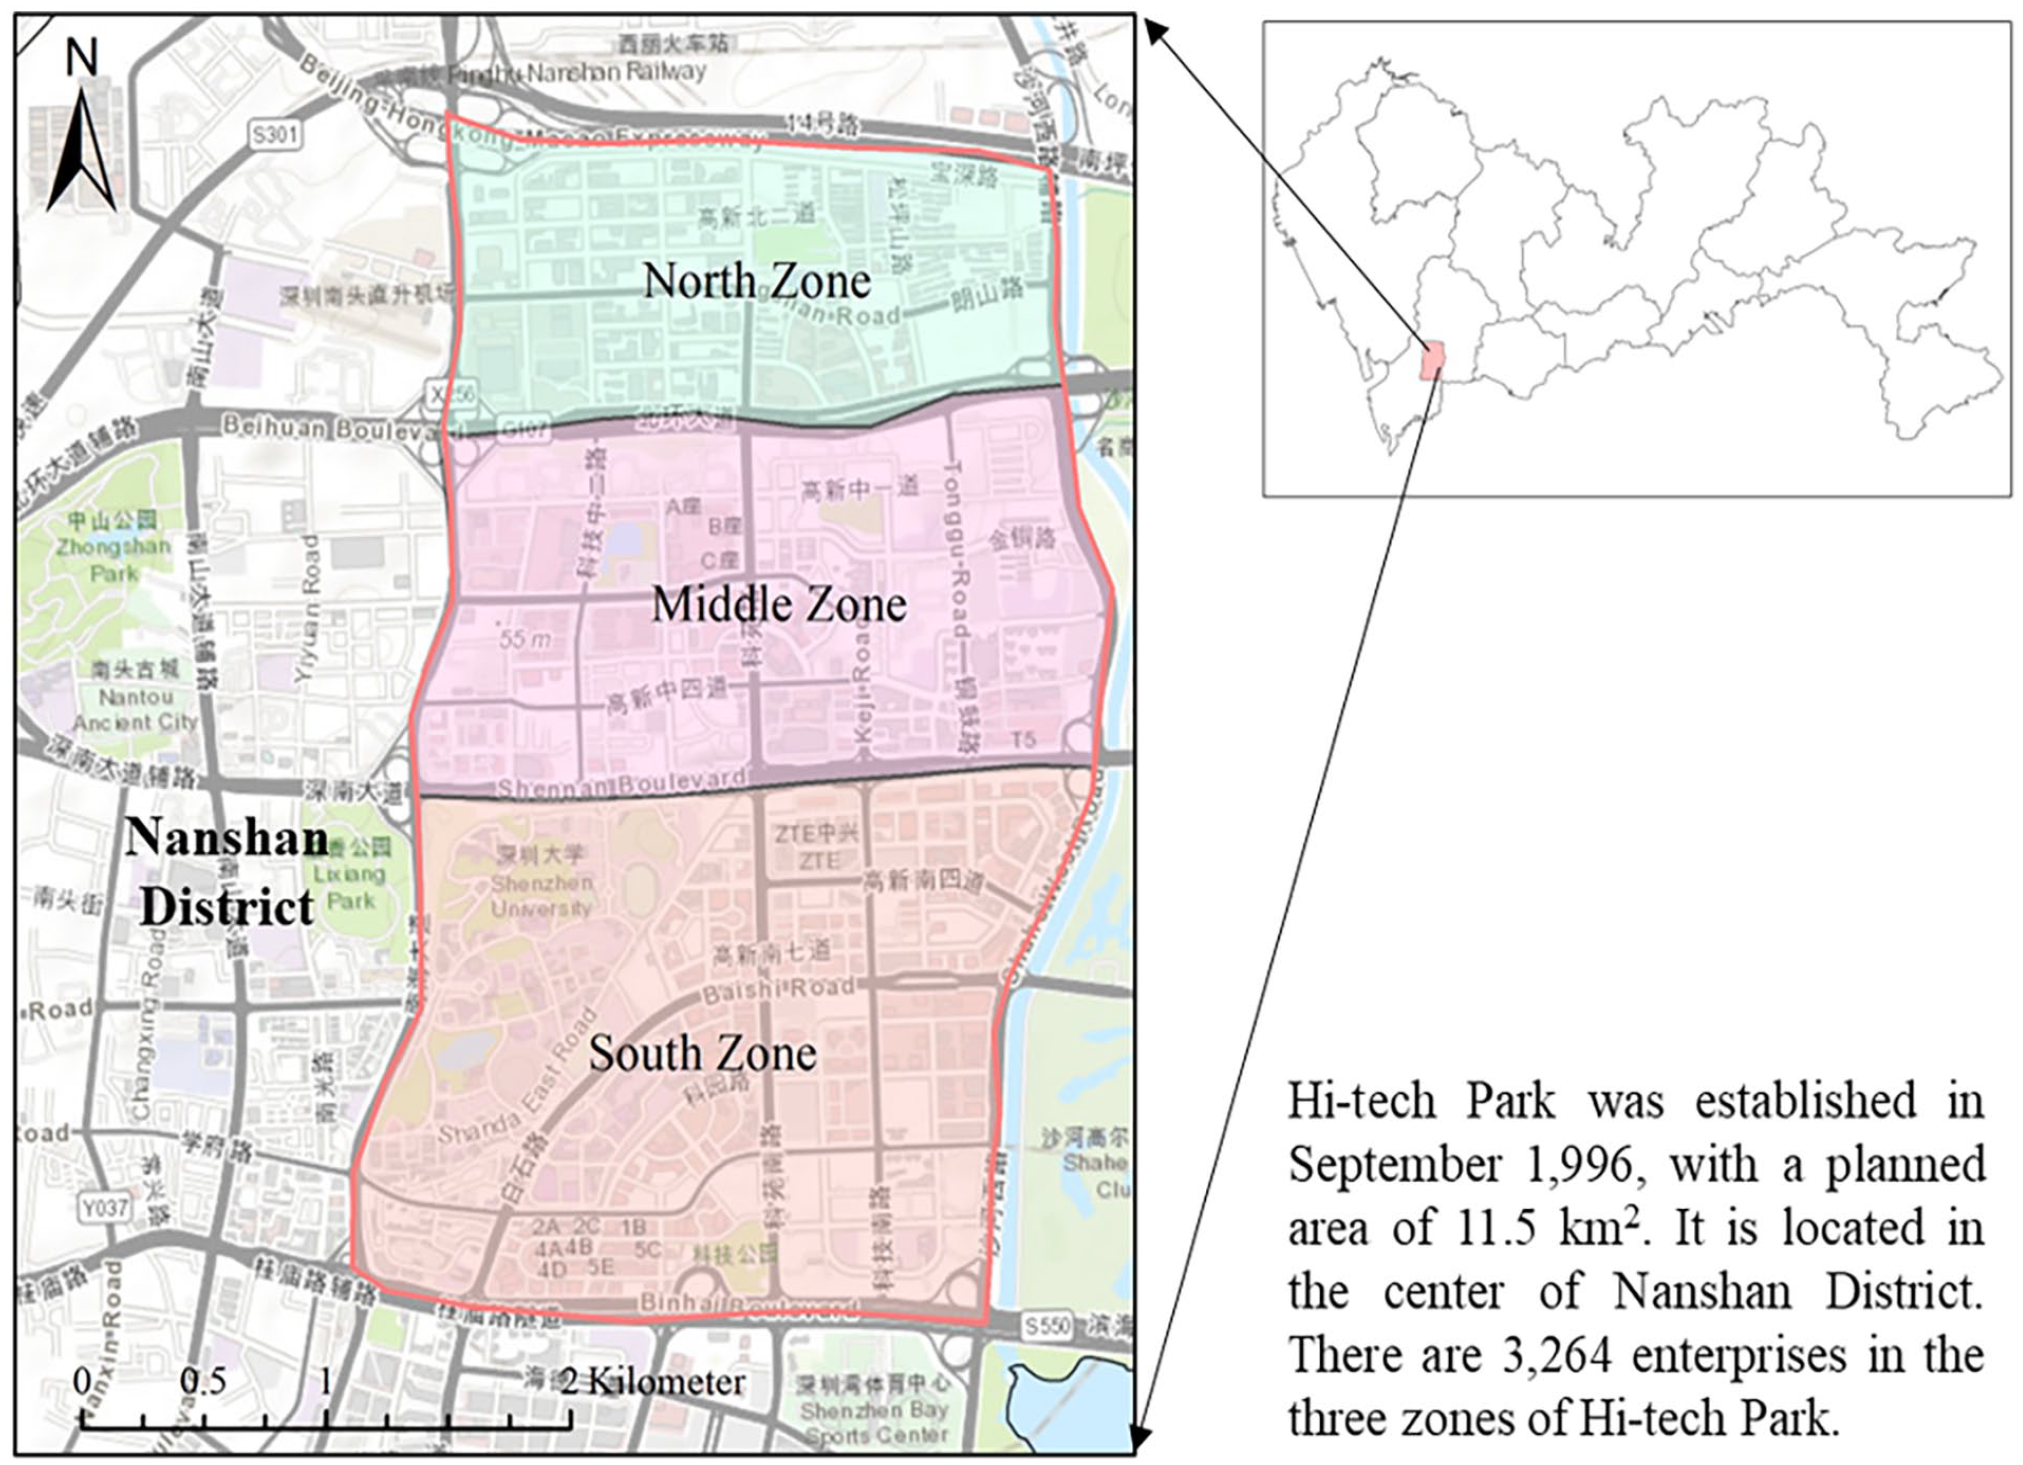
Study area of Hi-tech Park in Shenzhen.
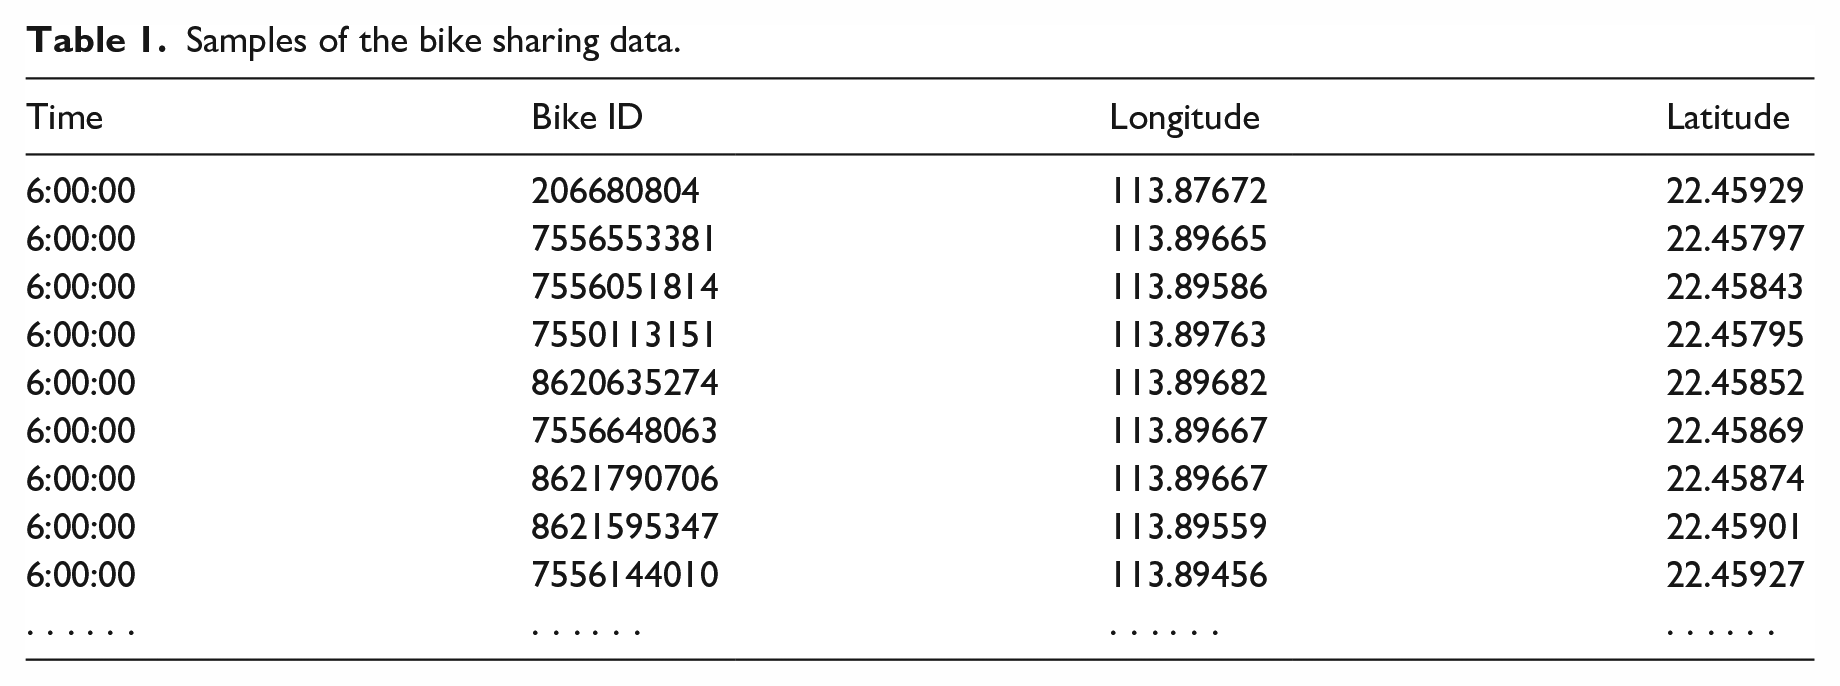
An Application Programming Interface (API) crawler was employed to collect the dynamic location information of shared bikes at an interval of 3 minutes throughout the study area. Bike ID, location (longitude and latitude with five decimal places), and time (accurate to the second) of shared bikes were included in the data (Table 1). In total, we captured 26,721 shared bikes, including moving and stationary bikes, during 6:00 AM to 24:00 PM from 19 July to 24 July in 2017. It indicates that the shared bikes have been allocated in the case area with a high density, namely 2,988 per km2. Among these allocated bikes, 3,254 stationary bicycles were identified on average at each time point. In addition, 7,029,096 cycling trips were recorded totally, indicating an average turnover rate of 43.8 times per bike per day, which is a rather high level of shared bike usage.
Samples of the bike sharing data.
Travel demand analysis
Travel demand of cycling can be evaluated by the density distribution of shared bikes. By using the approach of kernel density analysis to examine the collected geographic information of Meituan bikes, the spatial distributions of shared bicycles were revealed. Figure 3 shows the kernel density map at the morning peak (8:00 ~ 9:00) in the middle and south zones of Hi-tech Park for trip origins and destinations, respectively. The departure/origin hot areas with high kernel density are basically in the vicinity of railway stations, while the destination hot areas with the high kernel density are located at the central business areas of Hi-tech Park (e.g., Software Industry Base, Kingdee Software Park, Kexing Science Park).
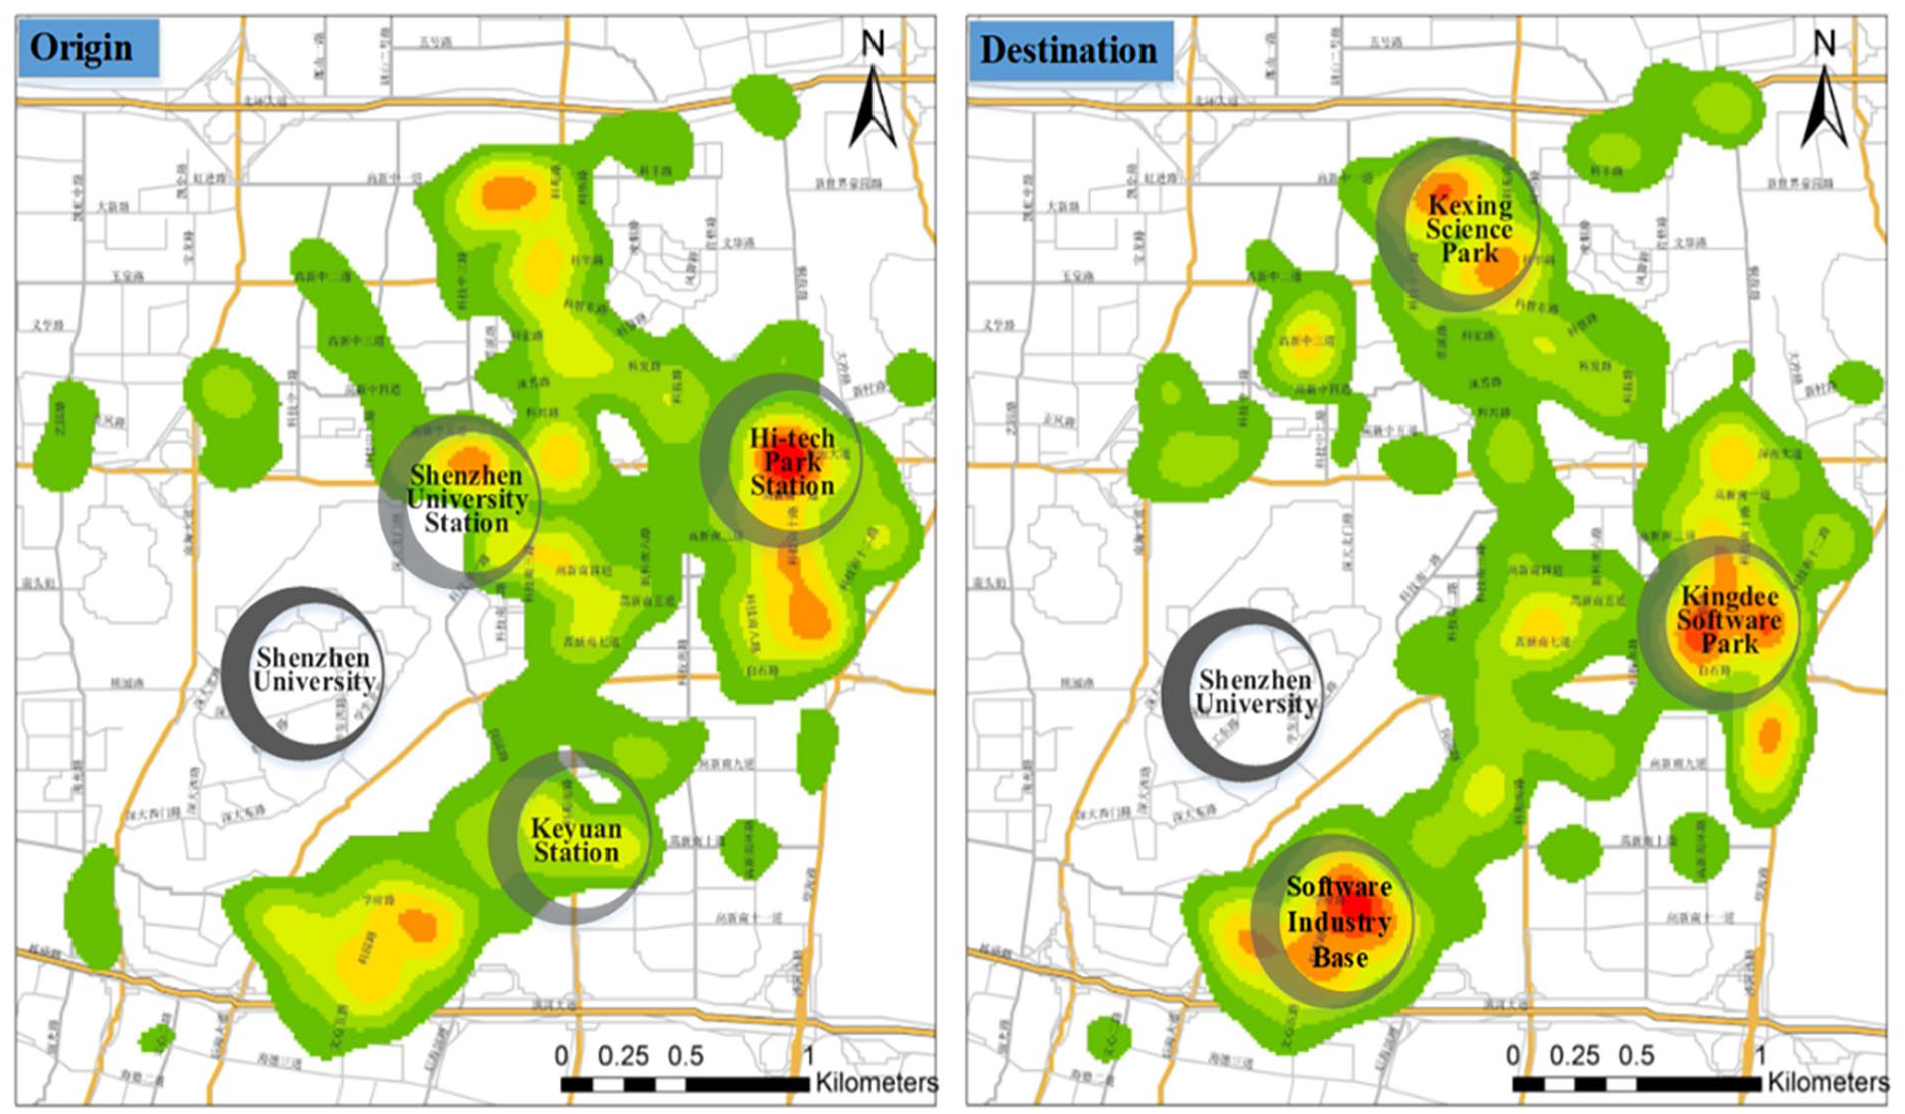
The origin and destination heat map of shared bike.
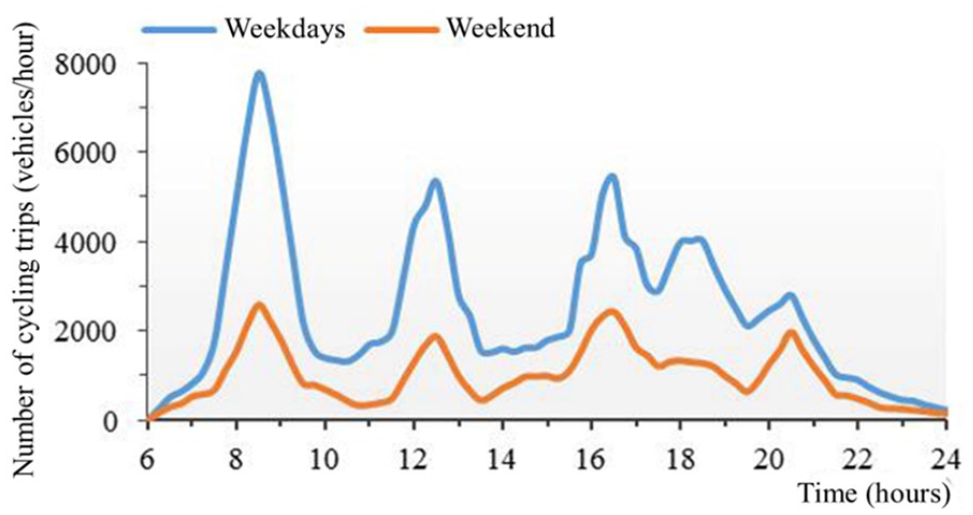
The dynamic changes of bicycle riding in the Hi-tech Park area are pronounced (Figure 4), illustrating three peaks during the commuting and eating periods. The bicycle sharing trips within this area are approximately 7,783 vehicle per hour, and its highest value of the day comes around 8:45AM, which is four times that of the off-peak periods. Given that, the shared bikes are shortly supplied during the morning peak on workdays, the ratio could be larger if more shared bikes are available. In addition, the amount of bicycle trips during weekdays is 2.5 times that on weekends, and this is mainly because most companies in the park do not operate on weekends, lowering the travel demands. However, it shows a similarity in their travel demand distribution to that of weekdays.
The distribution of riding bike sharing.
Travel corridors identification
As the cycling route involves personal privacy, information such as the bike ID and geographic location of shared bikes can be obtained through the API of Meituan mobile app. When the data collection period is continuous and long enough, a matching algorithm can decipher the geographic information of a bicycle to produce the departure and arriving points of each trip. However, such origin-destination (O-D) information is not sufficient to depict the travel corridors of all the shared bicycles directly. To investigate the travel corridors in the study area and to understand the operational characteristics of the shared bicycles, this paper converts the original O-D line into a planned route (Figure 5) through the function of path planning provided by the AMAP, 1 one of the most popular online map servers in China. Once provided by the origin and destination of a trip, the AMAP can produce a planned route on a basis of this trip, which could be made by several possible travel modes including walking, cycling, driving, and public transit. Additionally, travel time and travel distance will also be generated after we set the travel mode as cycling. The travel route information (e.g., route section, cycling distance, and cycling time) are then stored as structured data and imported into the spatial information system.
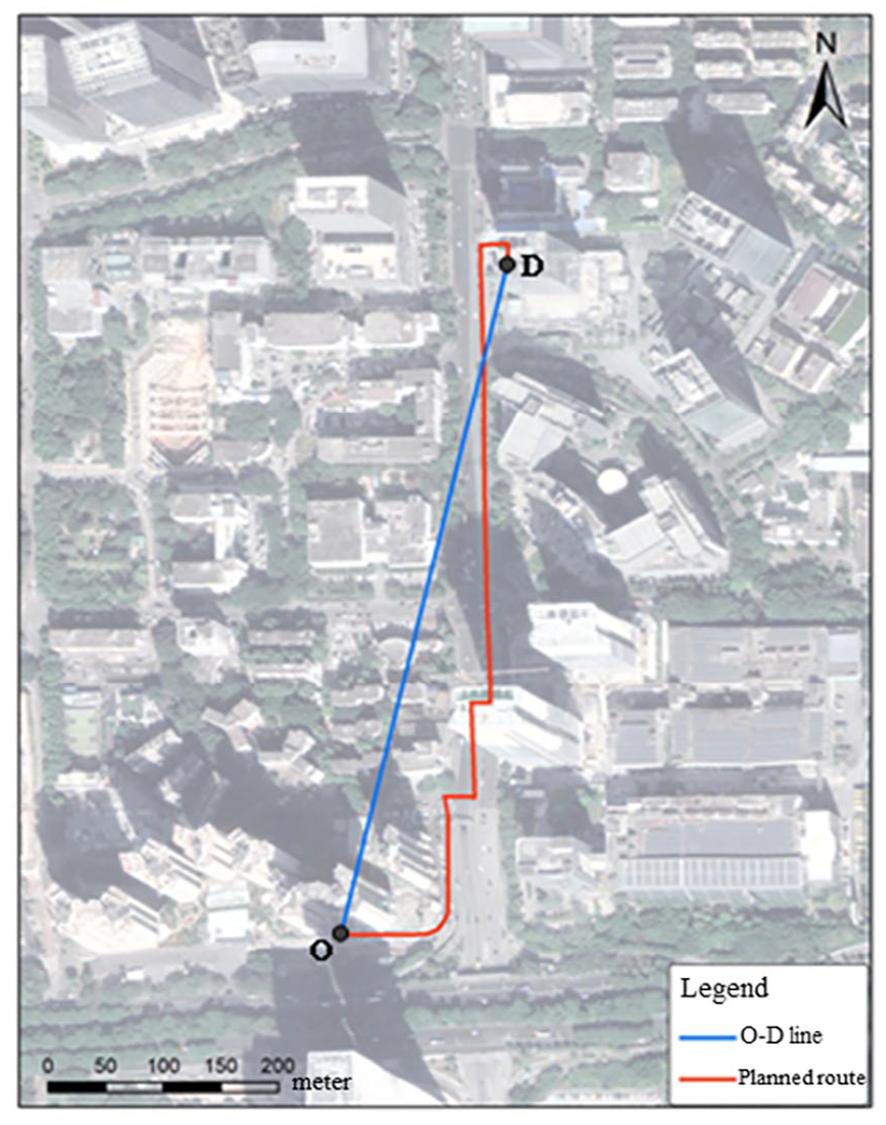
The O-D line and travel route of a trip by shared bike.
By converting the O-D information of bicycles during the morning peak into route information, the spatial distribution of cycling paths in Figure 5 can be elaborately produced as well. The redder color of a certain urban roads shows the higher frequency of bike sharing usage along them, indicating a possible cycling corridor in this area. The distribution of line density of bike sharing trips in Figure 6 shows five possible cycling corridors in Hi-tech Park areas, including Keyuan Avenue, Ninth Gaoxinnan Avenue, Wanghai Road, Gulou Road, and Fourth Gaoxinnan Avenue. These five cycling corridors are usually the major roads or secondary roads, instead of the urban express roads such as Beihuan Avenue in the north and Binhan Avenue in the south. In particular, among these cycling corridors, Keyuan Avenue, which cuts through the Hi-tech Park area from north to south, featured the highest density of bike sharing trips. Additionally, most of these cycling corridors are closely linked to the entrances and exits of the metro stations, such as Shenzhen University Station and Hi-tech Park Station. The vicinity of cycling corridors to metro station clearly shows that bike sharing is playing an important role in connecting with public transit (Guo and He, 2021a; Guo et al., 2021). Therefore, improving the non-motorized transport facilities of cycling can provide great convenience to metro commuters who face with a first/last mile issue.
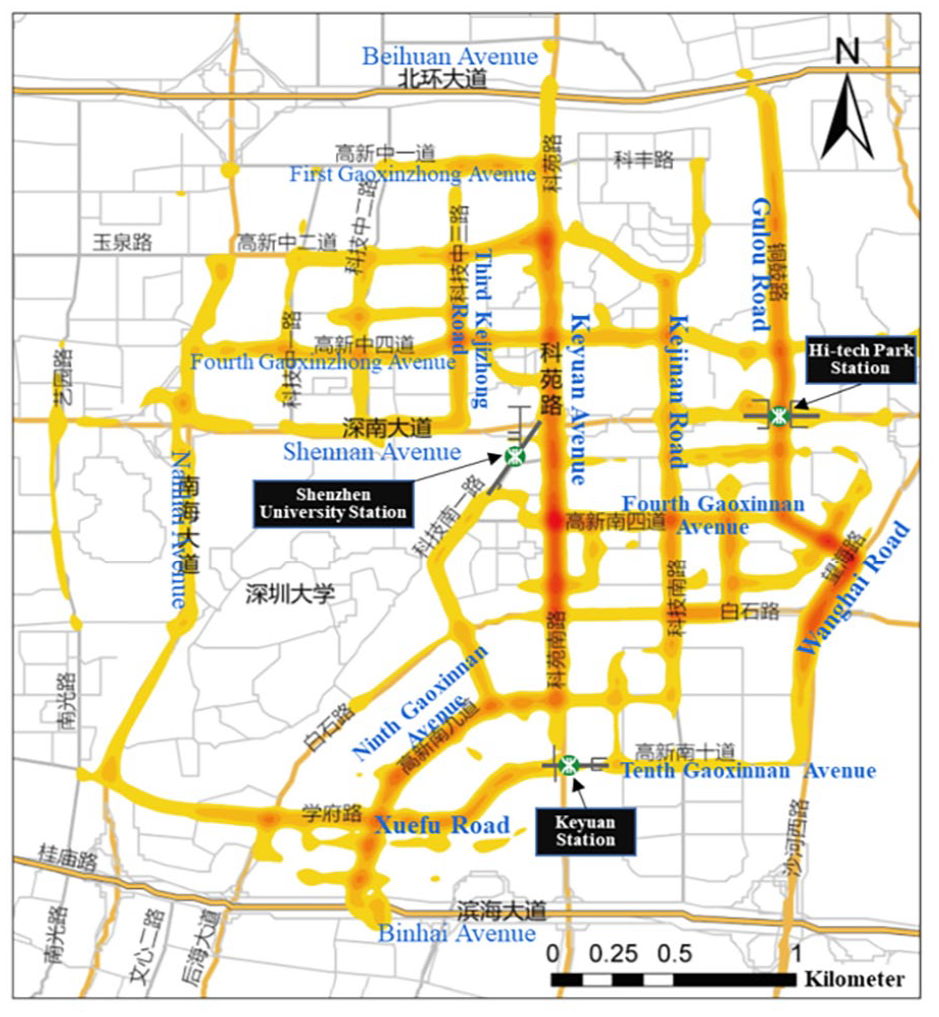
The cycling corridor in the Hi-tech Park area during morning rush hour.
Simulation modeling of non-motorized traffic
Hybrid traffic flow simulation refers to the modeling of the traffic scenario in which multiple traffic participants are involved. There is limited traffic simulation software that supports hybrid simulation modeling. As for cycling and walking, they are typical non-motorized transport modes, which are representatively human-powered and usually low-speed, flexible, and random (Bongiorno et al., 2019; Stefansdottir et al., 2019). In light of the differences in speed and convenience from motorized vehicles, the travel routes of non-motorized and motorized modes are usually different (Tirachini and Hensher, 2012). Therefore, the simulation model established in this study integrates more complicated behaviors and activities of individuals than the traditional traffic simulation model due to the combination of walking and cycling trips. Agent-based modeling technology, which enables the inclusion of multiple agents (Vehlken, 2020), is appropriately adopted to simulate people’s activities and behaviors under the framework of social force model, followed by an evaluation of the simulation effectiveness.
Agent-based modeling
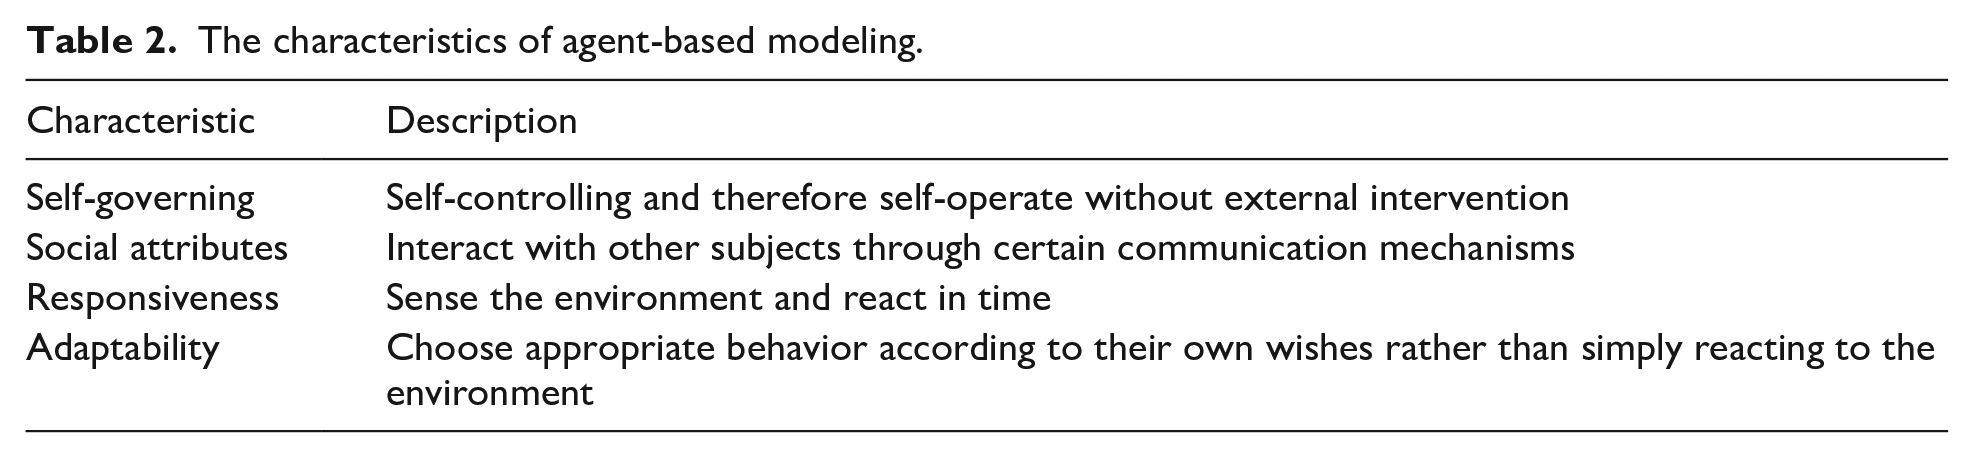
As the mainstream modeling method for travel behavior, agent-based modeling portrays the behaviors/characteristics of micro/individual units that comprises of a system (Bonabeau, 2002; O’Sullivan and Haklay, 2000). It reveals not only the mutual relations between the units and the evolutionary behaviors in the specific environmental background, but it also provides an understanding of the regularities of the system at macro level (Batty, 2005). The established agent-based modeling has the features shown in Table 2.
The characteristics of agent-based modeling.
In this paper, the agents of cyclists and pedestrians are modeled by using AnyLogic, 2 one of the complex system simulation platforms for agent-based modeling analysis. In agent-based modeling, the agent consists of three major parts: attribute, behavior, and state, which are interrelated with each other (Batty, 2012). Table 3 shows the components of each part. Based on the Belief-Desire-Intention model proposed by Georgeff et al. (1998), this study regards the traffic environment and traffic facilities as the Belief of the agent, while taking the purpose of reaching the destination as the Desire and treating the various behaviors of cyclists and pedestrians (i.e., moving forward, accelerating, decelerating, path finding, sensing other individuals and obstacles, avoiding, changing lanes, overtaking and queuing) as the Intention. At the beginning of each simulation, the agent of a traveler will choose a viable action from the intention set to execute. According to the simulation scene, a number of cyclist and pedestrian agents are generated. Meanwhile, the behaviors of individuals, the interactions between individuals, and the interactions between individual and traffic environment are simulated through this agent-based modeling, thereby reflecting the macro characteristics of the traffic system.
The major components of agent.
Social forces model
Compared with motorized transport such as the private car, non-motorized transport has personalized features which are strongly dependent on the attributes of non-motorized travelers. That is, the requirements for safety and collision avoidance of non-motorized travelers are less rigorous than those of motorized travelers, but with more complexities and randomness in terms of the movement (Hu and Huang, 2016).
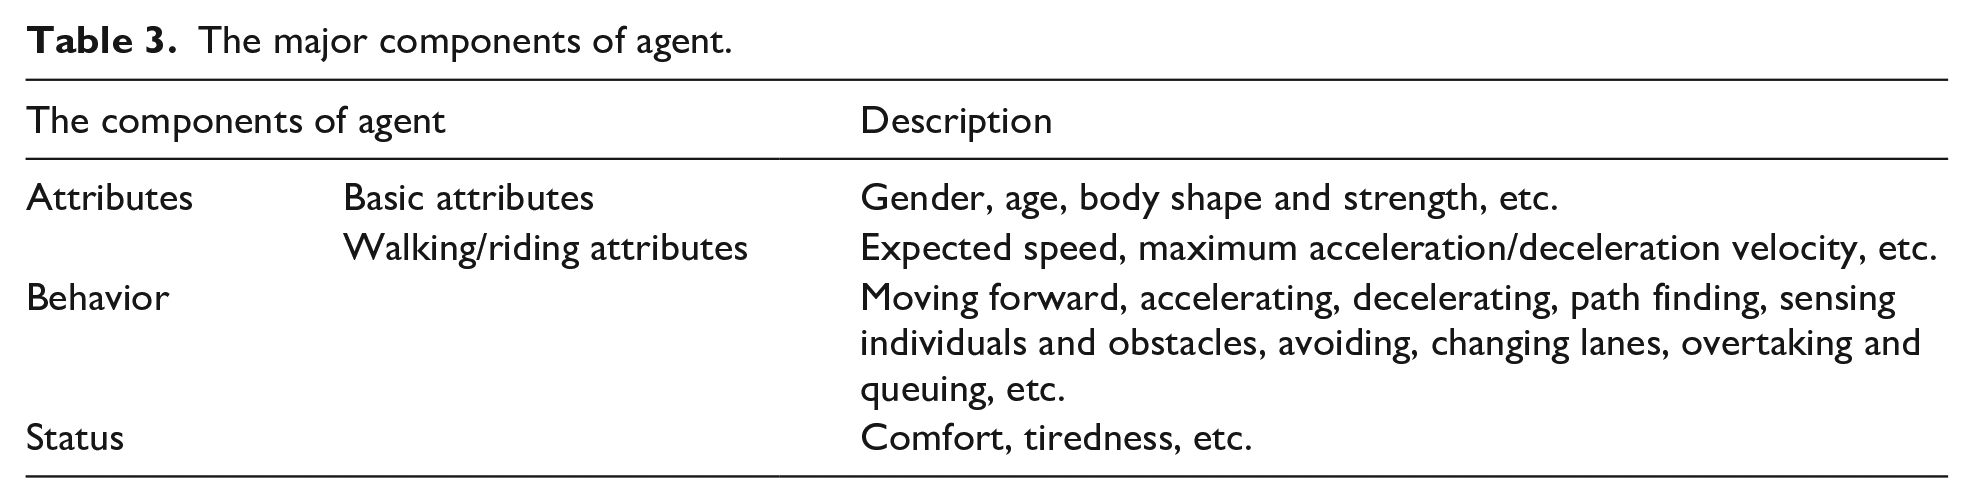
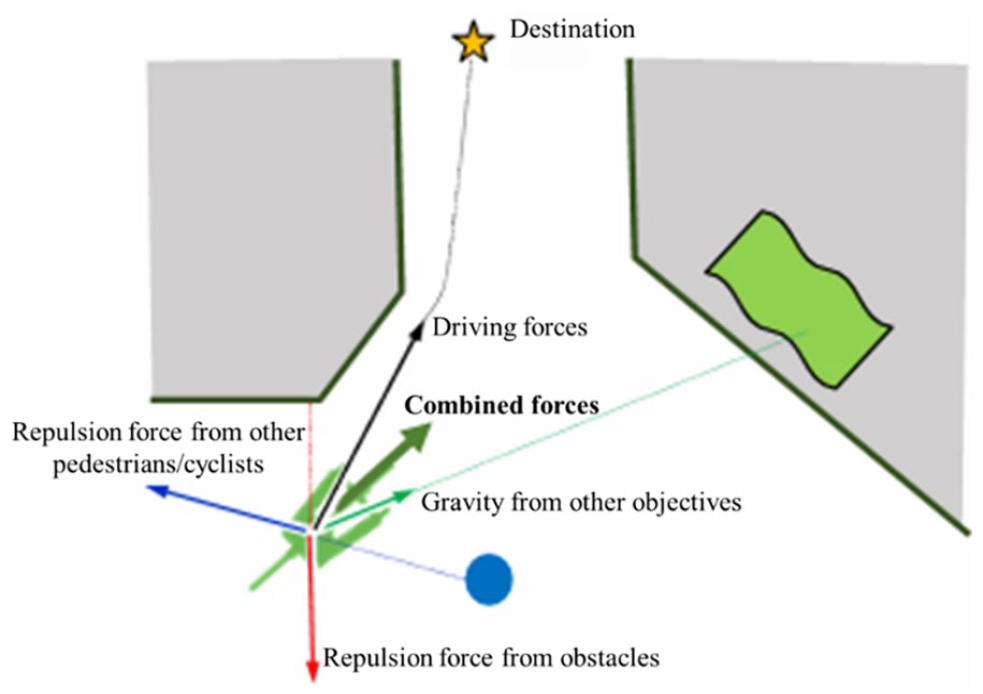
The social force model is a continuous micro simulation model that was first proposed by Helbing and Molnár (1995). The model is derived from the theoretical basis of Newtonian mechanics, assuming that a person’s walking behavior is driven by his own subjective willingness, while the direction and speed of walking are still influenced by other factors. In a view of the similar dynamic features between cyclists and pedestrians, the social force model has also been used to explain the movement of bicycles (Alsaleh and Sayed, 2021; Ma and Luo, 2016). In the social force model, three types of forces are taken into account (Figure 7), which are generated from the motivations (i.e., driving force) of cyclists and pedestrians, and repulsions from external obstacles (i.e., repulsion force from obstacles),and other individuals (i.e., repulsion force from other pedestrians/cyclists). When travelers stay unmoved, they also take up space. The required occupancy space here is the basis of the design for non-motorized transport system. Apart from the physical size of a vehicle, other factors such as age and gender of individuals and their perceived safety distance to other cyclists and pedestrians also influence the space demands (Figure 8) (Hu and Huang, 2016).
The diagram of social force model.
The occupancy space of cyclist and pedestrian.
Model building
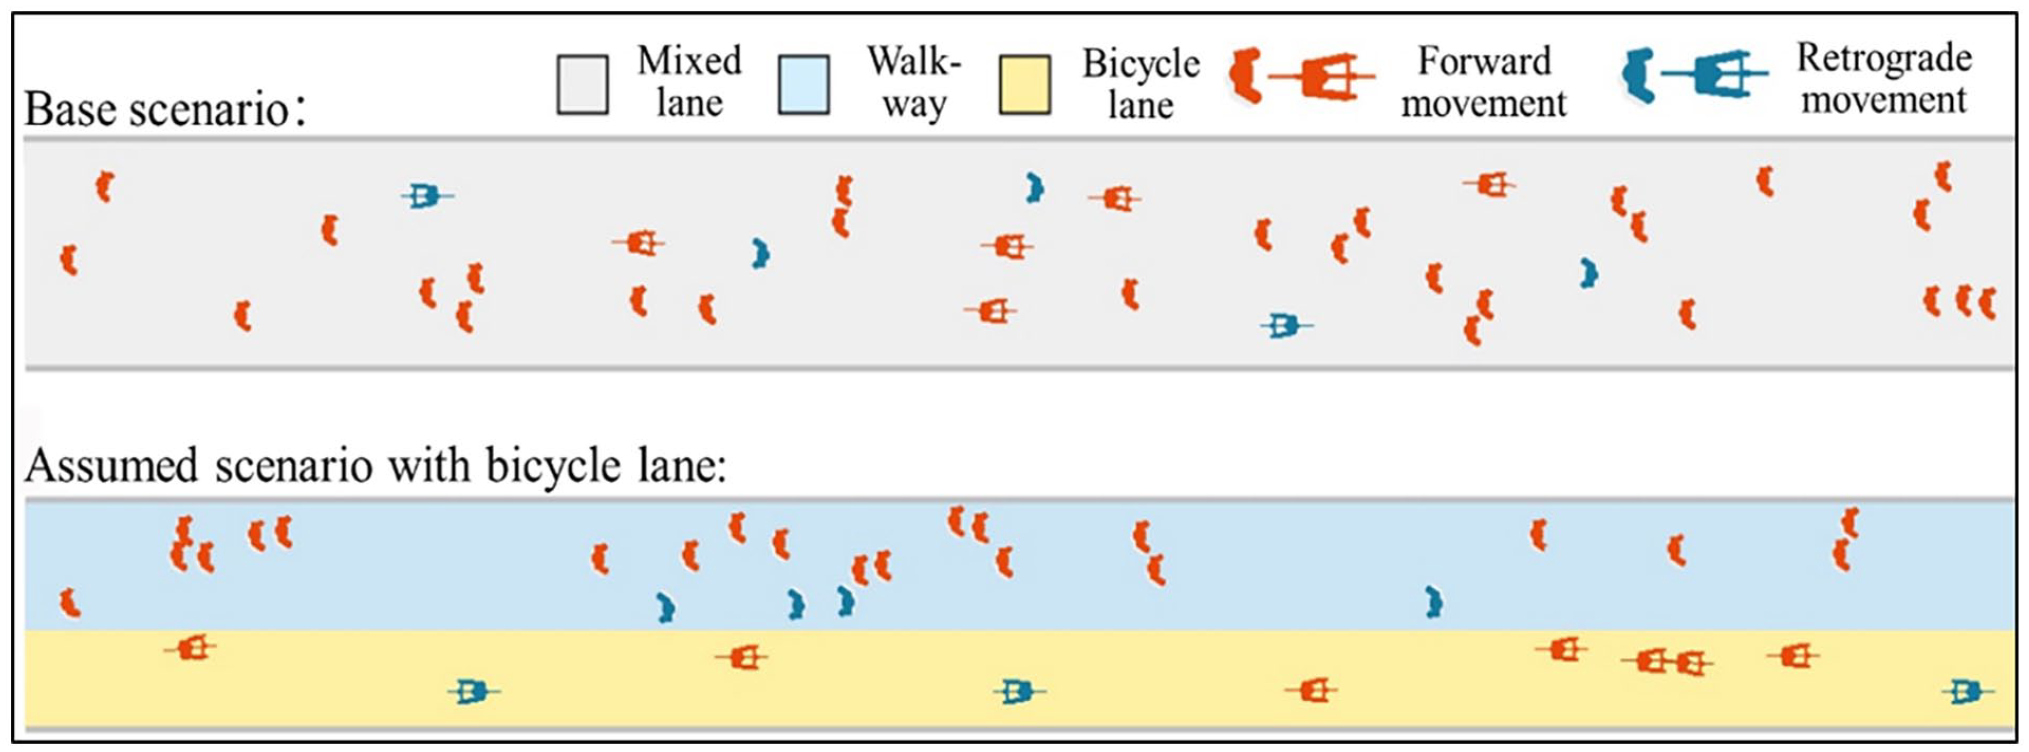
We selected the main cycling corridor of Keyuan Avenue as the simulation space, which was identified by the previous kernel density analysis in the section ‘Travel corridors identification’. Keyuan Avenue is a major urban road from north to south and carries a lot of cycling and walking trips. Hence, it is suitable for simulating the non-motorized traffic. The study constructs two simulation scenarios. The first one is the base scenario that is built based on the field survey data, indicating the real situation of non-motorized traffic. On the basis of the base scenario, an assumed scenario that adds a dedicated bicycle lane to the existing road section is built. By comparing the travel time and travel density, the impact of the extra bicycle lanes on the urban non-motorized traffic was evaluated.
Building a traffic simulation environment
Traffic is usually generated under a specific environment. Non-motorized traffic also follows this rule. With an understanding of the traffic situation through the field survey, the environmental model of the non-motorized traffic system is built, which enables the provision of a simulation system environment for the subsequent construction of the agents. This step involves extensive elements, such as obstacles (e.g., trees, fences, buildings), walking areas, cycling areas, shared areas for cycling and walking, queuing areas, etc.
Building the agent-based modeling
The behaviors of the cyclists and pedestrians are then abstracted for a convenience of building the agents by using the agent modules in the AnyLogic platform. The left part of Figure 9 shows the states of agents and the right part shows the attributes and behaviors of agents. Agents can perceive the pedestrians, vehicles, and the surrounding traffic environment, thereby providing the underlying data for the social force model. Subsequently, individuals will adjust their behaviors and activities according to their attributes, and finally control their state. In light of this, the agent-based modeling is used to simulate personal behaviors and interaction among individuals in reality. Through building a bottom-up system, it can simulate the interaction behaviors such as avoidance, acceleration, and deceleration between cyclists and pedestrians from a micro perspective.
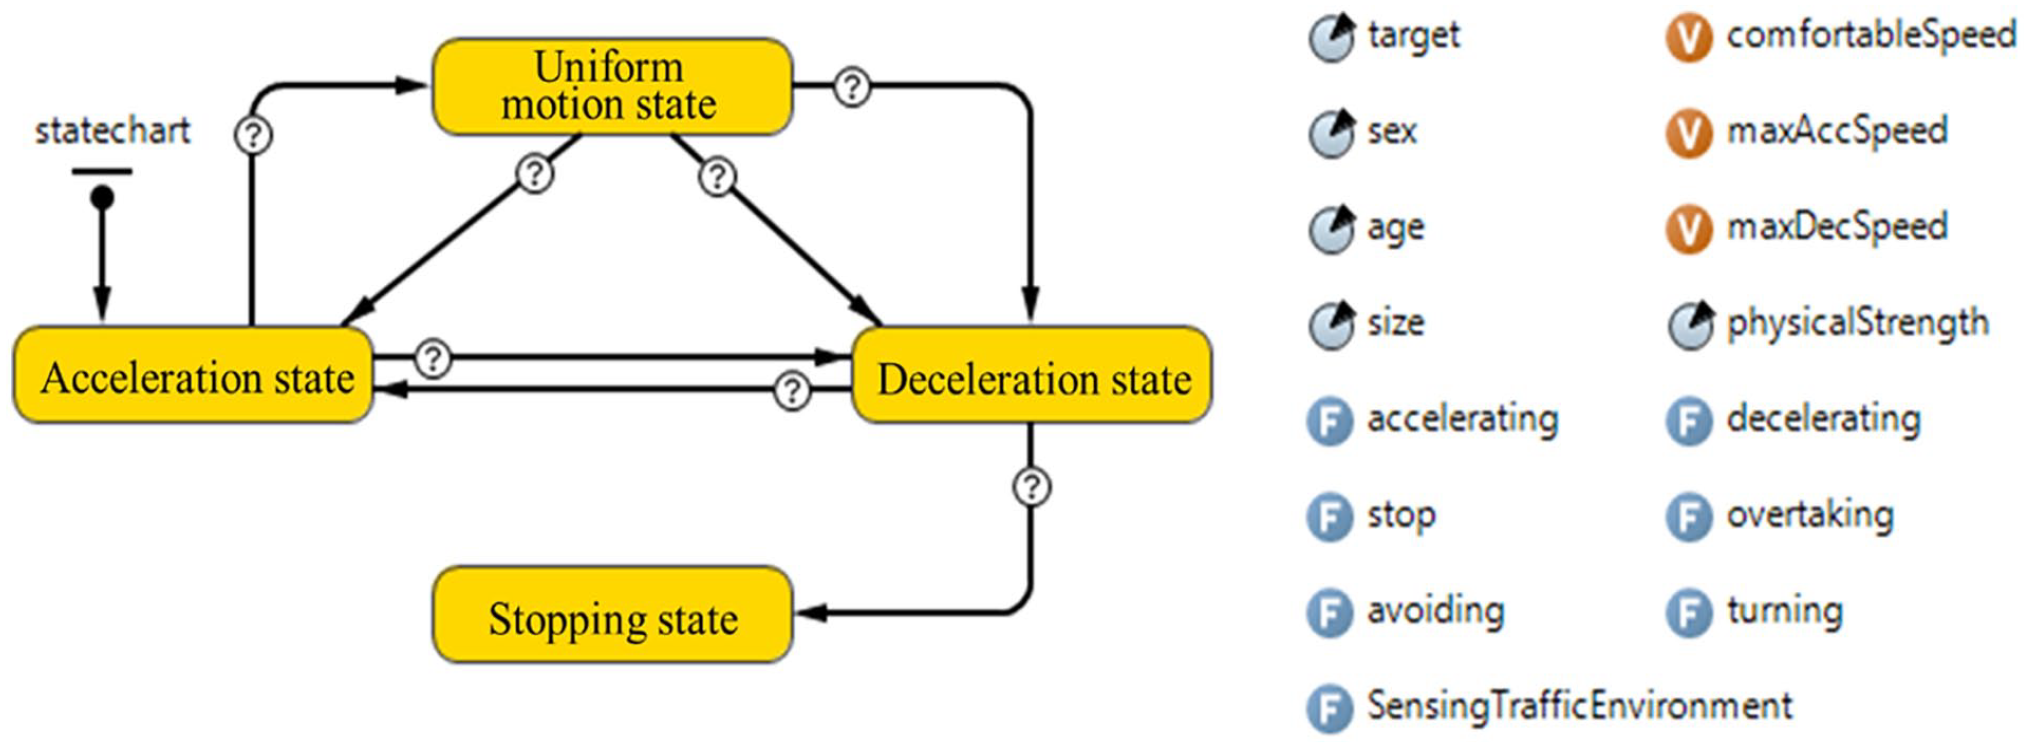
The state chart and attribute of agent.
Building a process model
The behavior module in the pedestrian flow database is used to establish the flow chart of bicycle and pedestrian flows. The bike sharing data and field survey data are combined to collectively set the parameters of the speed of cyclists and pedestrians. Then, the travelers are assigned into the specific non-motorized transport network according to their generated position, driving direction and other attributes. The state of the traffic network can be automatically updated when the time passing. And both cyclists and pedestrians in the traffic environment can perceive the changes of traffic network and then take actions accordingly and immediately. An individual’s behavior, in turn, also influences the operation state of the non-motorized traffic. Finally, the macro parameters (e.g., road traffic and road average speed) and micro parameters (e.g., acceleration and speed of each individual in the network at every moment) of the non-motorized traffic are obtained from the simulation by agent-based modeling. The simulated information is then stored in a database according to a specific data structure for subsequent evaluation analysis.
Additionally, the animations of simulation process and statistic information such as the number of vehicles, average road density, and driving distance can be also analyzed and outputted accordingly.
Evaluation on the effect of dedicated bicycle lanes installation
In this study, two commonly used traffic indicators were selected to assess the enhanced effects of the installation of dedicated bicycle lanes on the non-motorized traffic, which are defined as follows.
(1) Travel time
Travel time is the time spent by travelers in the process of traveling, and it is calculated by the formula in equation (1). The shorter the travel time, the larger the traffic capacity of the road section, indicating a better traffic efficiency. Minimizing the travel time is also one of the travelers’ spontaneous demands.

where
(2) Traffic density
In this study, traffic density refers to the number of moved bicycles/pedestrians in all sections of the road per unit length at a given moment. It is calculated by equation (2). Traffic density is usually used to indicate the volume of an urban road. The changes in traffic density are observed to determine whether the traffic situation has improved.

where K denotes the traffic density at a given moment (vehicles/km or person/km), N represents the number of moved bicycles or pedestrians, and L denotes the length of the observation road section (km).
Simulation results and analysis
In this study, two scenarios are simulated as explained in the section ‘Model building’. One is the base scenario, where pedestrians and bicycles are mixed randomly. The other one is the scenario to simulate the condition of adding a bicycle lane where bicycles are separated from pedestrians and are given priority to enter the bicycle area (Cohen and Kelly, 1990). The reason we choose to simulate the extension of bike lanes in this main road is because the priority of bike infrastructure such as a bike lane can straightforwardly encourage cycling mobility in big cities (Lu et al., 2018). However, cyclists will shift into the space of the walkway when bike flows are hindered by auto vehicles while pedestrians will still mainly move by walking on the walkway. When the walkway is also over-crowded, they will enter into the bicycle lane as well. Figure 10 shows the interface of the simulation model in AnyLogic platform, indicating that the addition of the cycling lane has significantly improved the traffic order and potentially improved the traffic safety. Before carrying out the simulation, we have measured the width of different lanes (i.e., mixed lanes, walkways, and bicycle lanes) in Keyuan Avenue on-site as these are important parameters of the modeling. The mixed lane, walkway, and bicycle lane are 10 m, 6 m, and 4 m wide on average, respectively. But it is noted that these parameters can be adjusted when we do the simulation according to the real condition. In light of this, the simulation results will be different.
The running interface of model.
Several simulations were carried out for both scenarios. The results reveal that the average traffic density of the simulation area is reduced by approximately 6% in the scenario with additional dedicated bicycle lanes. The decrease of traffic density reduces the probability of collision between bicycles and pedestrians, which improves the safety of the non-motorized transport system to a certain extent. Meanwhile, the efficiency of the non-motorized transport system has also been enhanced. Figure 11 shows the travel time curves of pedestrians/cyclists in the two simulated scenarios. In view of the great differences in the speed between walking and cycling, the travel time of cyclists is much shorter than that of pedestrians for the same distance, thereby indicating the bimodal shape of the curves. It is also worth to note that the travel time curve of the second scenario moved left slightly as a whole. In other words, the travel time of both cyclists and pedestrians has been reduced simultaneously after adding the dedicated bicycle lanes. In particular, the travel time of long-distance trips decreases more significantly than those of short-distance trips when dedicated bicycle lanes are introduced.
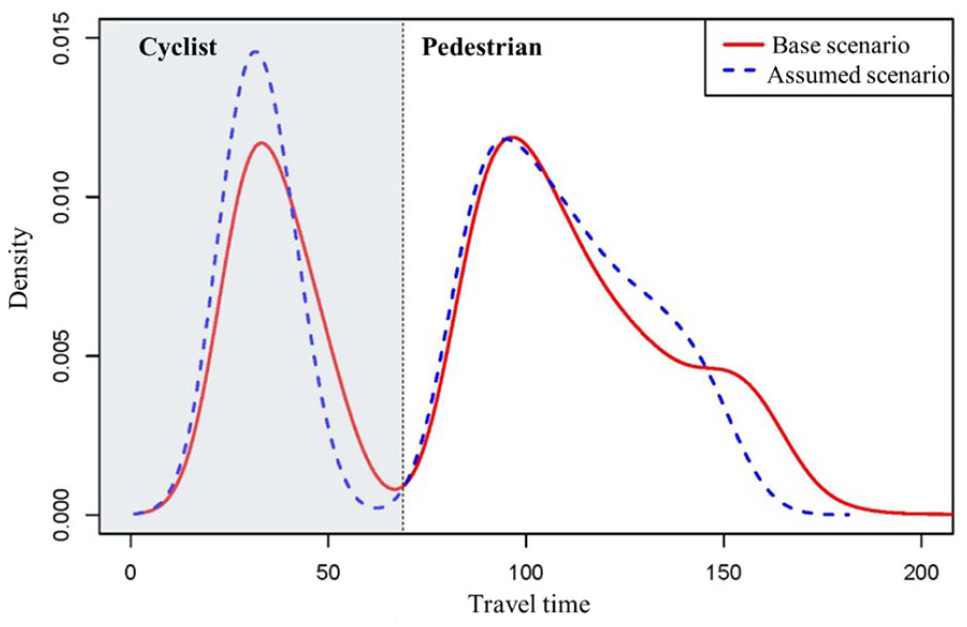
The distribution of travel time.
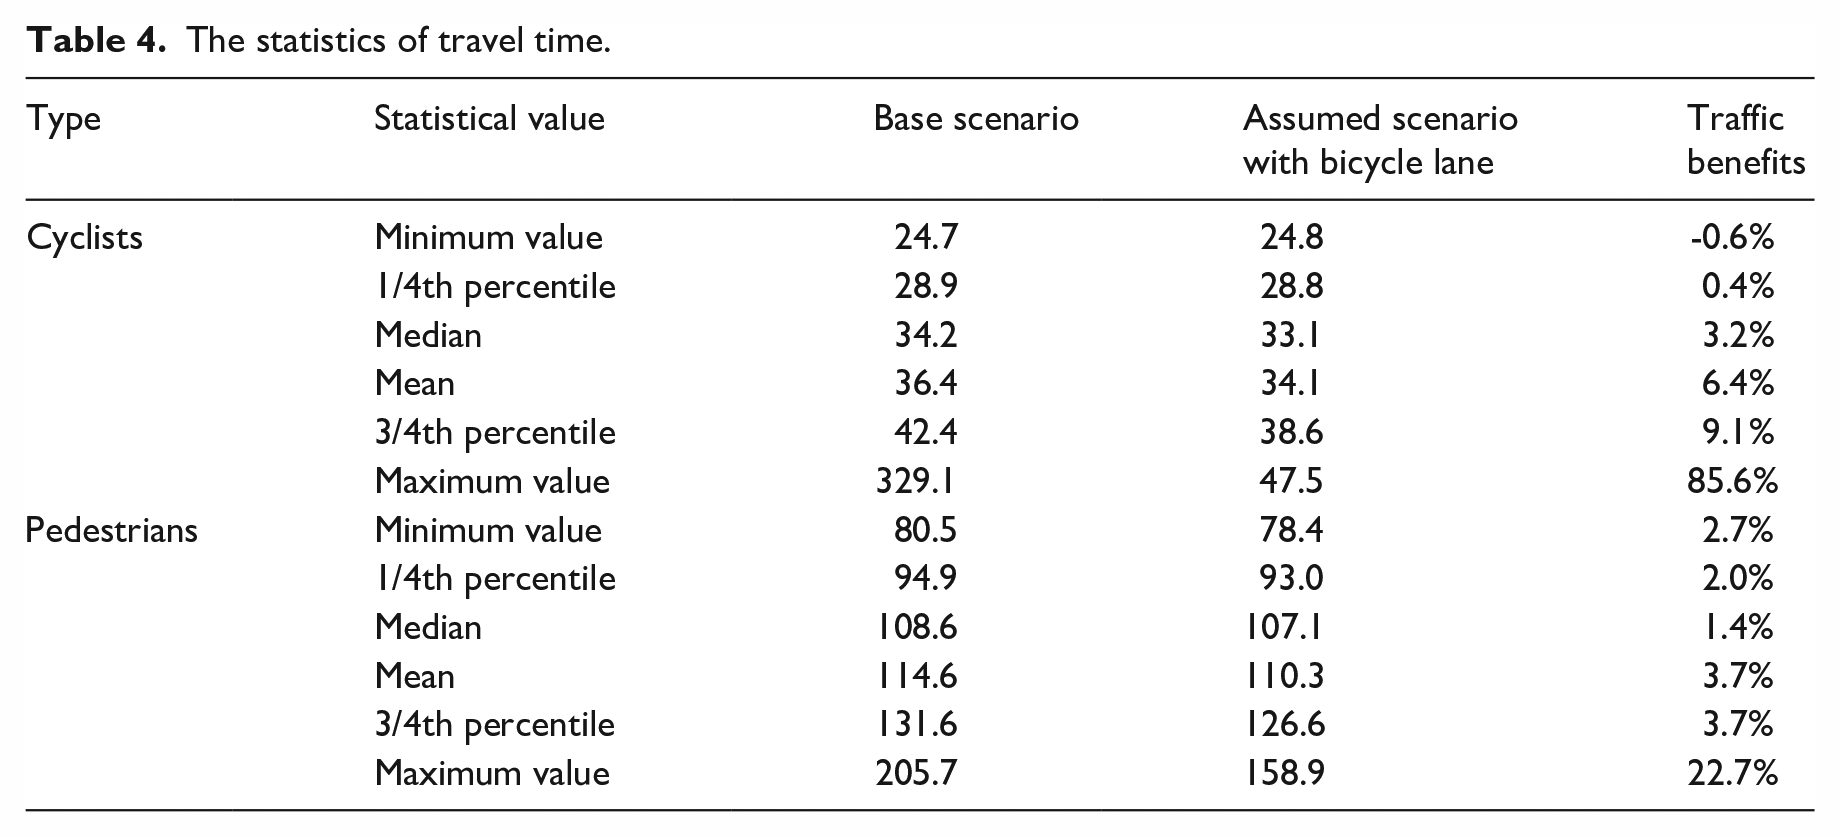
The statistics of travel time of two scenarios are shown in Table 4. The median travel time of cyclists and pedestrians decreases by 3.2% and 1.4%, respectively. This is probably because the setting of bike lanes is not always effective. For example, the change of travel time could be slight when the non-motorized traffic volume is low. However, when the non-motorized lanes are over-congested, the supplementary bicycle lanes can play a vital role in maintaining traffic sequences and enable individuals to pass quickly, otherwise they would be obstructed in the system for a longer time. This explanation can be validated by the statistics of three-quarter quartile and maximum value in Table 4, which shows a decrease of 9.1% (85.6%) and 3.7% (22.7%) for the three-quarter quartile (maximum value) of travel time for cyclists and pedestrians after adding the bicycle lanes, respectively.
The statistics of travel time.
Conclusion
Based on the cycling characteristics and corridor identification of bike sharing in the Hi-tech Park area of Shenzhen, China, the agent-based modeling approach is adopted to simulate the travelers’ behaviors in non-motorized traffic, followed by evaluating the effectiveness of adding bicycle lanes into the current non-motorized transport system. The proposed new approach in this study, which combines the agent-based modeling technique and social force model framework on the basis of big data of bike sharing, enables an advanced simulation of the non-motorized travel behaviors. Therefore, the information exchanges among different individuals as well as the interactions between individuals and the simulated environment can be achieved more clearly. Using the framework of the social force model, it further shows an advantage over the traditional simulation models due to its closeness to the real life (Kitchin, 2014; Kitchin et al., 2017).
The major findings of this study are summarized as follows: (1) the peak of cycling appears during the rush hours of commuting, and the demand for cycling on weekdays is about 2.5 times that on weekends; (2) the distribution of corridors is highly matched with the roads near subway stations; (3) the simulation results show that the efficiency and traffic effectiveness of the non-motorized transport system can be improved by deploying bicycle lanes along the road, which positively guide the separations of pedestrian and bicycle flows; (4) the addition of cycle lanes without increasing the width of urban road can result in an overall reduction in the traffic density by approximately 6%, saving cyclists’ travel time of 6.4% on average, and saving pedestrians a relatively smaller amount of travel time of 3.7%.
The new approach of combing big data of bike sharing and agent-based modeling technique developed in this paper is an exploratory attempt to simulate and evaluate the non-motorized traffic. This research may contribute to development of urban cycling under the efforts by local government and operators. First, the government can apply the proposed approach to dynamically simulate the bicycle volume and guide the traffic accordingly either at neighborhood level or at regional level. Second, the dynamic simulation can provide local government with targeted policy on planning the cycling infrastructure, such as bikeway, cycling direction board, cycling signal lamp, green shade for cycling, etc. Third, the operators can also adjust their scheme of allocating the bikes dynamically and spatially, which makes the operation of bikeshare more efficient and profitable.
However, some drawbacks still exist. First, the non-motorized traffic environment is simply set and more conditions could be added. Particularly, the setting of parameter in the simulation model requires more prior experience, which will make the simulation results more objective and accurate. Second, the interaction between non-motorized and motorized traffic has not been considered in the modeling. Future research on these directions can be fulfilled, thereby providing effective technical approaches for the improvement of the non-motorized transport system and supporting basis for the urban management on non-motorized traffic.
Footnotes
Declaration of conflicting interests
The author(s) declared no potential conflicts of interest with respect to the research, authorship, and/or publication of this article.
Funding
The author(s) disclosed receipt of the following financial support for the research, authorship, and/or publication of this article: This study is supported by the Humanities and Social Science Key Research Base of Education Department in Sichuan Province - Resource-based City Development Research Center (四川省教育厅人文社科重点研究基地-资源型城市发展研究中心, ZYZX-ZD-2101) as well as the fund of Beijing Municipal Education Commission Social Science Project (No.200B047000514122630).