
Abstract
Inter-city population movement and attractiveness are two crucial representations for their examination. Measurement of coordination and structural optimization within urban integration zones are vital subjects in the context of regional integration. In order to measure the degree of coordination between population flow and attractiveness among cities in urban integration areas, this paper first combines the gravitational force model and the coupling coordination degree model; it then uses the urban integration areas around Wuhan as an example and analyzes the population flow and coordination between Wuhan and the neighboring cities based on the multi-year Unicom signaling data. In a targeted manner, it offers the optimization plan for each city based on the amount of cooperation. The results show that: (1) there is a significant difference between Wuhan and its neighboring cities in terms of population flow intensity, and (2) Wuhan’s urban integration areas’ overall coordination of population flow is unsatisfactory, with 23.08%, 46.15%, and 30.77% of the total number of cities demonstrating high, medium, and low coordination of population flow and urban attractiveness respectively. Based on the degree of flow coordination, four different types of development methods are provided to meet the development needs of various districts: all-around deep and coordinated development, increased flow intensity, increased attraction strength, and increased flow intensity and attraction strength. This research will help advance research on the coordination level of urban integration areas, utilize big data in territorial spatial planning systems, and support strategic decision-making in metropolitan areas.
Introduction
In the next phase of urbanization development, China will promote coordinated regional development and characteristic growth of large, medium, and small cities and towns based on city clusters and metropolitan areas. The urban integration area serves as the foundation and central hub for the integrated construction of the metropolitan area and is a typical area of coordinated regional development. Urban integration is a phenomenon and a process that aims to establish regional integration and coordination. It typically encompasses characteristics like geographic proximity, strong economic links, balanced service distribution, and fluid factor flow (Zeng et al., 2013). However, there are problems with the regional labor division, the industrial structure layout, the lack of infrastructure network connection, and the deteriorating ecological environment quality in the process of regional urban integration development and urbanization (Li et al., 2010), which have given rise to regional inconsistencies. Major city clusters and metropolitan areas have proposed policies for the coordinated and integrated growth of nearby cities ever since China’s 14th Five-Year Plan. One such proposal comes from the Wuhan metropolitan area, which calls for accelerating the development of the Wuhan metropolitan area, highlighting Wuhan’s central leadership role, and actively pursuing urban integration and synergistic development with Wuhan. Expand the Wuhan metropolitan area’s integrated growth.
Population spatial movement is the most visible indicator of regional spatial linkages (Dong et al., 2014), and the degree to which it coordinates with inter-city attractiveness might indicate the stage of development of regional urban integration. Inter-city links between populations and cities are growing closer and more common as China’s urbanization process continues to pick up speed. Population flow is a crucial starting point for studying and managing regional town spatial systems because it may intuitively and accurately reflect inter-city linkages. The two most frequently used indicators in studies examining the degree of coordinated development of things are coupling degree and coordination degree. Coupling degree is the dynamic correlation relationship between two or more systems interacting and influencing each other to achieve coordinated development. Coordination degree refers to the size of the degree of benign coupling in the coupled interaction relationship, which can reflect good or bad coordination status. Coupling coordination degree combines the traits of two indicators, coupling degree and coordination degree, which can reflect both whether the systems have a good level of coordination and the relationship of interaction between the systems. This indicator is increasingly used to gauge the level of interaction between two or more systems as well as their mutual coordination and cooperation (Zhang et al., 2016). Because of this, it is possible to effectively encourage the coordinated development of urban integration areas by assessing the level of coordination of those areas from the perspective of population movement and proposing targeted synergistic strategies. This is advantageous for optimizing the internal structure of metropolitan areas and realizing high-quality regional development as a whole (Franco and Marmelo, 2014; Shen et al., 2021; Thakuriah et al., 2017).
This paper uses the Wuhan metropolitan area, a typical urban integration region in central China, as the research object. Based on data from Unicom cell phone signaling, this paper first analyzes the population flow between Wuhan and its neighboring cities (the term “population flow” in this paper refers to the number of people with Wuhan as the final destination and other cities in the metropolitan area as the departure point in a certain time period). The method for measuring the degree of coordination of urban integration areas is then proposed. Finally, we make development recommendations for cities in the region in conjunction with the degree of population flow coordination.
Review
As a result of globalization and information technology, the movement of people, goods, and information between cities is increasingly spanning established administrative borders and converging with surrounding regions (Ye et al., 2017; Zeng et al., 2013). The need for “integrated” development, or “urban integration” between cities, is become more and more important within the region. According to Zeng et al. (2013), “Urban Integration” is essentially the synergistic development of economic, social, environmental, and spatial elements between cities. The coordinated development of various elements is a key sign of the coordinated development of urban integration areas and a successful way to raise the region’s overall competitiveness.
In recent years, a large number of academics have studied regional development from the theoretical research, data analysis, and measurement perspectives on the current situation, functional mechanism, and coordination level measurement of urban integration development. However, the coupling and coordination between regional flow factors and urban gravity have received less attention. At the theoretical research level, researchers such as Meijers et al. (2014), Kavanoz and Erdem (2019), Kaisto (2017), and others have elaborated on the development status of urban integration from the perspective of twin cities or sister cities; researchers such as Hartt and Warkentin (2017), Arndt et al. (2000), and others have actively carried out research on urban integration development circumstances and dynamical mechanisms of urban integration; and researchers such as Morrison and Dowell (2013), Ortega et al. (2012), and others covered the functional complementarity between cities in urban integration areas, functional features analysis, and other aspects. In terms of data analysis and technology, the degree of coordinated development among cities reflects the degree of regional urban integration development. Numerous academics have already measured the level of coordinated development of cities in terms of their spatial, demographic, transportation, informational, and industrial structures and have produced specific research findings. For example, Shen et al. (2021) use various “factor flow” measures to analyze the level of coordination within urban networks in urban integration areas. Zhang and Tang (2022) and Li and Chen (2016) assessed and measured the urban integration development of Wuhan city circle and Wenling city urban integration area in four dimensions of spatial connection, population flow, market integration, and industrial structure, as well as two dimensions of job-dwelling relationship and attractiveness intensity of public service center. Relevant research on the measurement of urban integration, however, focuses on a single “factor flow” or the link between each “factor flow” rather than the coupling and coordination between each “component flow” and the city. The studies, however, pay little attention to how each “component flow” is coupled and coordinated with the overall size of the city, and they completely ignore how the city itself affects the movement of factors between cities.
Numerous urban integration studies have used “people flow” as the main entry point: Shen et al. (2021) and others integrated people flow and other factor flow measures to evaluate the degree of inter-city connection and coordination level in urban integration areas, and Li and Chen (2016) and others used the “people flow” information identified by cell phone signaling data to determine the basic conditions and future development trend of urban integration. With the advantages of a large sample size, accurate data, and strong timeliness, Internet resources represented by cell phone signaling data (Becker et al., 2011; Kang et al., 2012) and Tencent Big Data (Christian et al., 2011) have gradually become a new direction for regional and urban research in recent years. Among them, cell phone signaling data, as a new form of data to measure the human flow connection between cities, can directly reflect the human flow connection between cities by multiple transportation modes than the previous method of estimating the human flow connection between cities by obtaining the number of passenger trips by air, rail, and road, and has the characteristics of full coverage between urban and rural areas and continuous recording of user spatial location, and is also significantly better than other traditional data in terms of accuracy (Wang et al., 2018).
Based on this, this paper proposes a method to measure the coordination between “people flow” and the size of each city in the urban integration area based on the population flow data of Unicom cell phone signaling. Through this method, we further analyze the development level of each city in the urban integration area and propose optimization strategies. This paper aims to provide new perspectives and methods for urban integration research, as well as a reference basis for the optimization of urban systems, future development directions, and planning ideas for each city.
Methodology
Gravity model: city attraction strength calculation
Urban gravity is commonly referred to as the objective tightness of connections between cities. The initial introduction of gravity models into economic geography research was the Reilly formula in the 1930s, which became the most primitive urban gravity model. Such models have a wide range of applications and have been widely used in economic, transportation, and spatial research (Song et al., 2019; Wu C et al., 2021a). The specific formulas are as follows.
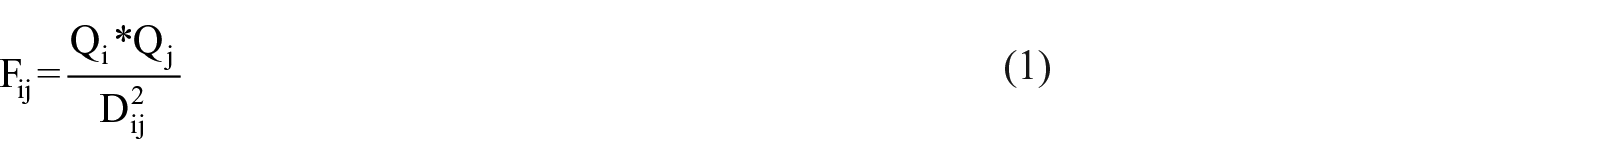
In the formula:
Since the specific determination index of urban quality
In the formula:
Coupled coordination degree model: coordination analysis of population flow and attraction strength
(1) Coupling degree of population flow intensity and objective attraction strength of cities.
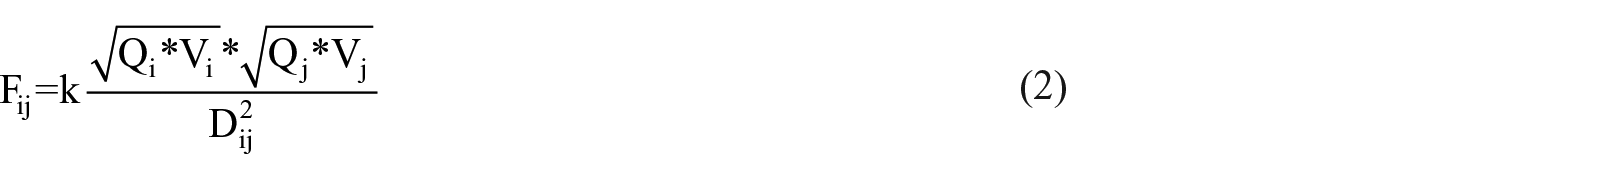
The process of interaction and game between the intensity of population flow and the strength of objective attraction of cities is the process of gradual and coordinated development of regional population urban integration. First, cities with a high degree of economic development and a large total population are more likely to attract the inflow of foreign population; second, the intensity of large-scale urban population flow provides cities with a large amount of labor force and a basis for development, but too much population inflow tends to create a labor surplus and affect the resource allocation of the inflowing places. Therefore, there is a mutually reinforcing and constraining relationship between the intensity of population movement between cities and the objective attraction strength based on the gravitational force of cities. The coupling degree measurement model of population flow intensity and objective attraction strength of cities is constructed based on the reference of related research results (Song, 2021) and combined with the reality of this study, and the expression of coupling degree
In the formula:
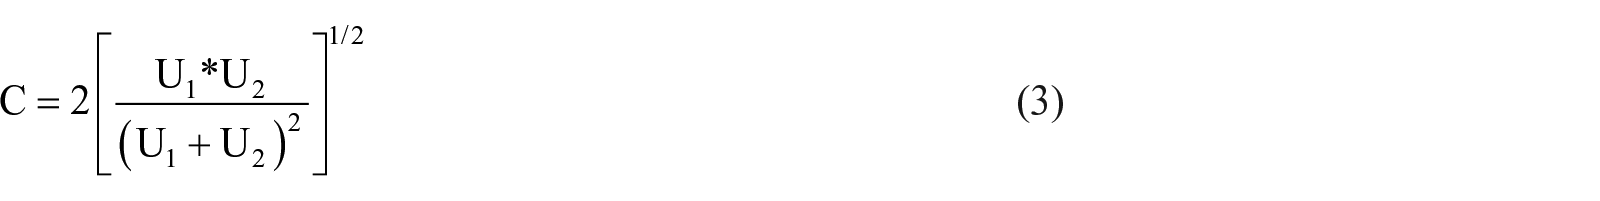
(2) Some studies (Wang and Tang, 2018; Yan and Zhang, 2020) pointed out that although the coupling index can characterize the degree of interaction between the intensity of population mobility and the objective attractiveness of a city, in some cases it cannot accurately reflect the overall coordination effect of the intensity of population mobility and attractiveness of a city, i.e., it cannot characterize whether the two are mutually reinforcing at a high level or constraining at a low level. Therefore, this paper introduces the coupling coordination index to construct a coupling coordination model between population flow intensity and objective attractiveness of cities, which is calculated as follows:


In the formula:
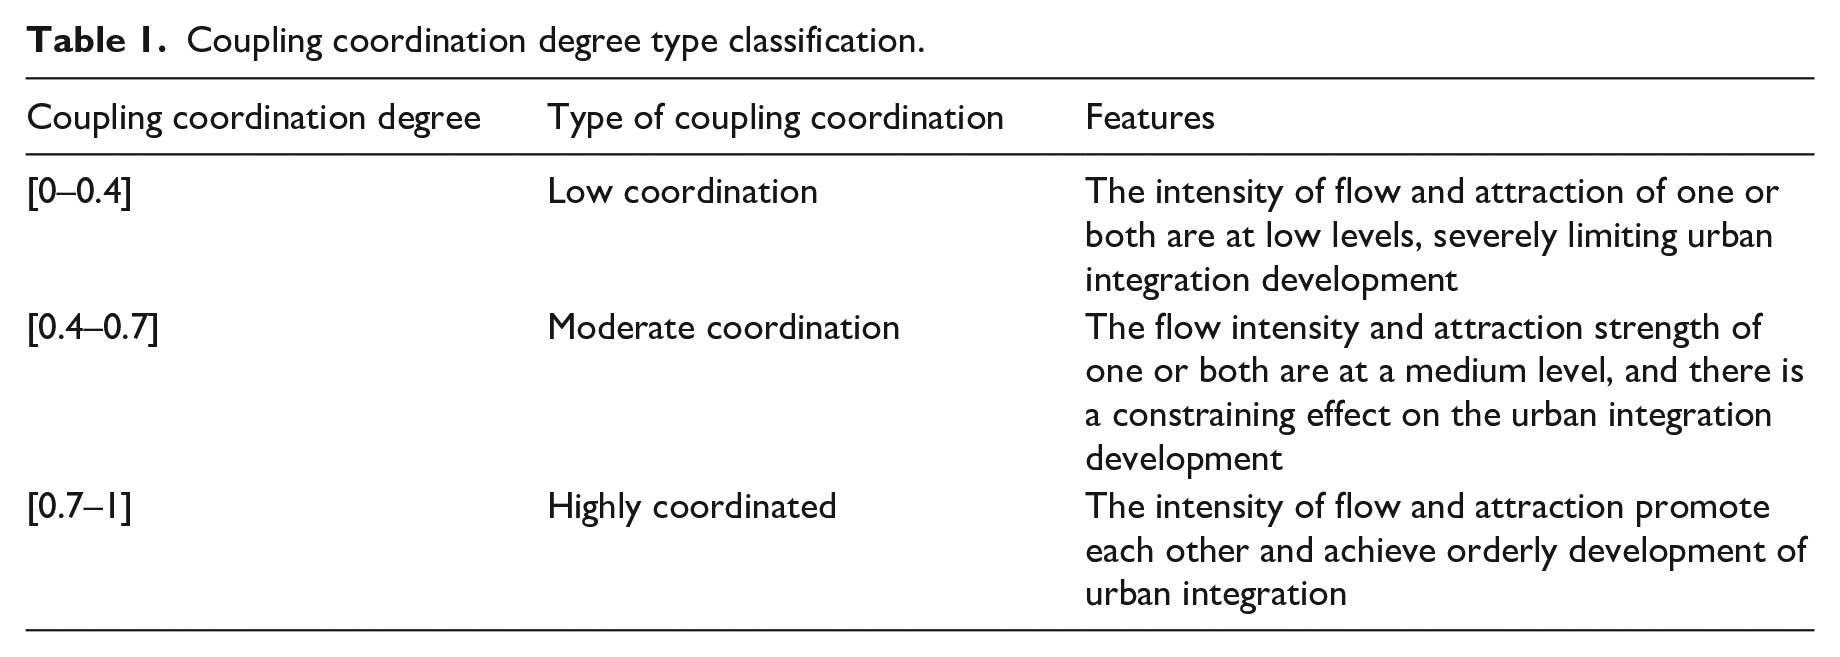
Coupling coordination degree type classification.
Cities type determination and optimization strategies
The coupling coordination degree model is used to measure the coordination level of the number of mobile population from each district within the Wuhan metropolitan area to Wuhan and the corresponding objective attractiveness value, thus reflecting the overall urban integration coordination degree of the Wuhan metropolitan area. The cities were first classified into high coordination, medium coordination, and low coordination according to the results of the coupling coordination degree (Song, 2021), indicating whether the two are mutually reinforcing at a high level or constraining each other at a low level (Wang et al., 2011).
According to related research results (Yan and Zhang, 2020), when the coordination type is low coordination, it indicates that the overall synergy between actual population flow and attractiveness is low, and there is one party that constrains the development of the other party, generally in three ways: first, the overall level of both urban population flow and attractiveness is low; second, the level of urban population flow is high, while the level of urban attractiveness is low; third, the level of urban population flow is low, while the level of urban attractiveness is higher. Medium coordination indicates that the overall synergy between urban population flow and attractiveness strength is at a medium level, but there is still a development shortcoming in one aspect. High coordination means that the overall synergistic effect of both urban population flow and attractiveness is extremely high, the level of urban integration development is mature, and the intensity of flow and attractiveness both promote each other’s coordinated development.
Therefore, in order to investigate the reasons for the low level of urban integration coordination in metropolitan areas, a comparative analysis of population flow intensity and attractiveness was further conducted for the medium and low coordination categories (Yan and Zhang, 2020): If the population flow > objective attractiveness, the city’s objective attractiveness lags behind the actual population flow, and the objective attractiveness of the city constrains the further development of the city to a certain extent; if the population flow < objective attractiveness, the city’s mobility intensity constrains the city, i.e., the actual population flow lags behind the objective attractiveness of the city, and the actual population flow constrains the further development of the city to a certain extent. If population mobility ≈ objective attractiveness and both values are low, then the mobility intensity and attractiveness constraint type, i.e., the actual mobility intensity and objective attractiveness of the city, both constrain the further development of the city to a certain extent. Among them, the attractiveness-constrained type indicates that the economic development level and population size of the city still need to be improved; the flow intensity-constrained type indicates that the scale of population flow has not yet reached the objective expectation and needs to be targeted to improve the number of mobile population; the flow intensity and attractiveness-constrained type indicates that the values of city attractiveness and the tendency intensity of population flow are similar and both are at a low level, and there is an urgent need to improve both aspects simultaneously.
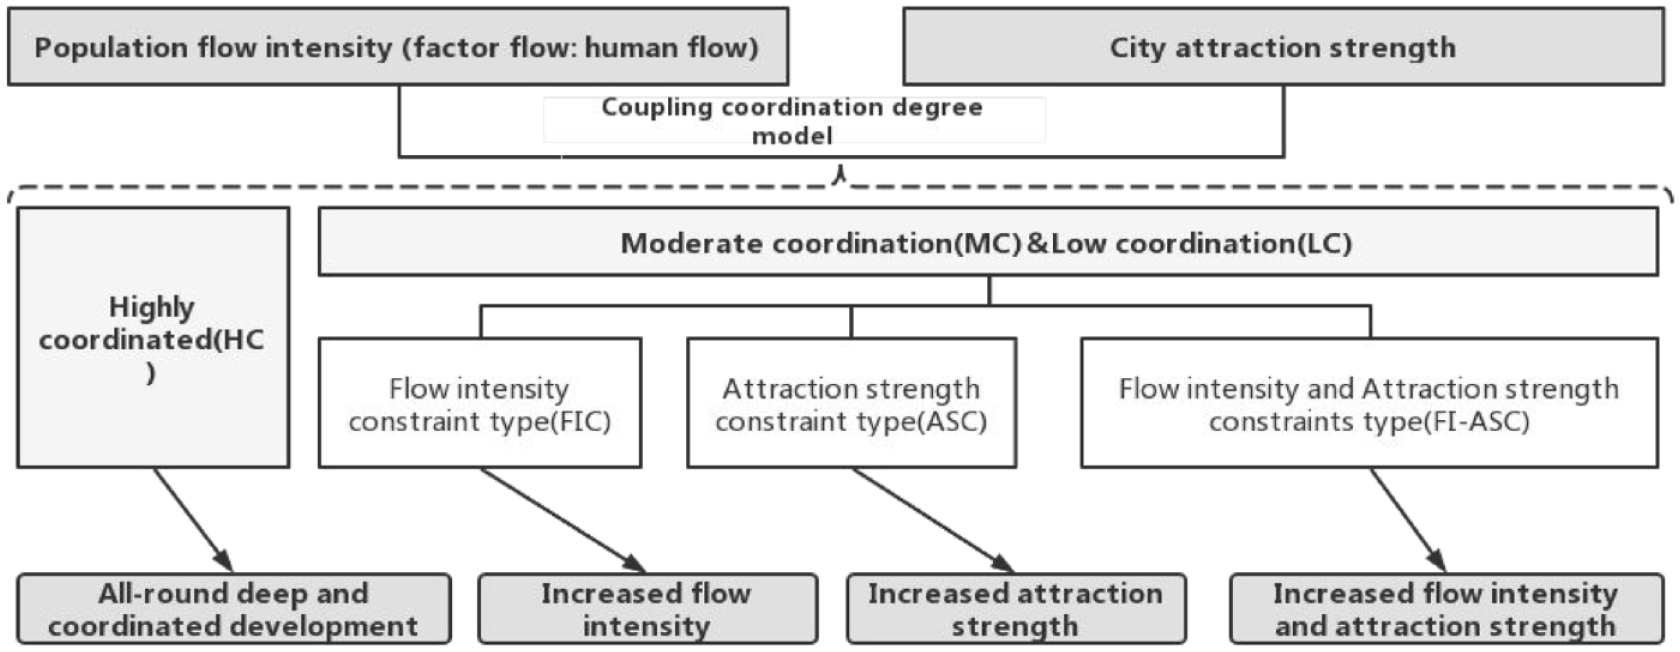
The appropriate urban integration development techniques are suggested for the existing condition and development needs of various cities in terms of flow intensity and attraction strength, integrating the aforementioned classification results and associated urban integration development research (Figure 1). In the development of urban integration areas, the urban integration level of high coordination cities are more advanced, and they must use population urban integration as the basis to realize the all-round deep coordination of urban integration, and adopt the all-round deep coordination strategy; the flow intensity-constrained cities in medium and low coordination cities must increase population flow intensity with Wuhan, and adopt the flow intensity enhancement strategy; the attraction intensity-constrained cities in medium and low coordination cities are still in the early stage of urban integration development, so they adopt the flow intensity and attraction intensity enhancement strategy.
District type discriminations.
Experimental study
Study area overview
This paper takes Wuhan metropolitan area as the research object (Figure 2), i.e., the urban cluster with the Wuhan city center as the center and 80 km as the radius. Wuhan metropolitan area includes a total of 14 districts and counties, including Wuhan city, Ezhou, Huangzhou, Huangshi city, Xiantao, and some streets and towns in Honghu. The metropolitan area has a total area of 20,600 km2, a resident population of 18.07 million as of 2018, and a total GDP of 145 million. 1 Wuhan Metropolitan Area Spatial Strategy and Synergistic Planning (hereinafter referred to as “the Plan”) proposes that the metropolitan area should play the core leading role for Wuhan, and the surrounding cities should actively strive for urban integration and synergy with Wuhan. As the main space for the synergistic development of Wuhan and the surrounding area, Wuhan metropolitan area is the main carrier of the core functions of the national central city and an important growth pole for the development and revitalization of the central region. Wuhan metropolitan area has good transportation location and population advantages, but the internal city structure is yet to be further defined and possesses research significance.
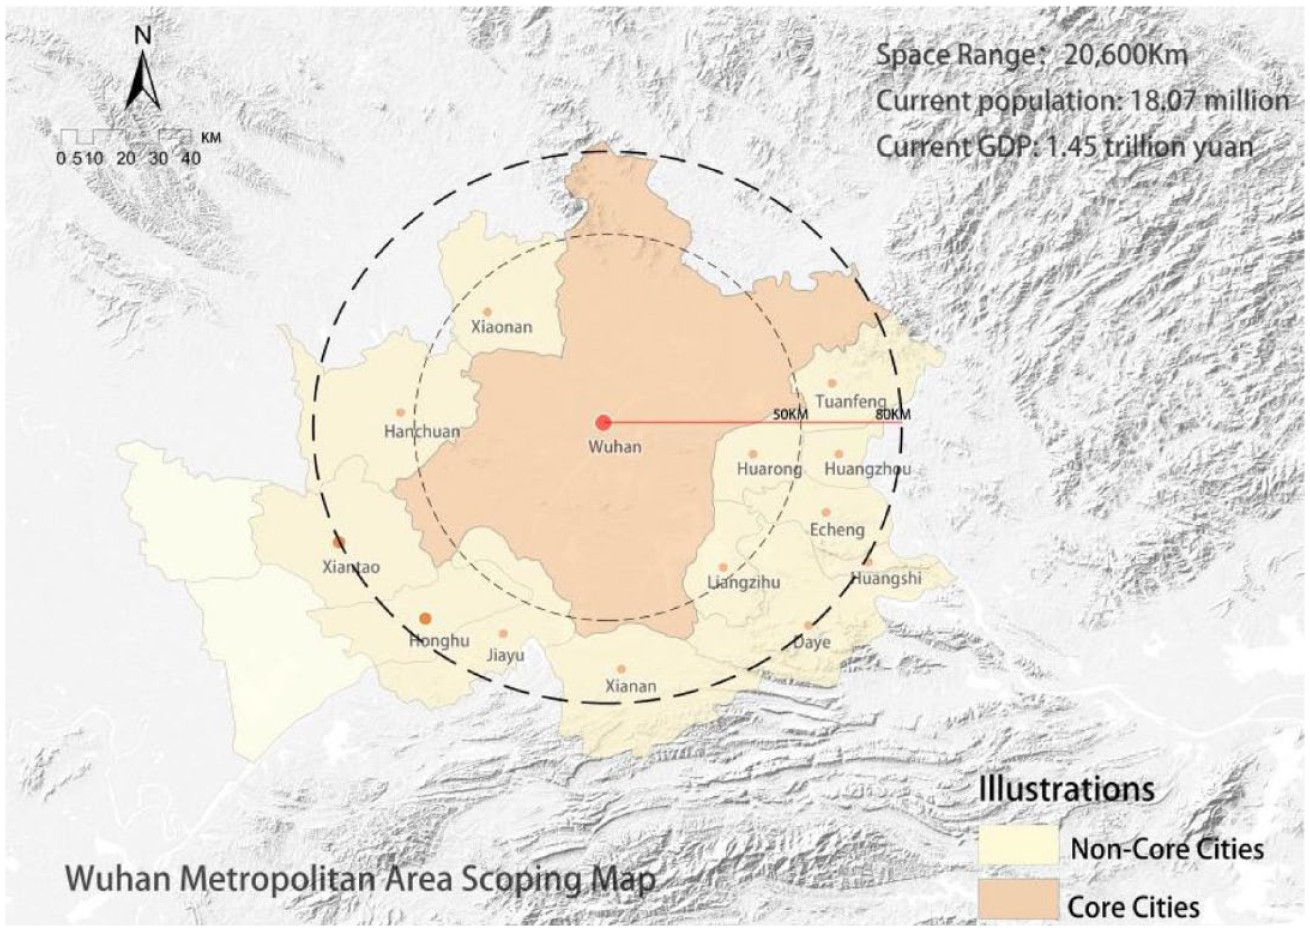
Wuhan metropolitan area scoping map.
Data sources
This paper uses cell phone signaling data processed by Unicom’s Smart Footprint platform. Specifically, travel users are identified in each time period from June 1 to 30, 2017, June 1 to 30, 2019, and June 1 to 30, 2021, with other districts and counties outside the Wuhan metropolitan area as the origin and Wuhan as the final destination, and the number of trips of all users in a certain time period is recorded as the total population movement from that city to Wuhan. This paper finally obtains the one-way population flow quantities from each district and county to Wuhan from June 1 to 30 in each year of 2017, 2019, and 2021 (only the total population flow from each city to Wuhan in a certain time period is included, and no information on the mobile population is included).
In addition, the data of resident population and gross domestic product (GDP) of each county-level city (district) in the Wuhan metropolitan area were calculated based on the statistical yearbooks of previous years (the data of some areas have not yet been published, and the author obtained them based on the data of previous years).
Result
Flow intensity study results
Based on the cell phone signaling data, the total number of people moving from each district to the Wuhan city center over the years was counted (Figure 3). In terms of the number of the mobile population in each district horizontally, the difference between the total mobile population in each district in Wuhan metropolitan area and Wuhan is relatively obvious. Most of the cities have mobile population numbers between 50,000 and 500,000, among which Huarong has the largest mobile population, followed by Xiaonan and Hanchuan, which is basically in line with the judgement of the Plan. The lowest average mobile population is in Honghu, which is relatively far from the central city of Wuhan.
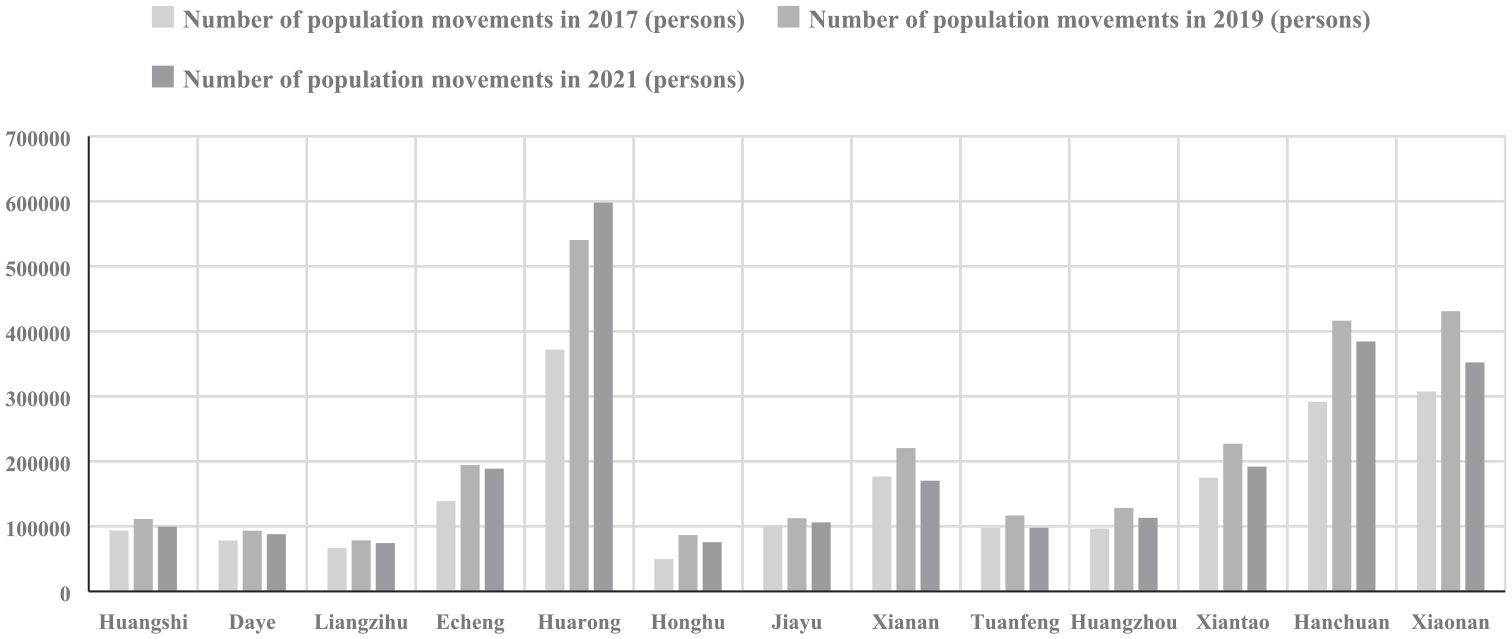
The number of population movements from each district to the central city of Wuhan over the years.
From the trend of changes over the years, the frequency of population movement between counties in the Wuhan metropolitan area and Wuhan basically shows a “rising-declining” trend. From 2017 to 2019, the frequency of population movement from all cities in the Wuhan metropolitan area to Wuhan increased, and the connection between neighboring cities and Wuhan also increased. Among them, the highest increase of 73.94% was observed in Honghu, where the construction of “Wu Xian Hong” urban integration, represented by the manufacturing development corridor, played an important role. Between 2019 and 2021, the frequency of population movement from cities in the Wuhan metropolitan area to Wuhan basically decreased, and the connection between neighboring cities and Wuhan weakened, perhaps due to COVID-19. Among them, Xianan had the highest rate of reduction in population movement frequency at 23%. However, the frequency of population movement in Huarong increased continuously in two time periods, which may be inseparable from the co-city construction of Wuhan and Ezhou represented by the Gedian area.
Flow coordination study results
The most representative data for 2021 were chosen for further examination in this study due to potential variations in each city’s degree of coordination over time. In this paper, the data were quantified and normalized using the Min-Max-Scaler method of great value for the sake of data comparability, and the urban mobile population size and objective gravitational values as well as the coupling coordination values and coupling coordination types for each district are shown in Table 2. Min-Max-Scaler is a linear transformation of the original data. Let minA and maxA be the minimum and maximum values of attribute A, respectively. An original value x of A is mapped to a value x’ in the interval [0,1] by min-max normalization using the formula:

Analysis of flow coordination by district.
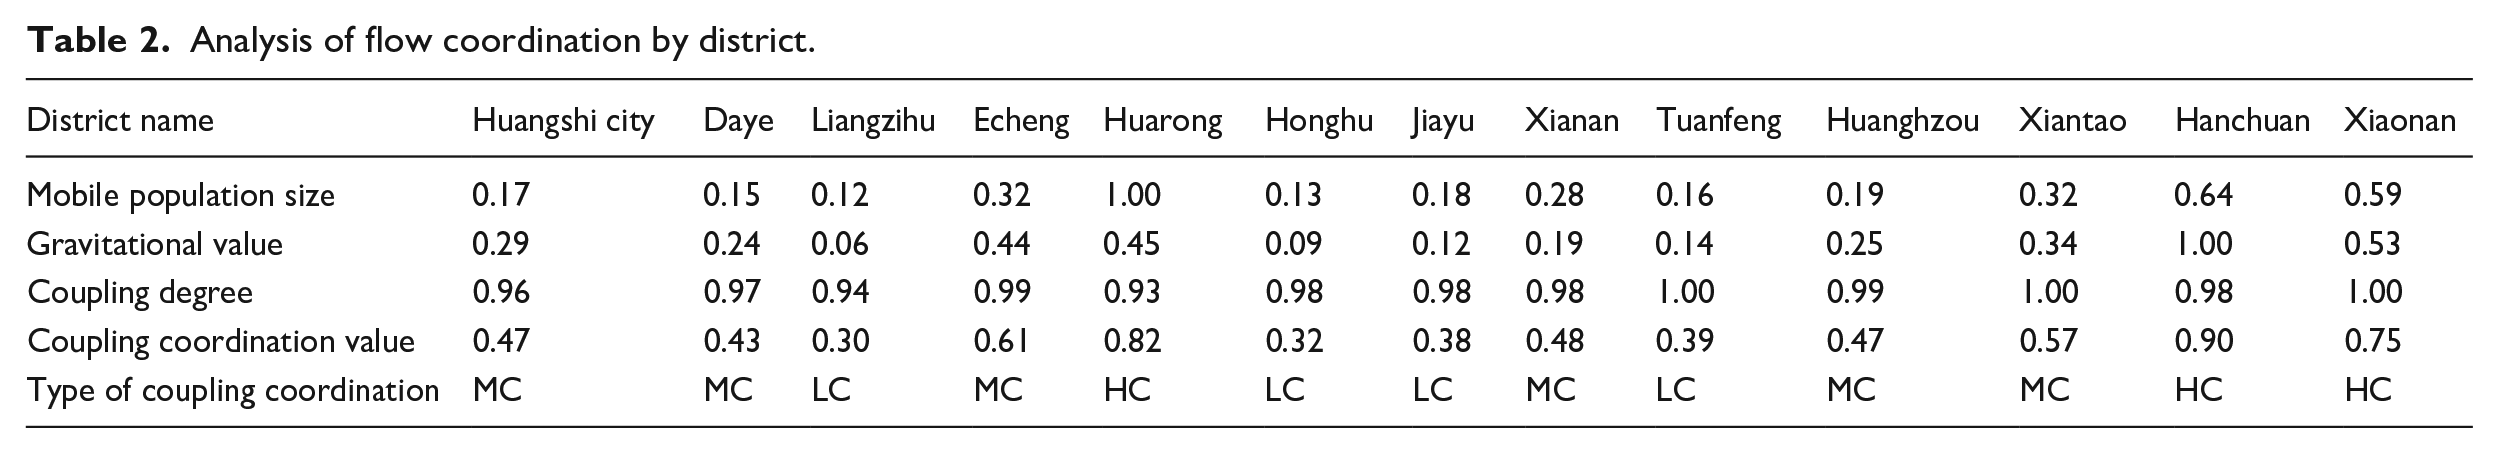
According to the results, there are three hierarchical types of coupling coordination between the actual number of population movements and objective attractiveness values in each district: high coordination, medium coordination, and low coordination. Highly coordinated cities (3) account for 23.08% of the total, moderately coordinated cities (6) account for 46.15% of the total, and lowly coordinated cities (4) account for 30.77% of the total. The coordination types of Wuhan metropolitan area cities are mainly medium and low coordination, and the overall level of urban integration needs to be strengthened.
Further comparative analysis of the population flow intensity and attractiveness of the medium and low coordination types of cities is conducted to explore the reasons for the low level of urbanization coordination in the metropolitan area. (Table 3)
Analysis of population flow and attractiveness in medium and low-coordination cities.
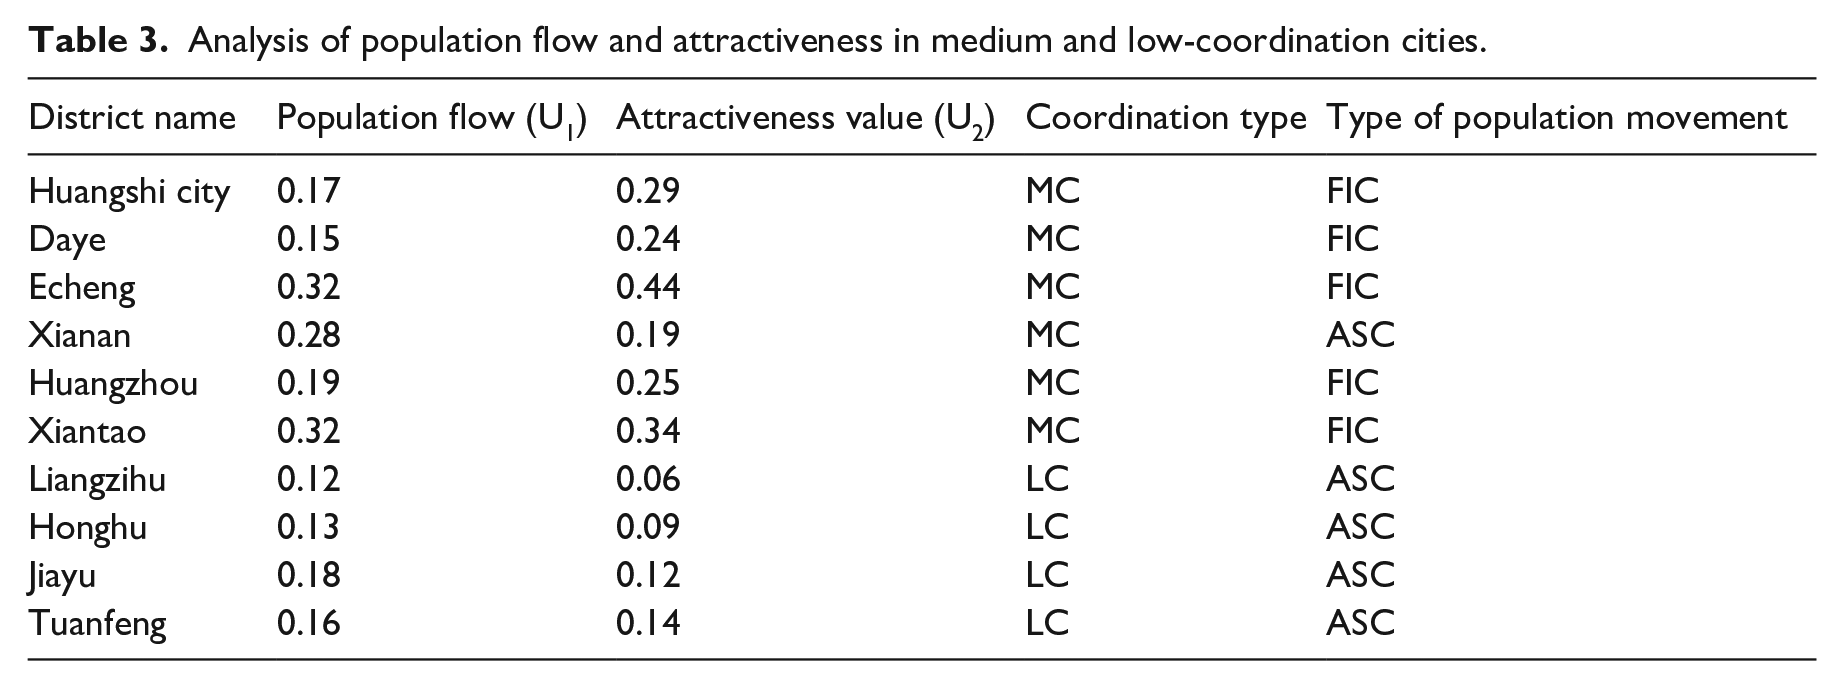
In Wuhan metropolitan area, the medium and low coordination degree counties were further divided into flow intensity constraint type and attraction strength constraint type. Among them, 5 flow intensity-constrained cities are Huangshi, Daye, Echeng, Huangzhou, and Xiantao; 5 attraction intensity-constrained cities are Xianan, Liangzihu, Honghu, Jiayu, and Tuanfeng; the flow intensity-constrained and attraction-intensity-constrained counties account for 50% (5) and 50% (5) of the total number of medium and low coordination counties, respectively. In general, the overall urban integration coordination level of the Wuhan metropolitan area is unsatisfactory. In order to support the balanced and coordinated growth of the metropolitan area, it is vital to propose differentiating development strategies for various types of cities.
Optimization strategies
City optimization classification
This paper analyzes the urban integration development between the central city and the neighboring cities in Wuhan metropolitan area at two levels: in terms of flow intensity, there is a large difference between the flow intensity of each district in the Wuhan metropolitan area and the central city, and the frequency of flow shows a trend of “strengthening-weakening”; in terms of flow coordination, the overall coordination between the flow of each district in Wuhan metropolitan area and the objective economic attraction is not satisfactory. The overall coordination between the population flow and attraction strength of each district in the Wuhan metropolitan area is not satisfactory, with 77% of the cities with medium and low coordination, and there are some cities with restrictive flow intensity and restrictive attraction strength. The overall urban integration level and urban system pattern of the Wuhan metropolitan area need to be optimized.
Based on the analysis results of flow coordination, the coordination types of cities in metropolitan areas are obtained: high coordination type (HC), flow intensity constraint type in medium-low coordination (FIC), attraction intensity constraint type in medium-low coordination (ASC), and flow intensity and attraction intensity constraint type in medium-low coordination (FI-ASC). Different classification strategies are proposed according to the coordination types: all-round deep coordination development strategy, flow intensity enhancement strategy, attraction strength enhancement strategy, and flow intensity and attraction strength enhancement strategy. In Wuhan metropolitan area, three cities, Huarong, Hanchuan, and Xiaonan, are of high coordination type and apply to an all-round deep coordinated development strategy; five cities, Huangshi city, Daye, Echeng, Huangzhou, and Xiantao, are of flow intensity constraint type and apply to flow intensity enhancement strategy; and five cities, Xianan, Liangzihu, Honghu, Jiayu, and Tuanfeng, are of attraction intensity constraint type and apply to attraction intensity enhancement strategy (Figure 4). It should be noted that there is no mobility and attraction constraint type in Wuhan metropolitan area due to the uniqueness of the selected area. The mobility and attraction constraint type is an explicit type in this study methodology, so the optimization strategies for mobility and attraction constraint cities are also briefly explained in the strategy proposal section below.
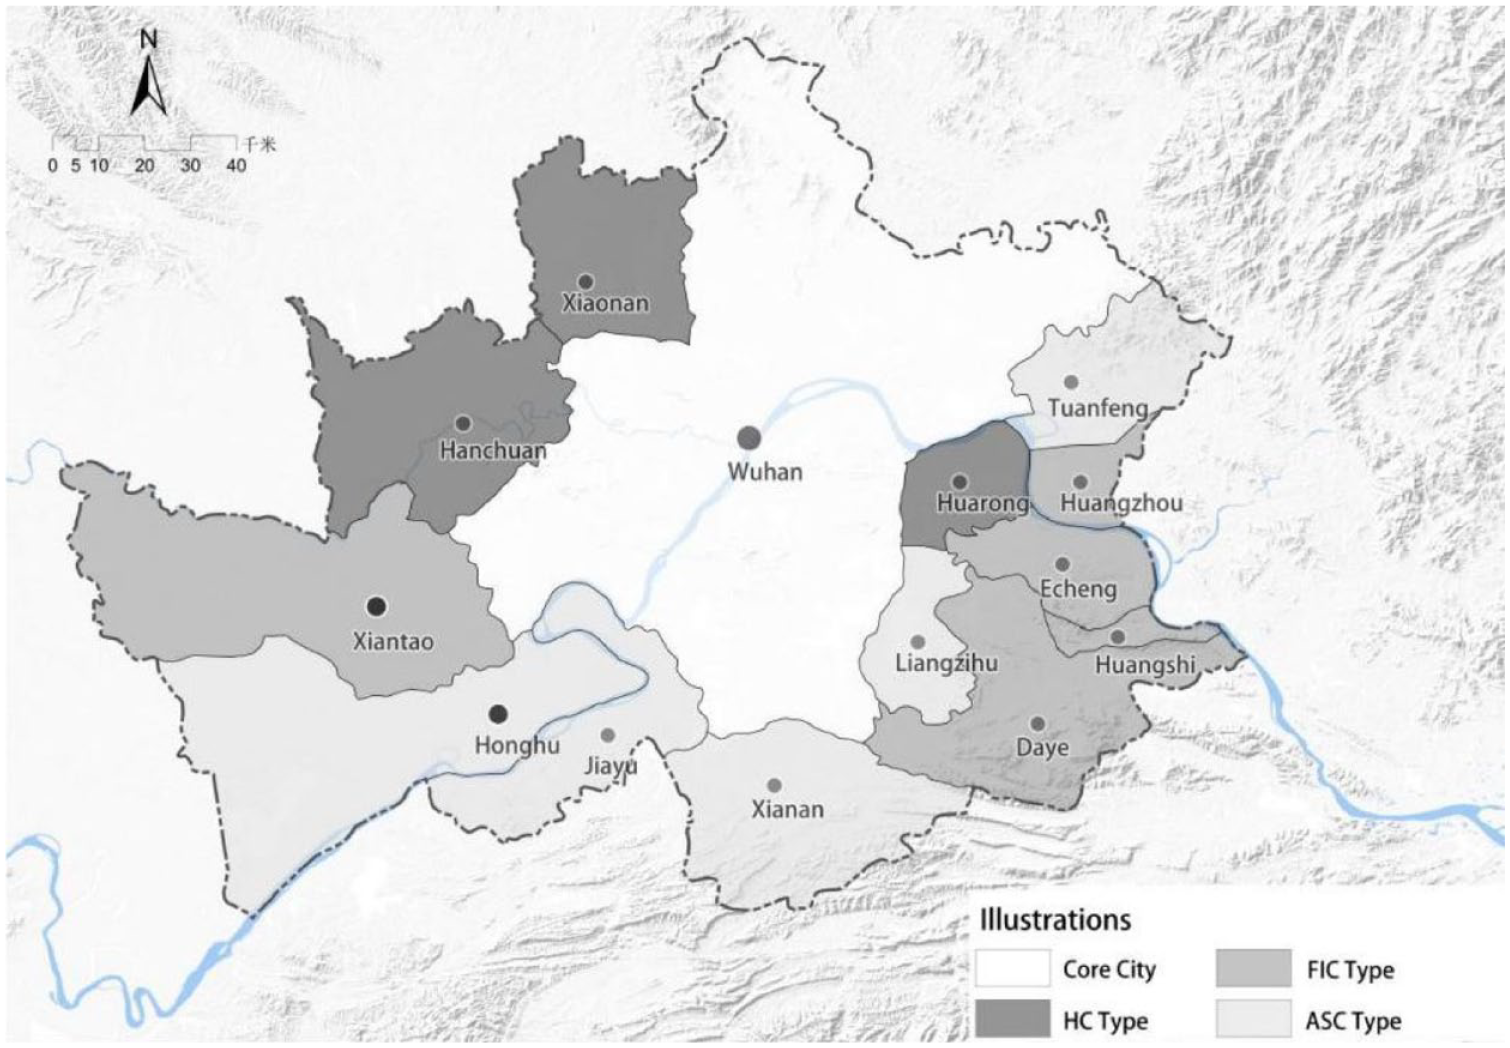
Types of cities in the Wuhan metropolitan area.
Optimization principles
In the development of urban integration areas, cities that adopt an all-round and deeply coordinated development strategy need to deepen their ties with core cities, increase their resources, prioritize their development, and achieve all-round and deep synergy with core cities. Cities that adopt the development strategy of enhancing attractiveness should focus on securing the foundation of urban integration, solving the main obstacles to urban integration, realizing the growth of their scale, and promoting the coordinated and stable development of themselves and the whole metropolitan area; cities that adopt the development strategy of enhancing flow and attractiveness should explore new development paths based on solving the obstacles to urban integration, combining their advantages, and realizing the dual growth of flow and attractiveness. The cities that adopt the development strategy of enhancing flow and attractiveness should explore new development paths based on their strengths to achieve the dual growth of flow and attractiveness (Brenner, 2004; Li et al., 2014; Liao et al., 2021; Wu et al., 2021b) (Figure 5).
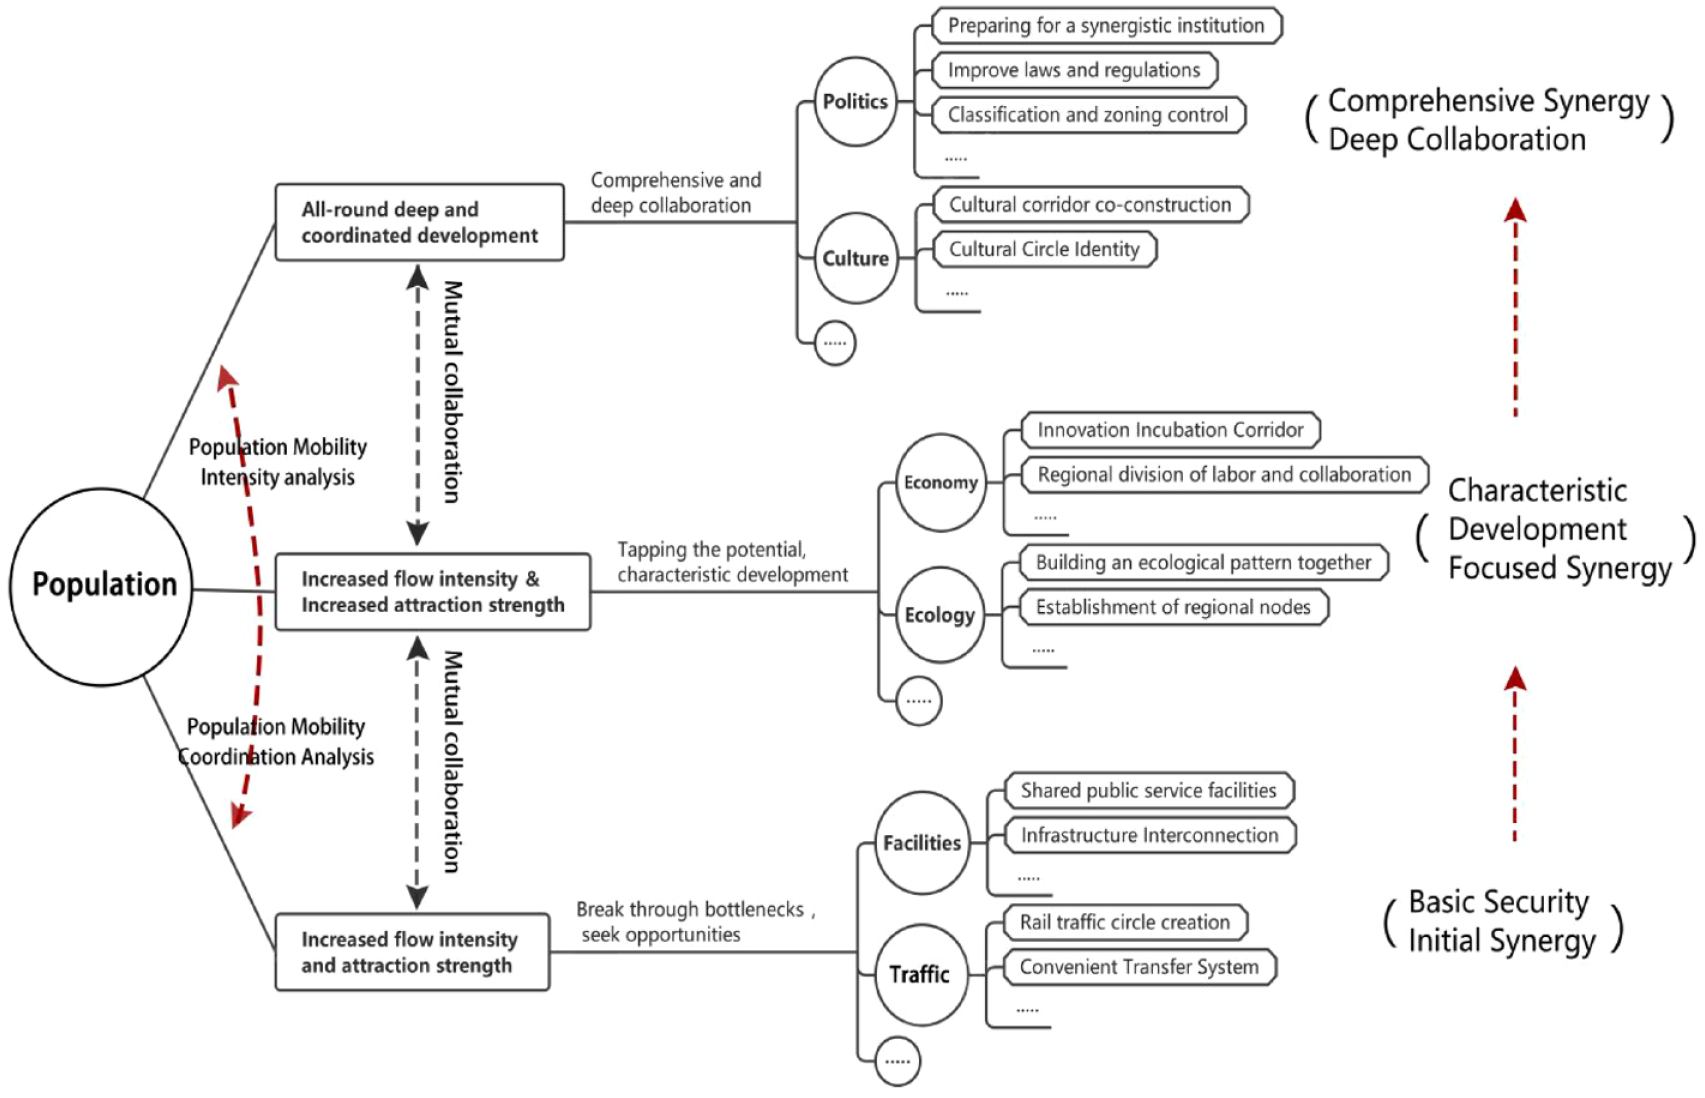
Schematic diagram of the optimization strategy of the metropolitan area.
All-round deep and coordinated development
Highly coordinated cities are more maturely urban integrated with the core cities and are the key development collaboration areas of the metropolitan area in the future. They need to seek comprehensive and deep synergistic development with the core cities and adopt all-around deep and coordinated development strategies in the process of urban integration development. These cities have close population ties with the core cities, and most likely have close communication and exchanges with the core cities in economic, social, cultural, and ecological aspects. In the process of urban integration development, these cities should continue to deepen their ties with the core cities, increase resource tilting, and further break down administrative barriers and institutional barriers that hinder the flow of factors between the two cities. The cities will eventually establish mature and perfect transportation networks and realize all-round deep collaboration with the core cities in terms of industry, transportation, facilities, culture, and institutions, forming a three-dimensional and networked intercity connection.
For the Wuhan metropolitan area, Huarong, Xiaonan, and Hanchuan are more mature in terms of population urban integration development and adopt an all-around deep and coordinated development strategy. In the planning and development process of the Wuhan metropolitan area, we should take the co-preservation and co-cultivation of ecological resources as the basis for action, and transportation urban integration as the driving force – for example, Xiaonan should focus on promoting the construction of the airport hub and airside sub-city, and strengthening the docking with Wuhan city rail – with innovation urban integration as the goal – for example, Huarong and other places focus on the Wuhan Optics Valley as the basis, and build the innovation park platform with the core of creating innovation application corridors, so as to make these areas the starting point of innovation co-city diffusion and the key innovation synergy area in the development line and innovation corridor of “Wu-E-Huang-Huang”.
Increased flow strength
The flow intensity-constrained type of medium and low coordination cities are major factors in the development of urban integration in metropolitan areas and are in the development stage of urban integration with core cities. Such cities should actively explore their own industrial characterization development path, explore the potential of regional development innovation, and adopt flow-intensity enhancement development strategies in the process of urban integration development. The scale of population flow between such cities and core cities has not yet fulfilled objective expectations, and there is significant room for growth and interchange with core cities in economic, social, cultural, and ecological aspects. In the process of urban integration development, cities should strengthen communication with core cities, accept the basis of driving and growing strength, and actively explore the characteristic development path to realize the improvement of linkage intensity and urban integration degree.
For Wuhan metropolitan area, Huangshi city, Daye, Echeng, Huangzhou, and Xiantao still have the potential for further urban integration development in terms of population flow scale, using the flow intensity to enhance the development strategy. For example, Xiantao might collaborate with Honghu to undertake the industrial transfer of Wuhan based on the new Tan Park, while insisting on location-based agglomeration to promote the ecological economy’s synergistic growth. Or they could have good transportation and logistics advantages; for instance, Echeng could turn its attention to the new airport as the foundation for encouraging the surrounding areas, like Daye, to integrate into the logistics corridor in order to realize the chain-type synergistic growth of “innovation-manufacturing-logistics”. Huangshi and Huangzhou District should fully play the policy and facility advantages of the central city to strengthen co-city construction with Wuhan.
Increased attractive strength
Medium and low coordination type cities with constrained attraction strength and core cities are gradually increasing the degree of urban integration, and are important growth poles for the urban integration development of the metropolitan area. Therefore, they should concentrate on achieving their own economic and social growth, completing the fundamental requirements of urban integration, boosting core competitiveness, and implementing the strategy of attraction strength enhancement development throughout the urban integration process. The objective attraction strength of such cities and core cities has not yet reached objective expectations. In the development of metropolitan areas, cities should emphasize the creation of transportation and facilities for urban integration, put a priority on the fundamental infrastructure of urban integration, and encourage the scale of population movement on the basis of improving their own economy and population scale. The city should focus on considering pilot development, taking the advantageous points as the foundation for development, leading the city with the points, promoting the overall development of the city, and centering on resolving its glaring shortcomings, enhancing its core competitiveness, and giving full play to its potential.
For the Wuhan metropolitan area, Xianan, Liangzihu, Honghu, Jiayu, and Tuanfeng adopt the strategy of attracting efforts to enhance development. Such cities generally have certain negative natural conditions or facility disadvantages. These cities should accelerate the construction of metropolitan urban areas on tracks to offset facility shortcomings and increase the interoperability effectiveness of production elements in the metropolitan area. For Jiayu and Liangzi Lake, we should make full use of their excellent natural conditions and take ecological resources as a starting point; for example, we can unite Xianan and Jiangxia to create a world lake area across administrative boundaries, turn disadvantages into advantages, and promote the urban integration of transportation, facilities, economy through ecological urban integration, and then realize the synergistic development of the whole metropolitan area.
Increased flow strength and attractive strength
The flow intensity and attraction strength constrained cities in medium and low coordination type cities are in the early stage of urban integration with core cities and are the backup force for the future development of metropolitan areas. Such cities should further make up for their outstanding shortcomings, reverse the declining trend of urban integration development in the region, and adopt flow intensity and attraction strength enhancement development strategies in the process of urban integration development. The current status of such cities is weak in terms of population linkage with core cities, and the late stage of the integration process of metropolitan areas is weak, which is not conducive to healthy development intra-city and even in the whole metropolitan area. In the development of metropolitan areas, cities should take basic security as the basis, and actively explore the path of mobile population enhancement to promote the scale of the city and the scale of population flow. Some cities, whose own development conditions are relatively inadequate compared with other regions, are at a disadvantage in the competition within the metropolitan area. It is necessary to further weaken the administrative boundaries and strengthen the collaboration between different types of cities to promote the coordinated and stable development of the whole metropolitan area.
Conclusion
With the increasing urbanization process, co-located areas are becoming an increasingly crucial component of the region’s coordinated development. They are also an essential part of future to boost the competitiveness and radiation of metropolitan areas and achieve high-quality regional economic development (Zhang and Tang, 2022). For the purpose of coordinating regional development and maximizing the growth pattern of each city, it is advantageous to be able to precisely and appropriately analyze the degree of development coordination of cohabitation regions.
In previous research on urban integration, scholars have rarely studied the coordination degree of co-located regions, especially around the coupled coordination degree between factor flow and urban attractiveness under the development trend of urban integration. Therefore, from the perspective of population flow, this paper innovatively proposes a measure of the coordination degree between actual regional urban flow and theoretical urban attractiveness, as well as the optimization strategy of urban integration based on population flow and coordination degree. Specifically, the attraction strength between cities is measured by the gravitational force model; the actual scale of population flow from each city to the central city is measured by cell phone signaling data; and thus, the coordination level between the actual scale of urban population flow and the theoretical attractiveness of cities is measured by the coordination degree model. Cities are classified into three categories based on their coordination level: high coordination, medium coordination, and low coordination, and then further classified into flow intensity constrained, attraction intensity constrained, and flow intensity and attraction intensity constrained, with corresponding development strategies proposed. The strategies are as follows: cities with high coordination degrees adopt a comprehensive and deeply coordinated development strategy to achieve a comprehensive and deep synergy with the central city as much as possible; cities with flow intensity constraints adopt a flow intensity enhancement strategy to actively explore their own special urban integration development path and increase the size of the mobile population; cities with attraction intensity constraints adopt an attraction intensity enhancement strategy to fully explore the development potential of the region, improve their own economic and population scale, and achieve an attraction intensity enhancement. Cities with flow intensity and attractiveness constraints should adopt the strategy of enhancing flow intensity and attractiveness to secure the infrastructure of urban integration and find further opportunities for collaboration to achieve the steady improvement of urban integration synergy.
The empirical verification of this paper shows that the method can better analyze the regional urban integration development level from the perspective of “factor flow” and city gravitational scale coordination, and identify the population urban integration development level of cities around megacities, which can provide some reference for urban integration and regional development research and big data application in territorial spatial planning. However, it is worth noting that “people flow” is only one type of urban “factor flow”, and other urban “factor flows” can be used to identify the level of population urban integration – such as “economic flow”, “information flow”, etc. – can still be used as a basis for determining the level of regional urban integration development. In addition, human travel has multiple purposes, and are the different purposes of mobility – such as “residence-oriented mobility”, “employment-oriented mobility”, etc. – equally compatible with the attractiveness of the corresponding cities? Further experiments are needed.
It should be noted that although this paper represents a novel attempt to coordinate development, there are still some issues with it. For example, the data from a single Unicom cell phone does not accurately reflect the actual population movement in the area, and the data analysis level also does not account for the variations in policies caused by the epidemic for different regions. As such, there is still room for further improvement in the follow-up study.
Footnotes
Declaration of conflicting interests
The author(s) declared no potential conflicts of interest with respect to the research, authorship, and/or publication of this article.
Funding
The author(s) received no financial support for the research, authorship, and/or publication of this article.