
Abstract
The severe population ageing has rapidly increased the demand for urban elderly care services in most countries. As a novel urban elderly care mode, community-embedded elderly care facilities integrate various functions and allow older urban adults to enjoy comprehensive care services in a familiar environment at an acceptable cost. Therefore, it is widely recognised as an effective way to resolve the contradiction between the increasing demand and limited supply capacity of elderly care services in large cities. However, spatial analysis of elderly care facilities in previous studies were focused on static characters, ignoring the evolution process. The traditional static analysis methods might be one-sided for the spatial analysis of community-embedded elderly care facilities, considering their highly dynamic development. This study considers Beijing as a case study and establishes a novel spatiotemporal analytical framework, augmented by big data, to analyse the spatial distribution of the local community-embedded elderly care facilities (elderly stations) from a dynamic view. The multi-source data regarding elderly stations, the elderly population and basic geographic information of Beijing were extracted and integrated into the analysis. On this basis, the proposed framework was applied to examine the distribution tendency, evolution trend and accessibility of elderly stations from 2017 to 2020. The results reveal a significant cluster development characteristic of elderly stations. Although the density of elderly stations in the downtown area is much higher than that in the urban periphery, the elderly stations might still be unable to satisfy the enormous elderly care demand in Xicheng and Dongcheng districts. Moreover, the imbalance between the urban centre and peripheries and the spatial mismatch between the elderly stations and population were identified. The research output could support the planning practice of elderly stations for relevant departments.
Keywords
Introduction
Population ageing has become a global problem affecting future social development with considerable effects on all aspects of life (Nguyen et al., 2022; Shao et al., 2019; Zhang et al., 2022). The United Nations Population Division projects that the population over 60 will increase to more than two billion in 2050, representing 22% of the world population (United Nations, 2017). The severe ageing trend has rapidly increased the demand for elderly care services in most countries, accompanied by growing investment in public resources which is not consistent with urban sustainability (Zhang et al., 2021b). Unlike the rural area, the dense population, longer life expectancy and decreasing fertility rate make the urban area more sensitive to population ageing, strengthening the contradiction between the supply and demand of elderly care resources. Especially for large cities, the ageing population leads to rapid growth in the demand for elderly care facilities (Zhang et al., 2022). Traditional elderly care facilities in large cities are primarily large-scale institution-based pensions, where the older adults ordinarily live (Zhang et al., 2019). Due to the high land prices in the central urban area, most locate in suburban areas to reduce operational costs. However, most older adults prefer to live and be cared for in familiar surroundings rather than in a new environment, which is challenging to adapt to (Guo et al., 2015; Ho, 2020). Therefore, although institution-based facilities provide a solution for the long-term care of the elderly, transferring older adults from their family and community to an unfamiliar environment might cause psychological resistance (Dixon et al., 2015; Ho, 2020). Especially in eastern countries, people tend to have a solid family value that family members should be cared for by each other instead of strangers, contradicting the children’s burdens and the elderly’s sense of family belonging, particularly intense in large cities (Morikawa, 2014; Sumita et al., 2021; Tsutsui, 2014).
In this context, many countries focus on updating the residential communities to be more elderly suitable to realise the ageing-in-place for their large cities (Sun et al., 2020). As declines in physical functioning are one of the primary reasons for older tenants to move out of their units, collocating health and community support services on-site is essential for promoting ageing-in-place (Sheppard et al., 2022). As a realisation route, community-embedded elderly care facilities have spread in large cities to satisfy the elderly’s need to receive the necessary elderly care services inside their community. The novel facility integrates various functions, such as health care, social activities, meal assistance and entertainment, and provides short-term residence or on-site nursing services.
Japan was the first to develop community-embedded elderly care facilities through a national planning project. It began to deploy community-embedded elderly care facilities in major cities across the country in 2006. A facility’s service scope corresponds to the area of the school district it belongs to, which approximately equals an accessible area of a 30-minute walk for older adults (Hatano et al., 2017). In the developing process, the Japanese government further subdivided the community-embedded elderly care facilities into nine types based on the characteristics of service objects (dementia and disability) and service forms (day care, live-in care and night care). Following Japan, other countries also developed community-embedded elderly care facility planning, e.g. the Centre-based Care Services in Singapore (Ho, 2020) and the Community Health Care Facility in Australia (Zainol and Pettit, 2016).
China launched the popularising projects of the community-embedded elderly care concept in 2014, focusing on spreading the community-embedded elderly care facilities in major cities. Beijing started developing its local form of a community-embedded elderly care facility (the elderly station) in 2016. Beijing’s government established a series of policies to satisfy at least 70% of the older adults’ demand for elderly care services by constructing community-based facilities. As a realisation route, the traditional community-based facilities (elderly care centres, elderly activity centres) were updated to the elderly station to enrich service categories and improve the service quality. Furthermore, numerous new elderly stations were distributed to all administrative divisions of the city. After years of development, 1,192 elderly stations had been put into operation by the end of 2020, which has driven the evolution of the developing pattern and spatial structure of the elderly service industry. The existing research on urban commercial space evolution shows that the evolution of the elderly care industry is not a straightforward process of replacing old elements with new elements in a time sequence but a reorganisation and coordination of the elements under new spatiotemporal conditions and policy backgrounds. Despite the institutional elderly care facilities only serving the older adults living in the facilities, the spatial distribution of elderly stations is essential. Although the developing trend is vigorous, defects such as low profitability, unbalanced spatial distribution and resource waste emerged, impelling the planners to review the spatial evolution process and evaluate the planning rationality for the elderly stations. In addition to the influence of site selection and time, establishing elderly stations should also consider the local population’s characteristics to rationalise facilities’ scale and radiation range to maximise social welfare (Zhang et al., 2022).
Several studies have been conducted around the theme of the spatial analysis of elderly care facilities to support the sustainable planning of the urban elderly care industry. Different analytic methods have been introduced for evaluating the spatial distribution of elderly care facilities, e.g. the average nearest neighbour (Li, 2019) and kernel density (KD) (Xu and Zhao, 2017; Yuan et al., 2019; Zhong et al., 2020). Consequently, the primary spatial patterns of urban elderly care facilities have been identified from various aspects. Besides, recent studies have focused on the accessibility of elderly care facilities. Much of the related research adopted accessibility-based approaches to evaluate the spatial matching of elderly care facilities and older adults (Cheng and Huang, 2020; Wu et al., 2017; Xu et al., 2017), recognised as the primary factor for analysing spatial equity and social fairness (Huang et al., 2022; Luo et al., 2018; Zeng et al., 2017). Collectively, these studies outlined a critical role for the spatial analysis of elderly care facilities as planning support; however, these studies remain narrow, focusing only on the static sectional distribution, barely providing sufficient information about the spatial evolution process and developing trend of newly emerged facilities, community-embedded elderly care facilities for instance.
Therefore, this study establishes a spatial analytical framework to comprehensively analyse the spatial distribution of urban community-embedded elderly care facilities through a dynamical vision. Compared with previous research, this study provides new insights into understanding the evolution trend of the spatial distribution for elderly care facilities. The research begins by constructing a spatiotemporal database integrated with multi-source data, and it will establish an analytical framework based on selecting methods dealing with different analytical objectives. Further, the spatial evolution process of elderly stations from 2017 to 2020 in Beijing will be analysed from three aspects: distribution tendency, evolution trend and accessibility. The research output should help the planners better understand the influencing process of guiding policies on the spatial evolution of elderly stations.
The remainder of the paper is organised as follows. The second section provides an overview of the related works of spatial analysis using different methods for urban elderly care facilities. The third section lays out the research data source and explains how we pre-processed the data to construct a spatiotemporal database for elderly stations in Beijing. The fourth section is concerned with the analytical framework and the specific methods used in this study, including Moran’s Index, nearest neighbour index (NNI), standard deviation ellipse (SDE), KD estimation and two-step floating catchment area (2SFCA). The fifth section presents the analysis results from three aspects (distribution tendency, evolution trend and accessibility) based on the potential implications for planning practice. Finally, the sixth section concludes the primary findings and limitations of this study.
Literature review
Spatial analysis for elderly facilities
Unlike young generations, the spatiotemporal behaviour of older adults is unique. They have more flexible time to visit public facilities, e.g. hospitals and parks (Sun et al., 2020). Furthermore, older adults’ physical abilities are limited, making them more sensitive to the travel distance to a destination facility. Appropriate spatial distribution of elderly facilities could guarantee the convenience of daily activities for older residents. Hence, evaluating the spatial distribution of urban elderly facilities becomes a critical issue for planners. In this context, a large and growing body of literature has proposed various spatial analysing approaches for elderly facilities. Much of the current literature focuses on the present spatial distribution characteristics of elderly facilities. A typical example is a location map, which tries to describe the density of the facilities and discover the problem areas based on a spatial presentation of the urban elderly facilities (Breznik et al., 2019). Geographic information system (GIS)-based tools were used to analyse and evaluate the spatial distribution of elderly facilities to capture detailed and quantitative characteristics. Zhou et al. (2013) calculated the Global Moran’s I to measure the spatial autocorrelation for public-and-community facilities and used local indicators of spatial association clustering to discover the spatial association based on the facilities’ spatial equity. In the case study of Los Angeles, Frochen et al. (2019) conducted spatial clustering and hot spot analysis using Getis-Ord Gi* to pinpoint the statistically significant clusters of local residential care facilities.
After the concept of ageing-in-place was proposed globally, whether the location of elderly facilities matches the spatial distribution of older adults gradually become a new concern for relevant research. Data from several studies suggested that older adults significantly prefer to visit the facilities supporting their daily life that are within 15 minutes of walking time (Ariza-Álvarez et al., 2021; Bhuyan et al., 2020; Joy, 2021; Zhang et al., 2021a), which was recognised as a planning guide for elderly facilities. Accepting the 15-minute walking time as a threshold, Dawidowicz et al. (2020) designed a universal methodology to identify the potential active ageing places in cities based on appropriate locations for new elderly facilities, considering the spatial-temporal behaviour of older adults. Recently, several studies have been published on spatial equity and matching degrees with the elderly population for distributing amenities, parks, medical facilities and elderly care facilities (Guo et al., 2019; Sharma and Patil, 2021; Wen et al., 2020; Zheng et al., 2020).
Accessibility evaluation for elderly facilities
Accessibility has been widely recognised as an effective tool for assessing the spatial matching degree of public facilities and the population (Guo et al., 2019; Levine, 2020; Shi et al., 2020). Although the concept of accessibility has acquired numerous meanings in many fields during the century of its evolution, it is typically defined as the ease with which activities at one place might be reached from another via a specific travel mode or available modes (such as walk, bus, rail, bike or car). Following the definition, accessibility has been used to evaluate the ease, quality and extent of people to reach potential opportunities, facilities or services in many studies (Ariza-Álvarez et al., 2021; Cheng et al., 2020; Ranković Plazinić and Jović, 2018; Shi et al., 2020). It also helps to unravel the complicated relationships between land use, transport and human activities in many research fields (Cheng et al., 2020) and can reflect spatial equity (Guo et al., 2020). Therefore, numerous studies have focused on the elderly’s accessibility to healthcare facilities and public parks, which are critical for achieving a better life quality for older adults (Cheng et al., 2020; Gong et al., 2021). Adetunji (2020) used the nearest neighbour analysis method to calculate the average distance between urban residents and medical facilities to evaluate accessibility. Sasaki et al. (2017) investigated the relationship between the transportation environment and the long-term care insurance system in Japan and highlighted that accessibility, especially by car, could affect long-term care insurance usage. Better accessibility regarding distance and time cost could significantly increase the frequency of public parks and other urban green space use for older adults (Lau et al., 2021; Vich et al., 2021).
The community-embedded elderly care facilities locate in the community and most older adults walk there daily. The reduced mobility might inhibit older adults from walking to facilities with lower accessibility (Cheng et al., 2019a, 2019b). Therefore, community-embedded elderly care facilities are more spatial-sensitive than traditional facilities, strengthening the necessity to analyse their accessibility to older adults. The 2SFCA approach is currently the most popular method for investigating accessibility and has been widely used in the accessibility calculation for elderly facilities (Guida and Carpentieri, 2021; Guo et al., 2019; Tao and Cheng, 2019; Wen et al., 2020). Thus, the accessibility to community-embedded elderly care facilities for older adults was calculated using the 2SFCA approach. The analysis of accessibility was conducted, focusing on its annual change.
Summary of previous studies
The previous literature has focused on criteria to select an adequate method for the spatial analysis of elderly facilities, providing abundant alternative analysis methods for this study. However, the spatial distribution of traditional elderly facilities is moderately stable, causing scholars to habitually concentrate on analysing the current state but ignoring the chronological evolution process. As a newly emerged elderly facility, the spreading speed of elderly stations is astonishing, distinguishing it from traditional elderly care facilities. An accurate description of the dynamical evolution features could provide the decision-makers with more information, which is critical to understanding the effect of guiding policies and predicting the future developing trend. However, no method in the previous studies could comprehensively analyse the spatial evolution process for elderly stations. Therefore, establishing a spatiotemporal analytical framework for distributing community-embedded elderly care facilities is significant for supporting the relevant practical planning – the major contribution of this paper.
Data
Study area
This study uses Beijing, the capital of China, as the case study. The city comprises 16 districts (Figure 1), among which the Dongcheng, Xicheng, Chaoyang, Haidian, Fengtai and Shijingshan districts are the six core districts.
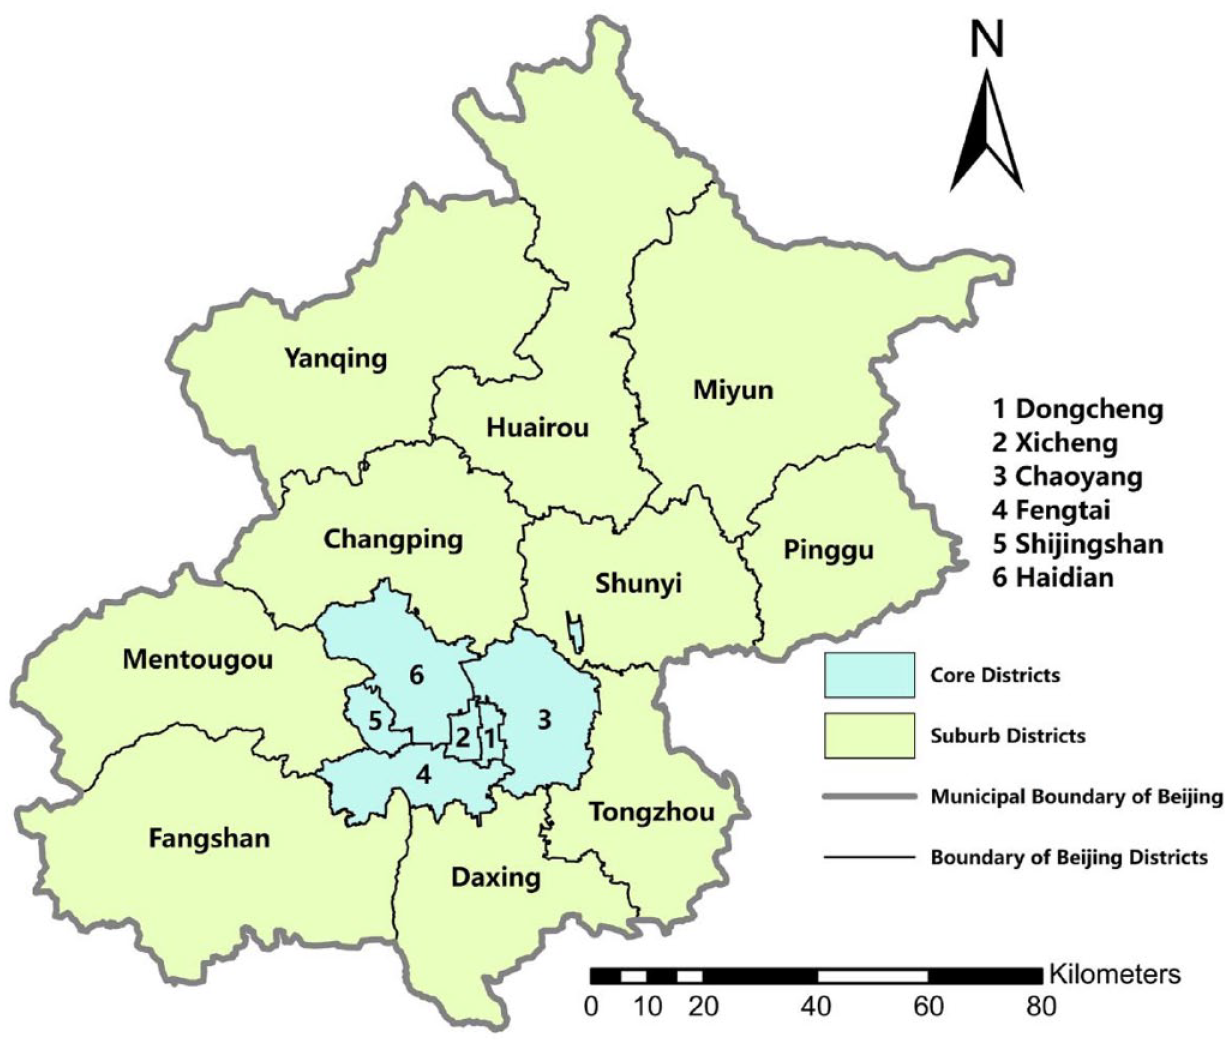
Administrative divisions of Beijing.
Regarding the demographic composition, the Seventh National Census (in 2020) shows that the total permanent population of the city is 21.89 million, of which the population aged 60 and above is 4.30 million, accounting for 19.6%. According to the local standard, this study defines the population aged 60 or above as older adults. Compared with 2010, the number of older adults has increased by 7.1% until 2020, indicating that Beijing faces an increasingly severe ageing problem. One of the most pressing issues caused by population ageing is the conflict between the rapid increase in elderly care demand and the limited number of elderly care facilities. Therefore, the local government conducted a construction project of community-embedded elderly care facilities in 2017. By the end of 2020, the local form of community-embedded elderly care facilities (elderly stations) had achieved full coverage for all the administrative districts.
Data preparation
This study constructed three datasets (the elderly station, older adult and basic geographic information datasets) for the analysis. The elderly station dataset includes geographic data of elderly stations and related policy documents, typically collected from the official website of the Beijing Municipal Civil Affairs Bureau (www.mzj.beijing.gov.cn/). The policy documents contain construction strategies for elderly stations and related planning policies. Furthermore, the registration information of elderly stations is open to the public on the website mentioned above, where we collected the names, addresses and opening dates of the elderly stations. After that, an open-source point-of-interests catchment tool named Guihuayun (www.guihuayun.com/) was used to obtain the coordinates according to the elderly stations’ addresses. Finally, all elderly station data were geocoded using ArcGIS, as shown in Figure 2, presenting the distribution of 1,192 elderly stations constructed by the end of 2020.
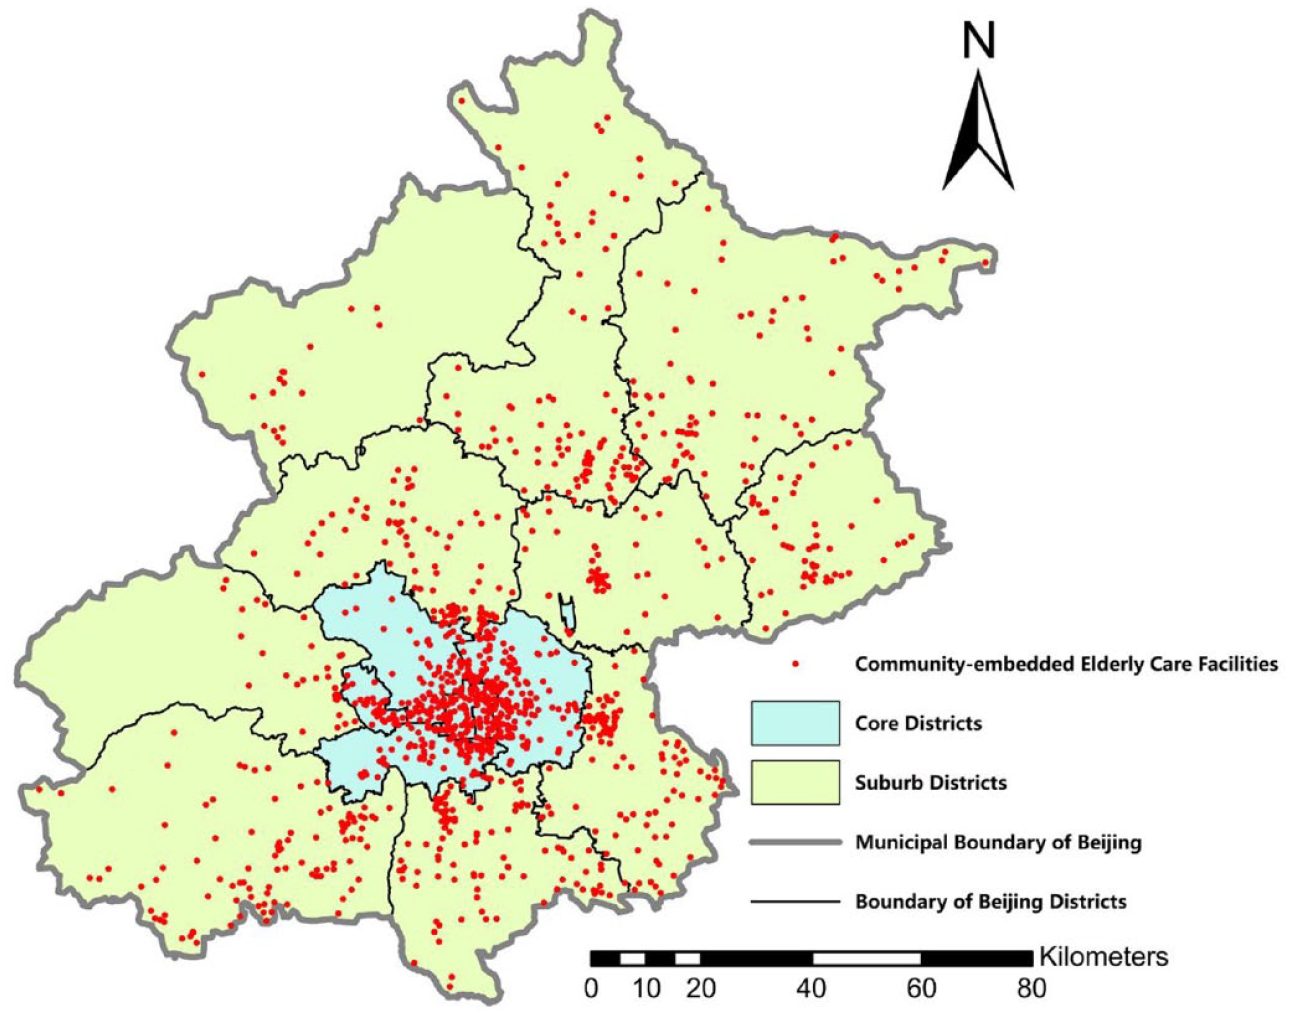
Distribution of the elderly stations in Beijing.
The older adult dataset contains the elderly population’s spatial distribution on the traffic analysis zone (TAZ) scale and their activity characteristics. The elderly population was extrapolated from cellular signalling data collected from 1 June 2015, to 7 June 2015, by China Mobile. The signalling data were cleaned and processed by removing the noisy data, such as duplicate and ping-pong effect data. The number of cellular users in each TAZ was counted according to users’ night-time patterns. If a cellular user triggered a base station in a TAZ during the night at least three days a week, it departed from the TAZ every morning or arrived at the TAZ every night and it is recognised as a resident belonging to this TAZ. A Bayesian classifier considering the travel and mobile phone use characteristics obtained from a questionnaire survey was used to identify older adults from cellular users. The classification accuracy reached 91% in cross-validation, validating the effectiveness of the Bayesian classifier (Wei et al., 2022). Finally, the number of older adults in each TAZs was expanded according to the ratio between the city’s permanent population in Beijing and cellular users (Figure 3). The permanent population is from the Beijing 2015 Statistical Bulletin on National Economic and Social Development published by the Beijing Municipal Bureau of Statistics (Beijing Municipal Bureau of Statistics and Survey Office of the National Bureau of Statistics in Beijing, 2016: 1).
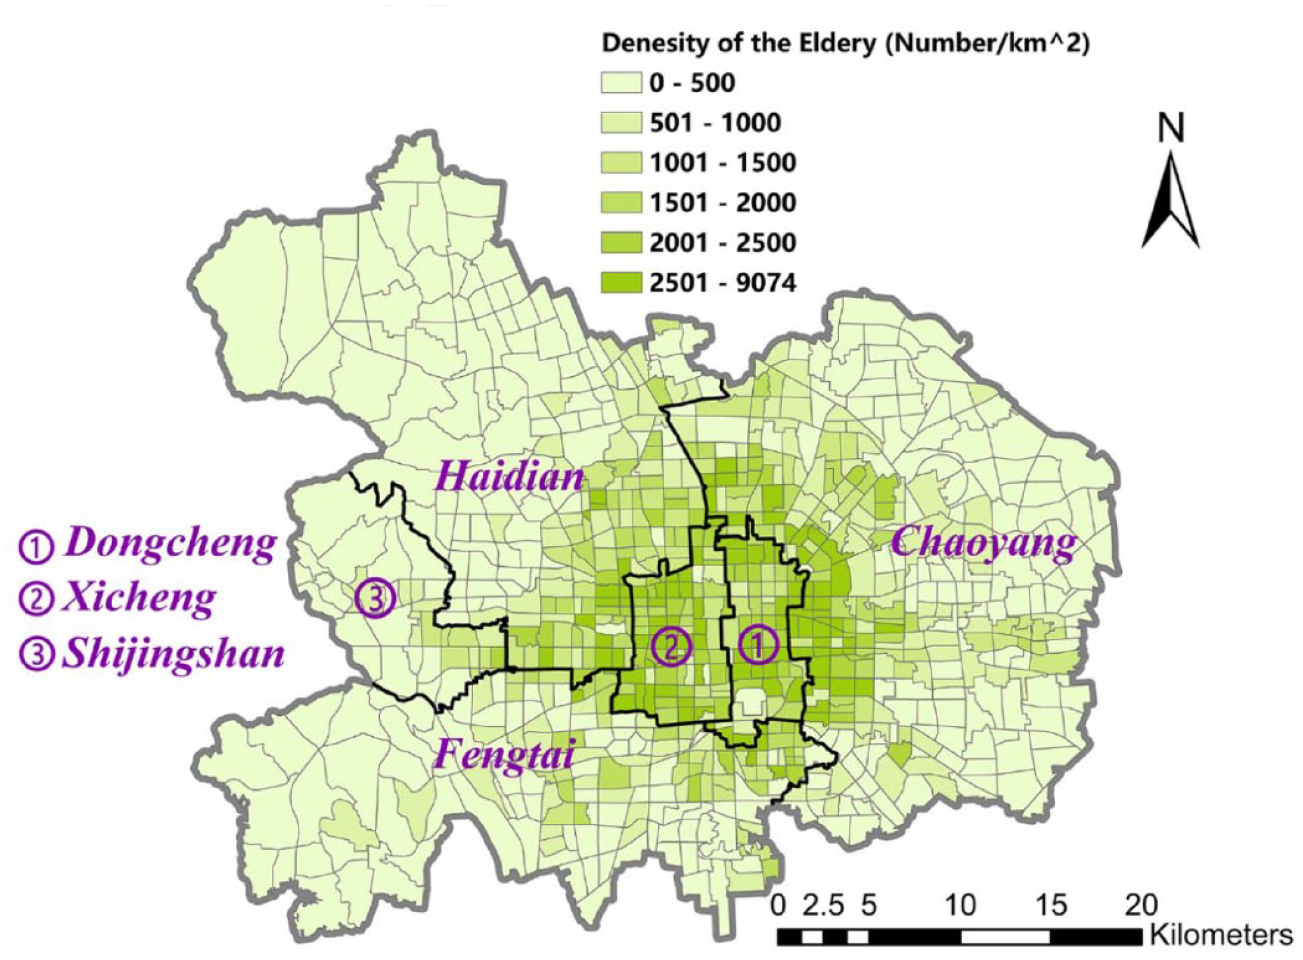
Spatial distribution of elderly population in the six core districts.
The basic geographic information dataset contains the boundaries from the entire city to the TAZs and the geographic information data necessary for the analysis. Most data were extracted from the National Catalogue Service for Geographic Information and processed in ArcGIS to unify their forms.
Methodology
Spatiotemporal analytical framework
Figure 4 shows that the spatial distribution features of elderly stations were examined from three aspects: distribution tendency, evolution trend and accessibility. For each analysis dimension, suitable quantification methods were selected from previous studies. The distribution tendency of elderly stations was investigated by employing Global Moran’s I to examine whether the locations of elderly stations present spatial aggregation or dispersion within the administrative boundary of Beijing and the boundaries of the six core districts. After that, the NNI of elderly stations was calculated to examine the annual aggregation or dispersion degree change. For the evolution trend, we constructed a SDE for the elderly stations and observed its annual change in directionality. The KD was estimated to visualise the change in construction hot spots over the developing process. Finally, the 2SFCA approach was adopted to measure the accessibility of the elderly stations for older adults at the TAZ level, quantitatively capturing the spatial matching degree between elderly stations and the population.
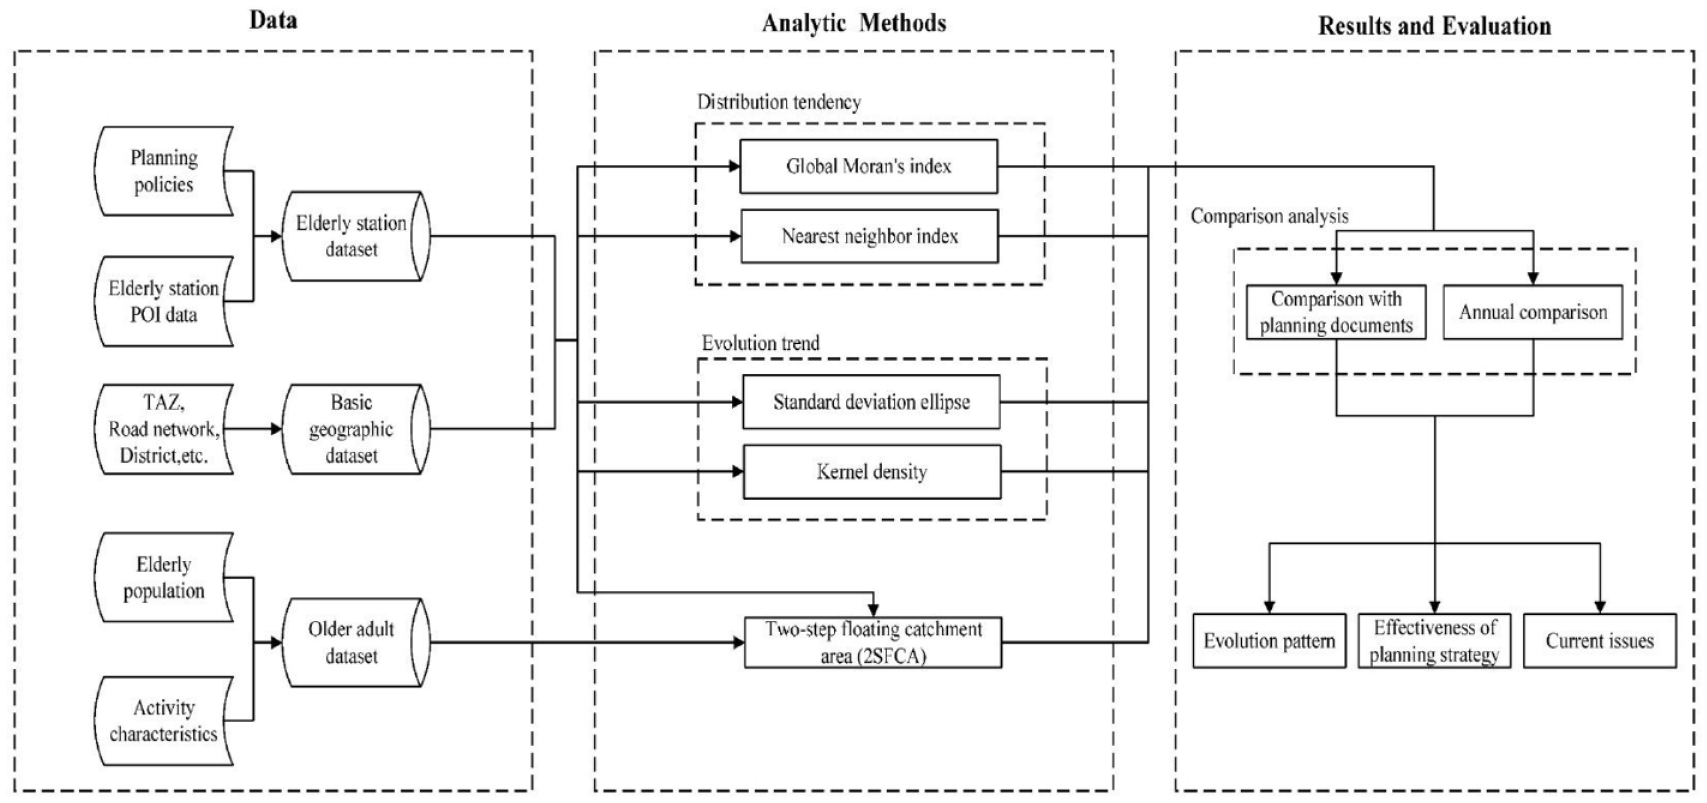
The spatiotemporal analytical framework for community-embedded elderly care facilities.
Global Moran’s index
The current spatial relationship and static agglomeration characteristics of elderly stations were studied using the Global Moran’s I. It has been proven as an effective tool for measuring the spatial pattern of urban environmental/socio-economical parameters (Kumari et al., 2019). The role of spatial relationships in spatial autocorrelation analysis is to judge whether the geographical distribution of points shows aggregation characteristics. The calculation formula is presented in equation 1.
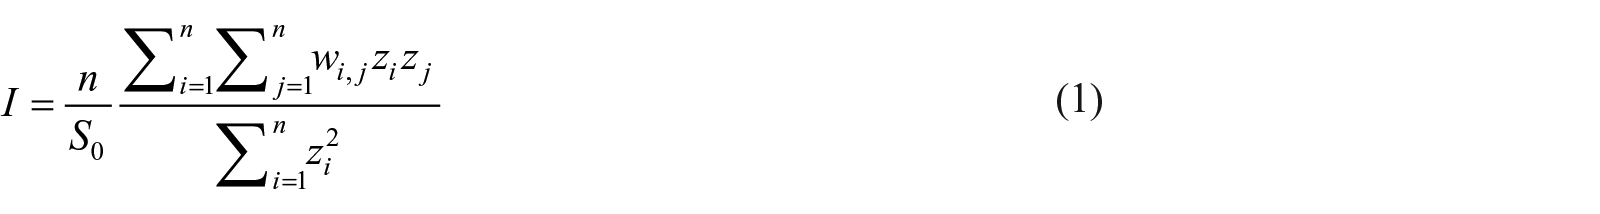
where
The statistical
where


This study used the Global Moran’s I tool in ArcGIS to realise the calculation process, and the spatial distribution characteristics were determined according to the characteristic values of the results. The Global Moran’s Index values are distributed in [−1, 1]. (0, 1] indicates a positive correlation among geographical entities, [−1, 0) indicates a negative correlation and 0 indicates no correlation. The higher the value, the higher the correlation. Greater than or equal to 0.2 is considered highly clustered.
NNI
The NNI is a typically used method to evaluate the equilibrium of geographical distribution for analysing targets. The distribution mode can be determined by comparing the NNI of actual samples and the generated random spatial distribution samples (Zhang et al., 2019). The NNIs of elderly stations were calculated and compared by single years from 2017 to 2020 to study the change in spatial distribution characteristics. The observed distance
Assuming that the samples are randomly distributed in the study area, the expected mean distance
The NNI

If the observed average distance equals the expected average distance, then
SDE
The SDE was adopted to observe the evolution trend of the distribution range and directivity from a macro-perspective. SDE is a frequently used method to measure the trend or distribution of a group of points in a specific region, summarising the spatial characteristics of geographical elements, such as dispersion degree, central trend and direction trend. Previous studies have used this method to explore the evolution of various elements, including natural water areas (Richter et al., 2021), carbon emissions (Du et al., 2019), public opinion evolution (Zhang et al., 2020) and pollutant concentrations (Shi et al., 2018). The long half axis represents the directivity and the short half axis represents the distribution range. The greater the difference between the values of the long and short half axes (the larger the flattening ratio), the more pronounced the directivity. The calculation procedure starts with determining the centre of the circle, which is the arithmetic mean centre of elderly stations in this study. The formulas are as follows:
where
Then, the ellipse’s direction is determined with the x-axis as the criterion, due north direction as 0 degrees and rotated clockwise. The formula is as follows:
where
The x- and y-axes’ lengths are calculated as follows:

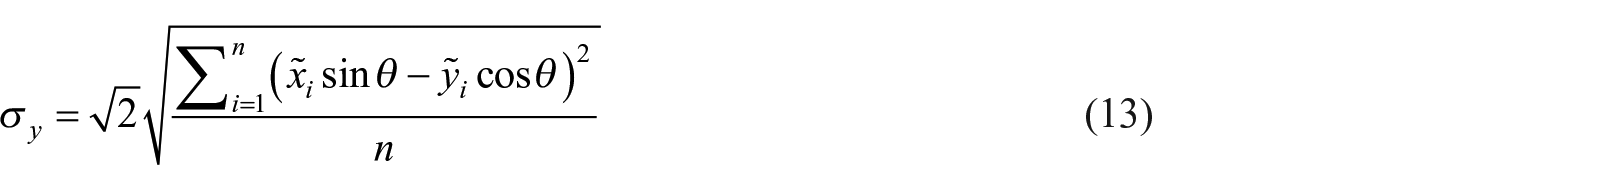
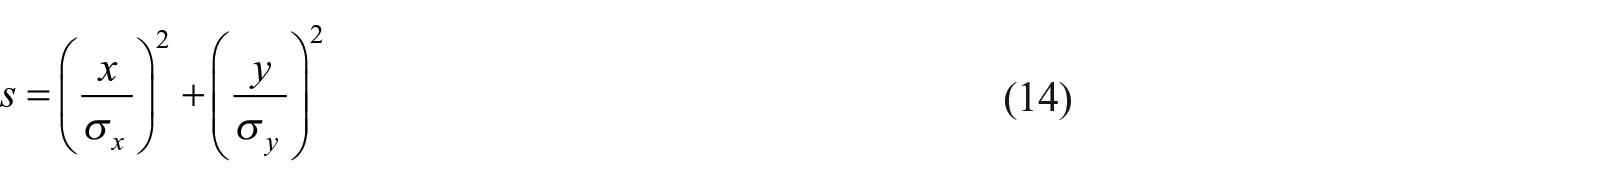
where
Finally, the Ellipse equation can be described as equation 14.
KD estimation
The KDs of elderly stations in the study area were estimated each year from 2017 to 2020 to examine the developing hot spots during the spatial evolution process. KD can directly reflect the distribution density of spatial points within a specific range. The method is to set a kernel function at each point and represent the neighbour point distributions by a kernel function, as shown in equation 15:
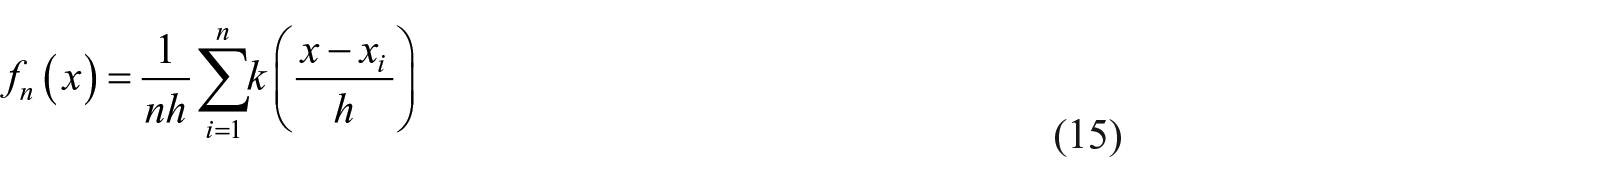
where
The 2SFCA method
The first step is to calculate the service coverage of the elderly station. For each elderly station at location
where
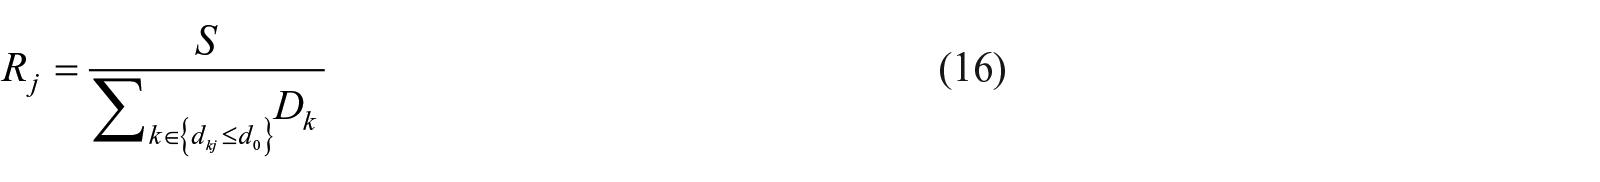
The second step is summing the service of each elderly demand point received from the elderly stations. For elderly demand points

where
Results and discussion
Distribution tendency
We first established a raster layer with a side length of 3 km to observe the general distribution characteristics of elderly stations. Figure 5 shows a significant disparity between the urban centre and peripheral area. The distribution of elderly stations is concentrated in the core districts and in the suburbs, they are fewer and scattered, only concentrated in a few regions. These results could be related to Beijing’s geographic features and planning strategy. On the one hand, the central urban area is well-developed and densely populated, stimulating the rapid growth of elderly care facilities and leading to the high density of elderly stations. However, the mountainous terrain in Beijing’s suburbs restrained large-scale urban construction, resulting in scattered towns and villages with less elderly care demand.
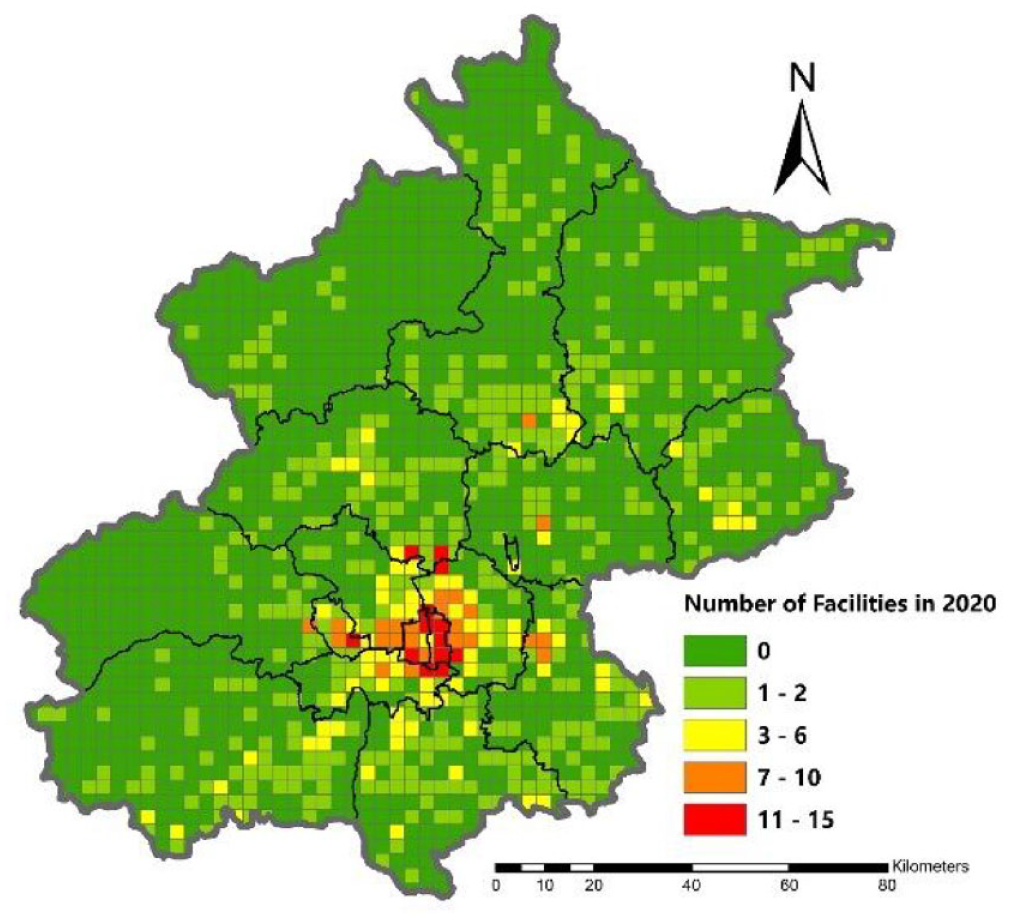
A diagram of spatial agglomeration of elderly stations in Beijing.
To deeply understand the elderly facilities’ distribution and development characteristics, the Global Moran’s I and NNI calculations were performed. Table 1 shows that Moran’s Index is 0.259 and shows statistical significance at a 99% confidence level, indicating that the distribution of elderly stations is concentrated. This result indicates that the elderly stations are primarily distributed in the core districts, suburb towns and clustered and the spatial distribution is disequilibrium.
Calculation results of Moran’s index (99% confidence level).
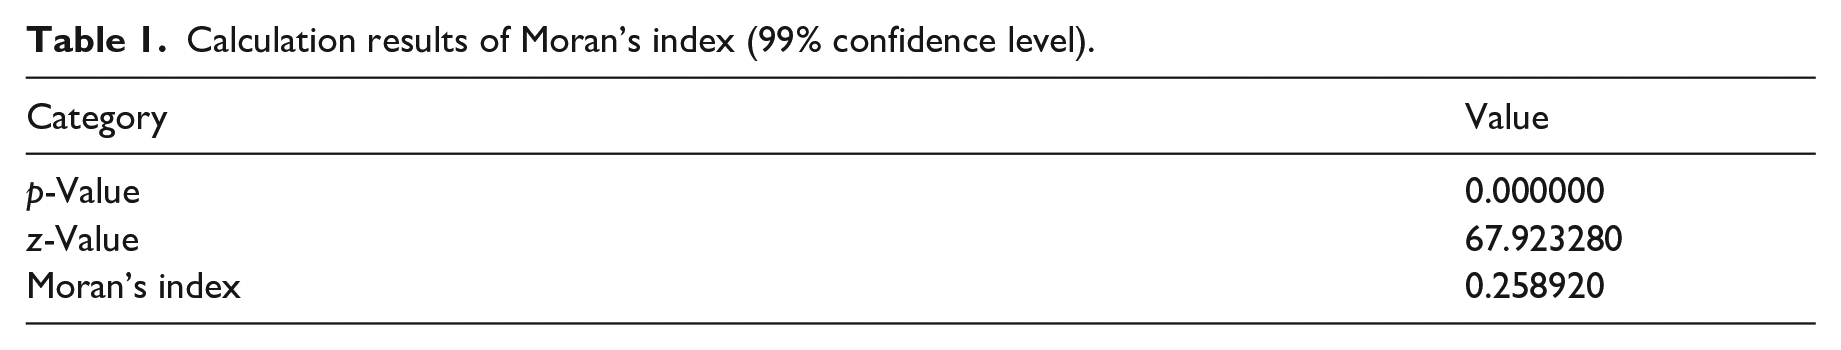
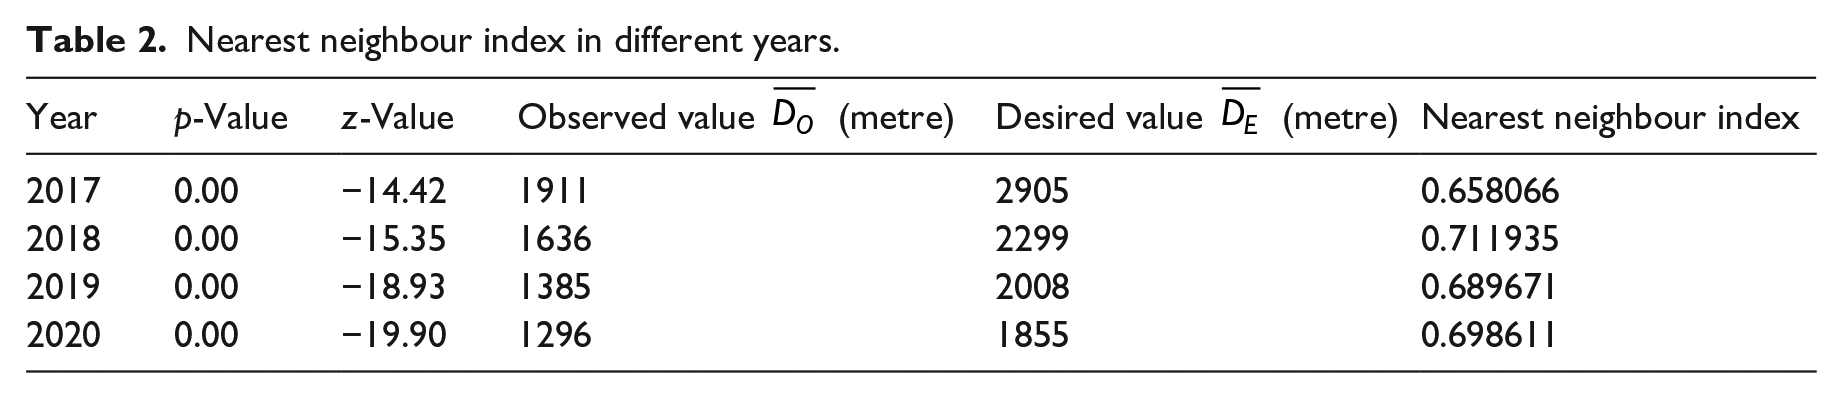
Table 2 shows the results of the NNI. The decrease in the observed value could be attributed to the continuous construction of elderly stations. The distribution of elderly stations presents spatial agglomeration but the agglomeration degree gradually weakened. A rather interesting phenomenon is that the NNI increased in 2018; therefore, the planning strategy in 2018 might have considerably contributed to the equalised distribution of elder stations in Beijing. These results indicate that although the current spatial distribution of elderly stations shows significant spatial agglomeration, the overall trend of aggregation declines during the developing process. The planning policies toward the equilibrium distribution of elderly stations were adequate but not stringent enough to achieve the targets.
Nearest neighbour index in different years.
In this section, we conducted a year-by-year analysis of the overall distribution of elderly stations. As the development of community-embedded elderly care facilities in most cities is highly dynamic, planners should constantly focus on the facilities’ development characteristics. The dynamical analysis based on Moran’s Index and NNI could help planners understand the overall development of community-embedded elderly care facilities from a quantitative perspective. Thus, the differences between status and planning objectives for each year could be easily clarified, further supporting the planners to determine whether the development has deviated from the original intention, explore the possible causes and adjust the relevant policies.
Evolution trend
We analysed the overall trend of spatiotemporal evolution for elderly station construction by demonstrating the SDEs from 2017 to 2020 (Figure 6) and Table 3 shows the numerical results. From 2017 to 2020, the total area of the SDE slowly increased by year, indicating a gradual expansion toward spatial equilibrium of elderly stations. However, the mean centre of the SDE is stably located in the six core districts, almost unchanged. The result indicates that although the number of elderly stations increased by year, the aggregation degree in the six core districts was the highest compared with the periphery districts.
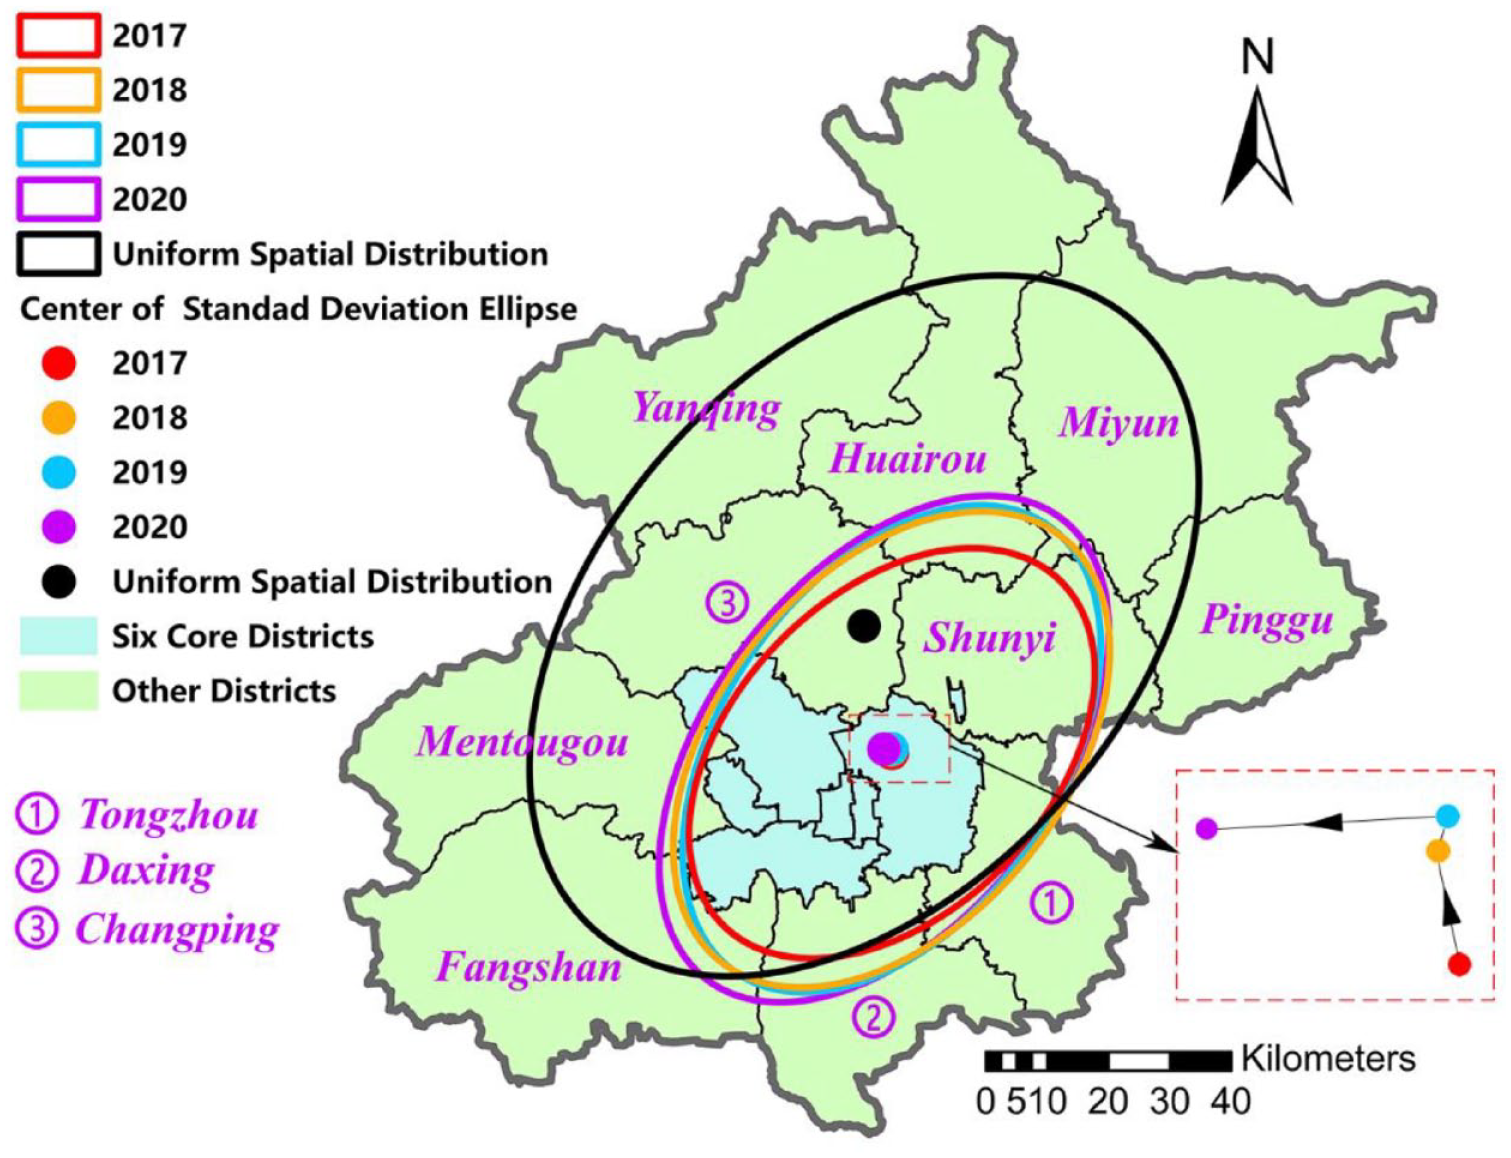
Standard deviation ellipses from 2017 to 2020.
Standard deviation ellipse results in different year.
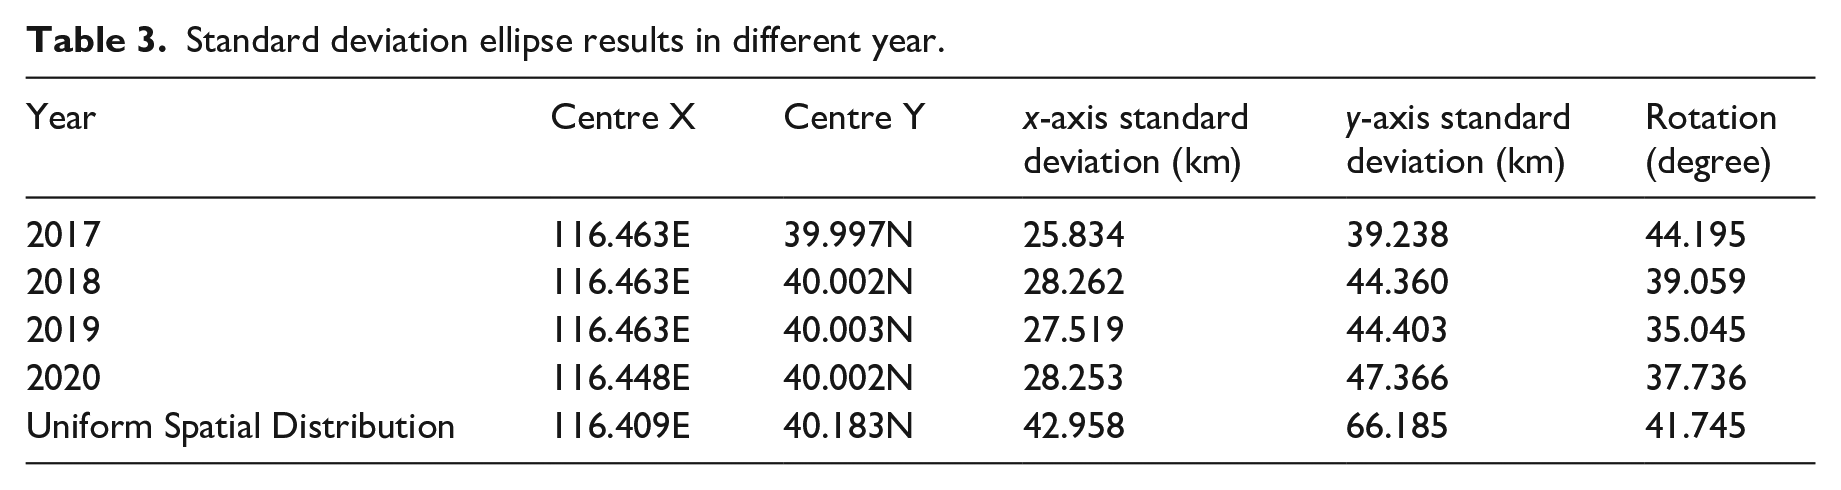
After a closer inspection of the primary axes, Table 3 shows that the x- and y-axes have increased. Specifically, the x-axis length changed from 25.384 km in 2017 to 28.253 km in 2020, experiencing an 11.30% increase. However, the y-axis length increased by 20.71% from 39.238 to 47.366 km through the construction of elderly stations. Moreover, the rotations of the axes did not show a notable change but only slightly turned 9.150° anticlockwise. These results describe the spatial evolution process of elderly stations. The construction started from the six core districts, which formed a highly aggregated area and spread along the northeast and southwest of Beijing.
Compared with the uniform spatial distribution, the SDE in 2020 is smaller and its centre is oriented to the southeast of Beijing. This result indicates that the aggregation of elderly stations is still quite significant after four years of expansion and the quantity and density are larger in the southeast than in other directions. The explanations for this result are twofold. First, it is partially due to the natural geographic condition factors. Specifically, the north and west of Beijing are surrounded by mountains, leading to a low elderly population density and, therefore, are not suited to be primary targets for developing elderly stations. Another cause for the differences between the SDE and the uniform spatial distribution is the planning strategies. The city is divided into four functional urban partitions, according to Beijing’s Urban Master Plan (2016–2035) (Beijing Municipal Commission of Urban Planning, 2017: 1): the capital function core area, the urban function expansion area, the urban developing area and the ecological conservation area. The planning strategy of elderly stations released in 2016 highlighted that the primary target is to ensure the complete service coverage of elderly stations for the capital function core area comprising the Dongcheng and Xicheng districts in 2019. These two districts locate in the southeast of Beijing and attract increasing construction opportunities for elderly stations because of policy orientation. Therefore, the operators might choose to open a new elderly station in the ecological conservation area only if they could barely find a better chance in other urban partitions.
The KD analysis for newly constructed elderly stations from 2017 to 2020 was conducted to understand the evolution trend better. Figure 7 shows the results. In the first year of construction, the distribution of new elderly stations in 2017 covers the most extensive range across the urban space. Furthermore, the high-intensity developing regions are closely clustered downtown, concentrated in the Xicheng, Dongcheng and the West of Chaoyang districts. Although the construction intensity in the periphery districts is not as high as downtown, four hot spots are independently located in the Changping, Huairou, Shunyi and Pinggu districts. Thus, the hot spot distribution might be due to the aggression of the local elderly population in the urban developing regions. Besides, the construction of elderly stations was frequently integrated into the detailed plan for developing areas in these districts, which might promote the local elderly station construction.
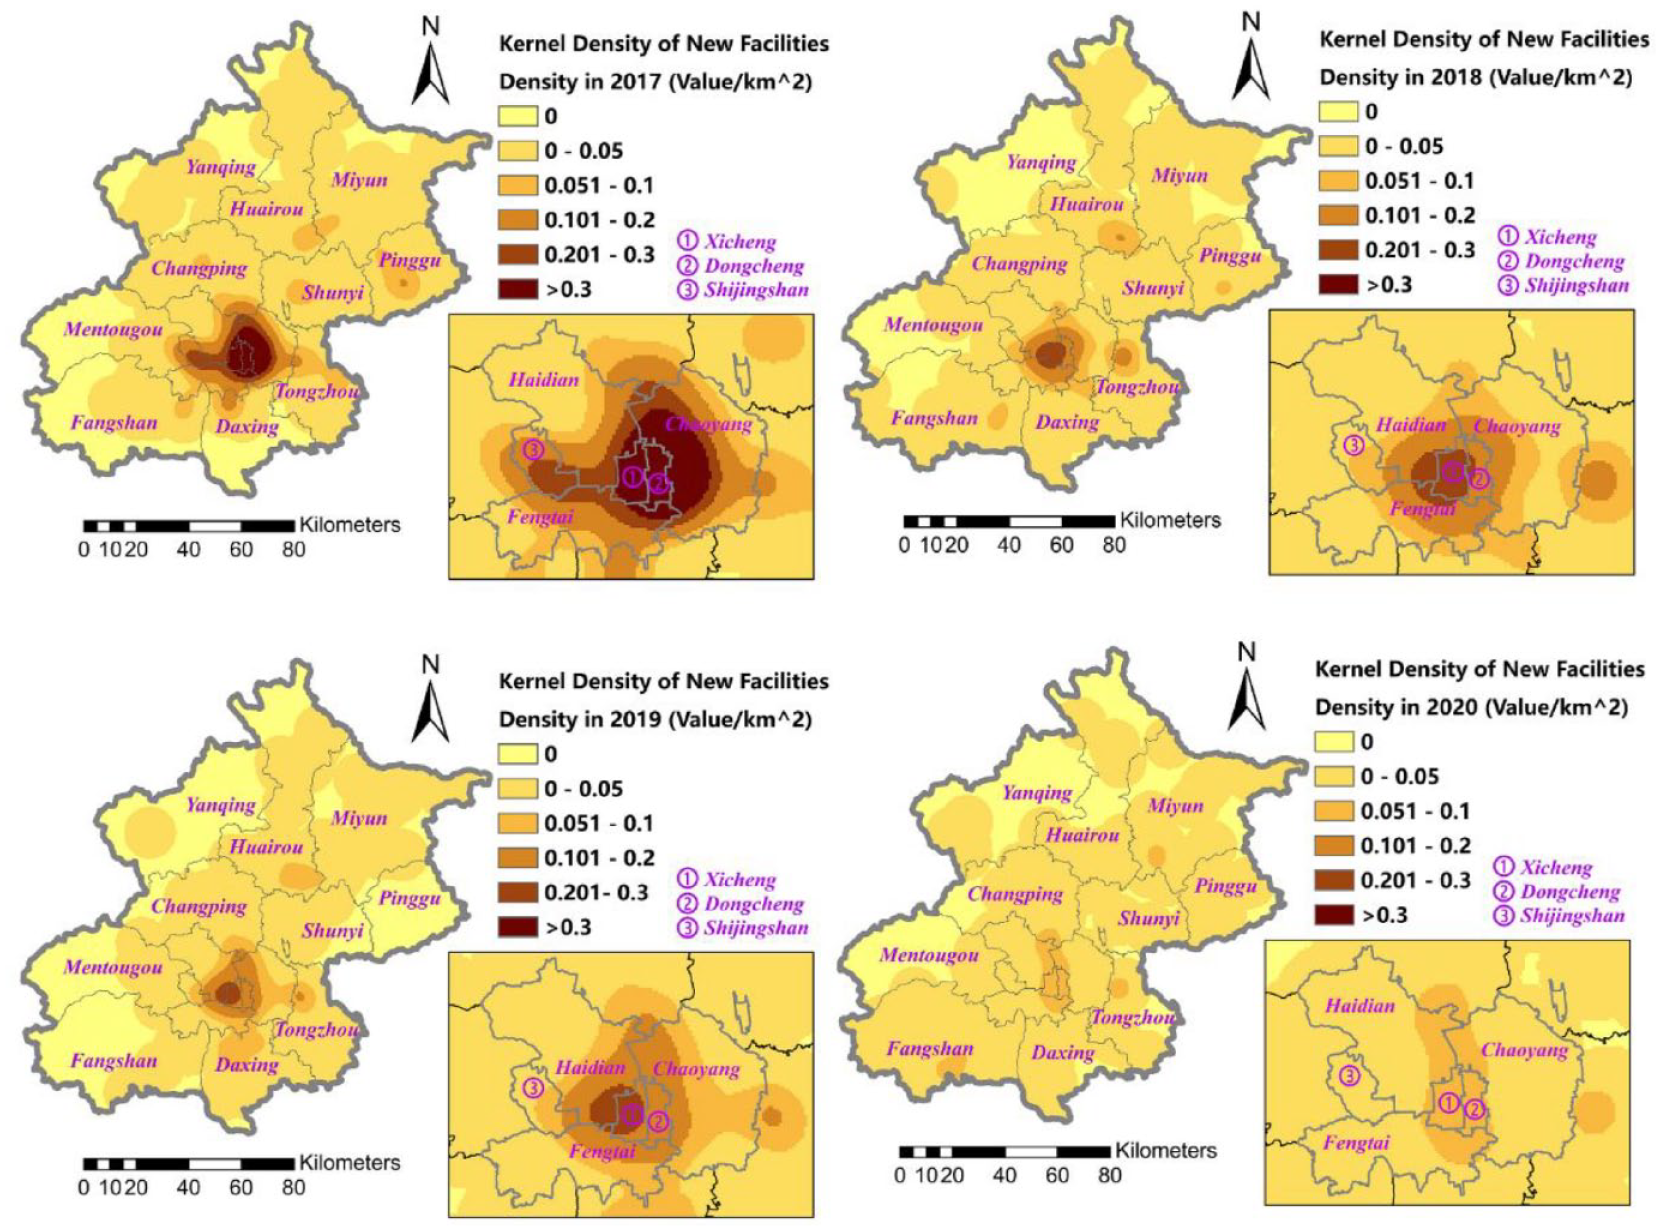
Developing hot spots of elderly stations from 2017 to 2020.
In 2018, the new elderly stations were still highly clustered in the six core districts, but the construction intensity was significantly reduced compared to 2017. Turning to the entire city, the coverage of new elderly stations showed an interesting phenomenon from north to south. The result indicates that the districts in the south, including Fangshan, Tongzhou and Daxing, successfully launched their construction programme, leading to an evolution trend to turn toward a balanced spatial distribution gradually. Overall, the construction of the new elderly stations in 2018 promotes the even distribution of elderly stations across the urban space in Beijing.
The distribution pattern of construction intensity of new elderly stations in 2019 is similar to 2018. The downtown area continued the high-intensity development of elderly stations in 2018. However, the coverage of new elderly stations shrank and the number of construction hot spots decreased in 2019 because of the planning documents. The Beijing Construction Plan of Community Elderly Stations (2016–2020) highlighted that the six core districts should actively mobilise all resources and strive to achieve complete coverage of elderly stations by 2019. Surprisingly, although the developing trend of elderly stations in other periphery districts seems to stagnate, the Daxing district in the south of Beijing has extensive new elderly stations with a significant high-intensity construction area. In summary, the six core districts achieved complete coverage of elderly stations after the construction in 2019, but the cluster development in the six core districts exacerbated the imbalance between downtown and the periphery districts.
Finally, in 2020, the number of new elderly stations has significantly reduced, especially in the six core districts. Nevertheless, the coverage of new elderly stations expanded in the suburbs compared to 2019. The results are quite revealing in several aspects. First, after four years of development, the number of elderly stations achieved the planning target established by the People’s Government of Beijing Municipality. Second, the complete coverage of elderly stations in the six core districts was achieved by 2019; therefore, the construction strategy turned back to enhance the even development across the urban space of the entire city.
This section provides a detailed analysis of the spatial evolution characteristics of elderly stations in different regions. The overall spatial evolution trend was evaluated by standard deviation and each year’s spatial intensity developing hot spots were identified by KD estimation. The results can provide the planner with evidence to judge whether the elderly stations extend towards a balanced distribution and easily recognise the city’s weak areas. On this basis, the refined management of elderly station construction can be achieved by regulating the policy and strategy for different regions according to their specific status, finally contributing to the balanced development of community-embedded elderly care facilities in the city. The analysis in this section is also helpful in investigating the developing pattern of community-embedded elderly care facilities in a metropolis and the causes. However, whether the elderly stations’ distribution matches that of the elderly population in Beijing is still inconclusive, which will be evaluated in the following section.
Accessibility
The accessibility to elderly stations for older adults on the TAZ scale was calculated using the 2SFCA method to examine the spatial matching degree between the elderly stations’ distribution and the elderly population. The catchment size was 1 km, considering the service range of the elderly stations defined in the Beijing Construction Plan of Community Elderly Stations (2016–2020). The service range of 1 km was consistent with the results of interviews conducted in 17 elderly stations in Beijing. Due to data limitations in scale and service supply capacity for each elderly station, it was assumed that all elderly stations have the same service supply capacity for older adults. Furthermore, because the elderly population data outside the six core districts were unavailable, we only considered the six core districts for accessibility analysis. Figure 8 shows the results.
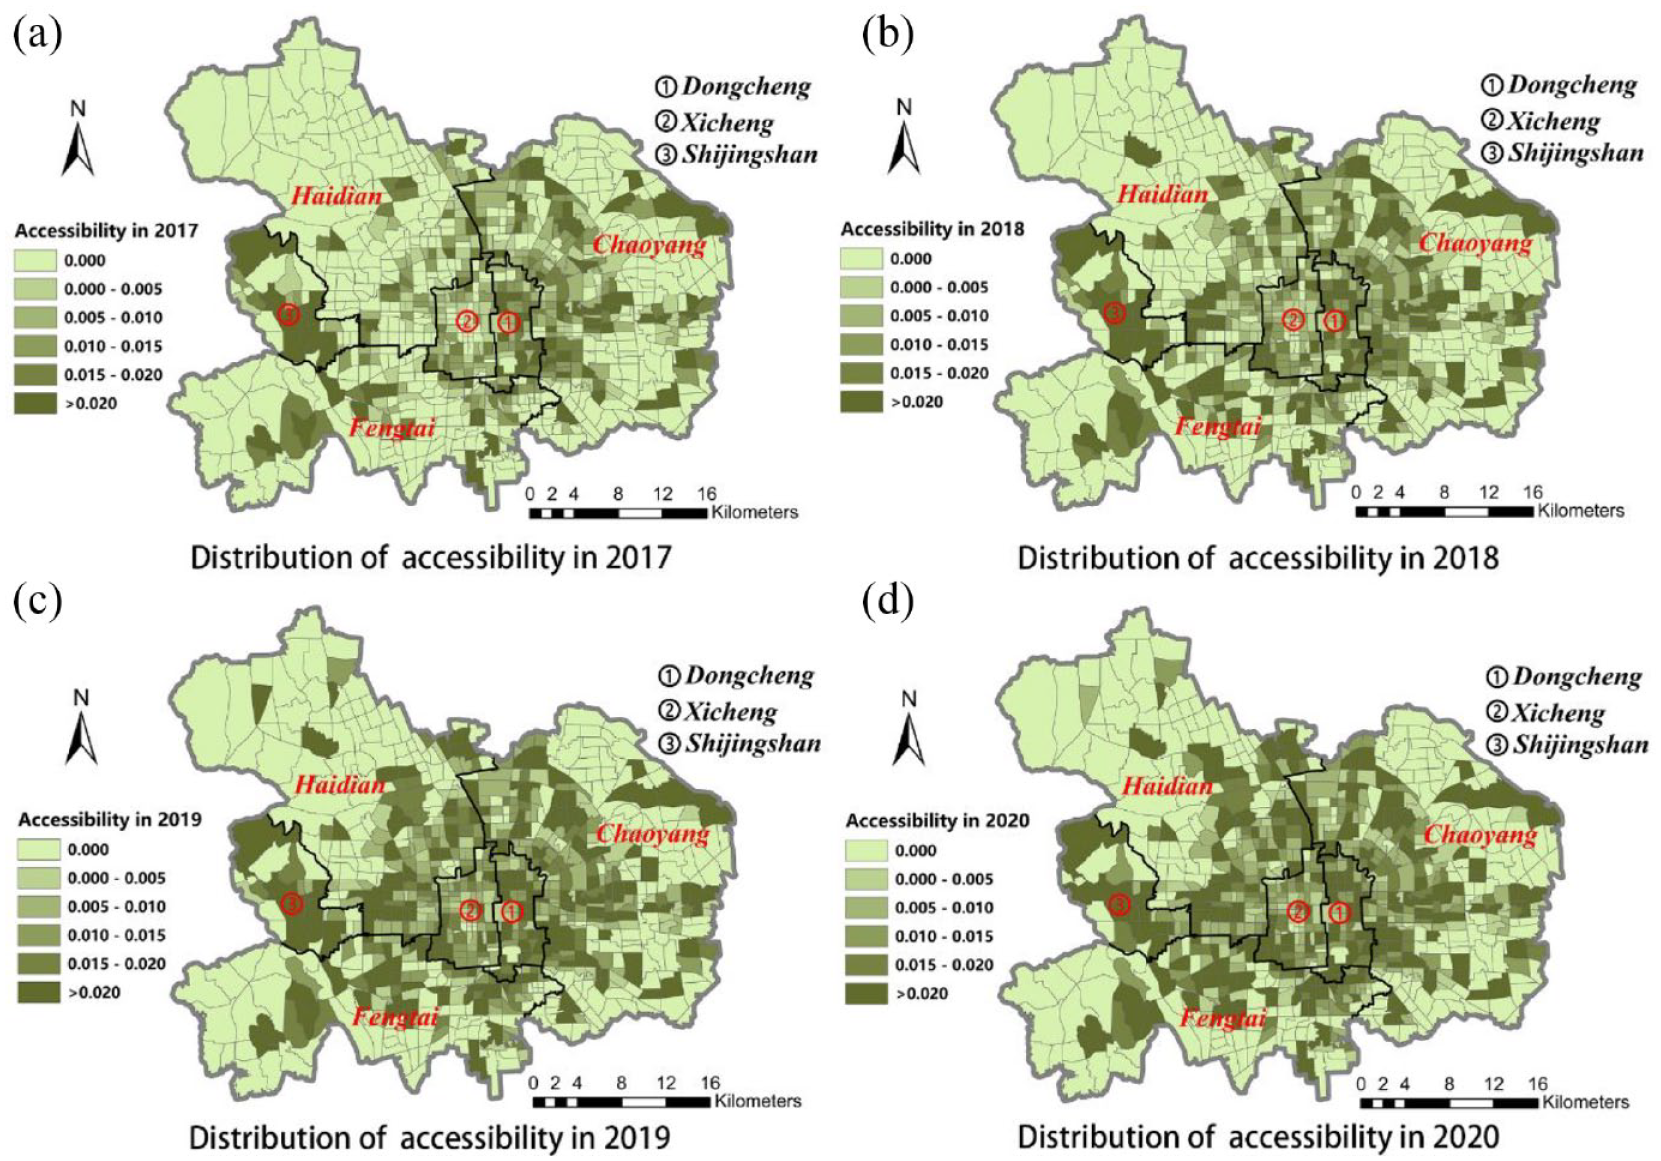
Distribution of accessibility in six core districts from 2017 to 2020.
From 2017 to 2020, the spatial variation in the accessibility of elderly stations in the six core districts of Beijing is significant. In 2017, the value of accessibility was higher in the Shijingshan and northwest Chaoyang districts, whereas the equilibrium of accessibility distribution was better in the Dongcheng and Xicheng districts. In 2018, the government expanded the construction scope of elderly stations. Thus, the coverage of elderly stations in the Chaoyang, Fengtai and Haidian districts gradually expanded, increasing accessibility. In 2019, the accessibility of elderly stations in the six core districts improved slightly. Therefore, the coverage in the six core districts was close to the planning target from a macroscopic perspective, naturally slowing the government’s path to constructing new elderly stations. However, it is apparent in our analysis that there exist TAZs with accessibility that is of concern in the six core districts. This result can be explained by the unbalanced spatial distribution of older adults and elderly stations.
Specifically, although the Dongcheng and Xicheng districts have a large density of elderly stations, the local elderly population is still over-aggregated compared to the elderly stations. Furthermore, the high density of historic buildings and the strict building codes in the capital functional core area make it challenging to find adequate spaces for elderly stations in the Dongcheng and Xicheng districts. Consequently, the elderly stations here are typically narrow and, therefore, have a somewhat limited in service capacity, contradicting that the total supply is still insufficient despite the numerous elderly stations. Due to the population density in the Xicheng and Dongcheng districts, the planning objective and evaluation criteria for elderly station construction should switch from the total quantity and coverage to the supply–demand ratio. Strengthening the service capacity of the current elderly stations and providing more subsidies for new elderly stations to locate in larger spaces might be feasible solutions to improve the inadequate total service capacity.
However, many TAZs have moderately scattered distributions of elderly populations and abundant construction sites in the Chaoyang, Fengtai and Haidian districts. Therefore, the accessibility of these TAZs is even better than most TAZs in the Dongcheng and Xicheng districts. Moreover, the satisfactory accessibilities in the Chaoyang, Fengtai and Haidian districts could be attributed to urban land use. For example, the northwest Haidian and southwest Fengtai districts have not been intensely developed, leading to a small population and a weak demand for elderly care services. The Shijingshan district has significant high accessibility compared with other districts because it is small and is a distinguishable plain and mountainous area. Thus, it is easy to maintain consistency in the location of elderly stations and the elderly population. Although the planning objective of elderly station construction quantity for the city of Beijing has been achieved, the TAZs in the peripheral areas in the Haidian, Chaoyang and Fengtai districts are facing low accessibility to elderly stations. It creates a need for adjustment in the planning scheme to expand the scope of construction according to the specific situations of these districts. Essentially, older adults should have an equal chance to accept elderly care services no matter where they live in the urban space.
Traditional planning policy-making procedures tend to be conducted from a macro-perspective, focusing on construction quantity and overall spatial distribution and based on the user’s facility satisfaction surveys (Longduoqi et al., 2022; Li et al., 2022). Subjective methods, such as questionnaire surveys, are easily influenced by the interviewee’s competency. The accessibility evaluated using 2SFCA might be an accurate quantitative indicator to objectively reflect older adults’ access to community-embedded elderly care facilities in different locations in the urban space. For planners, accessibility could complement the distribution tendency and evolution trend. By accessibility analysis, the regions with insufficient elderly care service capacity compared with demand could be accurately recognised to implement the corresponding counter-measures and planning adjustments in time.
Conclusions
Due to pervasive urban population ageing, many countries have established construction projects for community-embedded elderly care facilities to resolve the contradiction between the increasing elderly care service demand and insufficient supply in large cities. Compared with traditional elderly care facilities, older adults are sensitive to the location of community-embedded elderly care facilities. Therefore, whether the facilities’ spatial distribution is suitable for local characteristics has become an essential planning issue. However, most relevant studies focused on the static spatial distribution of elderly care facilities and used statistical data to describe the development status, ignoring the spatial evolution process. Consequently, planners could barely find valuable evidence to demonstrate the influences of guiding policies and planning strategies on the developing trend of elderly care facilities during their spatial evolution.
Based on multi-source big data, this study established a spatiotemporal analytical framework for community-embedded elderly care facilities’ distribution and evolution. Considering Beijing as a case study, the proposed framework was applied to conduct spatial analysis for elderly stations from three aspects: distribution tendency, evolution trend and accessibility. The primary findings are summarised as follows:
(1) After four years of construction, Beijing’s distribution of elderly stations matches the natural geographic characteristics and urban form but it shows significant spatial aggregation. The density of elderly stations is much higher downtown than in the urban periphery. Furthermore, several aggregation groups are dispersed in the Tongzhou, Shunyi and Huairou districts.
(2) The elderly stations presented cluster development during the developing process. The capital function core area (Dongcheng and Xicheng districts) experienced continuous high-intensity construction of elderly stations from 2017 to 2019. Consequently, although the planning target for the capital function core area was achieved in 2019, the high-intensity construction downtown until 2019 objectively aggravated the uneven spatial distribution of elderly stations.
(3) From an accessibility perspective, significant disparities exist across the urban space for older adults living in the six core districts. The accessibility to elderly stations for older adults living in the Xicheng and Dongcheng districts seems unsatisfactory, even though the construction target in the planning document has been achieved. Furthermore, accessibility in the Chaoyang, Fengtai, Haidian and Shijingshan districts shows significant differences among the TAZs. This finding indicates that the collaborative planning of elderly stations with the elderly population in Beijing has inadequacies in need of optimisation.
The insights gained from this study might assist in identifying the problems in the spatial distribution of elderly stations in Beijing and evaluate how the guiding policies have evolved since the elderly stations emerged. The proposed analytic framework effectively provides more precise and detailed information about the spatial evolution process for community-embedded elderly care facilities in a large city than previous studies, supporting the planning practice from a new perspective; therefore, it has excellent potential to be applied to analyse other cities.
Due to the data limitation, this study suggests many questions that need further investigation. First, the co-evolution process of community-based facilities with the traditional elderly care facilities has not been integrated into the analysis. Therefore, more data should be collected regarding other types of elderly care facilities to comprehensively analyse the overall spatial evolution process for the entire elderly care service industry. Second, limited by the absence of accurate population distribution data, the elderly population of the TAZs was estimated by signalling data using the Bayesian estimation method, which might introduce errors in the accessibility measurement. The accessibility calculated based on accurate population distribution can better reflect the actual situation, which will be conducted in our further research. Third, regarding the service supply capacities, the assumption that all facilities have the same capacity is strong and neglects the heterogeneity of the elderly stations. A revised investigation will be conducted considering the heterogeneity of elderly stations and the differences in service types after acquiring more accurate service data of the elderly stations.
Footnotes
Declaration of conflicting interests
The author(s) declared no potential conflicts of interest with respect to the research, authorship, and/or publication of this article.
Funding
The author(s) disclosed receipt of the following financial support for the research, authorship, and/or publication of this article: This research was supported by a grant from the National Natural Science Foundation of China (52008006). This research was also supported by a grant from the Beijing Association on Aging.