
Abstract
Amsterdam, a growing city of over 800,000 people in the Netherlands, is struggling to collect waste. While residents in most districts of the city use underground bins to deposit their garbage, the historic Centrum district continues to rely on curbside collection. As such, the streets around the UNESCO-World-Heritage canals are lined with garbage bags as trash trucks rumble down roads centuries old and ill-fitted for vehicles of such size. This paper assesses the viability of moving Centrum trash collection to the canals with a fleet of tug boats and floating dumpsters. It does so by using a combination of GIS tools and integer programming to determine the quantity and optimal collection locations while ensuring that an average Centrum resident walks no farther than denizens of the other Amsterdam districts. Additionally, it proposes a schedule for emptying floating dumpsters based on one comparable to the current truck system. The results of this paper suggest that mobile trash collection using the canals is a viable solution that could reduce noise, pollution, and congestion, thus improving the quality of Amsterdam’s historic cityscape.
Introduction
Amsterdam, a major European port city, has hundreds of kilometers of canals, some of which date from the 17th century. In addition to serving as iconic imagery, the ubiquitous canal network defines the structure of the city and is an anchor of everyday life, as 39% of the buildings in Amsterdam-Centrum are near the edge of a canal.
Historically, canals in Dutch cities “had a combination of functions: trade and navigation, drainage of the settlement itself and—via a network of field ditches—of the water-logged soils of the surrounding landscape, and even (until far into the nineteenth century) waste disposal” (Kingdom of The Netherlands, 2009: 127). However, over the years, Amsterdam’s canals have lost many of their original functions and are instead dominated by small pleasure crafts and tourist boats. The canals are an undeniably character-defining part of Amsterdam, and these historical waterways should perform an equally integral function in the city’s urban life.
This shift in perspective on the role of landscape—as a site for leisure rather than a guiding force for organizing the urban fabric—creates a missed planning opportunity, especially in the case of Amsterdam. Infrastructure networks in general tend to be socio-technical systems composed of many components, and they tend toward “stability or obduracy” (Bulkeley et al.: 1473). However, an important body of literature in urban studies has been advocating for the incorporation of heavy infrastructures as part of the city landscape. Frederick Law Olmstead’s nineteenth-century use of parks and green corridors as part of the urban infrastructure has recently gained renewed attention with projects like New York City’s High Line, which reclaimed a disused elevated railway as a popular park. As Charles Waldheim asserts, “one of the implicit advantages of landscape urbanism [is] the conflation, integration, and fluid exchange between (natural) environmental and (engineered) infrastructural systems” (Waldheim, 2016: 43). Equally interestingly, scholars and practitioners are advocating for including infrastructures as integral parts of urban landscapes, which requires an “intellectual and disciplinary realignment” to account for the public benefits and social demands of these multifunctional systems (Shepard and Genevro, 2017: 110). This method addresses the criticism that “mono-functional approaches to the design of infrastructures have typically segregated the basic provisions of water, waste, transport, food, and energy into separate, unrelated departments” (Bélanger, 2009: 85).
Multifunctionality turns static infrastructures into active ones that not only serve several purposes but also become integral constituents of urban life. In certain projects in Amsterdam, the decision to bury infrastructure (highways and railways) underground has created opportunities for more housing development (Salet, 2008). However, this does not take into account the possibility that infrastructure can perform a multitude of functions. While some cities are retrofitting abandoned infrastructures to create ecological networks of greenways, Kullmann (2013: 49) calls Amsterdam’s canals the “most intact example of a dense grade-separated urban network [that] truly rivals the orthodox grey network.” As the Amsterdam canals are the very identity of the city, regaining the infrastructural function of the canals in their full potential challenges engineers’ and designers’ common practice of hiding infrastructures away from landscapes that are “considered to be scenic” (Thompson, 2012: 13).
And, indeed, the concept of using canals for multiple functions, including waste transportation and other heavy-duty infrastructural tasks, is not novel. In Thailand, Hara et al. (2010) illustrate how agrarian canals, excavated mainly for irrigated rice cultivation, have continued to influence land-use patterns after urbanization. Kulcar (1996) compares waste collection by canal against rail and trucks in cost analyses in Brussels. The primary hindrance for Brussels, as evaluated by Kulcar, was that no waste treatment facility used the canal. This is not the case for Amsterdam, as the city’s incinerator is located right on the canal Aziëhaven. In other parts of the Netherlands, the city of Utrecht has employed a fleet of boats to deliver beer to restaurants and drinking establishments. Moreover, in Amsterdam, Mokum Maritime has been slowly implementing goods delivery and waste removal using barges in a small area in the city; the courier service provider DHL has a floating distribution center, from which bicycles depart and perform the last inland stretch (Janjevic and Ndiaye, 2014). A recent examination of the landscape and planning disciplines calls for the cross-pollination of ecology and design when considering urban environments, which are salient constructed ecologies (Grose, 2014). Lastly, and more specifically, where water is concerned, some argue that landscape can be closely tied to its inhabitants’ behaviors (Ramos and Aguiló, 1988). With this in mind, the Amsterdam canals are a readily available amenity waiting to be fully utilized.
This paper examines the possibility that Amsterdam could reclaim the key role of its canals as an urban infrastructure while still preserving the canals’ iconic stature. As Henriquez and van Timmeren (2017: 220) argue, “there are some cases of ancient water management methods being rediscovered that are proving not only to be cheaper and more efficient than incumbent systems but may also serve as archetypes for novel forms of urban design.” Reclaiming the canals for waste collection has the potential to be one such system, and we investigate this hypothesis by simulating the deployment of a fleet of waterborne dumpsters to improve waste collection in Centrum.
The Amsterdam context
The current waste framework in Amsterdam
This paper focuses on the Centrum district of Amsterdam. Similarly, we employ the city’s delineations of the other seven districts (“stadsdelen”) in the ensuing sections. For simplicity, the remainder of this paper refers to these seven districts (Nieuw-West, Noord, Oost, West, Westpoort, Zuid, and Zuidoost) collectively as the “peripheral districts.”
The city of Amsterdam separates trash into the categories shown in Table 1. This paper focuses primarily on household waste. However, given that most residents do not make the fastidious efforts to separate their trash at home, some of the categories are combined in producing a usable and realistic figure for household waste. Future studies will aim to integrate the sorting and recycling of waste into the design.
Amount of waste per capita in Amsterdam in 2015.
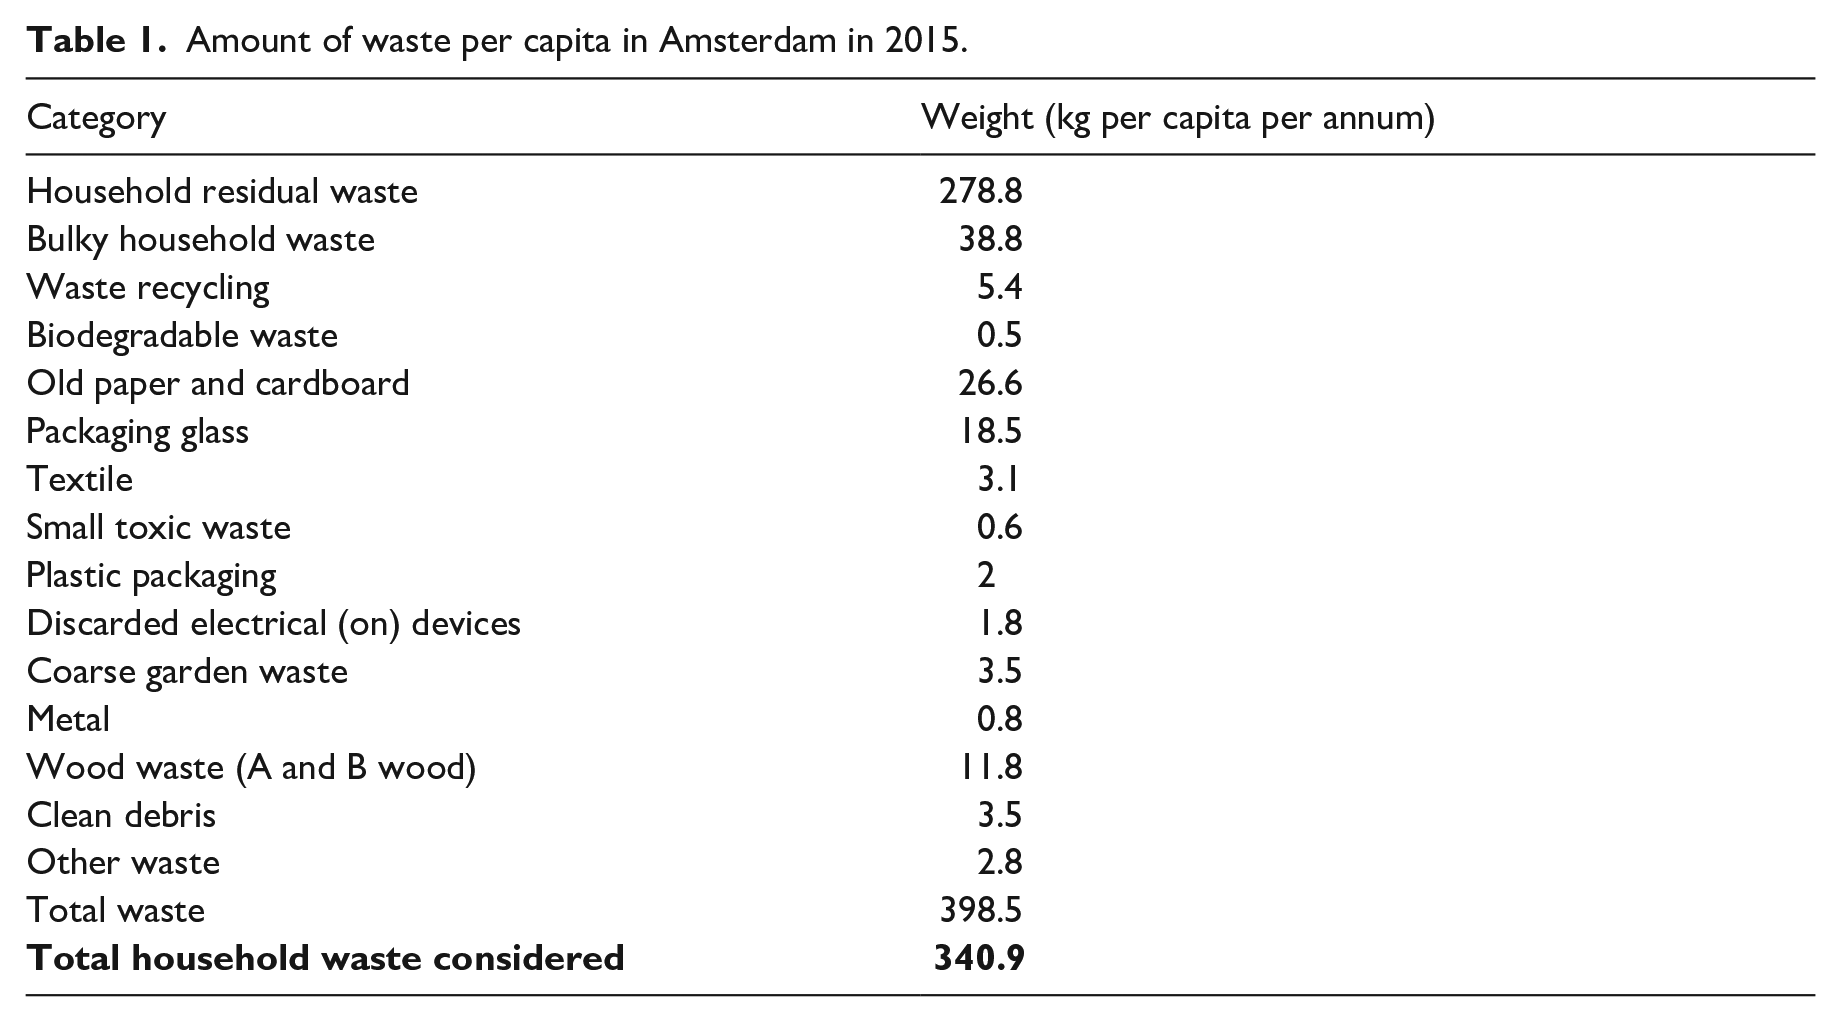
In 2015, the figure for municipal solid waste in Amsterdam was 341 kg per capita (Gemeente Amsterdam, 2015), meaning this city of 844,952 residents (Gemeente Amsterdam, 2018d) produced around 288,129 metric tons of household waste a year, or about 789 tons daily. Typically, in most of the peripheral districts of Amsterdam, residents bring their garbage and recycling to underground containers. These containers are built to last 15 years, and most measure 5 m3 in volume underground and 0.6 m3 aboveground (De Bruijn, 2014). The total volume—5.6 m3—roughly translates to a 1-ton capacity based on the density of 300 lbs/cubic yard (177.98 kg/m3) for uncompressed municipal solid waste (United States Environmental Protection Agency, 2016). The bulk of the trash is stored underground, thereby minimizing the impact on the streetscape.
However, for Centrum’s 86,422 (Gemeente Amsterdam, 2018d) residents and their estimated 29,470 metric tons of waste produced per year, the district relies on a system of curbside collection. Twice a week, residents put out bags they receive from the municipality to be picked up by trash trucks. This results in nuisances (Figure 1) where bags line the streets on collection days. Residents are also frequently fined for leaving their trash outside of the strictly enforced collection window, and such fines can cost at least 50 euros per offense. Of course, any comparison between Centrum and the peripheral districts are affected by the difference in space, social-economic development, and the course of historic development. However, this kind of comparison is still worthwhile as it provides a nimbler solution to a near-universal infrastructural problem that residents of any district would face.
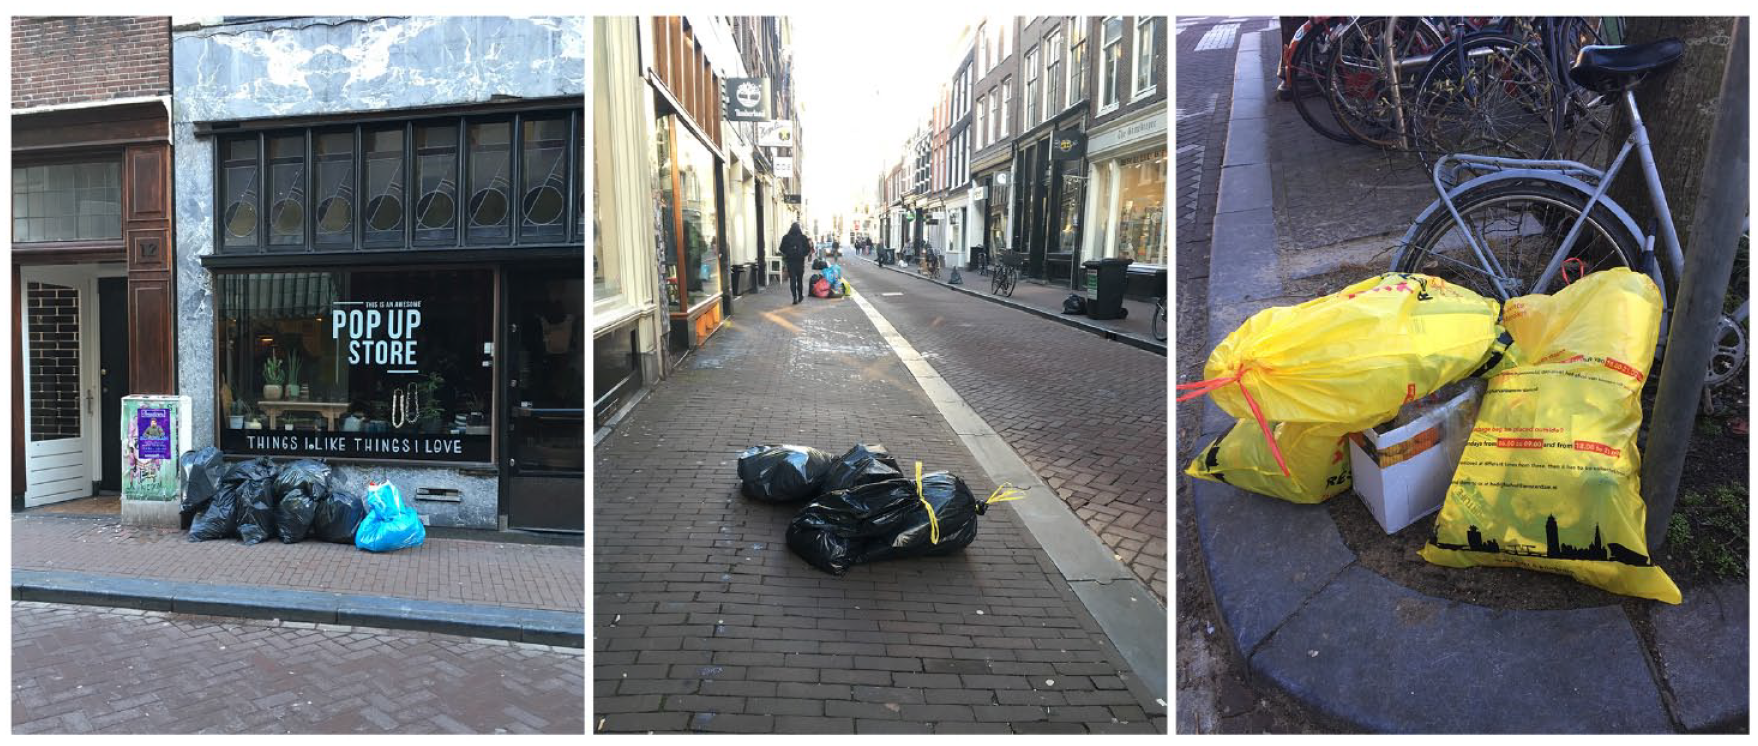
The current trash collection paradigm in Centrum results in streets lined with trash bags on collection days.
Where the trash trucks are concerned, the city of Amsterdam has outlined specific measures for reducing emissions from road traffic. In fact, all of Centrum is within Amsterdam’s “low emission zone,” where trucks heavier than 3,500 kg must meet strict motor standards to gain entrance. These rules are likely to become more stringent in the next decade, when, for instance, buses are expected to be completely emission-free (Gemeente Amsterdam, 2018a, 2018b).
As for the canals, the municipality has implemented equally strict emission policies for cruise boats and other types of ships: all canal cruise boats are required to have zero emission by 2025. This means that using a fleet of electrically powered boats for trash collection will not only alleviate traffic woes and some of the curbside waste problems, but it would also contribute to the city’s long-term emission-reduction goals.
Considering the detrimental effects on the aesthetic and hygienic qualities of the streetscape as well as the traffic, noise, and emissions resulting from the trash collection trucks, this paper aims to study the feasibility of migrating waste collection in the historic Centrum district to Amsterdam’s canals.
Determining the maximum distance
Currently, all peripheral districts employ a network of 5 m3 underground dumpsters to collect their residents’ trash. In order to establish an useful metric with which to evaluate the existing system and on which to build a proposed network, we sought to quantify the longest distances that residents in the peripheral districts are accustomed to walking to the nearest waste container—a value denoted as
Using GIS network analysis, specifically Closest Facility, we determined a subset

Certain districts’ boundaries encompass areas (typically rural or industrial) that are not served by underground dumpsters (shown in Figure 2). In these cases, there exist alternative waste collection options for the affected households. Since we were interested in the households whose occupants habitually walk with their trash to an existing underground dumpster, only such households were considered for the calculations.
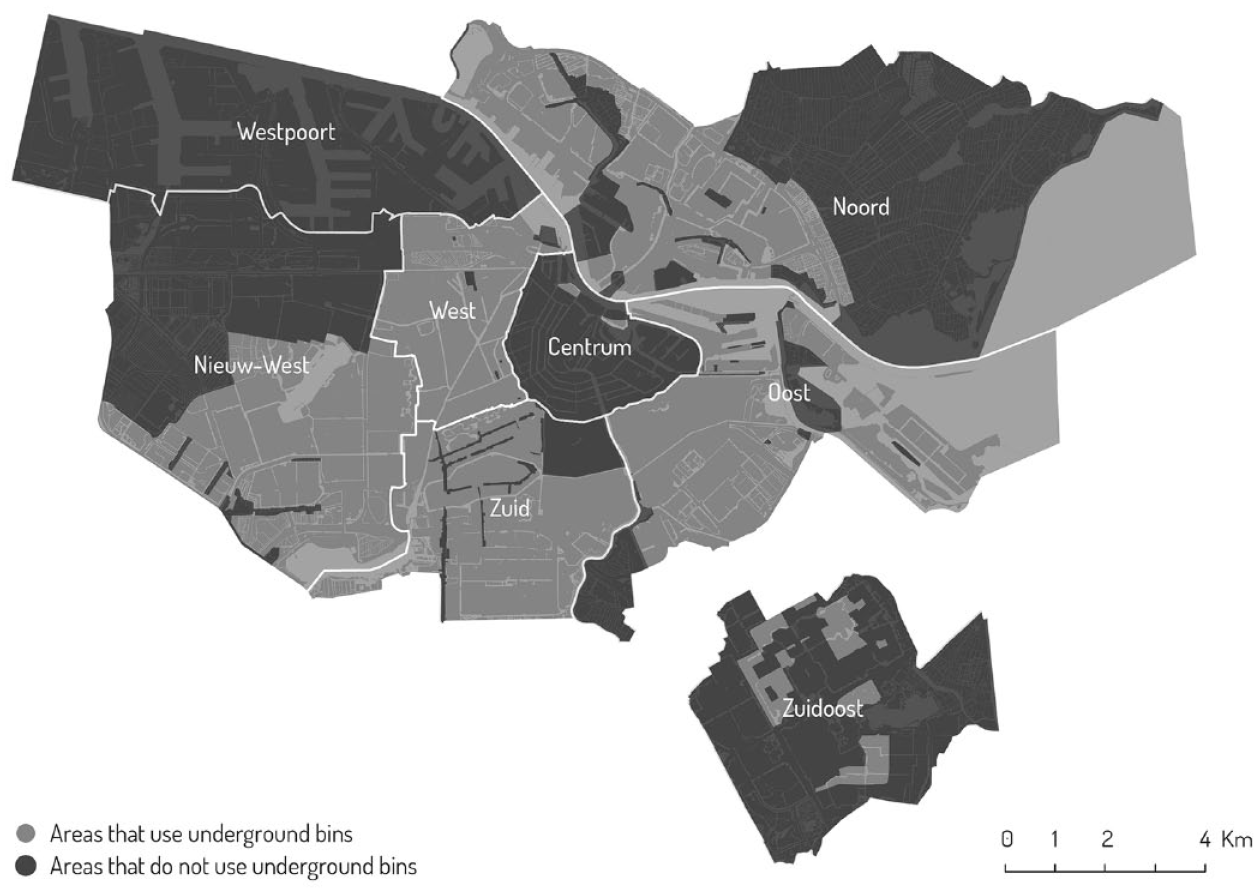
Areas in Amsterdam’s eight “stadsdelens” (districts) that use underground bins for waste collection.
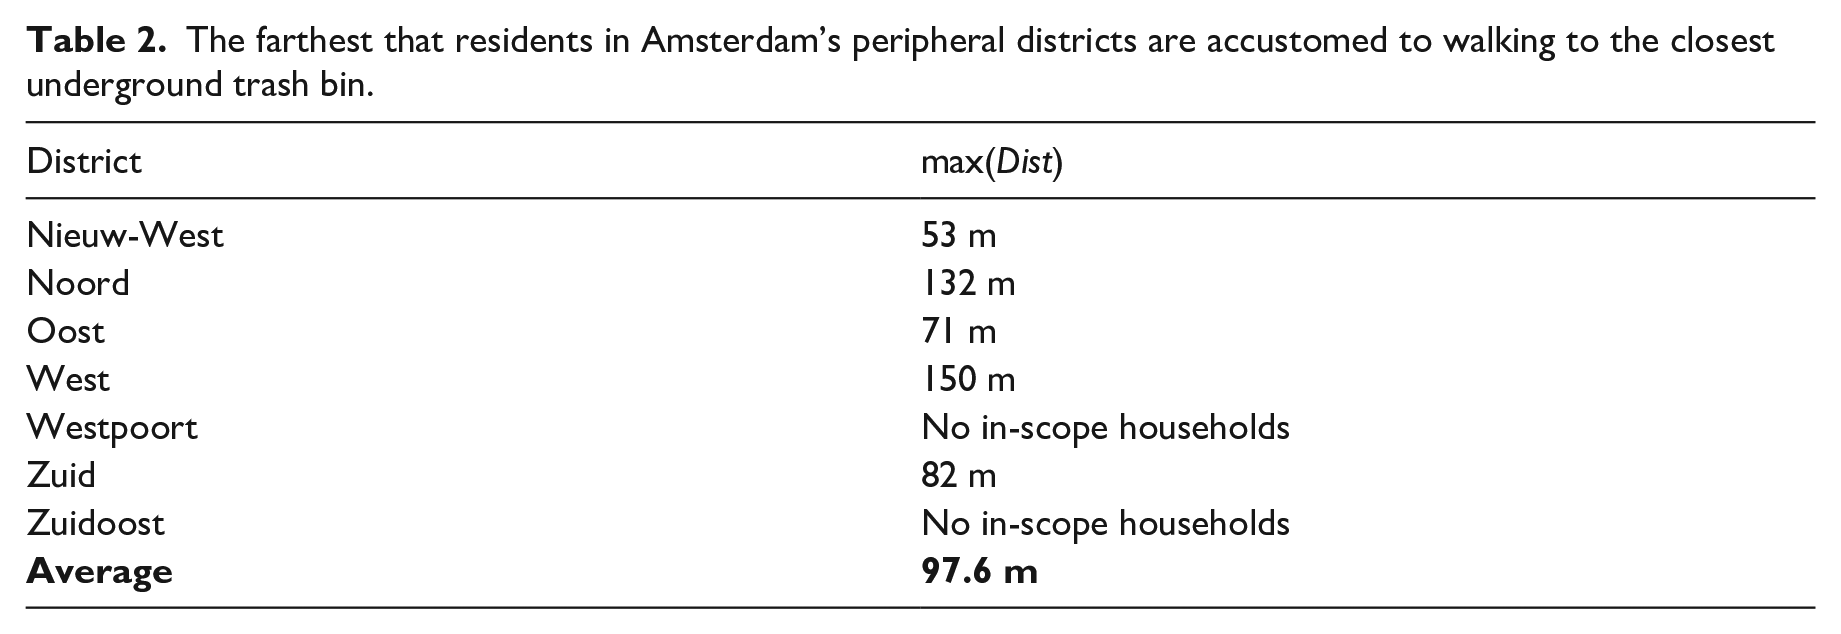
The results for each of the peripheral districts are shown in Table 2. On average, an Amsterdammer outside of Centrum has to walk at most 97.6 m before reaching the closest underground dumpster.
The farthest that residents in Amsterdam’s peripheral districts are accustomed to walking to the closest underground trash bin.
Using the peripheral districts’ underground bins as an example and the maximum distance calculated here as a metric, we sought to identify the optimal collection points for a fleet of floating dumpsters along the Centrum canals. The effectiveness and coverage of these collection points are then analyzed and compared to determine the feasibility of using the Amsterdam waterways as the main waste collection mechanism in Centrum.
Methodology
In order to determine the optimal collection locations, we positioned test points every 10 m along all canal edges, resulting in 6,292 test points in total. Since the heights of the canal walls typically increase as they approach bridges, a buffer zone of 20 m was created around all bridges in which no tests points were placed. This relieves future design tasks from having to negotiate among drastically different topographies. These test points will serve as candidate locations where a floating dumpster could be anchored (Figure 3).
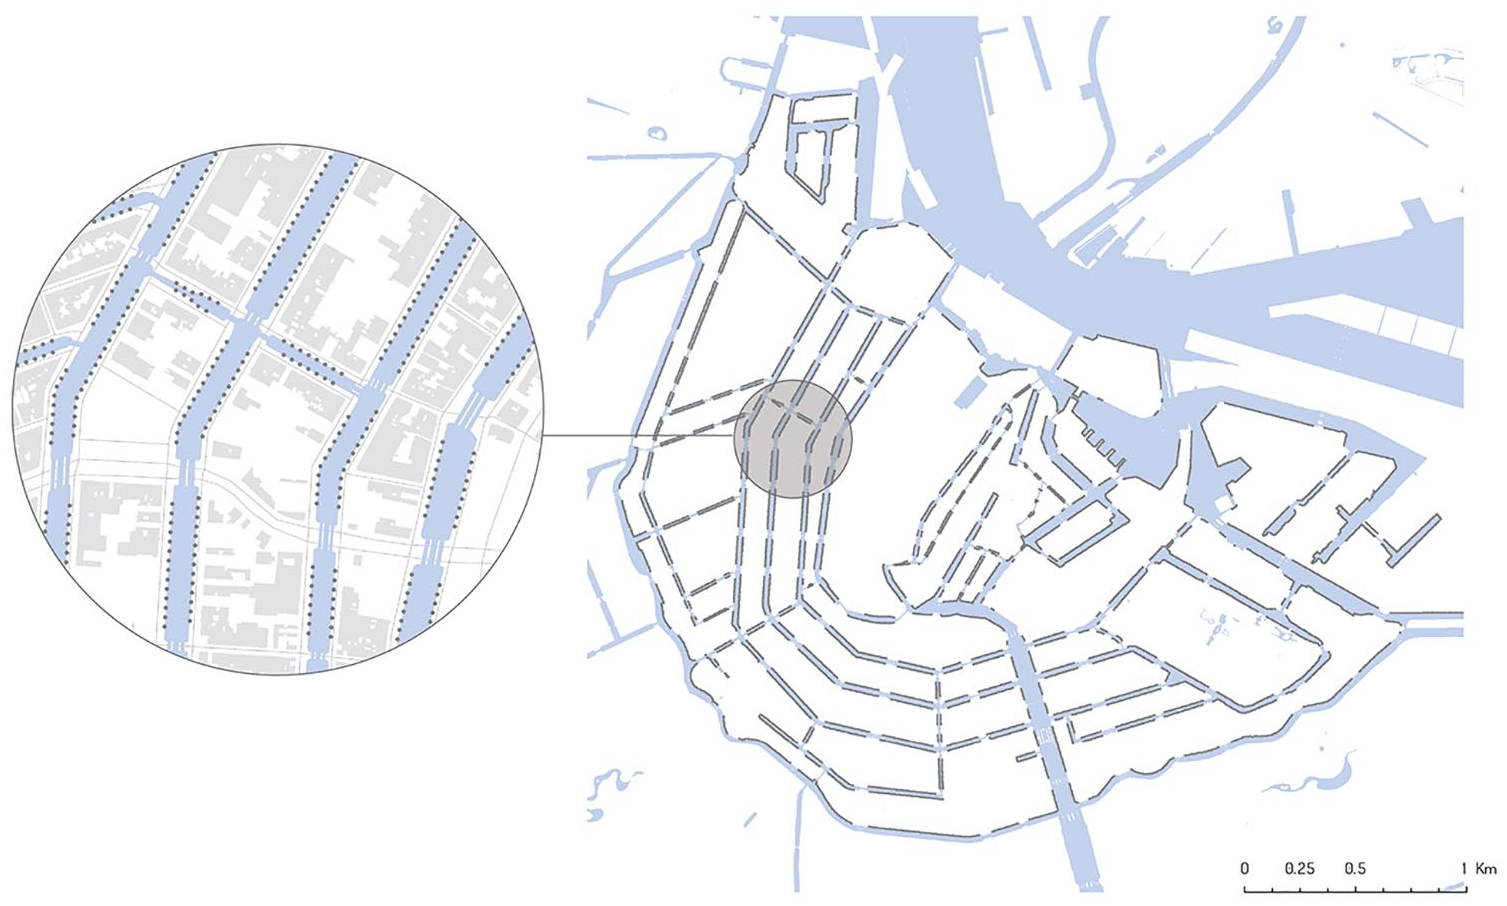
Test points were placed every 10 m along all canal edges. These 6,292 test points serve as candidates for floating dumpster locations.
In order to establish an upper limit to the coverage that this system can provide, we calculated the percentage of Centrum households that are within 97.6 m of walking to the nearest test point — which is the average maximum distance to the nearest dumpster Amsterdammers need to walk in the in-scope area in the other districts. About 70% of total households were identified. Figure 5 shows the in-scope buildings.
The task of identifying the precise locations of the collection points is broken down into three scenarios. First, we compute the smallest number of collection locations required based on the waste output of Centrum. The optimal locations for these collection points were identified while considering all households in Centrum. Secondly, we increased the number of collection points from the baseline to study if walking distances can be reduced and coverage improved. Lastly, we sought to minimize the number of floating dumpsters while ensuring that all households within 97.6 m of the test points are served. The problem was then formulated in three scenarios as follows.
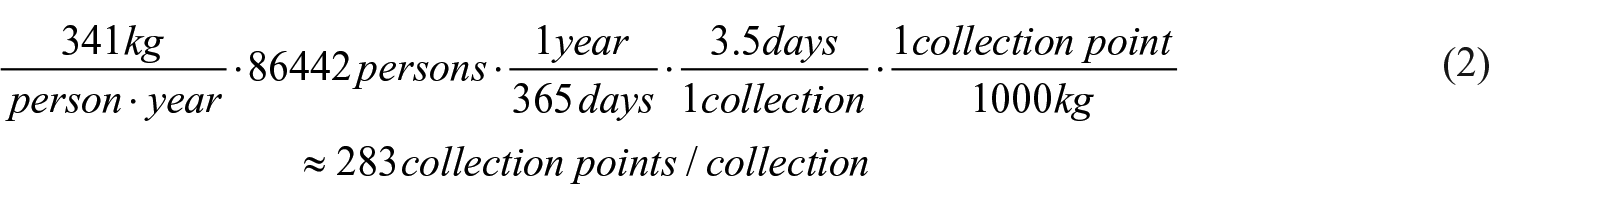
Scenario 1: The lower bound
The method assumes a fixed number of collection locations and aims to locate the ideal subset of test points to serve the entire Centrum district. Given the average amount of trash produced by Amsterdammers—341 kg per capita per year—we concluded, in equation (2), that a minimum of 283 collection points would be necessary to collect the trash twice a week. Since the peripheral districts’ underground bins have an estimated capacity of one ton, we will likewise use one ton as the presumptive capacity of the floating dumpsters for comparison.
Using the Network Analysis Location Allocation tool, ArcGIS Pro is able to identify 283 optimal locations. In this case, the optimization is to “maximize capacitated coverage” with each collection point responsible for no more than 188 households—the upper limit to each floating dumpster’s carrying capacity based on an average of 1.63 people per household. Of course, 283 collection points are needed in the ideal scenario where each dumpster is fully loaded. In reality, since households are not evenly distributed geographically, a greater quantity of dumpsters could be required. Therefore, iterations were run by increasing the number of floating dumpsters to study if walking distances could be reduced and coverage improved. The results of the iterations are presented in Table 3 and compared with scenarios 2 and 3 below. One hundred percent of the households in Centrum were considered in this optimization. It is worth noting here that since the ArcGIS Network Analysis Location Allocation tool was used here, the analysis is bound by the limitations and suboptimality of the solver (Chen et al., 2020). However, only a baseline number of collection points is established here, and a more detailed optimization model is discussed in the next section.
Results from increasing the number of floating dumpster locations.
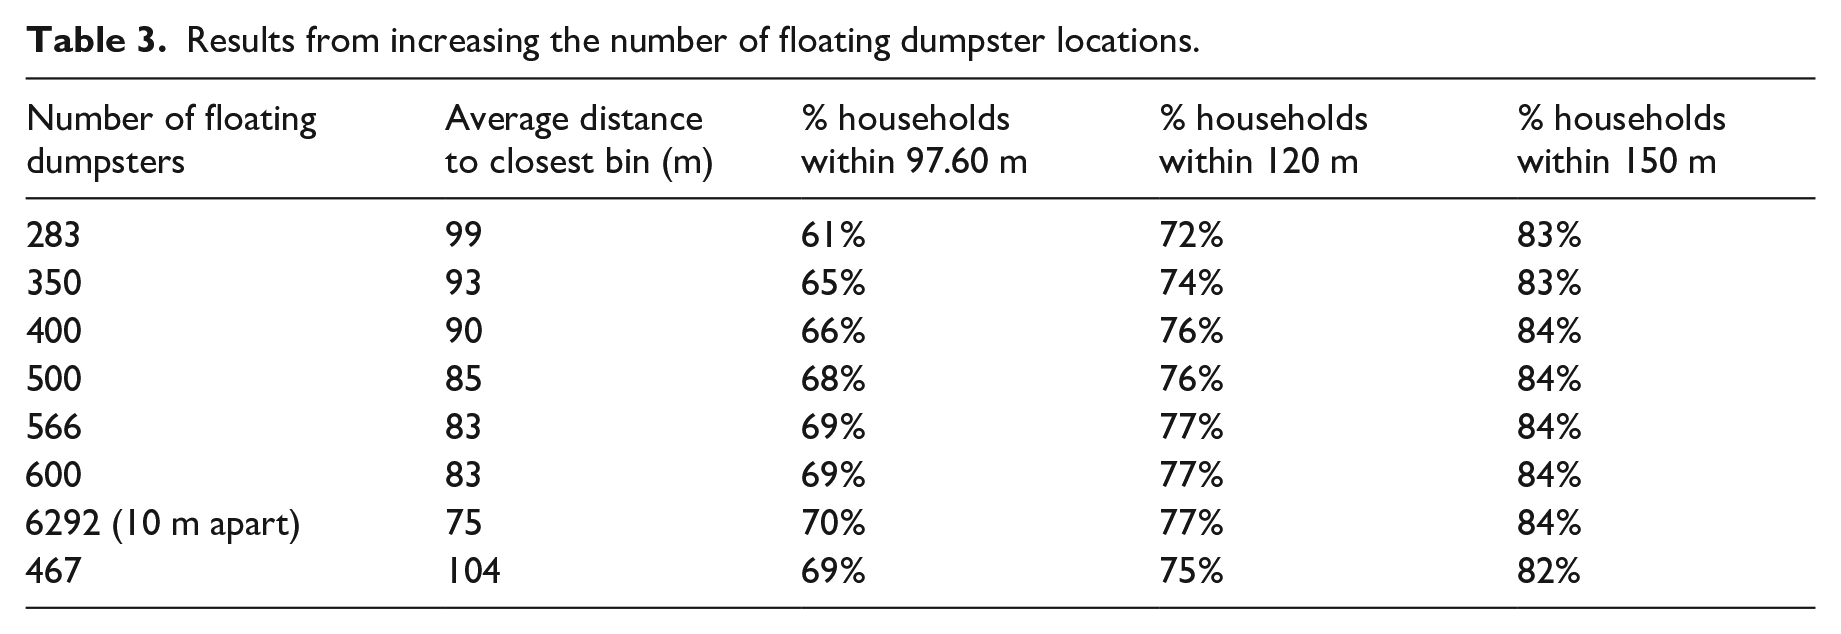
With 283 collection points, the mean walking distance was found to be 98.63 m from any household to the closest dumpster for all households in Centrum. Around 61% (32,387) of all Centrum households have to walk less than 97.6 m, the maximum distance established in Table 2. This coverage is slightly lower than the average of 67% in the peripheral districts. Each of the 283 collection points can serve 188 households, compared an average of 98.2 household per bin in the peripheral districts. These results show that our proposed system is much more efficient, where each collection point can serve more households, with the coverage of the households only a bit smaller.
Scenario 2: Increasing the number of collection points
Having established a theoretical minimum and studied its results, we increased the number of collection points and examined if more households could be served. Two metrics were used in the comparison: average walking distance to the closest dumpster and the percentage of households served within various distances.
As Table 3 demonstrates, increasing the number of points increases the coverage from 61% to 69% while requiring an increase of 184 bins (close to a 65% increase). Depending on the unit and installation cost of the bins, the investment’s diminishing returns should be investigated further in subsequent research.
Scenario 3: Optimizing for the in-scope households
Results from the previous method show insight on the relationship between the number of floating dumpsters and the walking distances for the entire Centrum district. This section examines a variant, where only households within the walking distance of 97.6 m of the test points were considered. With this subset of households, we sought to identify the optimal collection locations for these buildings alone.
To achieve this goal, a mixed-integer programming model is developed to minimize the number of optimal locations for the floating dumpsters subject to the maximum walking distance, 97.6 m. For each of the test points set 10 m apart along the canal edge, a list of buildings within the walking distance of 97.6 m were identified. Household numbers are calculated for each building and used as inputs for the optimization model. The modeling horizon is one week. The complete model formulation is presented as follows:

Subject to


where:
Decision variables
Parameters
Objective function
The objective of function (3) is to minimize the number of locations selected to hold the floating dumpsters.
Constraints
Constraint (4) ensures that there are enough floating dumpsters to hold the waste flow from each household location h.
Constraint (5) ensures that the amount of waste put on the floating dumpster b does not exceed its weekly capacity
Constraint (6) ensures that
Constraints (7) ensures that
The model’s associated FICO Xpress codes are provided as shown in Figure 4.
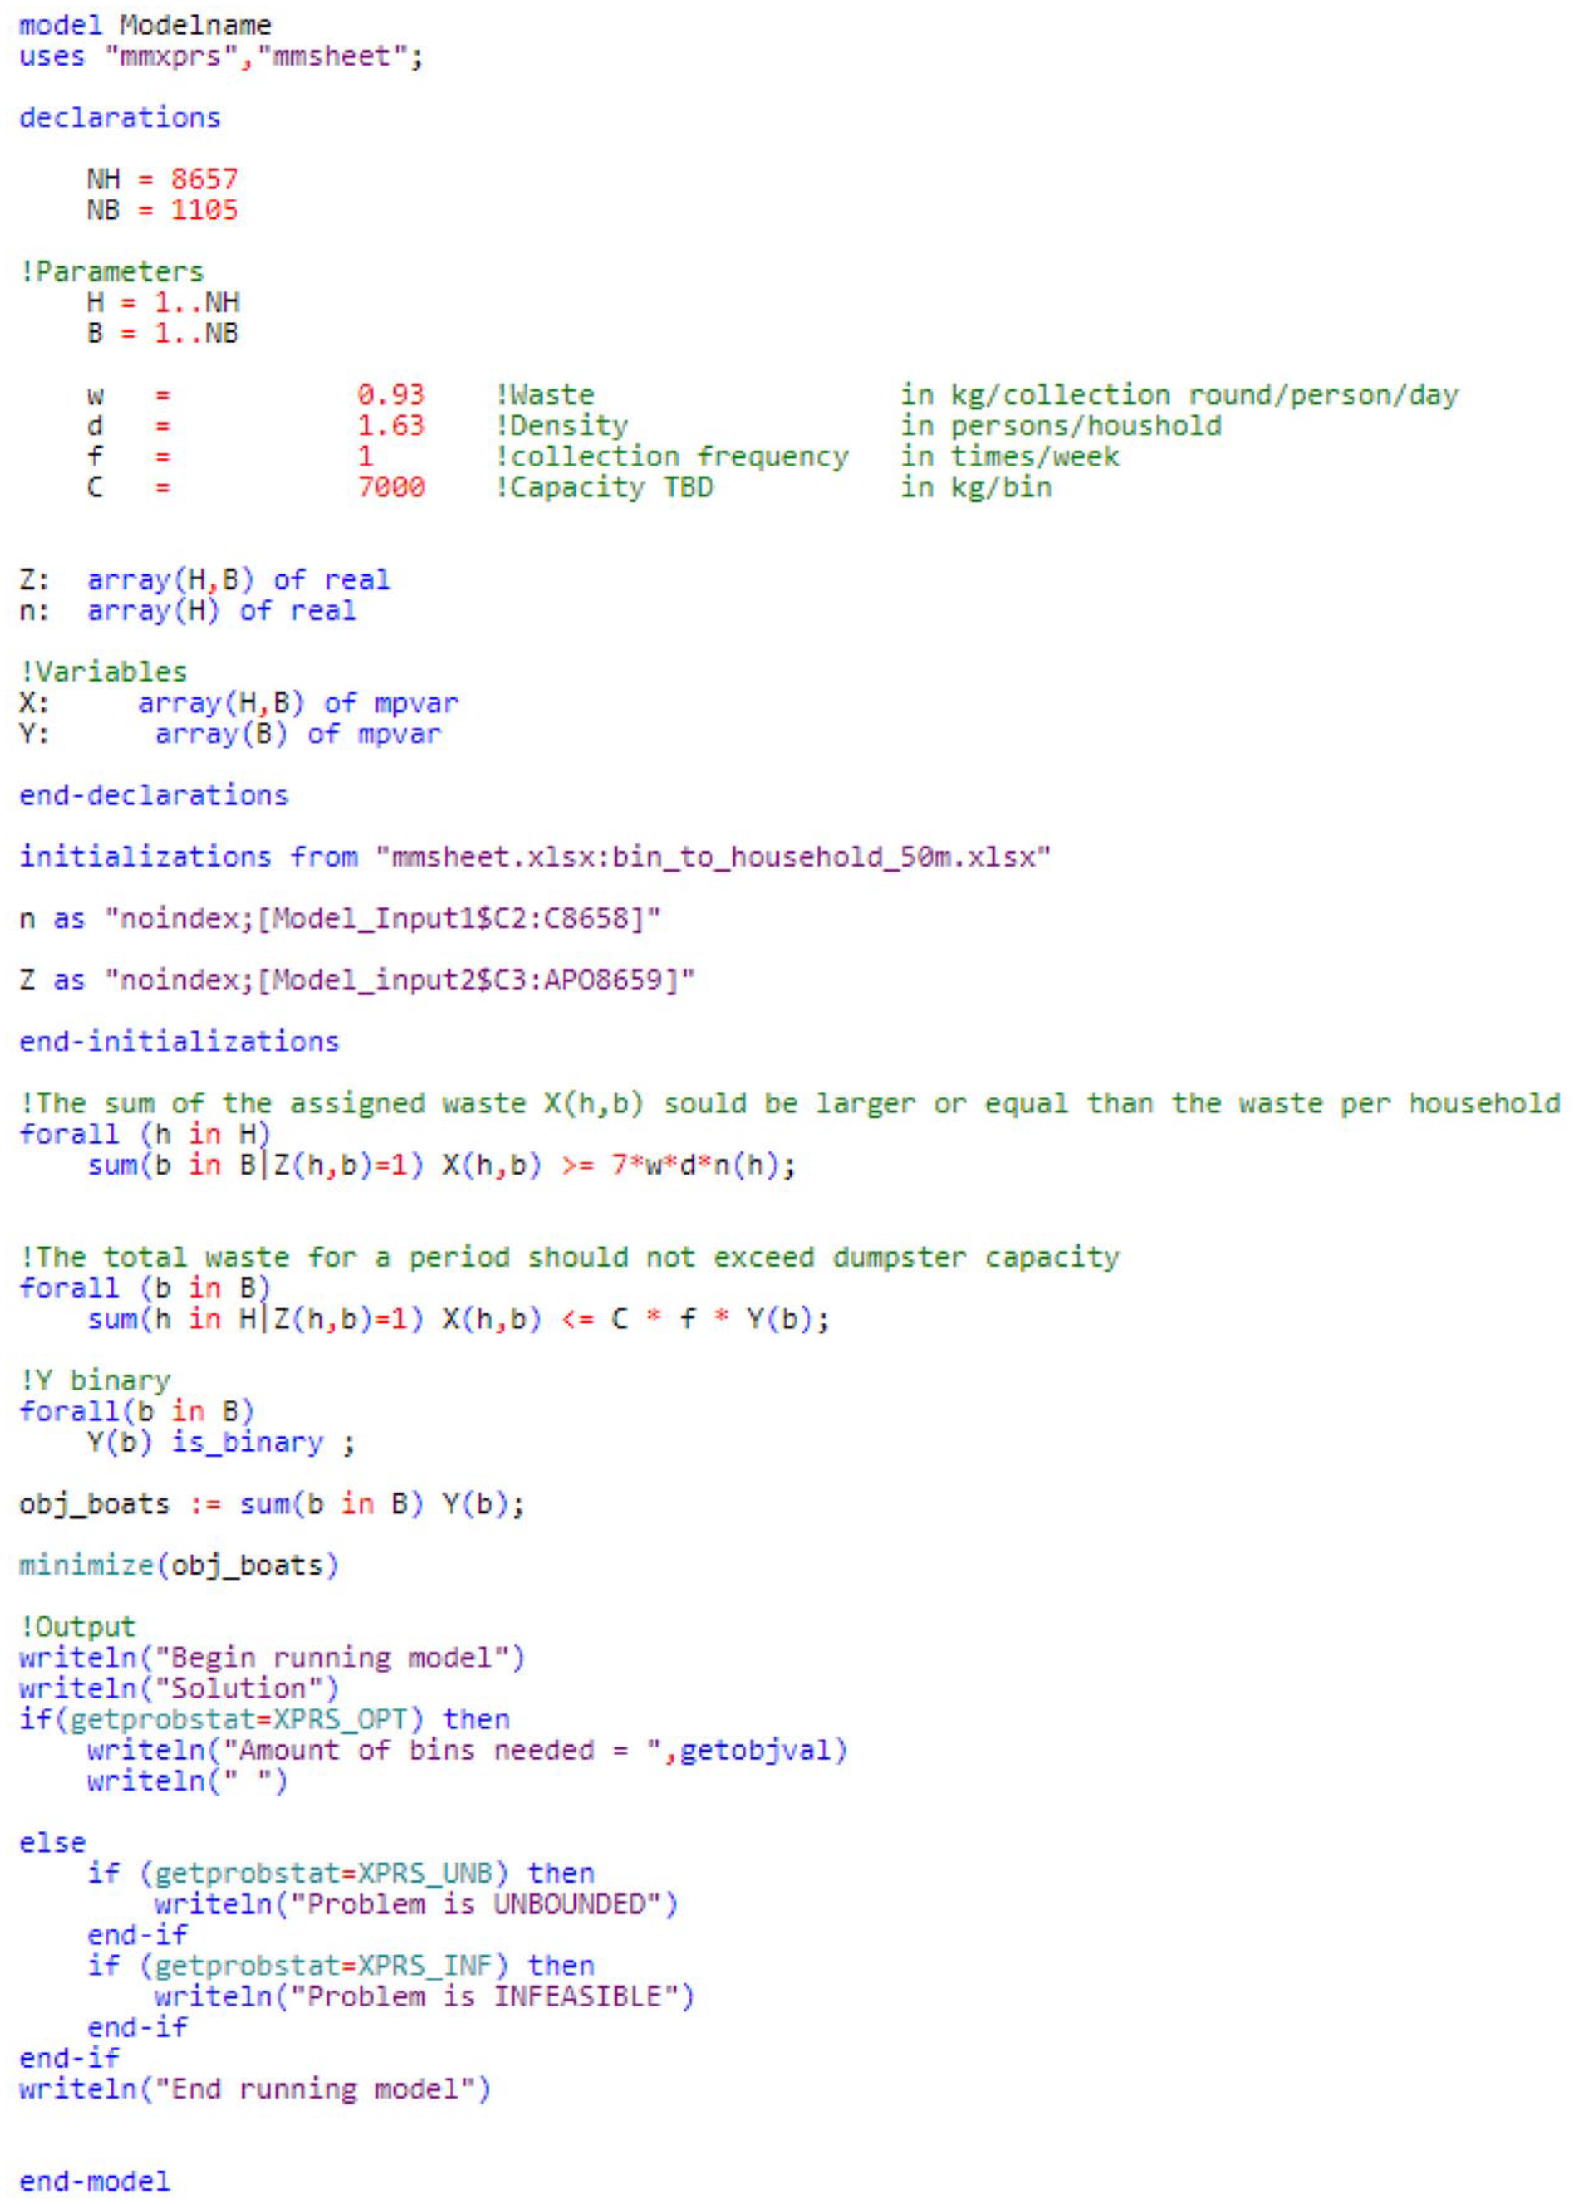
The mixed-integer programming model, executed in FICO Xpress, is provided for reference.
The output of the model indicates whether there is a connection between a household location and a test point, and the subset of test points with connections to households will be the selected locations of the floating dumpsters.
With the mixed integer programming model, when only households within 97.6 m of the test points were considered and their coverage prioritized, 467 test points were selected to hold floating dumpsters. With this result, the coverage slightly improves, but the average walking distance for the entire city increases to 103.78 m. Figure 7 shows the selected test points for 283 floating dumpster locations.
As Table 3 demonstrates, significant increases in the number of floating dumpsters only produced inconsequential growth in coverage and limited reduction in walking distance. In addition, optimizing for households within 97.6 m alone did not produce drastic improvement in overall coverage and actually increased the average walking distance. Therefore, we will use 283 collection points, the minimum number required to carry the projected amount of waste, in further analysis. As mentioned in the discussion of Scenario 1, the assumption for 283 collection points is contingent upon an ideal scenario where each dumpster is used to its fullest capacity and no more. Of course, in future implementation, the city could aim to increase the number of or redistribute the collection locations based on live demands.
In addition, as Figure 2 illustrates, parts of the peripheral districts employ alternative waste collection systems to supplement the underground bins where they are not ideal. As a comparison, we will define similar “in-scope” households as those within 97.6 m of a test point—70% of all Centrum households (Figure 5)—and only consider such households in subsequent analysis. Even though not all of Centrum can be served, there are still enough benefits to be gained from the waterborne setup. From an economic point of view, if 70% of households can be served by the proposal, then the workloads for truck drivers and waste collectors will be reduced by 70%, as would the long-term labor costs. More importantly, the floating dumpsters would eliminate trash bags and collection trucks from most of the city, especially close to the historic canals. This provides significant branding values to Amsterdam as an important tourist destination in Europe.
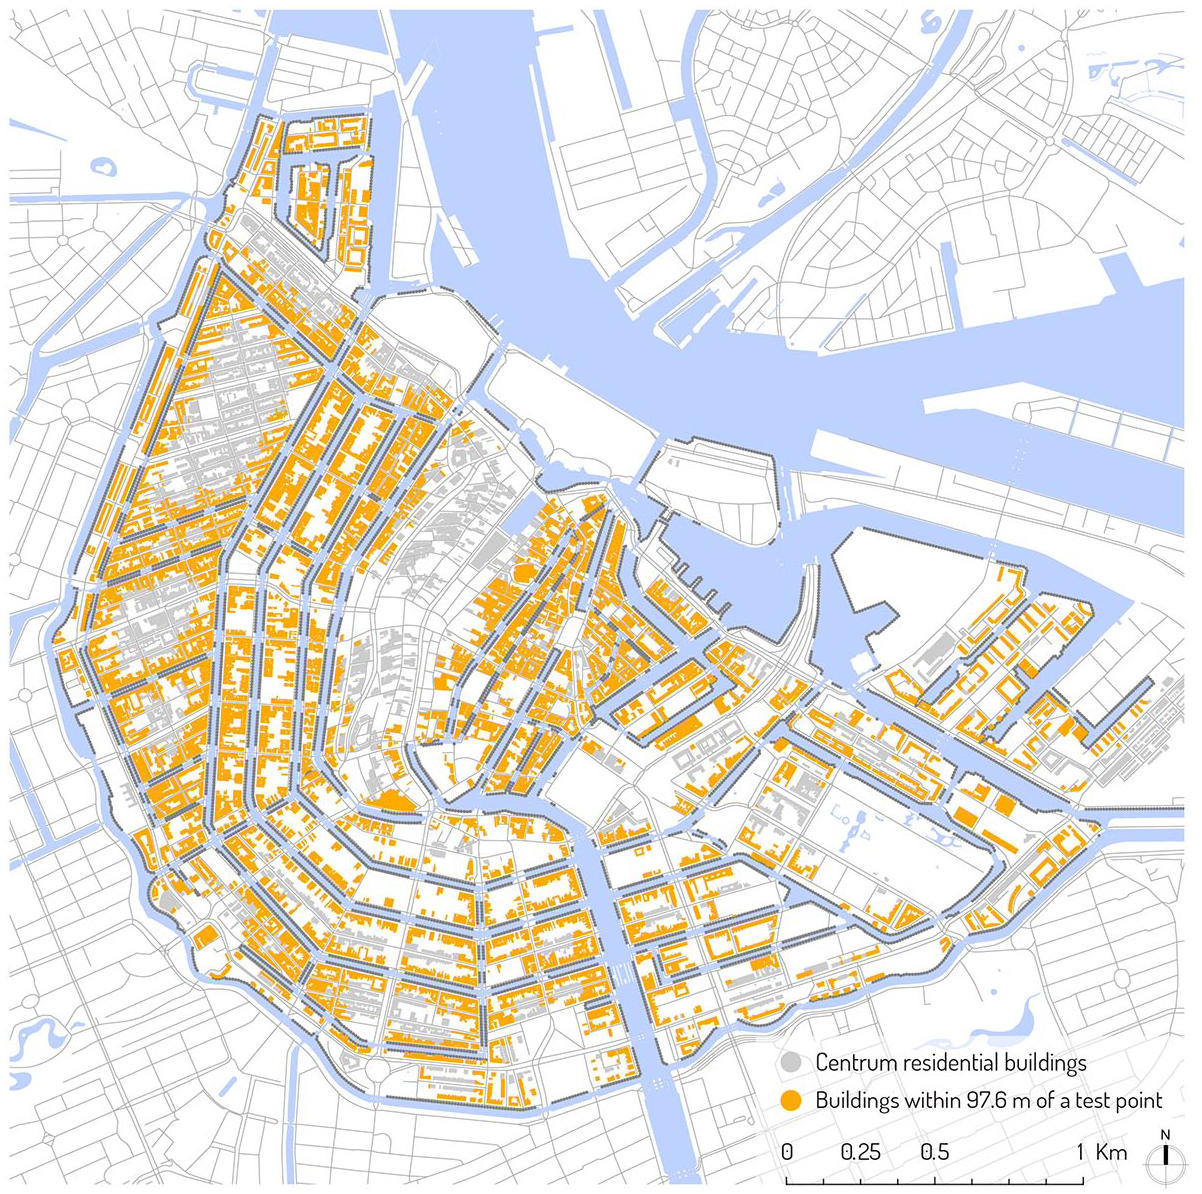
73% of Centrum residential buildings are within a walking distance of 97.60 m of a canal test point. This translates to 70% of the households.
Proposal
The results make it clear that it would be feasible for the majority of households to move their waste collection to the water network in Amsterdam. With a fleet of waterborne vehicles, we propose a system of two parts: tugboats and floating dumpsters. The tugboats are equipped with engines, communication devices, and navigational systems—the brain of the operation. The floating dumpsters—platforms with built-in waste receptacles—do not carry computational power or mobility on their own. However, the floating dumpsters do contain latching mechanisms that allow them to be tethered to each other and to any tugboat for transportation. As shown in Figure 6, each tugboat is responsible for moving a set of floating dumpsters. In an example scenario, one tugboat would tug a group of three floating dumpsters, deliver them to predefined locations for a fixed amount of time, and, upon the expiration of their collection time, the tugboat comes by again to take the floating dumpsters to the incinerator to be emptied and then continues to deliver them to the next set of collection points.
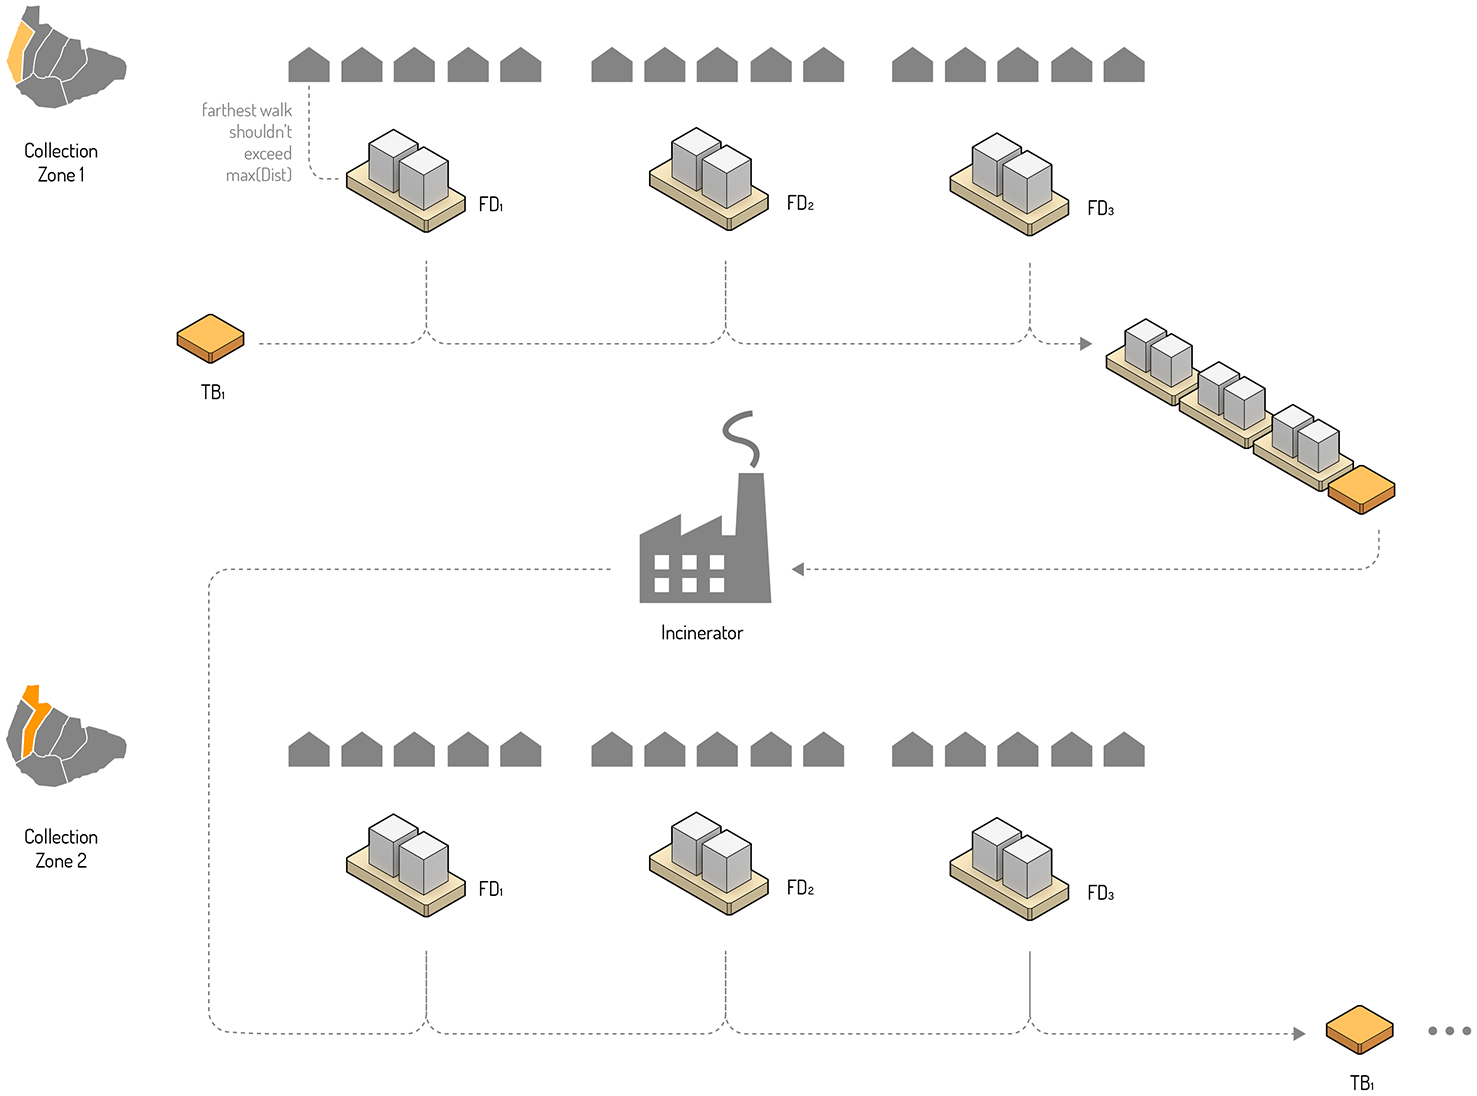
The proposed waste collection system using floating dumpsters and tug boats.
Once the optimal collection points have been identified, we sought to construct a schedule and zoning map to help determine how many floating dumpsters were needed to cover the collection points. As mentioned above, the proposal relies on a mobile network of floating dumpsters that will be moved by tugboats from one collection zone to another. The current, truck-based schedule and zoning map divides Centrum into six areas, and residents of those areas are instructed to put out their household trash on the curb on the designated day. The zones are also distinguished by collection time, where “day” indicates 07:30–15:30 and “night” indicates after 17:00 (Gemeente Amsterdam, 2017).
Since the delineation of the current map was designed to service a network of trucks, we sought to realign the map along the canals while keeping the current collection schedule. This helps residents who are accustomed to the schedule maintain a maximum amount of familiarity while adapting to the newly proposed system.
In producing the new collection map, the main consideration was the number of collection locations in each zone and the total travel time for the tug boats. In other words, the ideal zoning map would distribute all collection locations as evenly as possible while ensuring the routes that the tugboats take to collect them is the shortest. The motivation to minimize travel time is self-explanatory; the desire for even distribution warrants some further clarification.
As Figure 6 shows, the core of the system is mobile, where one set of floating dumpsters is dispatched to a different collection zone each day. As such, the maximum number of floating dumpsters needed is reflected by the quantity in the zone that is the most demanding. Therefore, a zoning schemata that evenly distributes the optimal locations would result in the smallest number of requisite floating dumpsters.
In order to generate such a map, the ArcGIS Pro Network Analysis tool was used to produce the optimal route in the canals connecting all the collection locations. Subsequently, the route is divided in six parts, where each part contains an equal and integral number of collection locations. These zones are then assigned a collection date and time based on the existing paradigm.
Since the floating dumpsters have the capability of being mobile, the actual number of floating dumpsters needed is much smaller than the number of collection points. When these 283 collection locations are divided into zones, the maximum number of floating dumpsters Centrum would actually need is 48. Figure 7 shows the optimal zone division and shortest collection route generated for 283 collection points using 48 floating dumpsters. In actual implementation, however, the city may choose a more visually legible way of zoning the floating dumpsters. It could result in longer travel times for the tug boats but might pose as a worthwhile trade-off for the purpose of public communication. Regardless, since the actual number of floating dumpsters needed is much smaller (i.e., 48), the system is significantly more efficient in actuality, where each of the 48 floating dumpsters can serve 1,106 households.
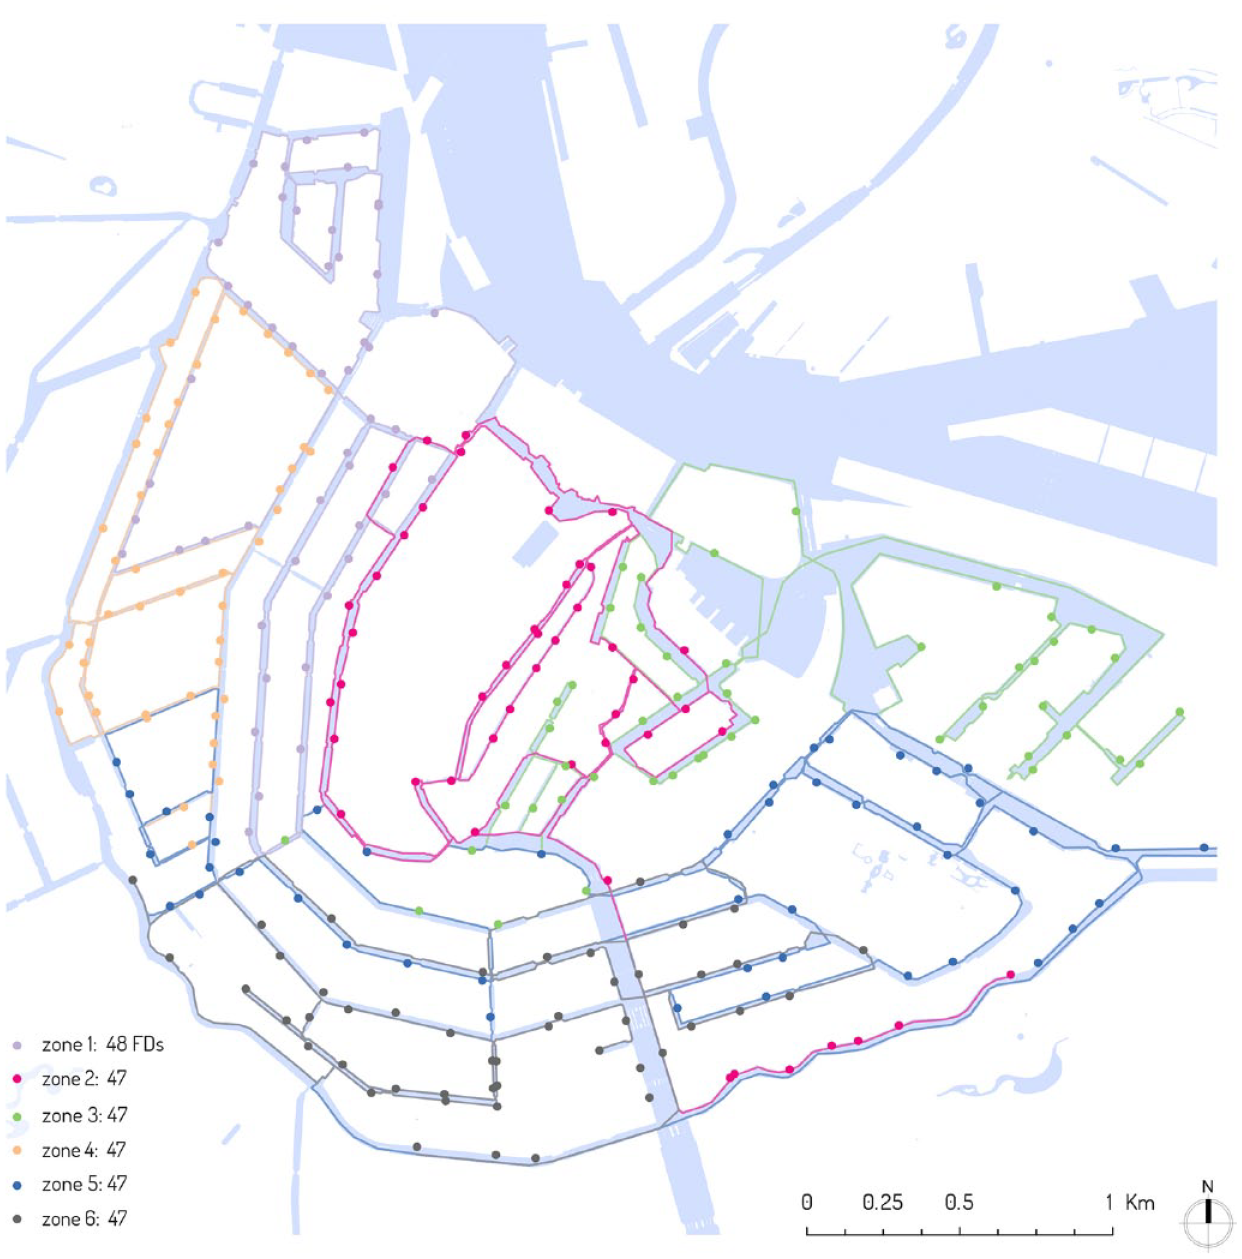
Proposed collection zone based on the shortest traveling paths for tugboats.
Comparing the proposed system in Centrum to existing paradigm in the peripheral districts
In this section, we tabulate the output from the previous section against the existing underground bins in the peripheral districts to evaluate the effectiveness of the proposed waterborne network in Centrum. More specifically, there were two measures that we used in the comparison: household-to-dumpster ratio and the percentage of households served within 97.6 m.
Bin-to-household ratio describes the number of households that each bin in the respective districts serve. This metric evaluates the efficacy of the systems in question. As shown in Table 4, with 48 floating dumpsters, each location is responsible for 1106 households in Centrum, which drastically outperforms the average (92 households per bin) in the peripheral districts. Of course, such a mobile system of waste collection likely increases the cost of transportation and energy consumption. Cost analysis is beyond the scope of this paper but could serve as an interesting topic for subsequent research.
Comparing the efficiency of 48 floating dumpsters in Centrum to that of the underground bins in the peripheral districts. Only in-scope households were considered for the comparison.
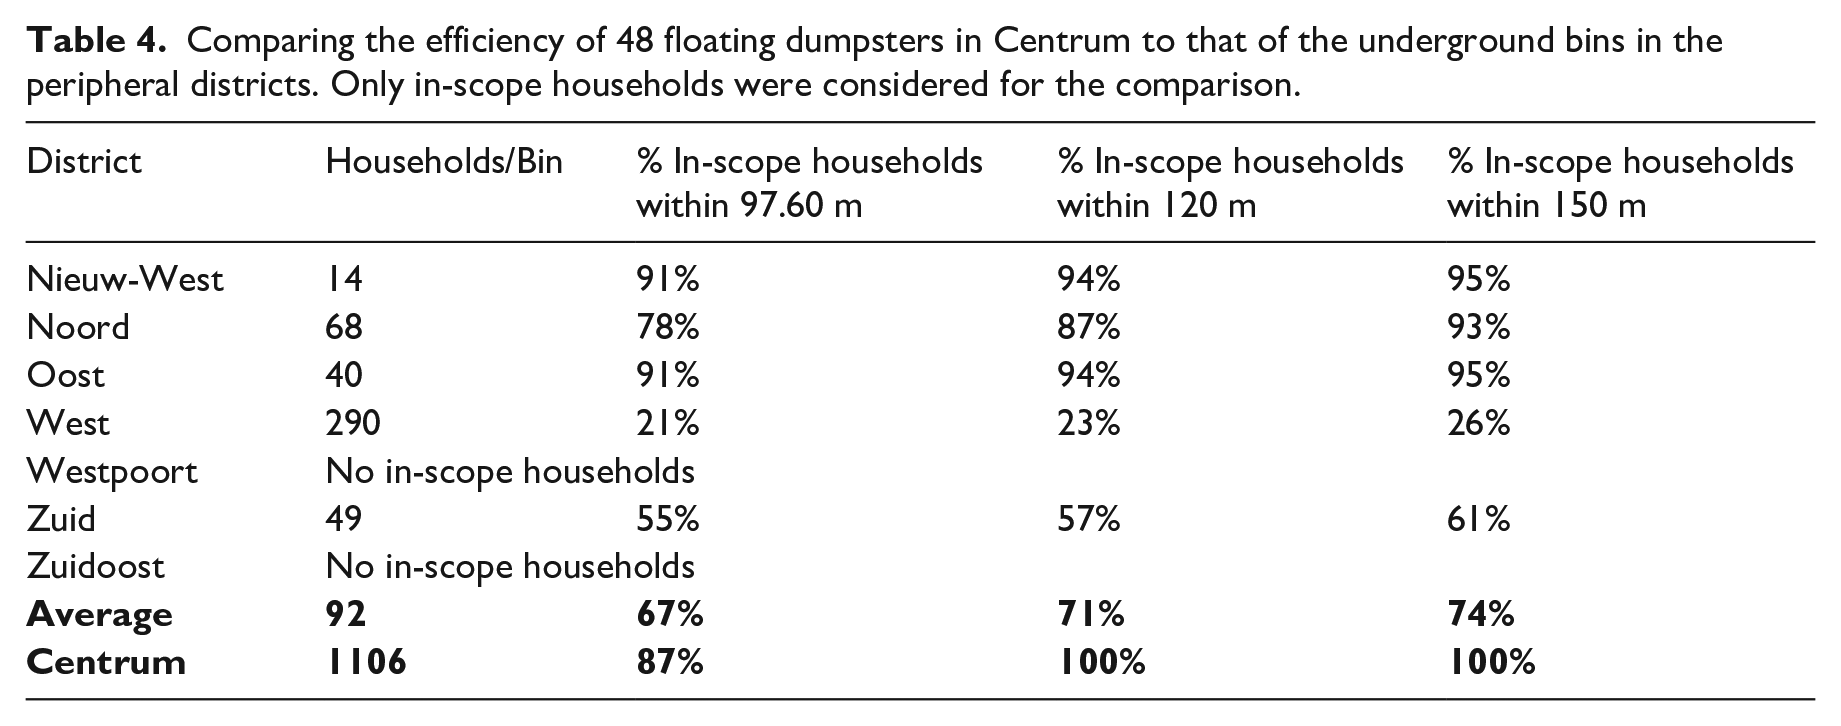
In addition, we determined in Section 2.2 a measure for the farthest distance that an average Amsterdammer in the peripheral districts is used to walking with their trash. In the comparison, therefore, it is imperative to evaluate the percentage of households that are actually served within that distance. As Table 4 shows, on average, about 67% of the households in the peripheral districts are within 97.6 m of an underground bin. Using the 48 canal-based floating dumpsters, a much higher percentage of the in-scope households (87%) are served within the same distance in the Centrum district. In addition, 100% of the in-scope households could be served if the residents are willing to walk up to 120 m, compared to an average of 71% in the peripheral districts.
In summary, the mobile waste-collection infrastructure created by the fleet of floating dumpsters and tugboats requires significantly fewer dumpsters to serve more households at comparable walking distances.
Given that the coverage of the proposed system for Centrum is structurally limited by the size of the islands, we suggest that the city test the proposal within the Amsterdam Canal District, where access to the canal edge and thus to the floating dumpsters is much more expedient.
Discussions and conclusion
The results have demonstrated the effectiveness of using a fleet of tugboats and floating dumpsters to fulfill the task of waste collection in Amsterdam-Centrum. This section explores further qualitative advantages of the system and identifies opportunities for future research.
This paper primarily focuses on the collection of household waste in the Centrum district. However, the floating dumpsters can play a key role in source separation when recyclables and other types of waste are added to the equation. Since the current paradigm requires that residents take different types of trash to distinct locations, the inconvenience and complexity frequently results in lower recovery rates for the recyclables and environmentally harmful waste. In response, Amsterdam is keen on significantly improving separation rates by 2020 (Gemeente Amsterdam, 2018c). The floating dumpsters, therefore, could serve as aggregated points of collection equipped with clear directions on waste separation.
Outside of Centrum, the City of Amsterdam has planned to construct artificial islands by the IJ, many of which will be used for housing units. Since a majority of these constructions will be directly situated on the water, tugboats and floating dumpsters appear to be the natural solution for their waste management needs. As mobile infrastructure, the system we propose in this paper has the merit of being able to respond flexibly and quickly to growing and volatile demands.
Furthermore, with the demonstrated efficiency compared to existing paradigms, the proposed fleet of waste-collecting vehicles has the potential to provide infrastructural improvements in other water-based cities, where the need for a nimble waste collection system is even more dire. Or, as a corollary, said system can serve as temporary relief to disaster-stricken zones, where a robust permanent solution would take months to plan and implement.
Lastly, in order to truly arrive at an optimal number of floating dumpsters, we would ideally incorporate the cost of production for the hardware. Speculating on the cost factor is out of the scope of this paper, but future studies will aim to include it for accuracy.
On autonomy
Beyond the benefits that would result from substituting water vehicles for trash trucks, this section investigates the advantages autonomy might bring to such a system.
In recent years, autonomous technology has become the focus of scientific research and development. It has been shown that the emergence and popularity of self-driving vehicles could lead to more pedestrian-centric cities (Millard-Ball, 2016). Where cars are concerned, autonomy significantly improves safety and reduces traffic congestion (Dresner and Stone, 2005). Although most of the literature thus far has focused on autonomous land vehicles, the boons are analogous for waterborne options. In Amsterdam specifically, a water-based trash collection system is well positioned to take advantage of autonomous technologies in order to create a nimble urban service.
Even in the current, still nascent stage of autonomy development, rendering the tug boats self-driving can significantly improve the waste collection paradigm proposed in this paper. Autonomy is most easily implemented when the tasks are predictable, and, while waste collection sometimes does respond directly to demand, it by and large is a rigid system. Routes are fixed and predictable, and users are accustomed to a schedule. In the case of household waste, quantities do not tend to fluctuate wildly from week to week. Incidental waste, such as construction debris, or bulky waste, like furniture, is deposited in designated locations and not collected along with household waste. Consequently, the task of household waste collection would be a suitable candidate subject for automation.
In addition, by introducing the driverless element, trash collection can potentially occur outside of peak hours or auto-adjust collection time based on a combination of traffic and demand. Simultaneously, in the age of big data, such a fleet of autonomous waste-collection boats can be used to gather higher resolution information on waste-related behaviors and patterns. This granulated data could then reinforce the proposed system.
Conclusion
In this paper we consider the feasibility of using a combination of tug boats and floating dumpsters to fulfill the task of bi-weekly waste collection in the Centrum district in Amsterdam. Three scenarios were considered in finding the optimal locations for the floating dumpsters, and a collection schedule was subsequently calculated. The system’s efficiency was compared to that of the existing underground bins in the other Amsterdam districts, and the results show that the proposed solution can effectively serve 87% of the in-scope households. The coverage rises to 100% if residents are willing to walk a bit farther. This suggests that using a set of floating dumpsters and tug boats for waste collection in Amsterdam-Centrum would improve the city’s streetscape while efficiently solving its waste problem.
Footnotes
Acknowledgements
The authors would like to thank Allianz, Amsterdam Institute for Advanced Metropolitan Solutions, Brose, Cisco, Ericsson, Fraunhofer Institute, Liberty Mutual Institute, Kuwait-MIT Center for Natural Resources and the Environment, Shenzhen, Singapore-MIT Alliance for Research and Technology (SMART), UBER, Victoria State Government, Volkswagen Group America, and all the members of the MIT Senseable City Lab Consortium for supporting this research.
Declaration of conflicting interests
The author(s) declared no potential conflicts of interest with respect to the research, authorship, and/or publication of this article.
Funding
This project was funded by the Amsterdam Advanced Metropolitan Solutions.