
Abstract
Purpose
This study examines whether machine learning approaches can effectively solve the portfolio selection and optimization problems related to Real Estate Investment Trusts (REITs)-mixed portfolios. It also investigates the impact of different proportions of Equity-REIT (EREIT) and Mortgage-REIT (MREIT) on portfolio returns.
Study design
This research collects daily data from 157 EREITs and MREITs, totaling 1,283,800 observations, and construct 126 portfolios in the U.S. market, covering the period from January 1, 2000, to July 31, 2022. Using a genetic algorithm (GA), we optimize REITs combined with stocks, bonds, and gold, and compare GA’s performance with the classical mean-variance (MV) method. To assess robustness, authors also perform sub-period testing to examine portfolio performance under adverse economic conditions.
Findings
The results show that the GA outperforms the MV method in optimizing REIT-mixed portfolios, especially during periods such as the pre-Global Financial Crisis (GFC) and COVID-19. Portfolios with higher allocations to REITs exhibit superior returns, with EREIT outperforming MREIT in enhancing returns and controlling risk. However, MV shows better results in some low-volatility periods, such as during the GFC.
Contributions
This study advances existing literature by applying machine learning techniques—specifically genetic algorithms—to the optimization of REIT-mixed portfolios. The contributions include demonstrating the effectiveness of GA in achieving better risk-adjusted returns compared to traditional methods, providing practical insights for investors on optimizing their portfolios in volatile markets. Additionally, it highlights opportunities for researchers to further explore the integration of heuristic methods in portfolio management, expanding the understanding of portfolio optimization in the context of REITs.
Implications
Our findings provide practical implications for investors and portfolio managers, demonstrating the benefits of GA-based optimization in the REIT sector, particularly in turbulent market conditions.
Introduction
With the rapid development of computing technologies in recent years, using machine learning algorithms to deal with different problems has become popular. Machine learning approaches have been widely used to solve problems in different areas, such as the development of national economies (Helbing & Balietti, 2011; Jordan & Mitchell, 2015; Mittal et al., 2019), social culture (Yasser et al., 2017), medicine (Cabitza et al., 2017; Sidey-Gibbons & Sidey-Gibbons, 2019), city development (Chin et al., 2017; Sumi et al., 2012), cybersecurity (Dua & Du, 2016), and for many social problems such as education and e-government (Alexopoulos et al., 2019; Rawat & Malhan, 2019). Ma and Sun (2020) indicate that different machine learning approaches provide researchers with different insights, driving them to extend different machine learning algorithms in new areas. Further, machine learning is increasingly being applied to financial analytics in the areas such as stock and real estate investment trust (REIT) (Swinkels, 2023).
A REIT is a publicly offered fund that allows people to invest in real estate without physical purchase. REITs invest in real estate related industries, including the properties and mortgages, so REITs can be divided into Equity-REITs (EREITs) and Mortgage-REITs (MREITs), depending on the main businesses and income sources. EREITs typically acquire, manage, build, and sell properties, such as office and retail, residential, industrial, hotels, and hospitals. The revenue of EREITs is mainly generated from rental and selling incomes. MREITs acquire the existing mortgage or mortgage-back securities and even lend money to the real estate buyers. Interest is the main incomes of MREITs, but they are more sensitive to credit risk and interest rate change (NAREIT, 2020). MREITs are also exposed to various of risks, such as repayment risk, liquidity risk, and reinvestment risk. These risks have resulted in previous studies rarely including MREITs. However, this paper provides comprehensive analysis of the REIT market via studying both EREIT and MREIT.
Although the trading mechanisms of REITs are similar to those of stocks, there are fundamental differences between REITs and stocks. REITs perform and behave less like traditional stocks and more like stand-alone financial products within an investment portfolio. First, the average turnover ratio of REITs is 115% lower than that of traditional stocks, and the number of financial analysts covering REIT companies is significantly lower than those covering other stock companies (Sahin, 2020; Wang et al., 1995). Second, REITs exhibit a distinct risk-return profile compared to traditional stocks. REITs tend to offer higher dividend yields and display different price volatility patterns, influenced by real estate market dynamics (Morawski et al., 2008). While traditional stock companies can use retained earnings to reinvest in various industries, REITs are constrained to investing in real estate and are required to distribute 90% of their taxable income as dividends annually. Third, REITs show low co-movement with stocks and bonds, as well as low volatility and inflation-hedging capabilities (Sebastian & Steininger, 2022). Kroencke et al. (2018) also highlight that REITs have lower correlations with broad stock indices, suggesting that REITs can offer diversification benefits within a mixed-asset portfolio. This lower correlation is attributed to the unique drivers of REIT performance, such as real estate market conditions and property-specific factors. Finally, compared to bonds, REITs are often seen as income-generating assets due to their mandatory dividend payouts. However, income from REITs can be more variable compared to the fixed coupon payments from bonds (Morawski et al., 2008).
In addition to the aforementioned differences from stocks, REITs are also assets that are more stable for diversifying risks in a portfolio compared to stocks. The dividend payout policy of REIT promises the portfolios’ stable cash flows. Empirical studies indicate that REITs have a median dividend payout of 111% of gross income and this payout has little effect on price (Ghorashi & Darabi, 2017; Razak, 2023). Case et al. (2012) find that the correlation between REIT and stock fluctuated without trend within the range of 59–76% from 1991 to 2008, but the significant correlation causes the increasing return of REIT-stock portfolios. They also suggest that increasing the share of REITs in the portfolio will increase returns and reduce risk. Rees and Sevtap Selcuk-Kestel (2014) claim that there is no linear relation between the prices of the United States (US) retail REIT and mixed stock portfolios; they then build portfolios among 9 REIT stocks, with results showing that the REIT-based portfolio could provide stable returns in both the long- and short-run to satisfy investors with different levels of risk tolerance.
Although researchers realize the significance of REITs analysis, applying machine learning algorithms to manage the portfolios relevant to REITs is still an emerging area of research. Currently, the mean-variance optimization method is one of the most popular methods for managing the REITs’ related-portfolios because the theories and effectiveness of the mean-variance optimization method have been well studied in the past decades (Yang et al., 2020). However, some researchers claim that the machine learning approach has better performance especially in REIT portfolio investments, for instance, GA can handle nonlinear relationships among various factors. The returns and risks of REITs are influenced by a variety of nonlinear factors, such as economic cycles, interest rates, policy changes, and real estate market dynamics. GA explores a large and complex solution space to capture these nonlinear relationships and search for optimal portfolio configurations. Additionally, most REIT investors use tailored investment strategies that seek to balance income generation and capital growth. GA supports customized parameter settings to meet specific investment requirements. (Deliktaş & Ustun, 2023).
Our study is motivated to identify the effectiveness of using machine learning approaches to construct mixed-REIT portfolios, improving the portfolios’ performance and return. Since the global REIT market has become larger, more and more countries have built their REIT market. In this case, how to construct the portfolios based on REITs directly affects the returns of these investors. Therefore, researching how to optimize the portfolios constructed can satisfy the development trend of the financial market in the future. Furthermore, another motivation of our study is to isolate different impacts of EREIT and MREIT on the portfolio. REIT contains EREIT and MREIT, which exhibit different characteristics in the same portfolio. This research is to explore the contribution of different percentages of EREITs and MREITs in the portfolio. Our results show that genetic algorithm can obtain better return when the portfolios contain different assets and different percentages of MREITs and EREITs. Finally, we are inspired by the economic events impact on portfolios return, thus the last motivation of this paper is to explore how REIT affects the portfolios' return in different periods and adverse economic events, such as pre-Global Financial Crisis (GFC) period (2000–2008), GFC (2009–2013), post-GFC (2014–2019), and COVID (2020–2022). The sub-period results show that the genetic algorithm can obtain a higher return than the mean-variance method, and REIT shows excellent performance during the GFC (2009–2013) and post-GFC (2000–2008) periods.
This study contributes to the literature in the following aspects. First, we extend the analysis and explore the contribution of MREITs and EREITs to the portfolio and the impact of different assets on the REIT portfolio. We build different mixed-asset portfolios based on MREITs and EREITs and controls for the percentage of EREITs and MREITs in the asset portfolio. Our empirical results indicate that the percentage of REITs significantly affects the portfolio’s return. Furthermore, our sub-period tests demonstrate the important role of REITs in asset portfolios. Second, our study compares the accuracy and effectiveness of the mean-variance and the genetic algorithm in building the US market mixed portfolios with MREIT and EREIT. Our study applies the genetic algorithm in the REIT market, comparing its efficiency with the traditional method. Such comparison is useful to clearly identify whether the genetic algorithm is better than mean-variance in handling the large number of assets portfolios.
The rest of the study is organized as follows: Section 2 reviews the literature and summarizes the empirical studies that apply traditional and machine learning methods in optimizing portfolios. Section 3 presents the working process of genetic algorithm and researching procedures. Section 4 presents and discusses the results. Section 5 concludes the study.
Literature review
The portfolio selection methods can be classified into two types. The first type includes traditional portfolio selection methods such as the mean-variance method, the James-Stein estimator, and the Bayesian method, which all focus on constructing the models to optimize the returns and risks of the target portfolios. The other type includes modern methods such as the Artificial neural network (ANN), the Support vector machine (SVM) method, the genetic algorithm, the ranking model, the passive-aggressive mean reversion approach, the local adaptive learning (LOAD), and the minimum spanning tree (MST). The past literature originally used the mean-variance model to find optimal portfolios; however, recent studies suggest that it is difficult for the model to achieve proper results when dealing with a large number of assets. The recent literature instead suggests exploring machine learning approaches to optimize the large numbers of assets portfolios. This section reviews the literature on empirical studies that apply traditional methods and machine learning algorithms/approaches to optimizing portfolios.
Traditional Methods
Development of Traditional Methods
The study of real estate investment trusts (REITs) has traditionally relied on econometric models and financial analysis techniques to understand market behavior, portfolio performance, and risk management. Over the years, these traditional methods have provided valuable insights into the dynamics of the REIT market and have made significant contributions to the field.
One fundamental approach to REIT research is the use of vector autoregressive (VAR) models to analyze the relationship between real estate price dynamics and REIT performance. For example, a study published in Real Estate Economics investigated how fluctuations in the value of underlying properties affect the long-term returns of REITs. This approach enables researchers to capture the interdependencies and feedback loops between real estate prices and REIT performance, offering a comprehensive understanding of the factors influencing REIT returns (Fan & Yavas, 2023).
In addition to VAR models, fixed-effects regression models have been widely employed to study the impact of specific factors on REIT performance. For instance, Fuller et al. (2019) examine the relationship between environmental sustainability initiatives and the financial outcomes of REITs. By using a fixed-effects regression approach, the study was able to control for unobservable heterogeneity among REITs, isolating the effects of sustainability ratings on performance indicators such as returns and risk-adjusted performance.
Furthermore, generalized autoregressive conditional heteroskedasticity (GARCH) models have been used to understand volatility transmission and market consolidation within the REIT market. The multivariate GARCH model has been applied to analyze volatility spillovers between UK REITs and the broader equity market. This approach enables researchers to capture the dynamic nature of volatility and its cross-market transmission, offering insights into how REITs respond to broader financial market volatility (Katyoka & Stevenson, 2024).
While these traditional approaches have greatly contributed to our understanding of the REIT market, they are not without limitations. Many models rely on assumptions of linearity, stability, and normality, which may not fully capture the complexity and nonlinearity of the real estate market. Additionally, traditional methods often focus on single-objective optimization, which may not be sufficient to address the multifaceted nature of REIT portfolio investment decisions.
Mean-variance method
In past decades, the classical mean-variance (MV) method, also known as the modern portfolio theory, introduced by Harry Markowitz in 1952, is one of the most popular traditional portfolio selection methods used for constructing portfolios. The basic principle of mean-variance analysis can be summarized as maximizing the returns of portfolios when their risk levels are controlled. This principle is based on the perception that any single financial asset does not determine the portfolio’s risk and return. Instead, the portfolio’s risk and return are determined by its construction (Kaplan, 1998; Markowitz & Todd, 2000; Zhang et al., 2007).
When investors use the mean-variance method to construct their portfolios, a basic assumption is that investors are risk-averse and prefer to choose the portfolio with the lowest risk. Sometimes, investors may use the expected excess return to replace the expected return in the mean-variance method, which is measured as
The classical mean-variance method suffers from many shortcomings, and as a result researchers propose some new models to address these shortcomings. For example, Cesarone et al. (2013) argue that the classical mean-variance model may not yield proper results when the number of assets included in the portfolio is enormous because the convex quadratic programming problem may not converge. To overcome this issue, the classical mean-variance model can be modified by adding a constraint to limit the number of assets:
Wang (2000) combines the classical mean-variance model and the mean-Value-at-Risk (VaR) model. The classical mean-variance analysis focuses on diversifying the risk of the portfolios being controlled, while the mean-VaR analysis encourages operators to reduce risk diversification to control risk (Artzner et al., 1999). In addition, the mean-VaR analysis may aggregate the risk of an individual asset, while the classical mean-variance method may face the problem of ineffectively distributing the return rates of different assets in the process of minimizing the risk (Guo et al., 2019). Wang’s combined method does not add new constraints to the classical mean-variance model but divides the portfolio selection process into two stages. The first stage uses the classical mean-variance method to obtain the primary portfolios; the second stage uses the mean-VaR method to evaluate the selected assets in the primary portfolios to judge their riskiness levels in order to determine whether they should be included or excluded from the portfolios (Serban et al., 2013).
The Limited Asset Markowitz model and the integration of the classical mean-variance and mean-VaR model have not entirely solved the shortcomings of the classical mean-variance model to control risks efficiently. Therefore, the mean-variance-skewness-kurtosis model is proposed, and its expression is shown in equation (1). Here,
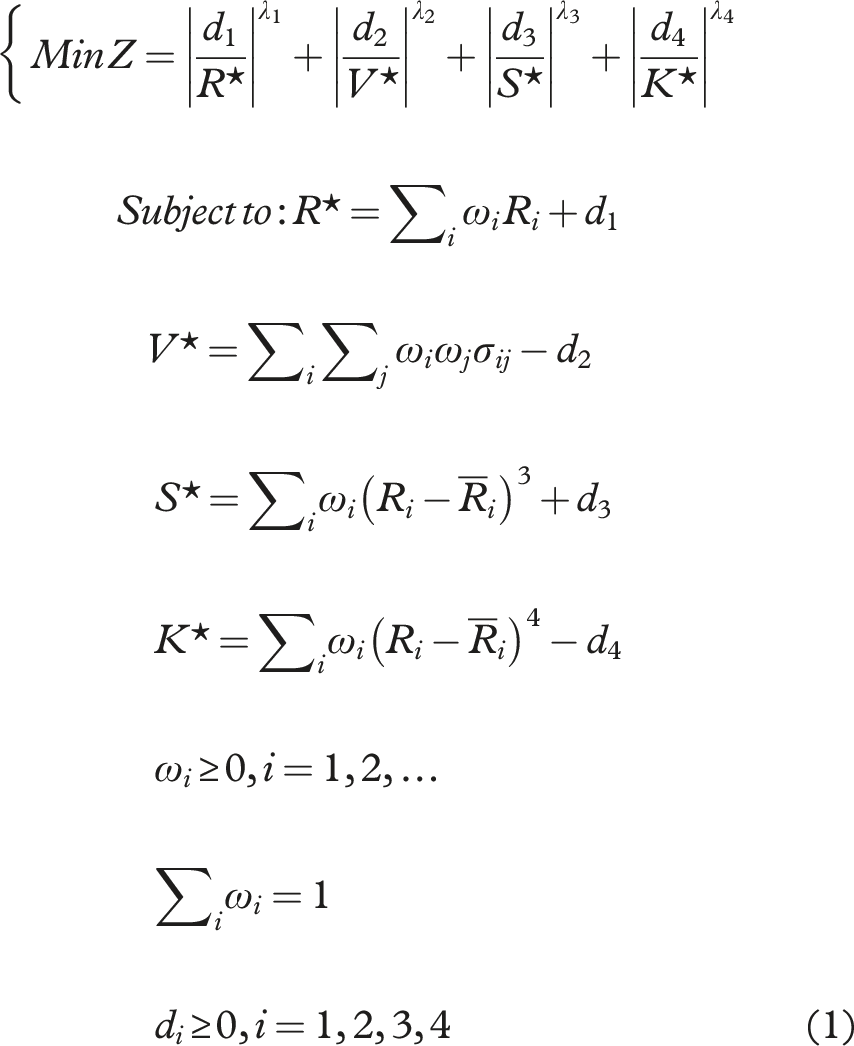
The mean-variance-skewness-kurtosis model is better than the classical mean-variance model in optimizing long-run portfolios’ structure (Beardsley et al., 2013). The model’s main approach to overcoming the shortcomings associated with the classical model is to add new constraints in order to improve the control of risks of these assets in the portfolio selection and optimization process.
Machine Learning Approaches
Genetic Algorithm
The innovator of Genetic algorithm (GA) is John Holland in 1975, a machine learning algorithm based on the natural selection and genetic science (Holland, 1992). The genetic algorithm has been applied to portfolio selection and optimization in recent years because of the power in global optimization, adaptability, robustness. First, genetic algorithm is designed to search the entire solution space. This allows GA to potentially find the globally optimal solution. Unlike traditional optimization methods that may get trapped in local optima, GA performs a global search, increasing the likelihood of finding the true optimal portfolio composition. Second, GA can adapt to financial noise and environments changing, provide adaptability and robustness in searching for optimal solutions in complex, multi-dimensional spaces. This is particularly beneficial for REITs-mixed portfolios, which involve numerous variables and constraints. Third, GA can easily incorporate various constraints and preferences, making it highly suitable for the diverse and multifaceted nature of REITs investment, which often involves balancing multiple financial instruments, such as stocks, bonds, gold. (Deng et al., 2019). These characteristics dictate that GA has advantage when dealing with REIT-related asset portfolios.
In general, the genetic algorithm approach also focuses on many practical problems in portfolio selection, such as cardinality constraints, minimum transaction lots, and the capacity of sector capitalization (Lin & Liu, 2008; Loraschi et al., 1995; Soleimani et al., 2009). Researchers have compared its efficiency and effectiveness with the classical mean-variance method. For example, Lin and Liu (2008) and Soleimani et al. (2009), who point out that the traditional Markowitz model (the classical mean-variance model) cannot deal with the minimum transaction lots in the process of optimizing the returns of portfolios, claim that the genetic algorithm can solve these problems, obtaining a curve similar to the efficient frontier obtained by the classical mean-variance model. Furthermore, Sefiane and Benbouziane (2012) argue that the genetic algorithm efficiently constructs an extensive portfolio with many assets. These researchers find that the genetic algorithm, an effective computing method for constructing portfolios to optimize the returns and control the risks, can perform better than the classical mean-variance method.
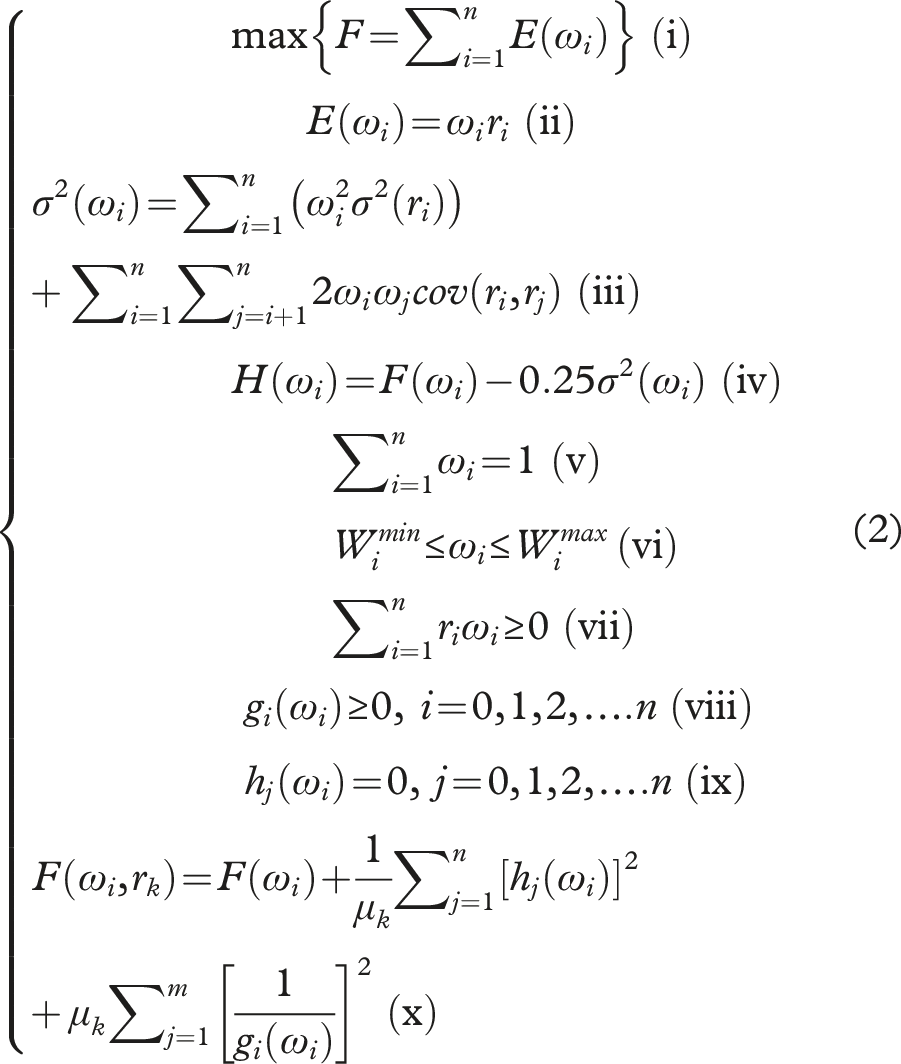
The portfolio selection problem for the genetic algorithm can be described in equation (2). Equations (2i) describes the basic objective of the portfolio selection problem: to maximize the portfolio’s return, where F is the portfolio’s expected return. Equations (2ii)–(2iv) define variables involved in this portfolio selection problem: the expected return of the portfolio, the variance of the portfolio, the multi-objective function to be minimized, and the weights of these assets in the portfolio, respectively. Equations (2vi)–(2ix) are some constraints for the portfolio selection problem, which control the values of the weights of these assets in the portfolio from different perspectives. Equation (2vi) constrains the minimum and maximum values of the weights. Equation (2vii) constrains the portfolio’s expected returns, requiring the portfolio to be greater than zero. Equation (2viii) is the constraints for the minimization method, which is a penalty method, and equation (2ix) is the inequality constraints, which means that the cross-sector part must be zero. Equation (2x) is the transformation of the expected return of the portfolio when the two constraints in equation (2viii) and (2ix) are considered, and
The pseudocode of genetic algorithm is express as follows:
BEGIN
generation: = 0
initialize (population (generation))
WHILE termination condition NOT satisfied
DO
BEGIN
generation: = generation + 1
select (population (generation) from population (generation - 1))
crossover (population (generation)) evaluate (population (generation))
ENDDO
ENDWHILE
END
The termination condition is no improvement in fitness values between generations.
Compared to traditional methods, genetic algorithms (GA) offer powerful alternatives that address many of the limitations of conventional approaches. Genetic algorithms are evolutionary algorithms, inspired by the process of natural selection, and are capable of solving complex optimization problems by exploring a broad search space. Unlike traditional models, genetic algorithms do not require strict assumptions about data or relationships between variables. Instead, they can adaptively search for optimal or near-optimal solutions, even in the presence of nonlinearities, high dimensionality, and multiple conflicting objectives.
For example, while a traditional event study might assess the impact of a financial crisis on the REIT industry, genetic algorithms can be used to optimize REIT portfolios, dynamically adjusting allocations to different sectors in response to such events based on real-time market conditions. Genetic algorithms are particularly well-suited for complex REIT portfolio management due to their ability to handle multi-objective optimization and adapt to changing environments.
In the broader context of REIT research, genetic algorithms represent a significant improvement over traditional method. The flexibility and robustness of GAs enable the development of more complex and adaptive investment strategies that can manage the complexities of the modern real estate market in ways that traditional models cannot. As the field of REIT research continues to evolve, the integration of genetic algorithms with other advanced computational techniques will play an increasingly important role in driving innovation and improving portfolio performance.
Artificial Neural Network Method
Researchers who have justified the effectiveness and efficiency of other machine learning approaches have compared these machine learning approaches with the classical mean-variance model and other traditional portfolio selection and optimization methods. ANN could identify the complex nonlinear relationships and pattern in large dataset, it is important to adopt REIT interactions between different economic indicators and REIT performance. ANN also can consistently improve their performance as more data becomes available, making them highly adaptable to changing market conditions and economic environments. For example, Loo (2019) predicts REIT performance via ANN, which produces better performance than the regression-based trading activities across various time periods. Furthermore, Fernández and Gómez (2007) point out that the Artificial neural network (ANN) method effectively solves the portfolio selection problem when cardinality and bounding constraints are considered in implementing the classical mean-variance model. At the same time, researchers find that the ANN method can be effectively integrated with other approaches to deal with portfolio selection problems, such as with the arbitrage pricing theory (APT) to control the risk of the portfolio (Hung et al., 1996), with the VaR model to optimize the portfolio selection computing procedures (Chapados & Bengio, 2001), or with the bootstrapping neural networks to optimize the expected returns of the portfolio (Hsiao et al., 2020).
Support Vector Machine Method
Another machine learning method, the Support Vector Machine (SVM) method, is also widely used by researchers in recent years to solve portfolio selection and optimization problems (Paiva et al., 2019). For example, Yu et al. (2014), who combine the SVM and the principal component analysis (PCA) to select the risk assets in the portfolio, distinguish the classification of SVM into two types, linear and non-linear. Marcelino et al. (2015), who compare the returns of the portfolio selected by the BOVA11 index fund, which focuses on investing in the Brazilian public equity market, and the SVM method, find that the SVM method is much better than the former method because the return rate of the portfolio based on the BOVA11 index fund is −14.42% while that of the portfolio selected from the SVM method is 94.15%. Paiva et al. (2019) compare the returns of three portfolios selected by different methods: the mean-variance method, the combination of the random selection method and the mean-variance method, and the combination of the SVM method and the equally weighted method. The findings show that the effectiveness of the SVM method in optimizing portfolio selection depends on which model it is combined with.
Other Machine Learning Methods
In addition to the above two machine learning methods (ANN and SVM), some researchers have developed new machine learning approaches to solve the problems related to portfolio selection and optimization. For example, the ranking model, based on the neural network method, ranks the probabilities and then selects the suitable conditions for the next step in transferring information from one generation to the next generation (Song et al., 2017). The passive-aggressive mean reversion approach (PAMR), developed from the mean reversion approach used by the Constant Rebalanced Portfolios (CRP), forecasts the possible range of the portfolio’s return in the future (Li et al., 2012). The local adaptive learning (LOAD) model is a development from the online portfolio selection system (OPS) (Guan & An, 2019). Finally, the minimum spanning tree (MST) approach is an idea for portfolio selection and optimization by finding the routes from a point to the edge with the small weights and without any cycles, achieving the goal of minimizing the weight of the total edge (Tarjan, 1982). This method, which intends to find the shortest paths to develop the portfolio, can use different variables, either the asset prices or the volatility, in the objective function (Miccichè et al., 2003). Overall, these machine learning methods modify the selection beliefs of the three popular machine learning methods, but as yet only a minority of researchers use them.
Traditional Versus Machine Learning Approaches: A Comparison
Our literature review explains many typical differences between the traditional and machine learning approaches used in portfolio selection. First, the traditional portfolio selection approaches developed from the mean-variance method all focus on the relationship between the expected return and the risks in determining the weights of different assets to construct the final portfolios to meet the investors’ demands. The main difference among traditional approaches is how to construct the objective functions based on the expected return and corresponding risks and then solve them. By contrast, most machine learning approaches do not limit the return and risks of the assets in developing the portfolios; exceptions are those that have used the machine learning approaches only as calculation algorithms and are combined with the classical mean-variance model. They always focus directly on the inner features of the price, for example, the trends of these assets’ prices, in order to obtain proper portfolios to meet the investors’ needs. Although returns and risks have also defined objective functions, the relationship between them is no longer the only criterion for selecting portfolios.
Compared to traditional approaches, even machine learning approaches are more flexible and accurate because they have considered the real-time information related to assets, rather than only the returns and risks. Moreover, some machine learning approaches, such as the LOAD model, have taken information from other fields beyond the invested assets. In this case, the machine learning approaches try to simulate the real environment of the financial market and then predict the trend to determine the weights of the portfolios, achieving the final goal of portfolio selection.
The machine learning approaches can make such flexible operations for portfolio selection because they can use the training process to test the real world of the financial market, predict the trend of the assets traded on this market, then select suitable assets and determine their weights to construct a portfolio to achieve the return requirements. The traditional approaches cannot do so because they have to pre-define the relationship between returns and different constraints: this directly limits their implementation in practice. It is also challenging to ensure that the pre-defined relationship between returns and other constraints is useful for all scenarios. Therefore, the machine learning approach should be more suitable for portfolio selection.
Research Gap
Based on a review of the existing literature, we have identified the following research gaps. First, the previous REIT studies have not mentioned how REIT weight shifting affect the portfolios’ return. Most previous studies add REIT index or all composites of REIT stocks in the portfolios, ignoring the different impacts of EREIT and MREIT on portfolio returns. For example, Birz et al.(2022) claim that REITs are relatively investor-friendly financial products and have made remarkable contributions in diversifying portfolio risks. They test the FTSE-NAREIT REIT stocks, and building equal-weight portfolios, but ignore the independent influence of EREIT and MREIT. Second, scholars have considered the addition of REITs into the portfolios, they have not examined the performance of EREITs and MREITs in the portfolio separately or tested the impact of different REIT percentages on the portfolio (Case et al., 2012; Price, 2009; Rees & Sevtap Selcuk-Kestel, 2014). Third, the combined genetic algorithm has been applied in REIT by Ishii et al. (2014). However, they did not discuss the efficiency of the genetic algorithm.
Model and Methodology
The Model
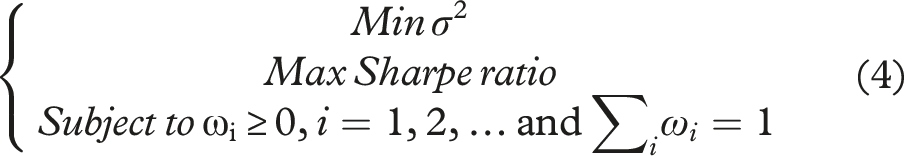
The genetic algorithm is used to examine the effectiveness of using the machine learning approach to optimize the portfolios. In using this method to select portfolios, the objective function is changed to minimize the variance. This differs from the method presented in equation (2) to maximize the expected returns because here we focus on the needs of the majority group of risk-averse investors. We also take the Sharpe ratio (the ratio between the return premium and the standard deviation) into account in defining the portfolio selection and optimization problem, except when considering the variance, because it measures the risk-adjusted return of a portfolio (Behr et al., 2013). The Sharpe ratio is defined as the ratio between the return premium and the standard deviation.

When the Sharpe ratio is large, the return is high relative to the risk. By contrast, a small Sharpe ratio means that the return is low relative to the risk. Behr et al. (2013) have justified the effectiveness of considering the Sharpe ratio in portfolio selection and optimization problems by using stock data. They find that when the objective function of maximizing the Sharpe ratio is considered, the expected return of the optimized portfolio is 32.5% greater than the one when the Sharpe ratio is not considered. Therefore, our study consider the minimum variance and the maximum Sharpe ratio in solving the multi-objective optimization problem. The portfolio optimization problem is defined as follows:
Research Procedures: Mean-Variance Method
The general mathematical framework of the mean-variance method can be described as follows. First, the investors calculate the expected return and the return variance of the portfolio’s return. The mathematical expressions of expected return and variances (MacKinlay & Richardson, 1991) are presented as:


In the basic model of the mean-variance method,
Then, the mean-variance method can be expressed as:

The
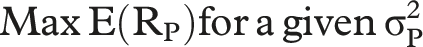
The mean-variance method can also be used in another way: to minimize the portfolio’s risk to achieve the expected return (Cesarone et al., 2013).

This formula slightly differs form from traditional mean-variance method. The target of this method is minimized the portfolio’s variance for a given expected return.
The two equations focus on different goals. Earlier equation (3) suggests that the investors obtain higher returns given a level of risk. By contrast, equation (4) needs to get lower risk when the investors expect to get proper portfolios.
Research Procedures: Genetic Algorithm
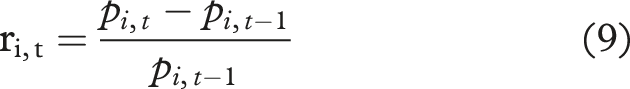
The daily return of a REIT is used to optimize the portfolios. Equation (9) measures the daily return;
The chromosome, an important component of the genetic algorithm, transfers information from one generation to the next. The portfolio optimization procedure refers to a set of assets’ weights contained in the portfolio. Hence, it is a one-dimension vector, labeled as W, and its expression is shown in equation (10). Here,

The fitness function for the genetic algorithm is the calculation of the portfolio’s variance and Sharpe ratio. The calculation formulas are presented in equations (3) and (2iii). Following the fitness function, the filtering criteria are also identified to control the chromosomes transferring information from one generation to the next generation. Two filtering criteria are identified. First, the variance of the daily return occurs before the points where the portfolio with the smallest variance is selected. Second, if two or more portfolios have the same variance, the portfolio with the more significant expected return and Sharpe ratio will be selected.
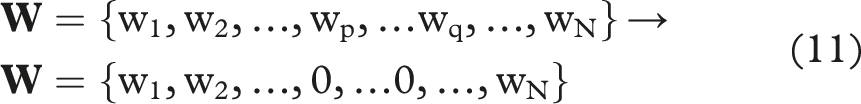
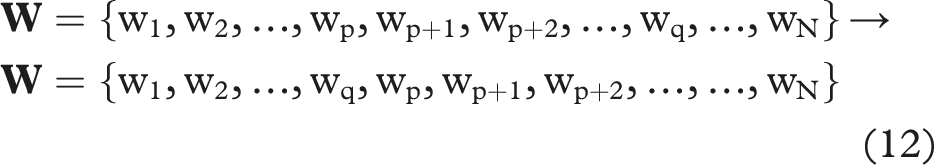
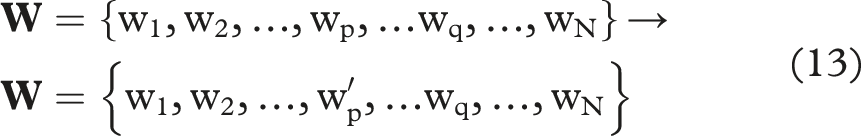
The mutation operators, crossover operators, and normal operators for the next generation must be considered in alignment with these procedures (De Falco et al., 2002; Ling & Leung, 2007; Stomeo et al., 2009). The two categories of mutation are chromosome-level and gene-level. The chromosome-level mutation indicates that the chromosome is changed as a whole; the gene-level mutation indicates that changes occur at some points. In this research, the gene-level mutation is considered because it is irrational to change the set of weights. The three common gene-level mutation types are deletion, insertion, and translocation. Deletion means that some genes are deleted, insertion means that some genes are inserted into the chromosome, while translocation means that several genes are shifted from one location to another. In this research, the insertion is not considered because it may damage the structure of the vector and then create errors in calculation; however, deletion can be considered by replacing the deleted weights (genes) with zero. The operators of deletion and translocation are shown in equations (11) and (12), respectively. Transition, another common mutation always considered in the genetic algorithm, indicates that one weight is replaced by another weight (Bhandari et al., 1996). The operator of a transition is shown in equation (13).
Crossover, another common operation in the genetic algorithm, evaluates the population for the next generation (Poon & Carter, 1995). Simply speaking, crossover indicates a way to recombine the genetic information of the parents to the offspring in biology. The genetic algorithm means recombining the solutions obtained for the previous generations. The mathematic framework of the crossover operator used in this research, a single-point crossover method (Stomeo et al., 2009), is described in equation (14).
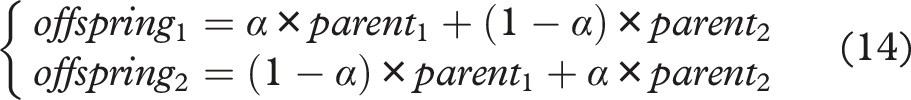
Here, Crossover operation described in equation (14). *Notes. This is simulated by combining two solutions (parent solutions) selected to produce two new solutions (children solutions) in the GA algorithm.
The normal operator for the next generation, a third operator, is also important because it controls how to pass information from the previous generation to the next generation when the mutation and crossover operators have been finished. Specifically, the normal operator adjusts the weights of the chromosome, ensuring that the sum of the weights is 1.0.
The final procedure of the genetic algorithm is to iterate these procedures to obtain the optimized portfolio. The iteration process stops when there are no changes in the three variables: the variance of the portfolio’s return, the return of the portfolio, and the Sharpe ratio.
The parameter settings of the Genetic Algorithm (GA) are crucial for both research and practice. For example, a lower mutation rate combined with high elitism can quickly improve the population, while a moderate crossover rate helps generate a relatively optimal solution. In our paper, we set the population size to 1000, the number of generations to 200, and the crossover and mutation rates to 90% and 5%, respectively. These parameter settings are well-suited for addressing problems with large solution spaces and complex datasets. The large population size and higher mutation rate encourage greater exploration, while the high crossover rate ensures a good mix of traits.
The parameter setting of genetic algorithms in this research is stated as follows:
Data Sources and Portfolio Composition
In this research, the EREITs, MREITs, S&P 500, Gold, and Bonds in the US are used to test the effectiveness of the machine learning approaches in constructing portfolios to optimize their performance. Data are collected from the Yahoo! Finance, Refinitiv DataStream, and Bloomberg. The daily data for the US market is used from January 1, 2000 to July 31, 2022. There are 157 REITs (including EREITs and MREITs) in the US market. This research has 1,283,800 total daily observations.
Portfolios Composition and Sub-Period Test.
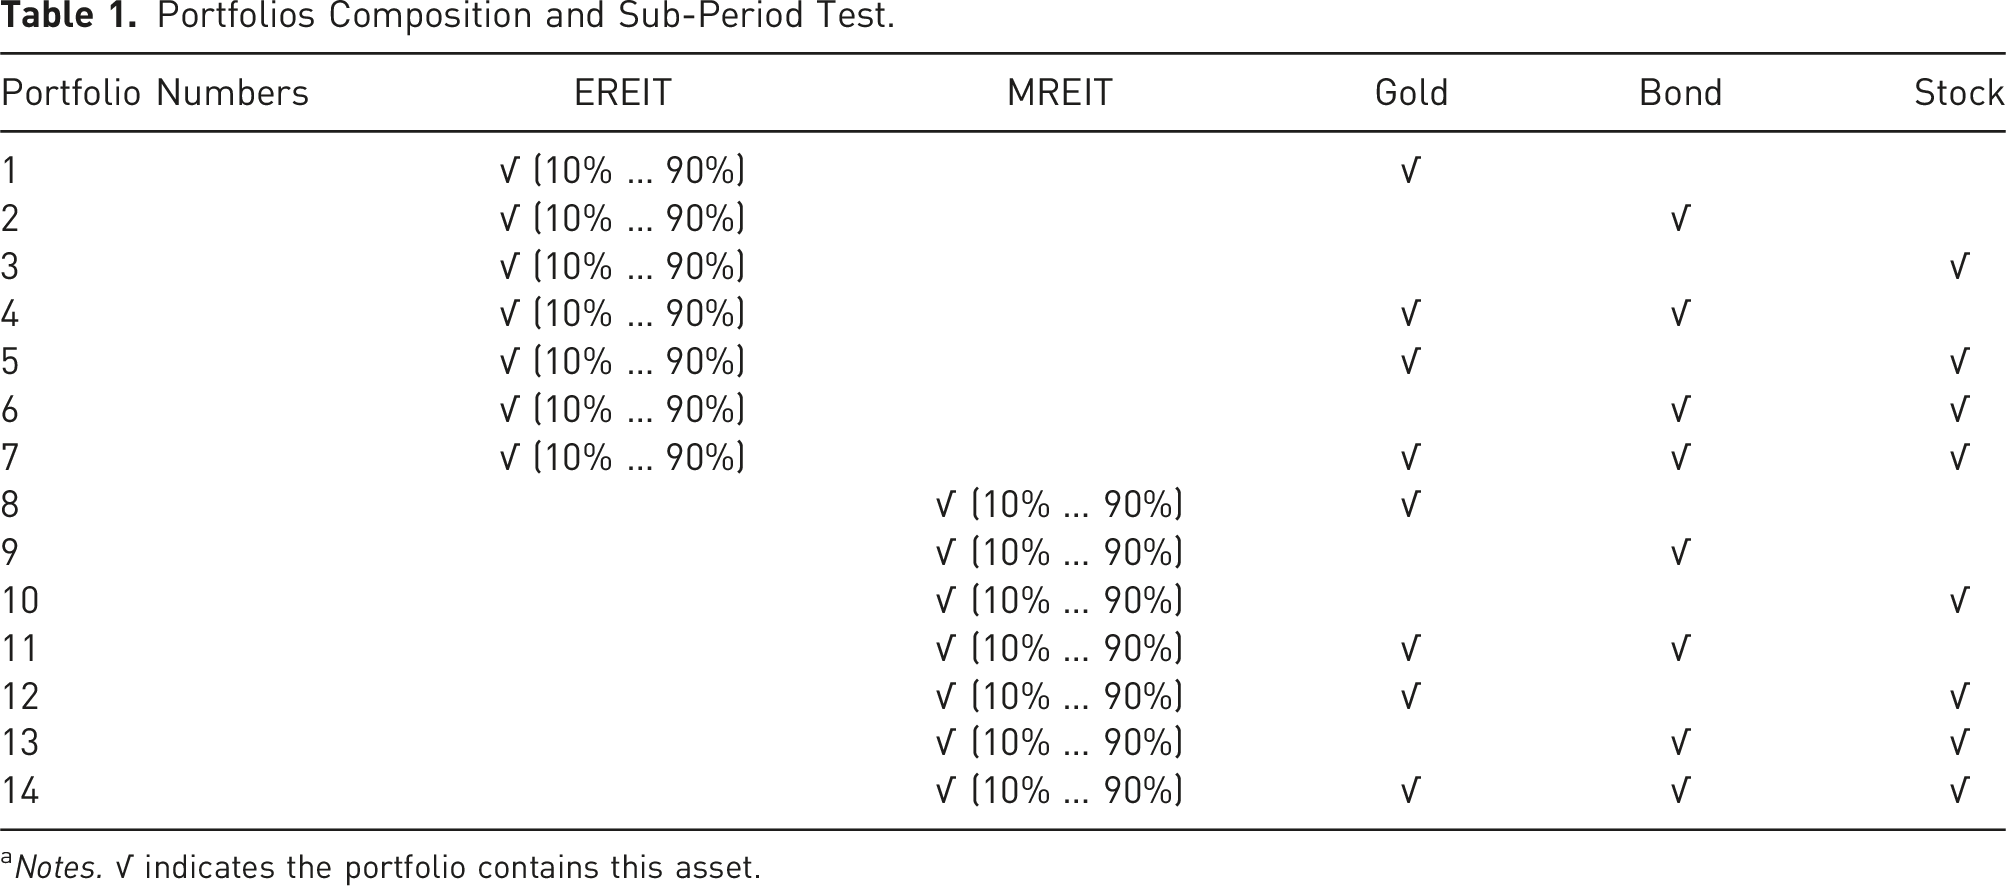
aNotes. √ indicates the portfolio contains this asset.
Findings and Analysis
Selected REITs – An Overview
REIT Stocks and Descriptive Statistics.
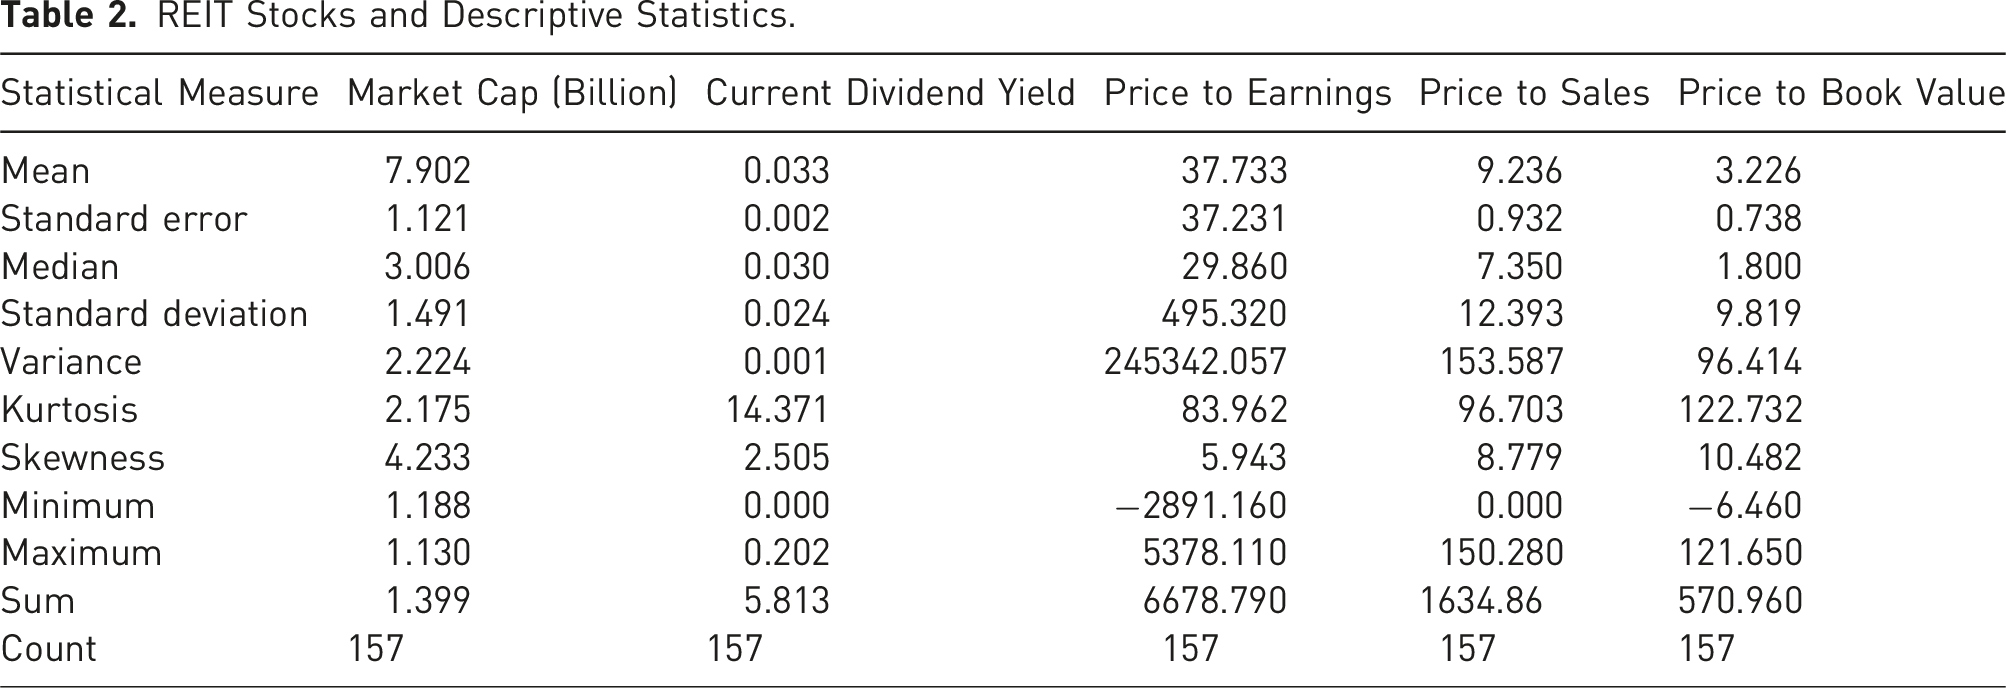
Descriptive Statistics
Descriptive Statistics of Selected REITs.
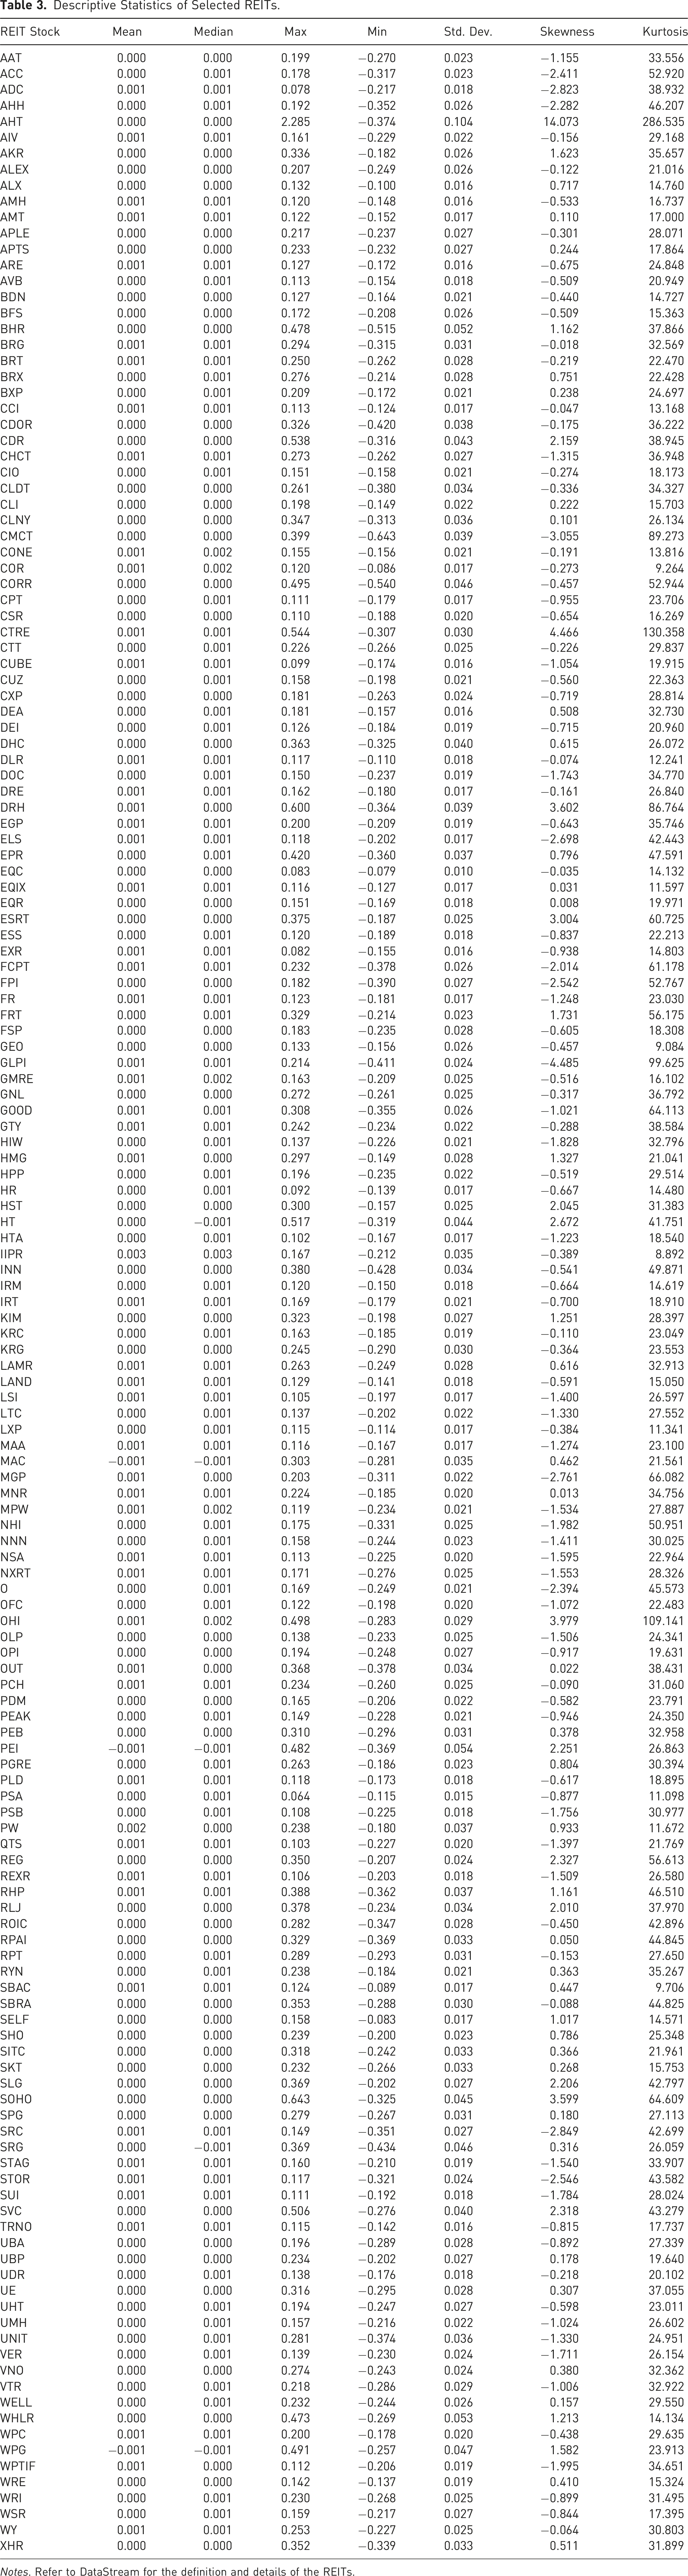
Notes. Refer to DataStream for the definition and details of the REITs.
Portfolios Optimization Results
EREIT Results for Mixed-Asset Portfolio Return and Sharpe Ratio [Genetic Algorithm (GA) and Mean-Variance (MV)].
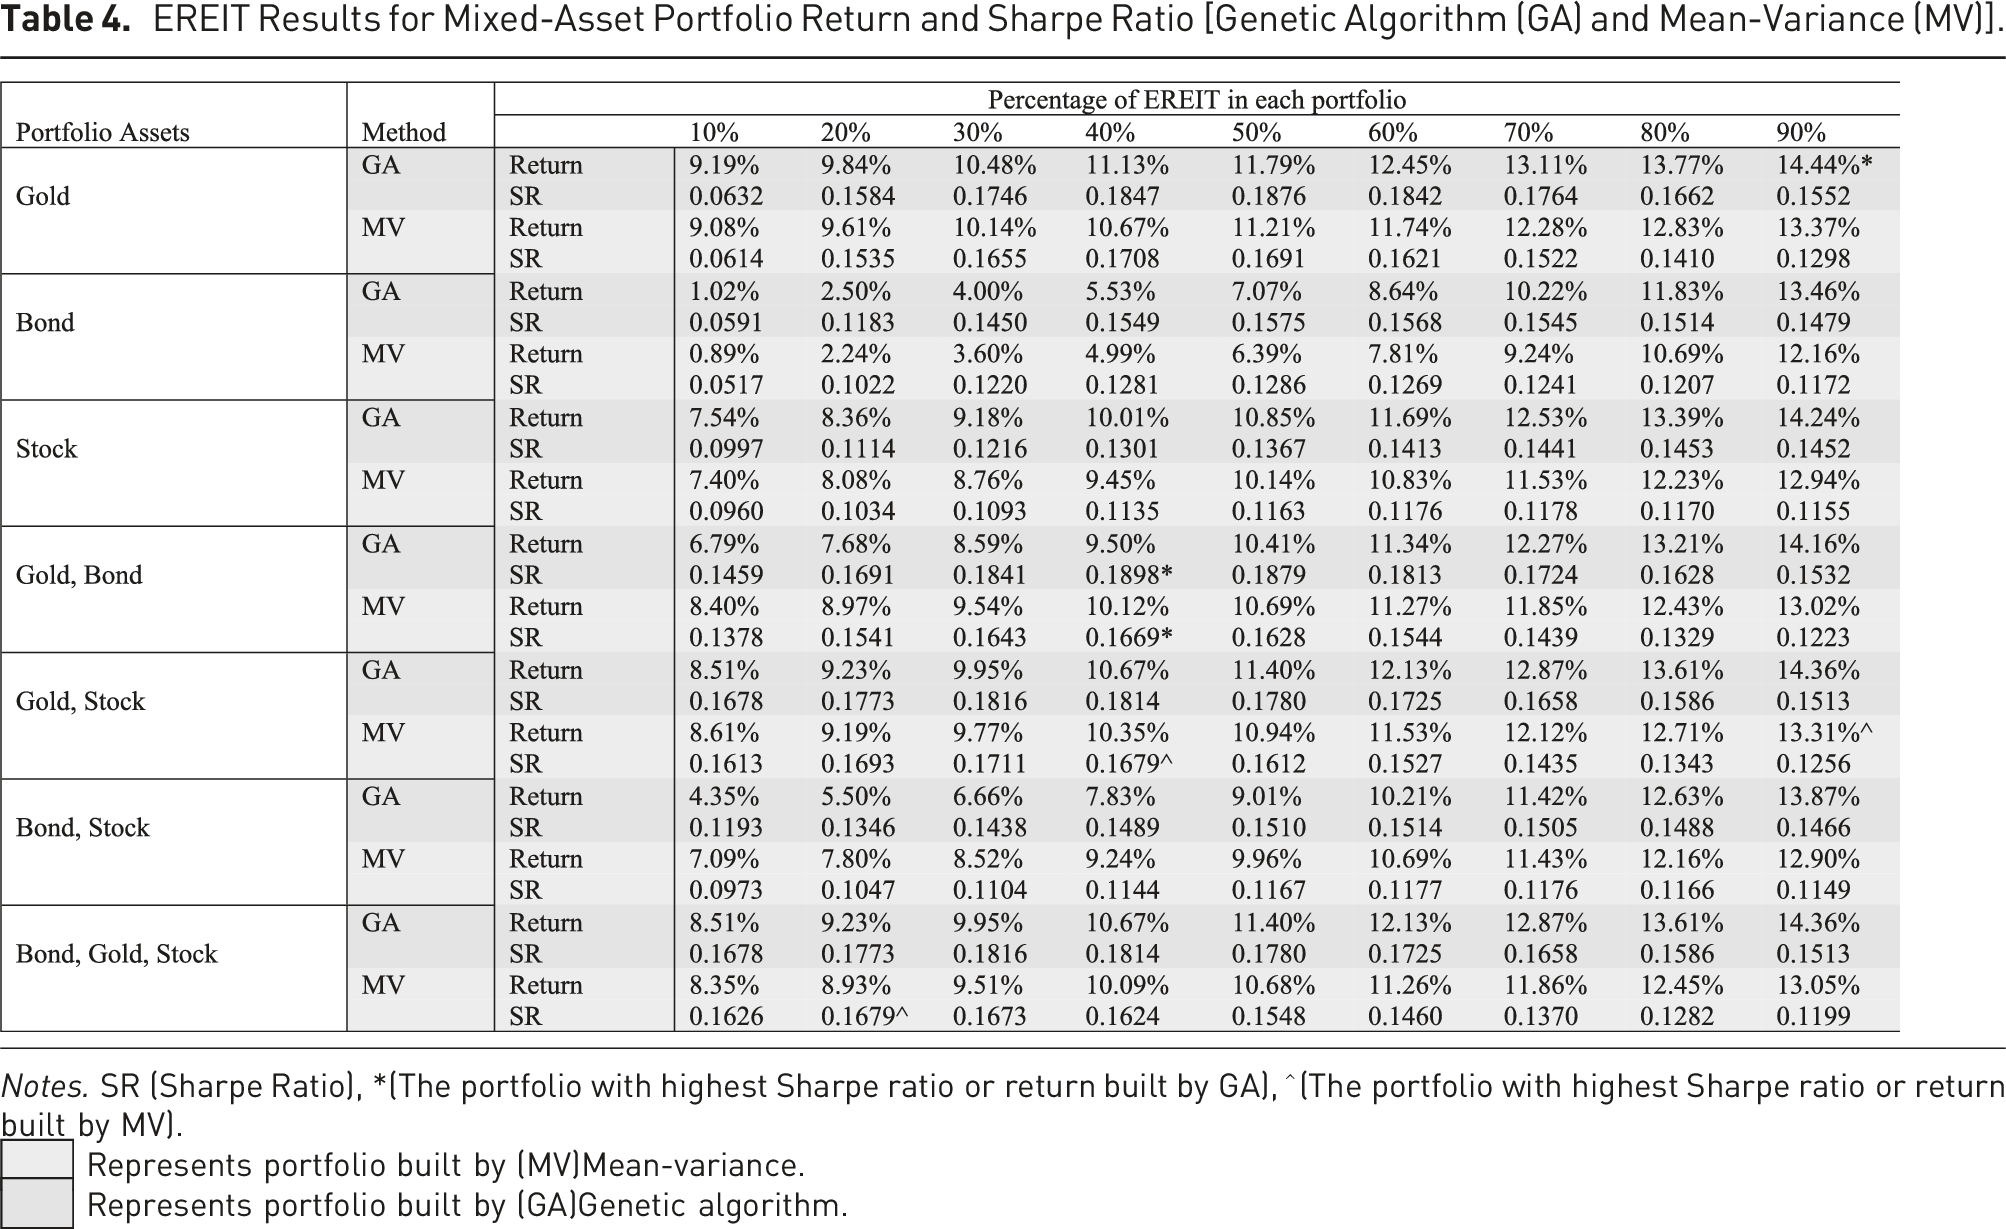
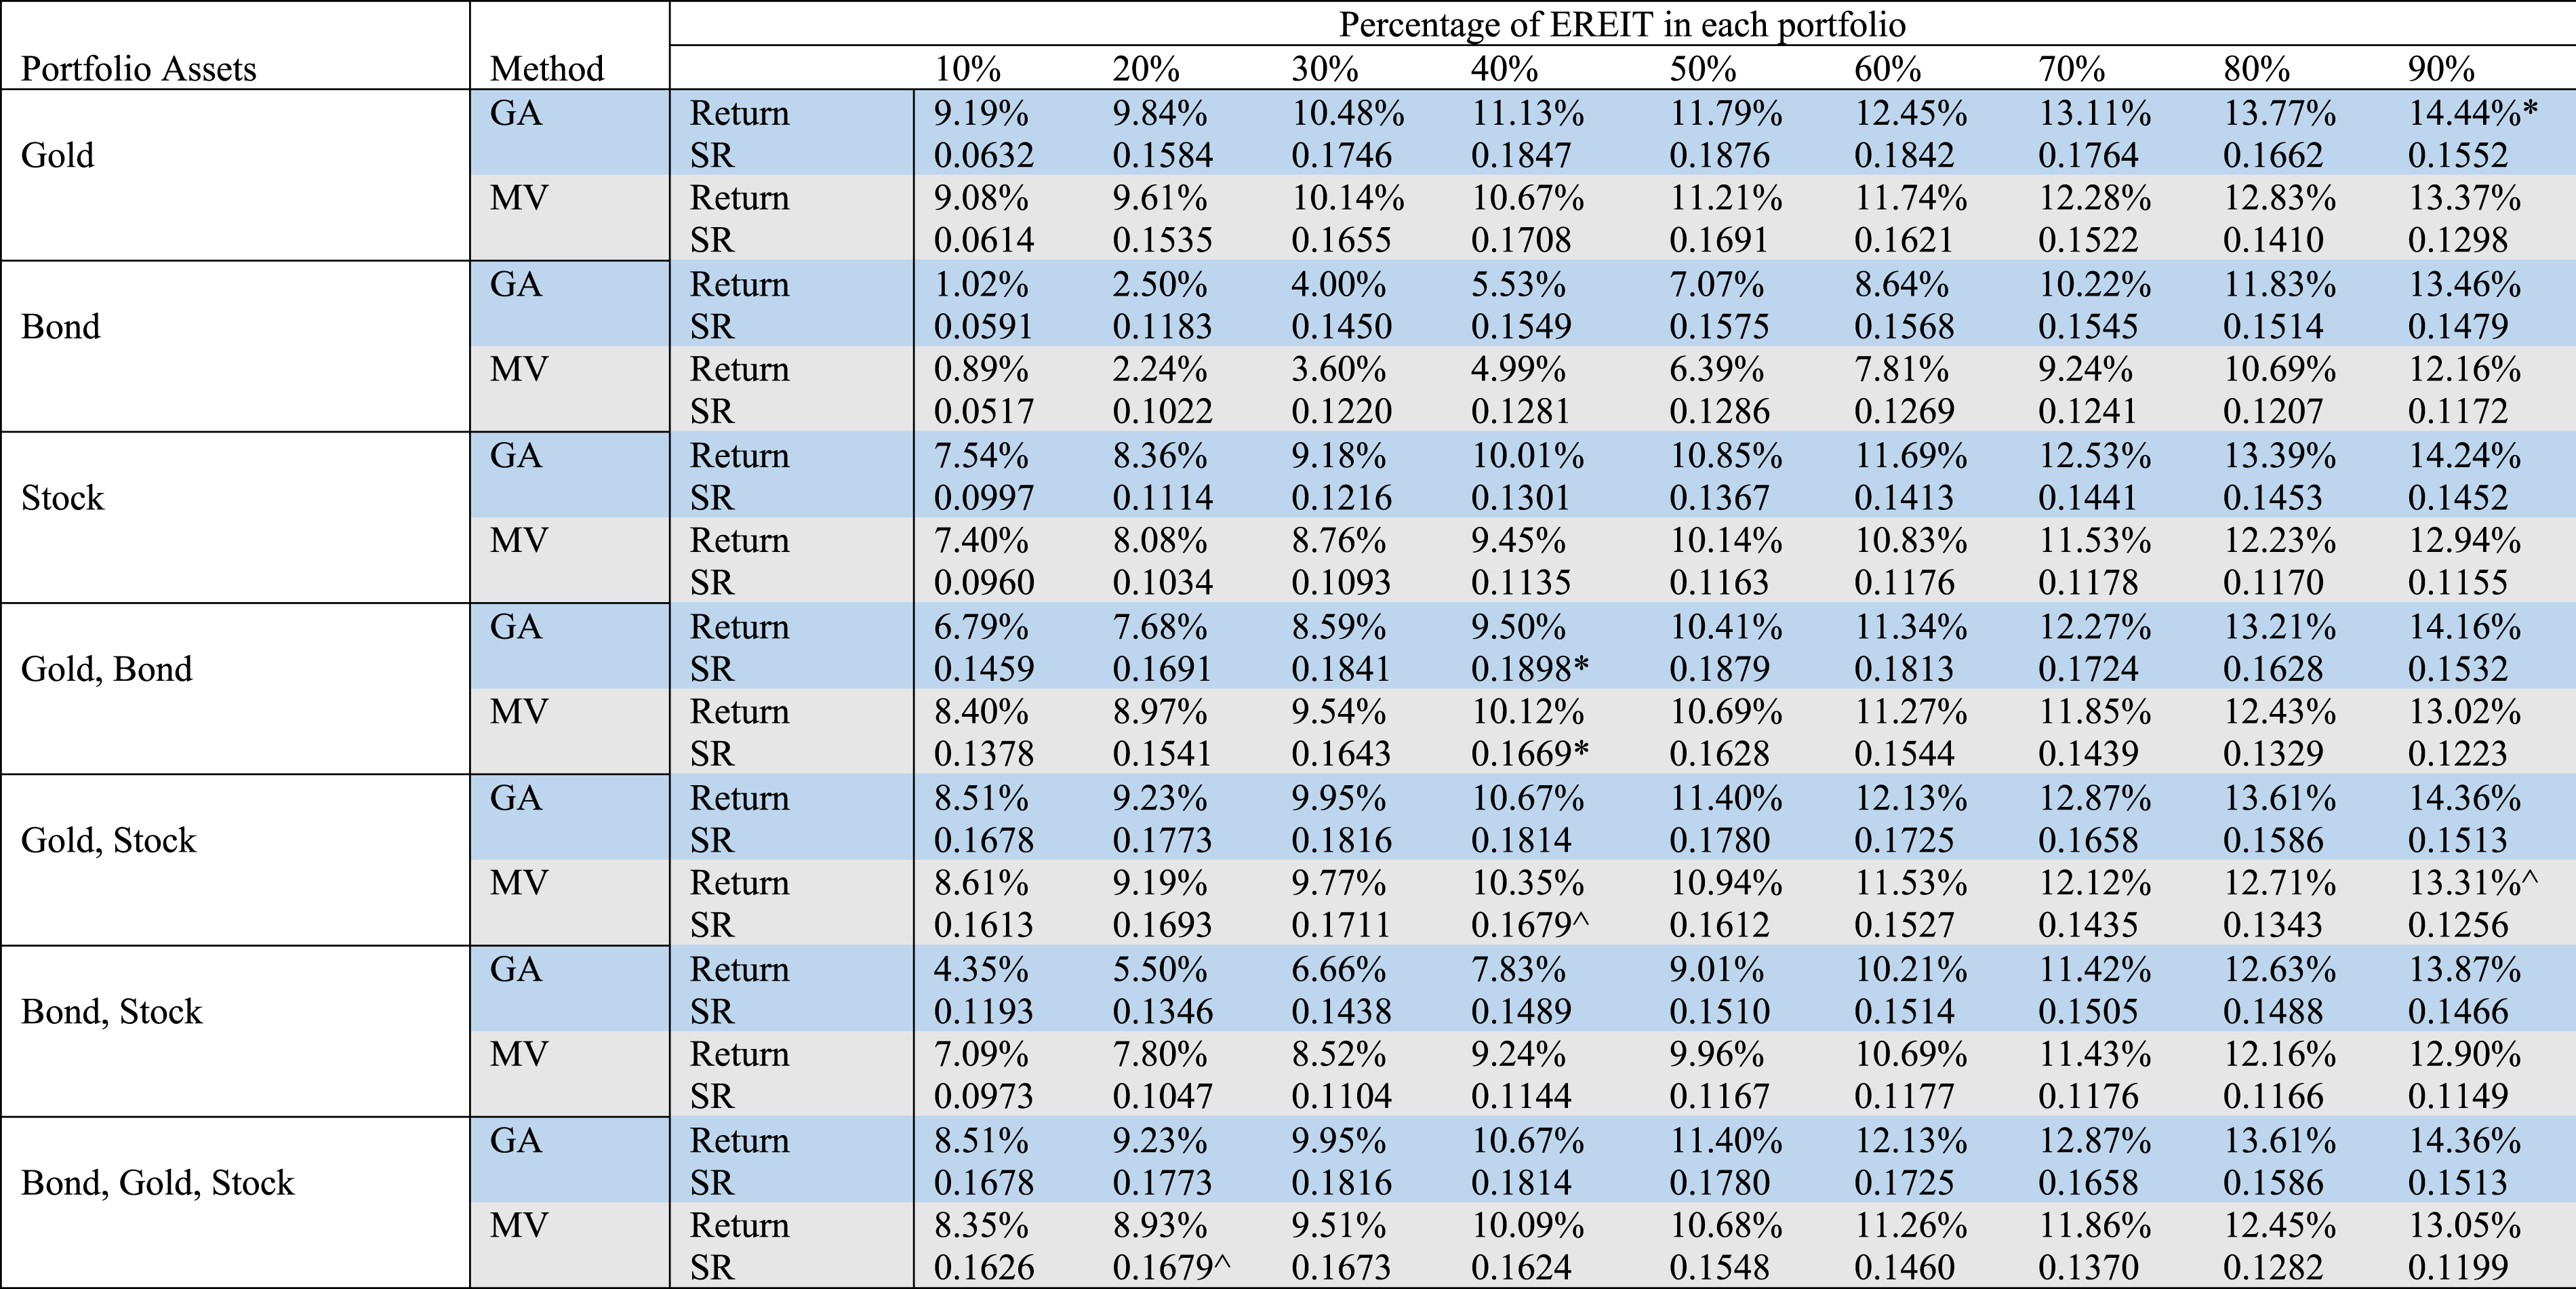
Notes. SR (Sharpe Ratio), *(The portfolio with highest Sharpe ratio or return built by GA), ^ (The portfolio with highest Sharpe ratio or return built by MV).
 Represents portfolio built by (MV)Mean-variance.
 Represents portfolio built by (GA)Genetic algorithm.
MREIT Results for EREIT Mixed-Asset Portfolio Return and Sharpe Ratio [Genetic Algorithm (GA) and Mean-Variance (MV)].
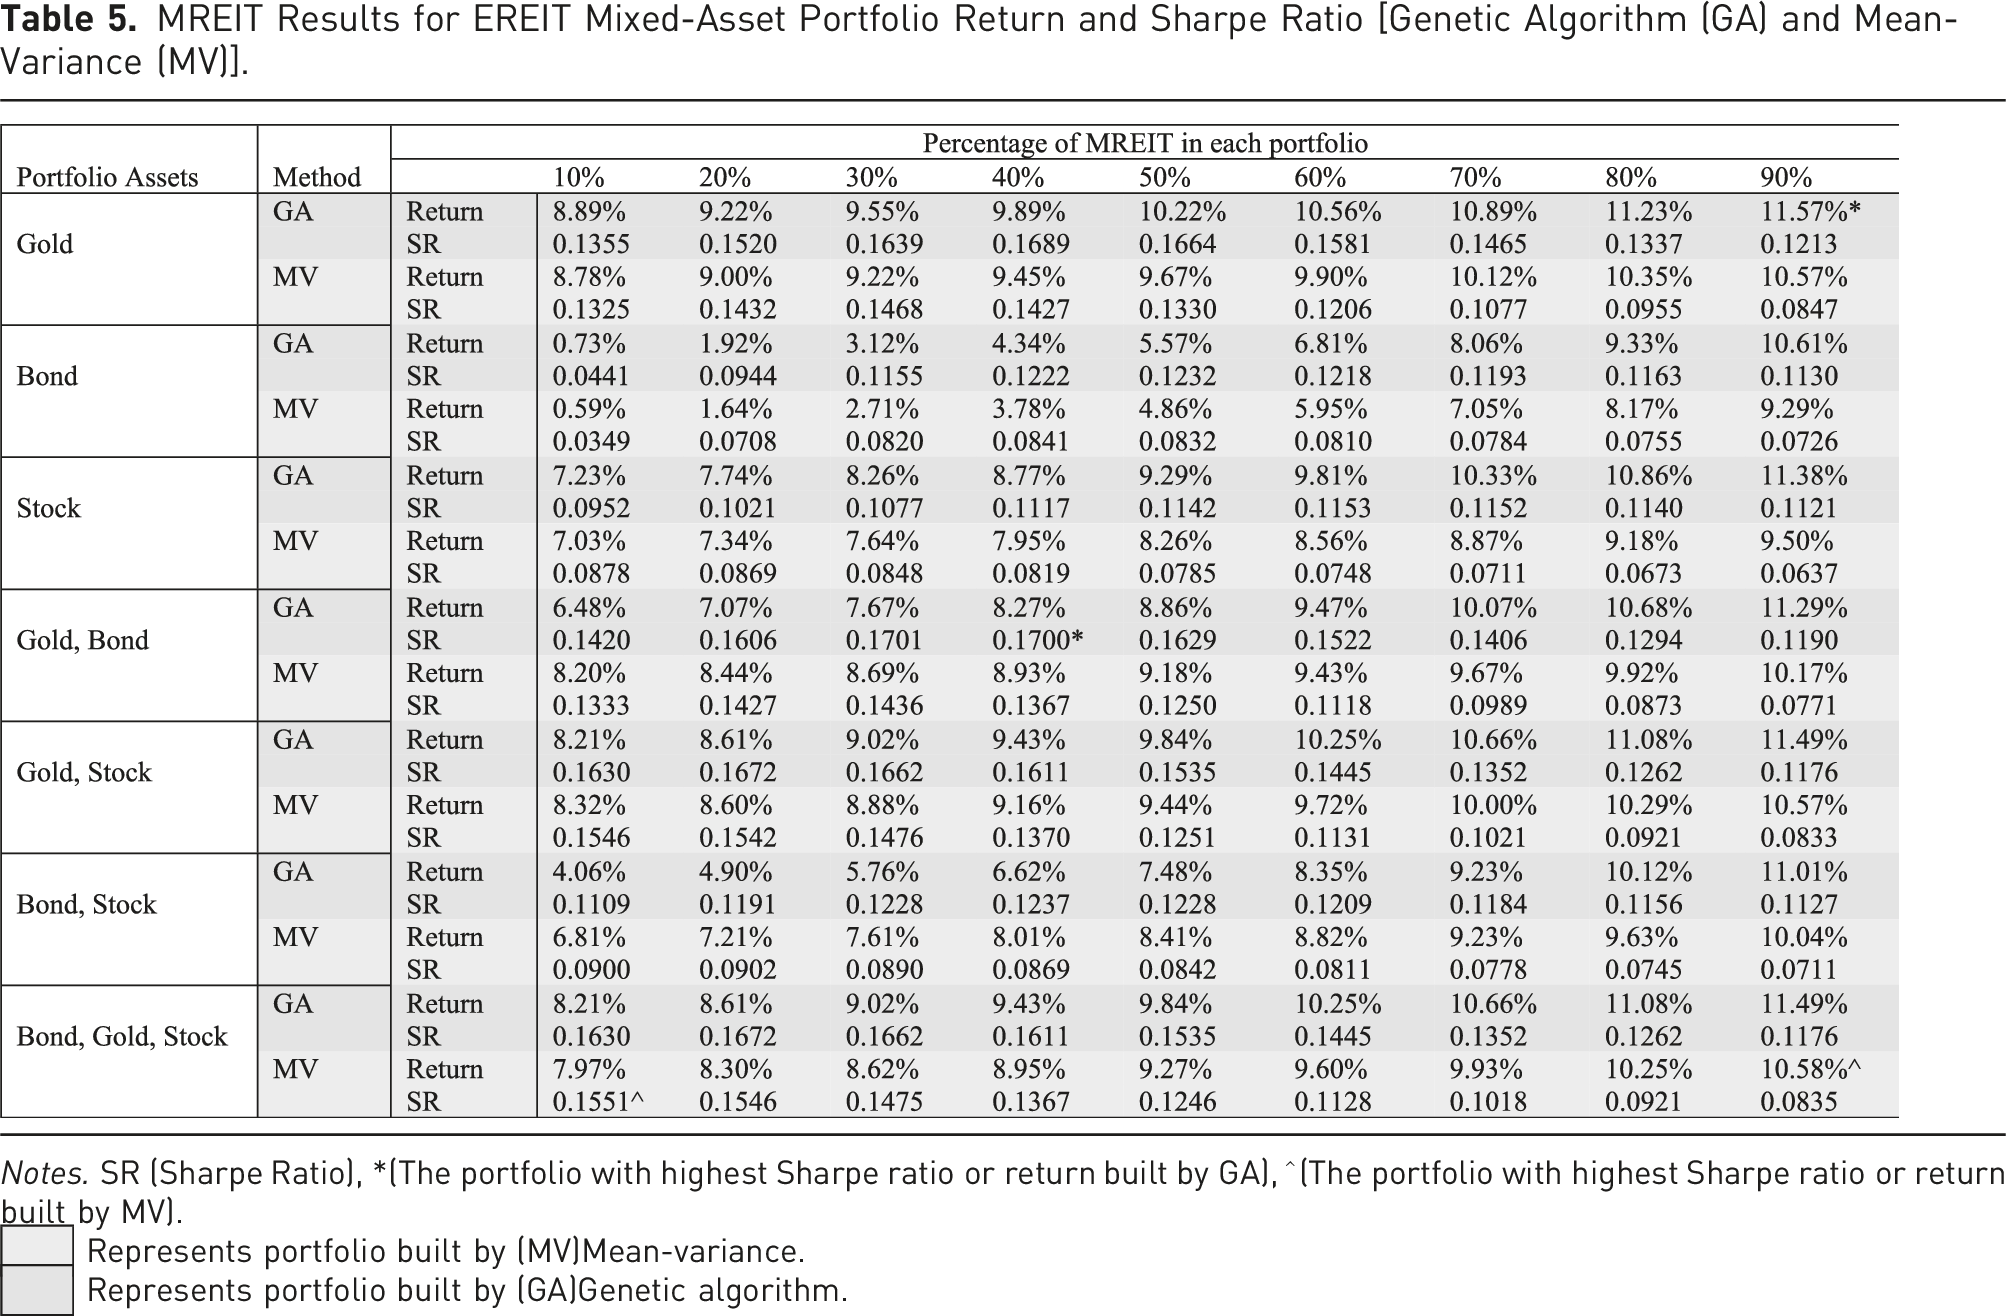
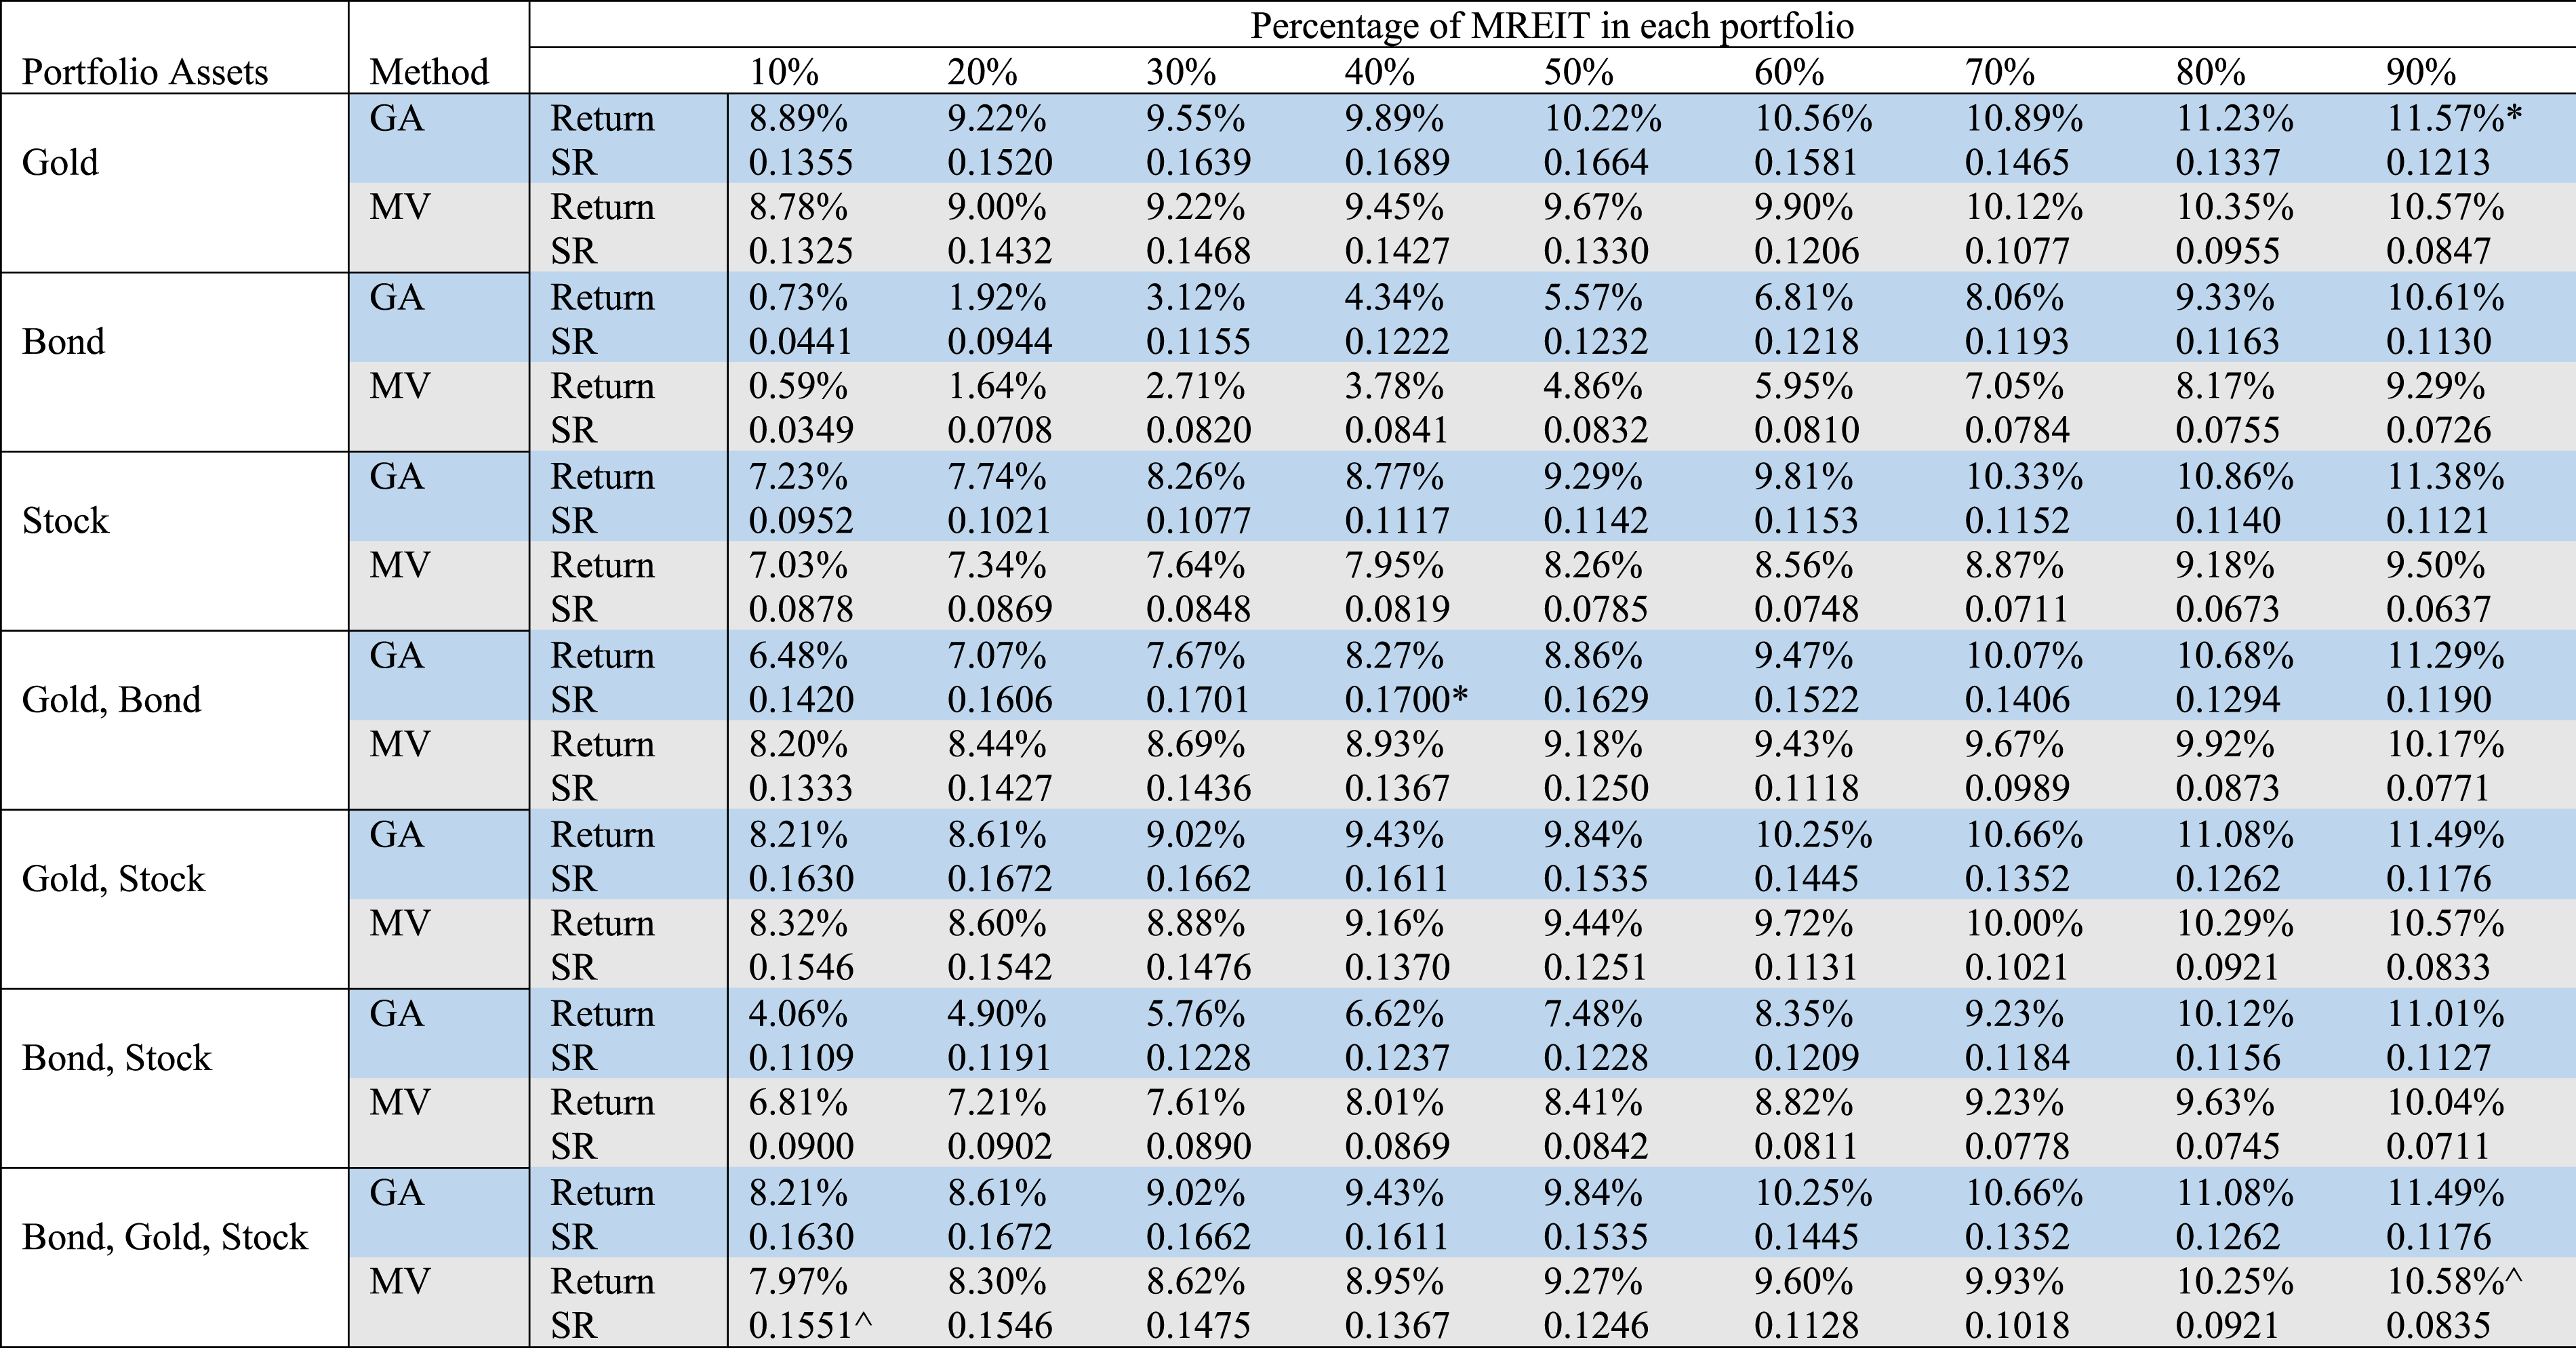
Notes. SR (Sharpe Ratio), *(The portfolio with highest Sharpe ratio or return built by GA), ^ (The portfolio with highest Sharpe ratio or return built by MV).
Represents portfolio built by (MV)Mean-variance.
Represents portfolio built by (GA)Genetic algorithm.
The findings suggest that GA typically outperforms the MV methodology, especially as the portfolios increase in the proportion of REITs and REITs in the portfolio. This outperformance is evidenced by above-average expected returns and Sharpe ratios for most portfolios. For example, the genetic algorithm achieves 1.14% higher returns and 0.0267 higher Sharpe ratios than the average for portfolios in which REITs and hybrid REITs comprise 90% of the assets. These results highlight the effectiveness of the genetic algorithm in capturing the complex nonlinear relationships in REIT-dominated portfolios.
Overall, the GA delivers better performance than the MV in mixed-REIT portfolio optimization. This phenomenon appears in most portfolios: the differences of expected return and Sharpe ratio obtained between the GA and MV increase when the percentages of EREITs and MREITs increase. For example, when the EREITs and MREITs occupy 90% of the portfolio (E + S), the differences of expected return and the Sharpe ratio between GA and MV are 1.14% and 0.0267 respectively. However, our results also show few outcomes in which MV outperforms GA. This phenomenon exists in some particular portfolios and when EREIT and MREIT are accounted for at a low percentage. For example, in portfolio (E + G + B) and (M + G + B), the expected return and Sharpe ratio of GA are lower than those of MV when REITs occupy 10% and 20%. The same situation occurs when the other portfolios contain bonds and have fewer than three assets. We propose two reasons for this phenomenon. First, the limitations of the MV method may contribute to this outcome. Perrin and Roncalli (2019) argue that when a portfolio contains too many assets, the mean-variance method struggles with the multicollinearity problem, making it difficult to obtain an accurate inverse matrix. Second, MV may outperform GA in low-volatility periods when asset price fluctuations are minimal. In stable and predictable market conditions, the simplicity and directness of the MV method can be advantageous, whereas GA’s inherent randomness and search-based optimization may not offer significant benefits.
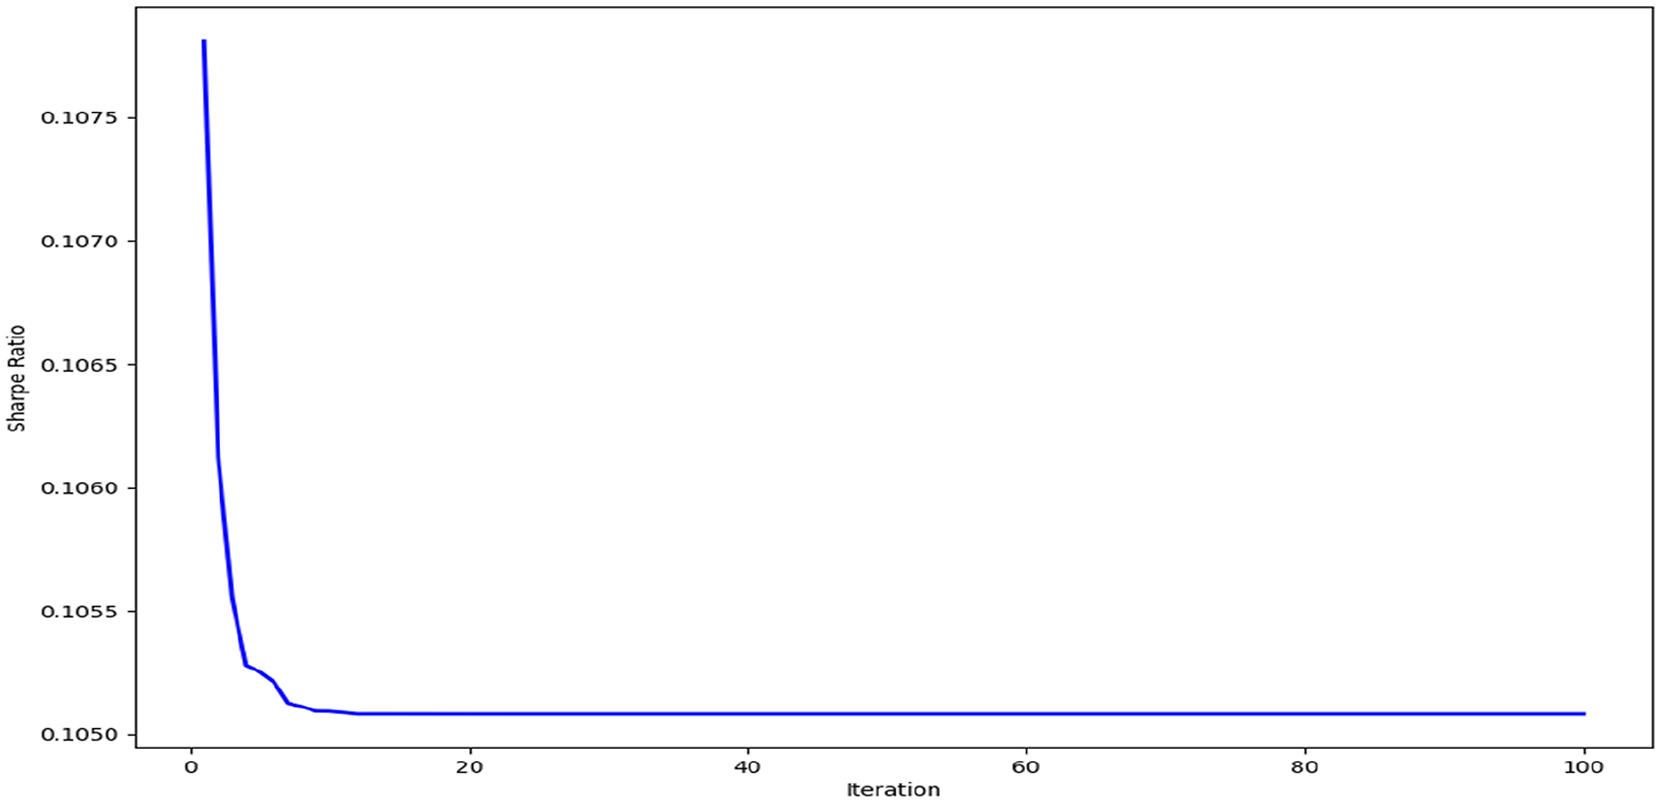
It has been suggested in past studies that a modified mean-variance model can solve the problem of the number of assets in the portfolio by taking more time (Cesarone et al., 2013). However, these studies also indicate that the machine learning approach may spend less time and achieve more accurate results. Figures 2 and 3 show the genetic algorithm working process of portfolios 6 and 8: when the portfolio contains the largest number of assets, after 6 and 7 iterations, the genetic algorithm achieves the optimal portfolio. Calculation results for the portfolio (E + B + S). *Note. The optimal portfolio achieves after 6 times of iterations. Calculation results for the portfolio (M + G). *Note. The optimal portfolio achieves after 7 times of iterations.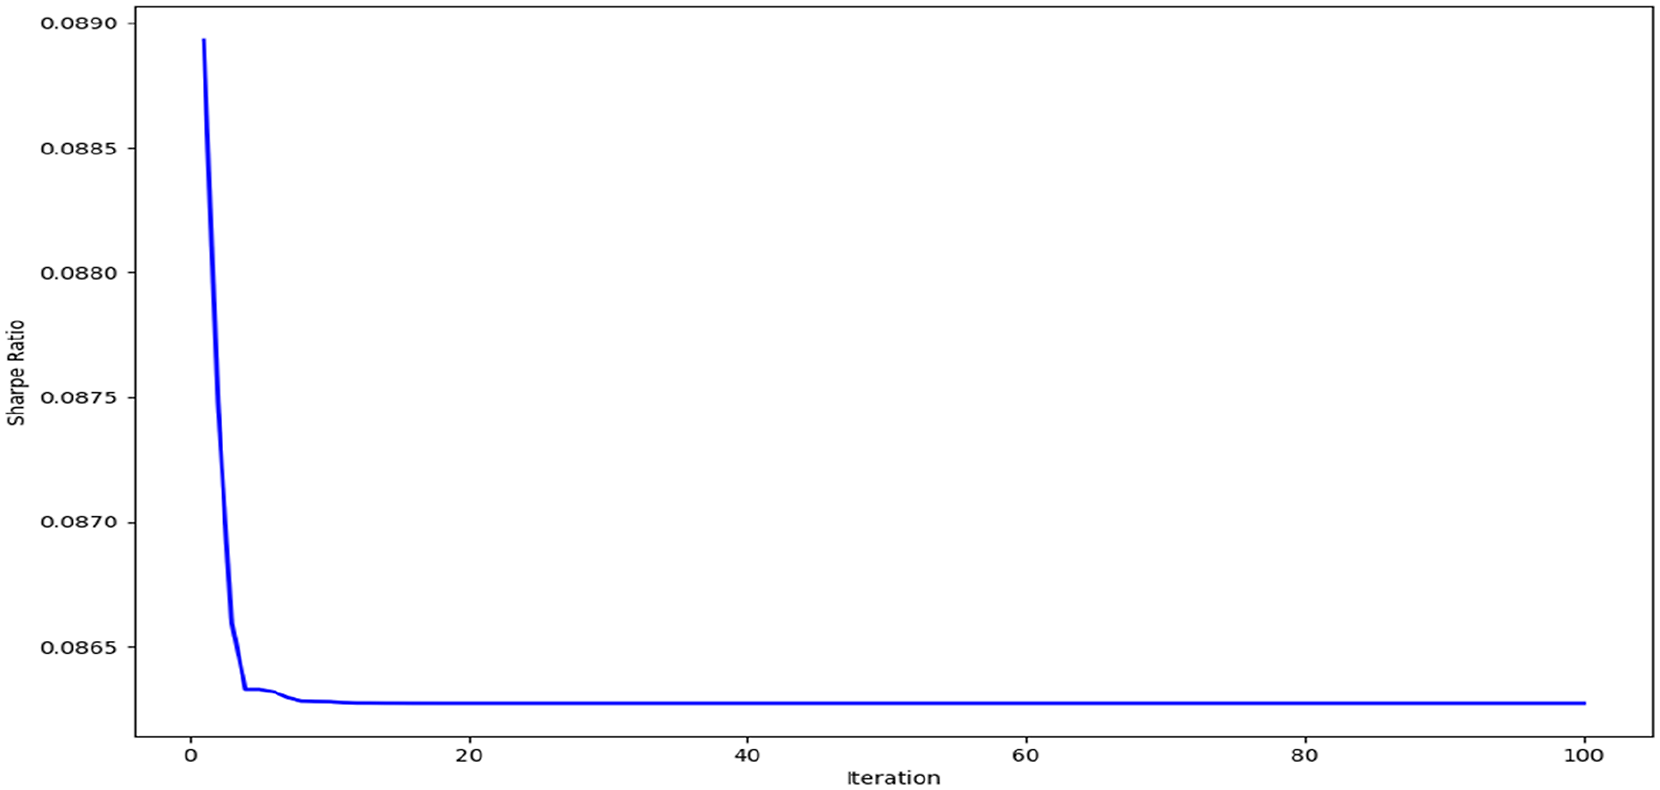
Sub-Period Analysis and Economic Value
Sub-Period Results for EREIT and MREIT [Genetic Algorithm and Mean-Variance].
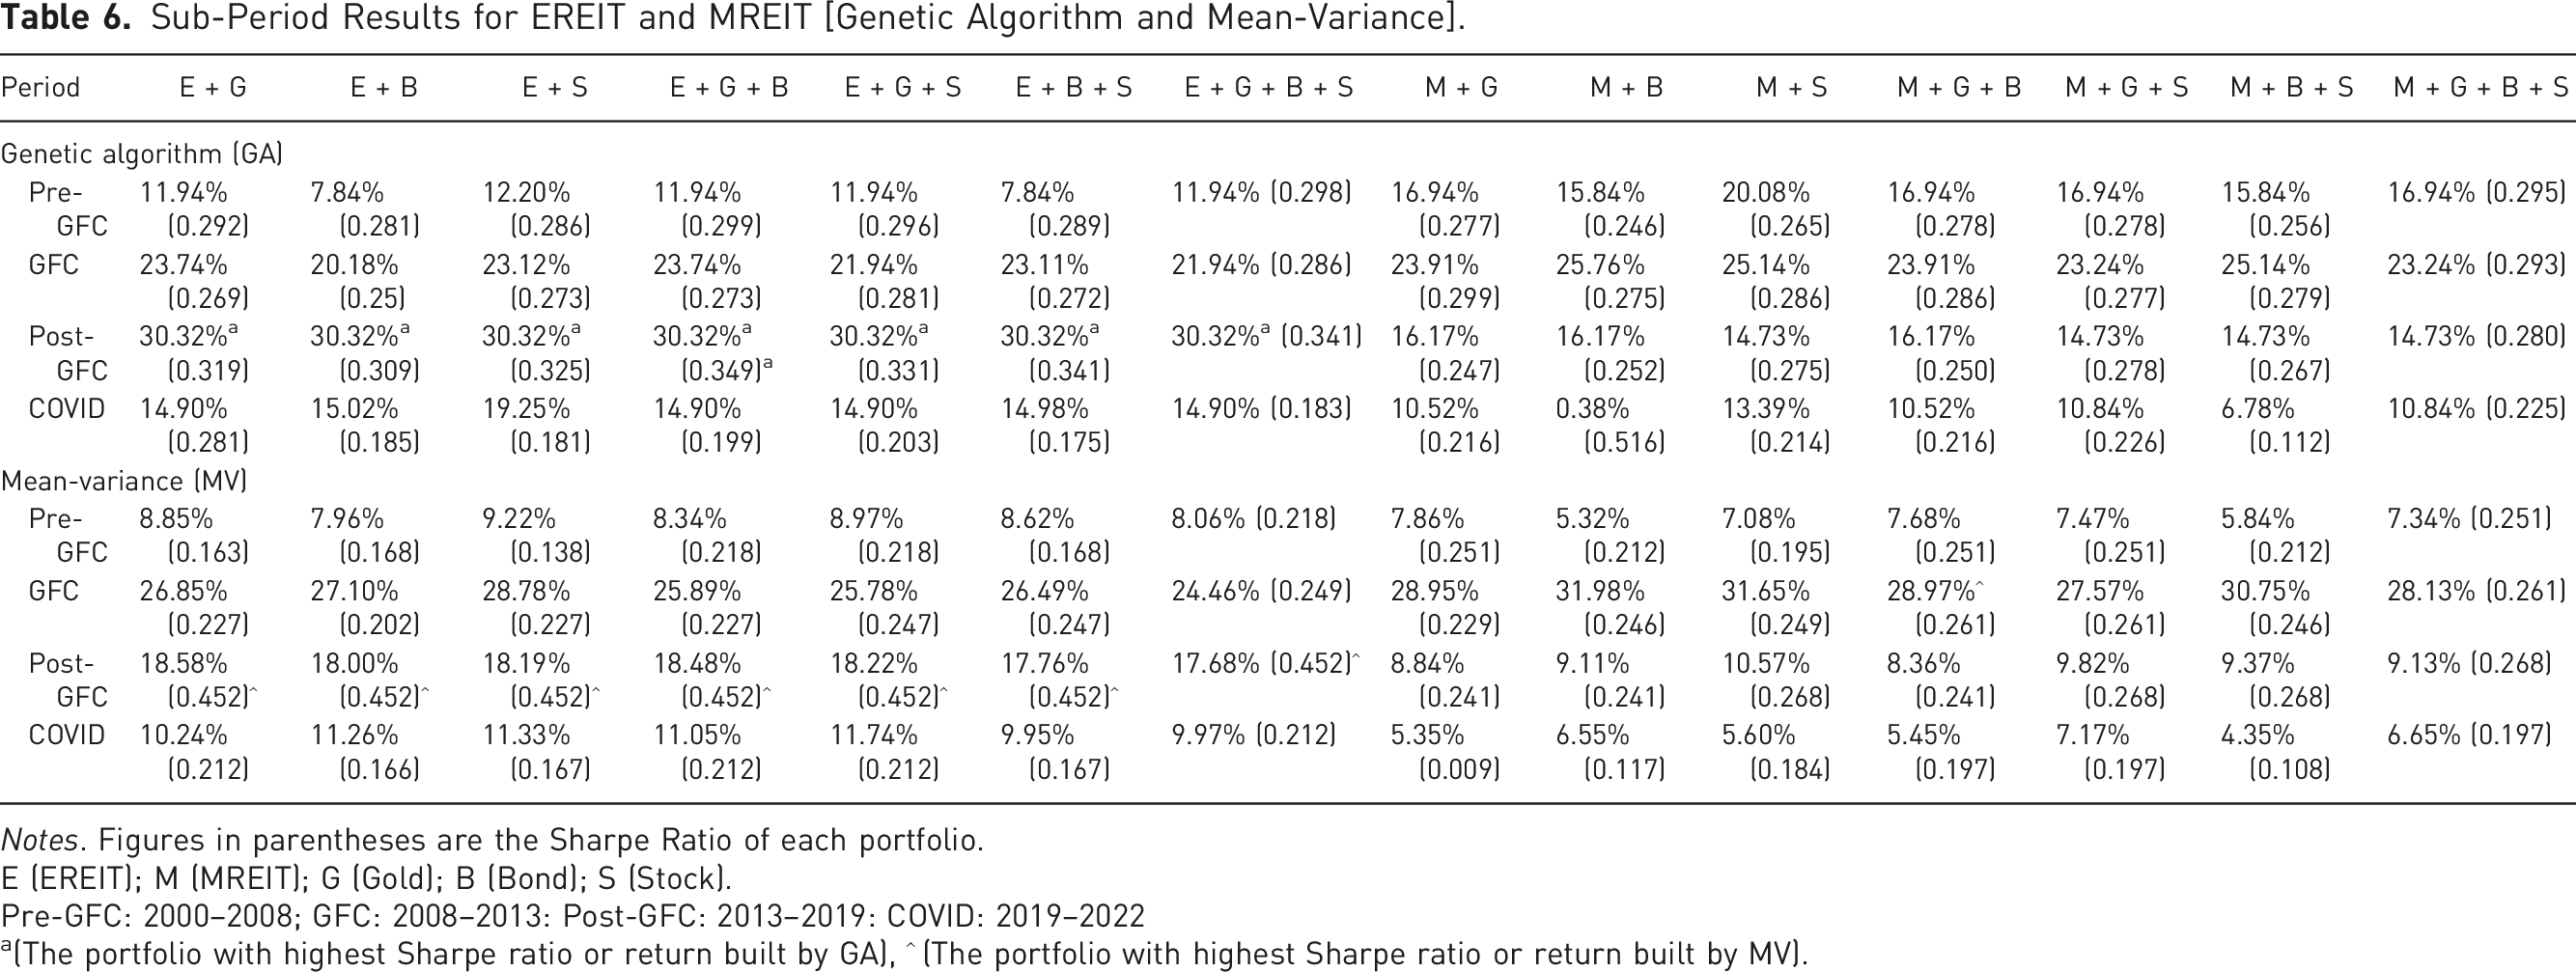
Notes. Figures in parentheses are the Sharpe Ratio of each portfolio.
E (EREIT); M (MREIT); G (Gold); B (Bond); S (Stock).
Pre-GFC: 2000–2008; GFC: 2008–2013: Post-GFC: 2013–2019: COVID: 2019–2022
a(The portfolio with highest Sharpe ratio or return built by GA), ^ (The portfolio with highest Sharpe ratio or return built by MV).
In addition to improving the economic value and providing more information to investors, we compare the portfolio utility between two methods. Utility is a measure of relative satisfaction that an investor derives from different portfolios: a higher utility indicates a higher expected return to the investor at the same risk tolerance level (Dong et al., 2022). We estimate 12- month future expected return and variance based on our sub-period testing results. The utility function is given by:

Utility Results for EREIT and MREIT [Genetic Algorithm and Mean-Variance].
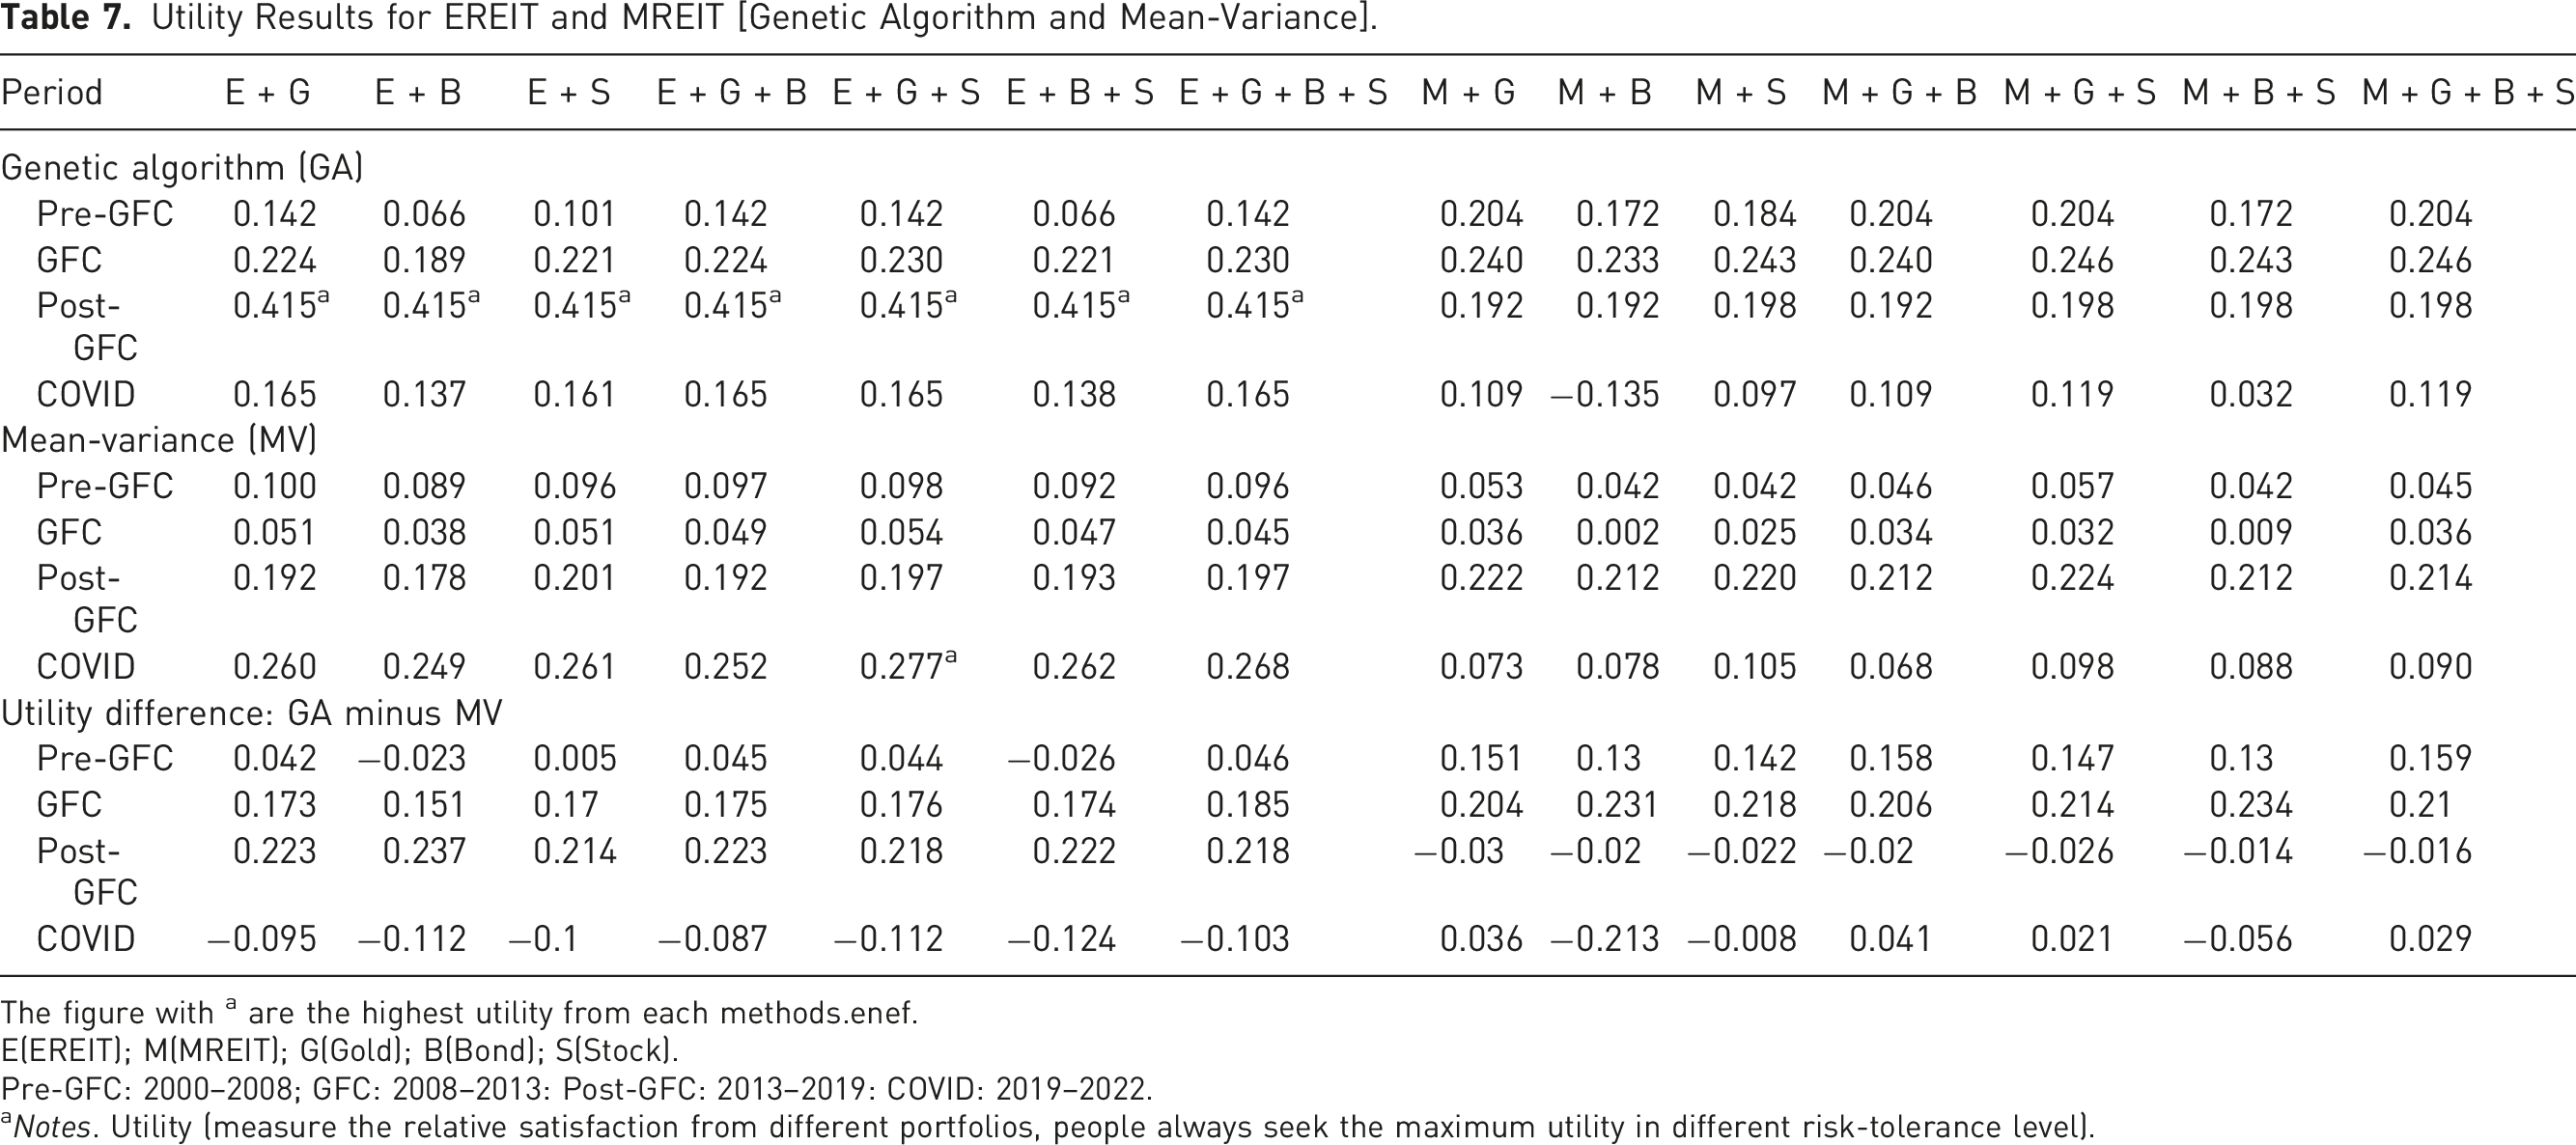
The figure with a are the highest utility from each methods.enef.
E(EREIT); M(MREIT); G(Gold); B(Bond); S(Stock).
Pre-GFC: 2000–2008; GFC: 2008–2013: Post-GFC: 2013–2019: COVID: 2019–2022.
aNotes. Utility (measure the relative satisfaction from different portfolios, people always seek the maximum utility in different risk-tolerance level).
The Role of REIT in Mixed Portfolios
According to our results, REITs, particularly equity REITs (EREITs) and mixed REITs (MREITs), have a significant impact on the overall performance of mixed portfolios. Our analysis suggests that increasing the weight of REITs in a portfolio tends to improve expected returns and Sharpe ratios, resulting in better risk-adjusted performance. This finding applies across a wide range of portfolio compositions and economic periods, highlighting the critical role of REITs in portfolio optimization.
As the proportion of REITs in a portfolio increases, so does the expected return. For example, in portfolios combining EREITs or MREITs with bonds (E + B and M + B), expected returns increased by 12.44% and 9.89%, respectively, as the REIT allocation rose from 10% to 90%. This indicates that REITs not only enhance portfolio returns but also diversify risk, as reflected by the increase in the Sharpe ratio. The Sharpe ratio, a measure of risk-adjusted performance, continues to rise as the proportion of REITs increases, peaking at around 70% of the portfolio. Beyond that point, the ratio begins to decline slightly, indicating a potential threshold where the benefits of further REIT allocation diminish.
This phenomenon underscores the dual role of REITs in a portfolio: they are both return enhancers and risk diversifiers. As REIT allocations rise, Sharpe ratios improve, suggesting that REITs can enhance risk-return profiles and serve as an important component of mixed-asset portfolios. For portfolio managers, this implies that the prudent inclusion of REITs can improve portfolio performance, particularly in moderate to high volatility environments.
The analysis also reveals significant differences between the performance of EREITs and MREITs within portfolios. EREITs consistently outperform MREITs in terms of expected returns and Sharpe ratios, a difference that is crucial for investors and portfolio managers incorporating REITs into their investment strategies. The outperformance of EREITs can be attributed to several factors, including structural features and market behavior.
EREITs primarily invest in real assets and tend to provide a stable income through rental revenue and potential capital appreciation. Their performance is closely linked to the real estate market, which generally has strong long-term growth potential. In contrast, REITs investing in real estate debt and mortgages, especially since the early 2000s, have become more defensive. As Sing et al. (2015) point out, MREITs have been structurally modified to protect investors, leading to lower returns, reduced volatility, and more conservative risk profiles. This structural shift makes MREITs less attractive than EREITs in terms of return potential, particularly in growth-oriented portfolios.
In light of these findings, we recommend that investors and portfolio managers prioritize EREITs over MREITs when constructing portfolios that include REITs. EREITs not only deliver higher returns but also offer more effective risk management. This recommendation is especially relevant for long-term investment strategies where growth and risk-adjusted returns are key objectives.
The results of this study have several practical implications for portfolio construction and management. First, there is strong evidence that including REITs—particularly EREITs—in mixed-asset portfolios can significantly enhance overall performance. This is especially effective during periods of economic growth or recovery when the real estate market is performing well. Portfolio managers should consider allocating a significant portion of their portfolios to REITs to capitalize on their return-enhancing and risk-diversifying features.
Second, the study emphasizes the importance of adjusting REIT allocations according to market conditions and economic cycles. For example, during periods of economic instability or recession, it may be prudent to allocate more defensively, including MREITs, to protect against downside risks. However, in stable or bullish markets, increasing the allocation to EREITs may result in superior performance.
Finally, the observed threshold effect suggests that the Sharpe ratio peaks when the REIT allocation reaches approximately 70%, indicating an optimal level of REIT allocation beyond which returns begin to taper off. Portfolio managers should keep this in mind when constructing portfolios to find the optimal allocation point that maximizes the benefits of REITs while avoiding overexposure to potential risks.
In summary, REITs play a key role in mixed-asset portfolios, offering both higher returns and enhanced risk management. EREITs, in particular, stand out as superior investment vehicles compared to MREITs, making them the preferred choice for investors seeking to optimize portfolio performance and safety. These insights provide valuable guidance to portfolio managers and policymakers in designing investment strategies that leverage the unique advantages of REITs.
Conclusion
This study has examined the effectiveness of the machine learning approach in portfolio optimization for the US REITs and explored how different weights of EREITs and MREITs affect different portfolio returns and the Sharpe ratio. In the 1960s, the US Congress introduced the REIT, allowing people to invest without actually buying property and be able to trade in the secondary market. Previous studies claim that REIT is more of a stand-alone financial product than stock is. Furthermore, REITs are more resilient in the face of systemic financial risks and unforeseen events, such as COVID (2020–2022) and GFC (2009–2013). REIT is divided into EREIT and MREIT based on their different characteristics and structures.
This study reviews popular portfolio optimization methods, mean-variance and genetic algorithm, and other machine learning approaches, such as ANN and SVM. The classical mean-variance (MV) method, introduced by Harry Markowitz in 1952, is a popular tool for portfolio selection, aiming to maximize returns while managing risk. However, the MV model has shortcomings, especially when handling a large number of assets. To overcome this, the Limited Asset Markowitz model was proposed, which limits the number of assets in the portfolio. Moreover, Wang (2000) proposed a hybrid of the MV and mean-Value-at-Risk (VaR) models, enhancing risk evaluation. Despite these improvements, issues with risk control persisted. Consequently, the mean-variance-skewness-kurtosis model was developed, introducing additional constraints for better risk management in portfolio optimization. The genetic algorithm (GA), a machine learning technique, has gained popularity in portfolio selection and optimization, dealing effectively with issues such as cardinality constraints, minimum transaction lots, and sector capitalization capacity. Research compares its performance favorably to the classical mean-variance method, with GA shown to handle the minimum transaction lots of problem more efficiently. It can optimize portfolio returns and construct extensive portfolios with multiple assets.
Our study offers two main contributions. Firstly, we examine how varying proportions of EREIT and MREIT in a portfolio influence returns and risk, a gap in existing studies. We find that optimal portfolio returns occur when REITs comprise 50–60% of the portfolio. Secondly, we compare the GA and MV method in constructing REIT-mixed portfolios. Generally, GA outperforms MV, except in portfolios with less than three assets and those containing bonds. Sub-period tests of 14 REIT-mixed portfolios confirm these findings. Additionally, utility tests of each sub-period portfolio provide valuable insights for investors, showing GA’s superior performance in optimizing REIT-mixed portfolios.
This paper addresses the previous research gaps by covering the following aspects: first, separate analysis of EREITs and MREITs: unlike previous studies that treated all REITs as a homogeneous group, this research specifically examines the performance and impact of Equity REITs (EREITs) and Mortgage REITs (MREITs) separately in the portfolio. By differentiating between these two types of REITs, we gain a better understanding of their individual contributions to portfolio returns and risk. Second, examination of REIT weight shifting: Previous studies have overlooked the effect of shifting REIT weights on portfolio returns. In contrast, this research investigates how changes in the percentage allocation of REITs within the portfolio impact overall returns. By analyzing the dynamics of REIT weight shifting, we provide valuable insights into the optimization of REIT allocations in portfolios. Third, efficiency of the genetic algorithm: while earlier study has demonstrated the feasibility of the genetic algorithm, this paper goes further exploring and discussion its efficiency by compare the portfolios optimal between genetic algorithm and the mean-variance method. By applying the genetic algorithm to optimize the REIT allocation in portfolios, we assess its effectiveness in improving portfolio performance and risk management.
The results of this study provide valuable insights for investors and portfolio managers who wish to optimize their REIT portfolios. By demonstrating the superiority of genetic algorithms over traditional mean-variance methods, particularly in portfolios with large REIT weightings, this study highlights the potential for enhanced returns and improved risk management. Investors can use genetic algorithm-based optimization methods to achieve more efficient asset allocation, especially in volatile markets, and REITs have proven to be strong performers in improving portfolio resilience. These insights can guide the development of more sophisticated investment strategies and products, ultimately helping investors achieve higher returns while managing risk effectively.
However, genetic algorithm has some limitation. First, although GA has capacity to handle numerous and complex datasets, they also need significant improvement of computer hardware. Second, the GA is highly relied on the appropriate parameter setting, such as mutation rate, crossover rate, and population size. Every parameter setting would cause the different optimal results.
The recent decline in the number and size of mortgage real estate investment trusts (MREITs), as reported by sources such as NAREIT, may significantly impact the results of this study. This trend could affect the performance and risk profile of MREITs, potentially altering their role in mixed portfolios. As MREITs become less prevalent and possibly more concentrated, their contribution to portfolio returns and diversification benefits may decrease. Investors and portfolio managers should account for these market trends when applying our findings, as the evolving environment for MREITs may necessitate adjustments to portfolio strategies to maintain optimal performance and risk management. Future research should continue to monitor these developments to ensure that optimization models remain relevant and effective under changing market conditions.
Our study claims that the genetic algorithm is both effective and efficient in its portfolio selection and optimization for a REIT-mixed portfolio in the US market. Our findings also imply that REIT plays an important role in financial market and portfolio optimization, and offers diversification benefits compared to stocks and bonds. Therefore, many countries and policymakers are establishing and vigorously developing REIT markets, such as China. To extend this finding to a large scale, future researchers can conduct further studies in the following two areas. First, researchers can compare the efficiency and effectiveness of different machine learning approaches, not only the genetic algorithm, to identify the utility of machine learning approaches in portfolio selection and optimization for REITs. Second, researchers can study the datasets of REITs in more countries, not only the US market, to test whether the similar findings remain when the data sources are changed.
Footnotes
Declaration of Conflicting Interests
The author(s) declared no potential conflicts of interest with respect to the research, authorship, and/or publication of this article.
Funding
The author(s) received no financial support for the research, authorship, and/or publication of this article.