
Abstract
There has been a great deal of interest recently in understanding the potential role of fintech firms in expanding credit access to underbanked and credit-constrained consumers. We explore the supply side of fintech `credit, focusing on unsecured personal loans and mortgage loans. We investigate whether fintech firms are more likely than other lenders to reach out to “underserved consumers,” such as minorities; those with low income, low credit scores, or thin credit histories; or those who have a history of being denied for credit. Using a rich data set of credit offers from Mintel, in conjunction with credit information from TransUnion (TU) and other consumer credit data from the FRBNY Consumer Credit Panel/Equifax Data, we compare similar credit offers that were made by banks, fintech firms, and other nonbank lenders. Fintech firms are more likely than banks to offer mortgage credit to consumers with lower-income, lower-credit scores, and those who have been denied credit in the recent past. Fintechs are also more likely than banks to offer personal loans to consumers who had filed for bankruptcy (thus also more likely to receive credit card offers overall) and those who had recently been denied credit. For both personal loans and mortgage loans, fintech firms are more likely than other lenders to reach out and offer credit to nonprime consumers.
Keywords
Introduction
Fintech firms became a well-known and trusted supplier of a wide variety of financial services to consumers in the last decade, from payment services to personal loans and mortgage loans. By 2019, about 96% of global consumers became aware of at least one fintech money transfer and payment service, and over three-quarters had heard of a fintech in the consumer credit space. 1 Many fintech firms, such as LendingClub, SoFi, and Rocket Mortgage (owned by Quicken), have become household names in recent years.
One of the biggest areas of fintech expansion has been in consumer credit, especially unsecured personal installment loans, which have typically been used for paying off credit card balances, debt consolidation, or large household purchases. The average year-over-year growth for the personal loan market has been more than 15% for the last several years (Beiseitov, 2019). According to TransUnion (2019), 38% of personal loans outstanding as of December 2018 were originated by fintech firms, compared with only 5% in 2013, a dramatic increase over the span of 6 years.
This trend is borne out in credit mailing offers as well. Figure 1 presents the total volume of personal loan (offer) mailings sent to consumers, broken down by lender types (banks, traditional nonbanks, and fintech lenders). Starting from almost zero credit offers in 2010, fintech credit offers started growing rapidly ― and surpassed credit offers by both banks and traditional nonbanks in 2014 to peak at about 1.2 billion in 2016. In addition to establishing a footprint in the personal lending space, fintech firms have also established a significant presence in mortgage lending. Indeed, one of the fintech mortgage lenders, Quicken, and its subsidiary Rocket Mortgage, have become the largest mortgage originator in the United States. Trends in personal loan mail volume by lender type. Data source: Mintel comperemedia, Inc. Direct mail monitor data and TransUnion LLC match file (2018).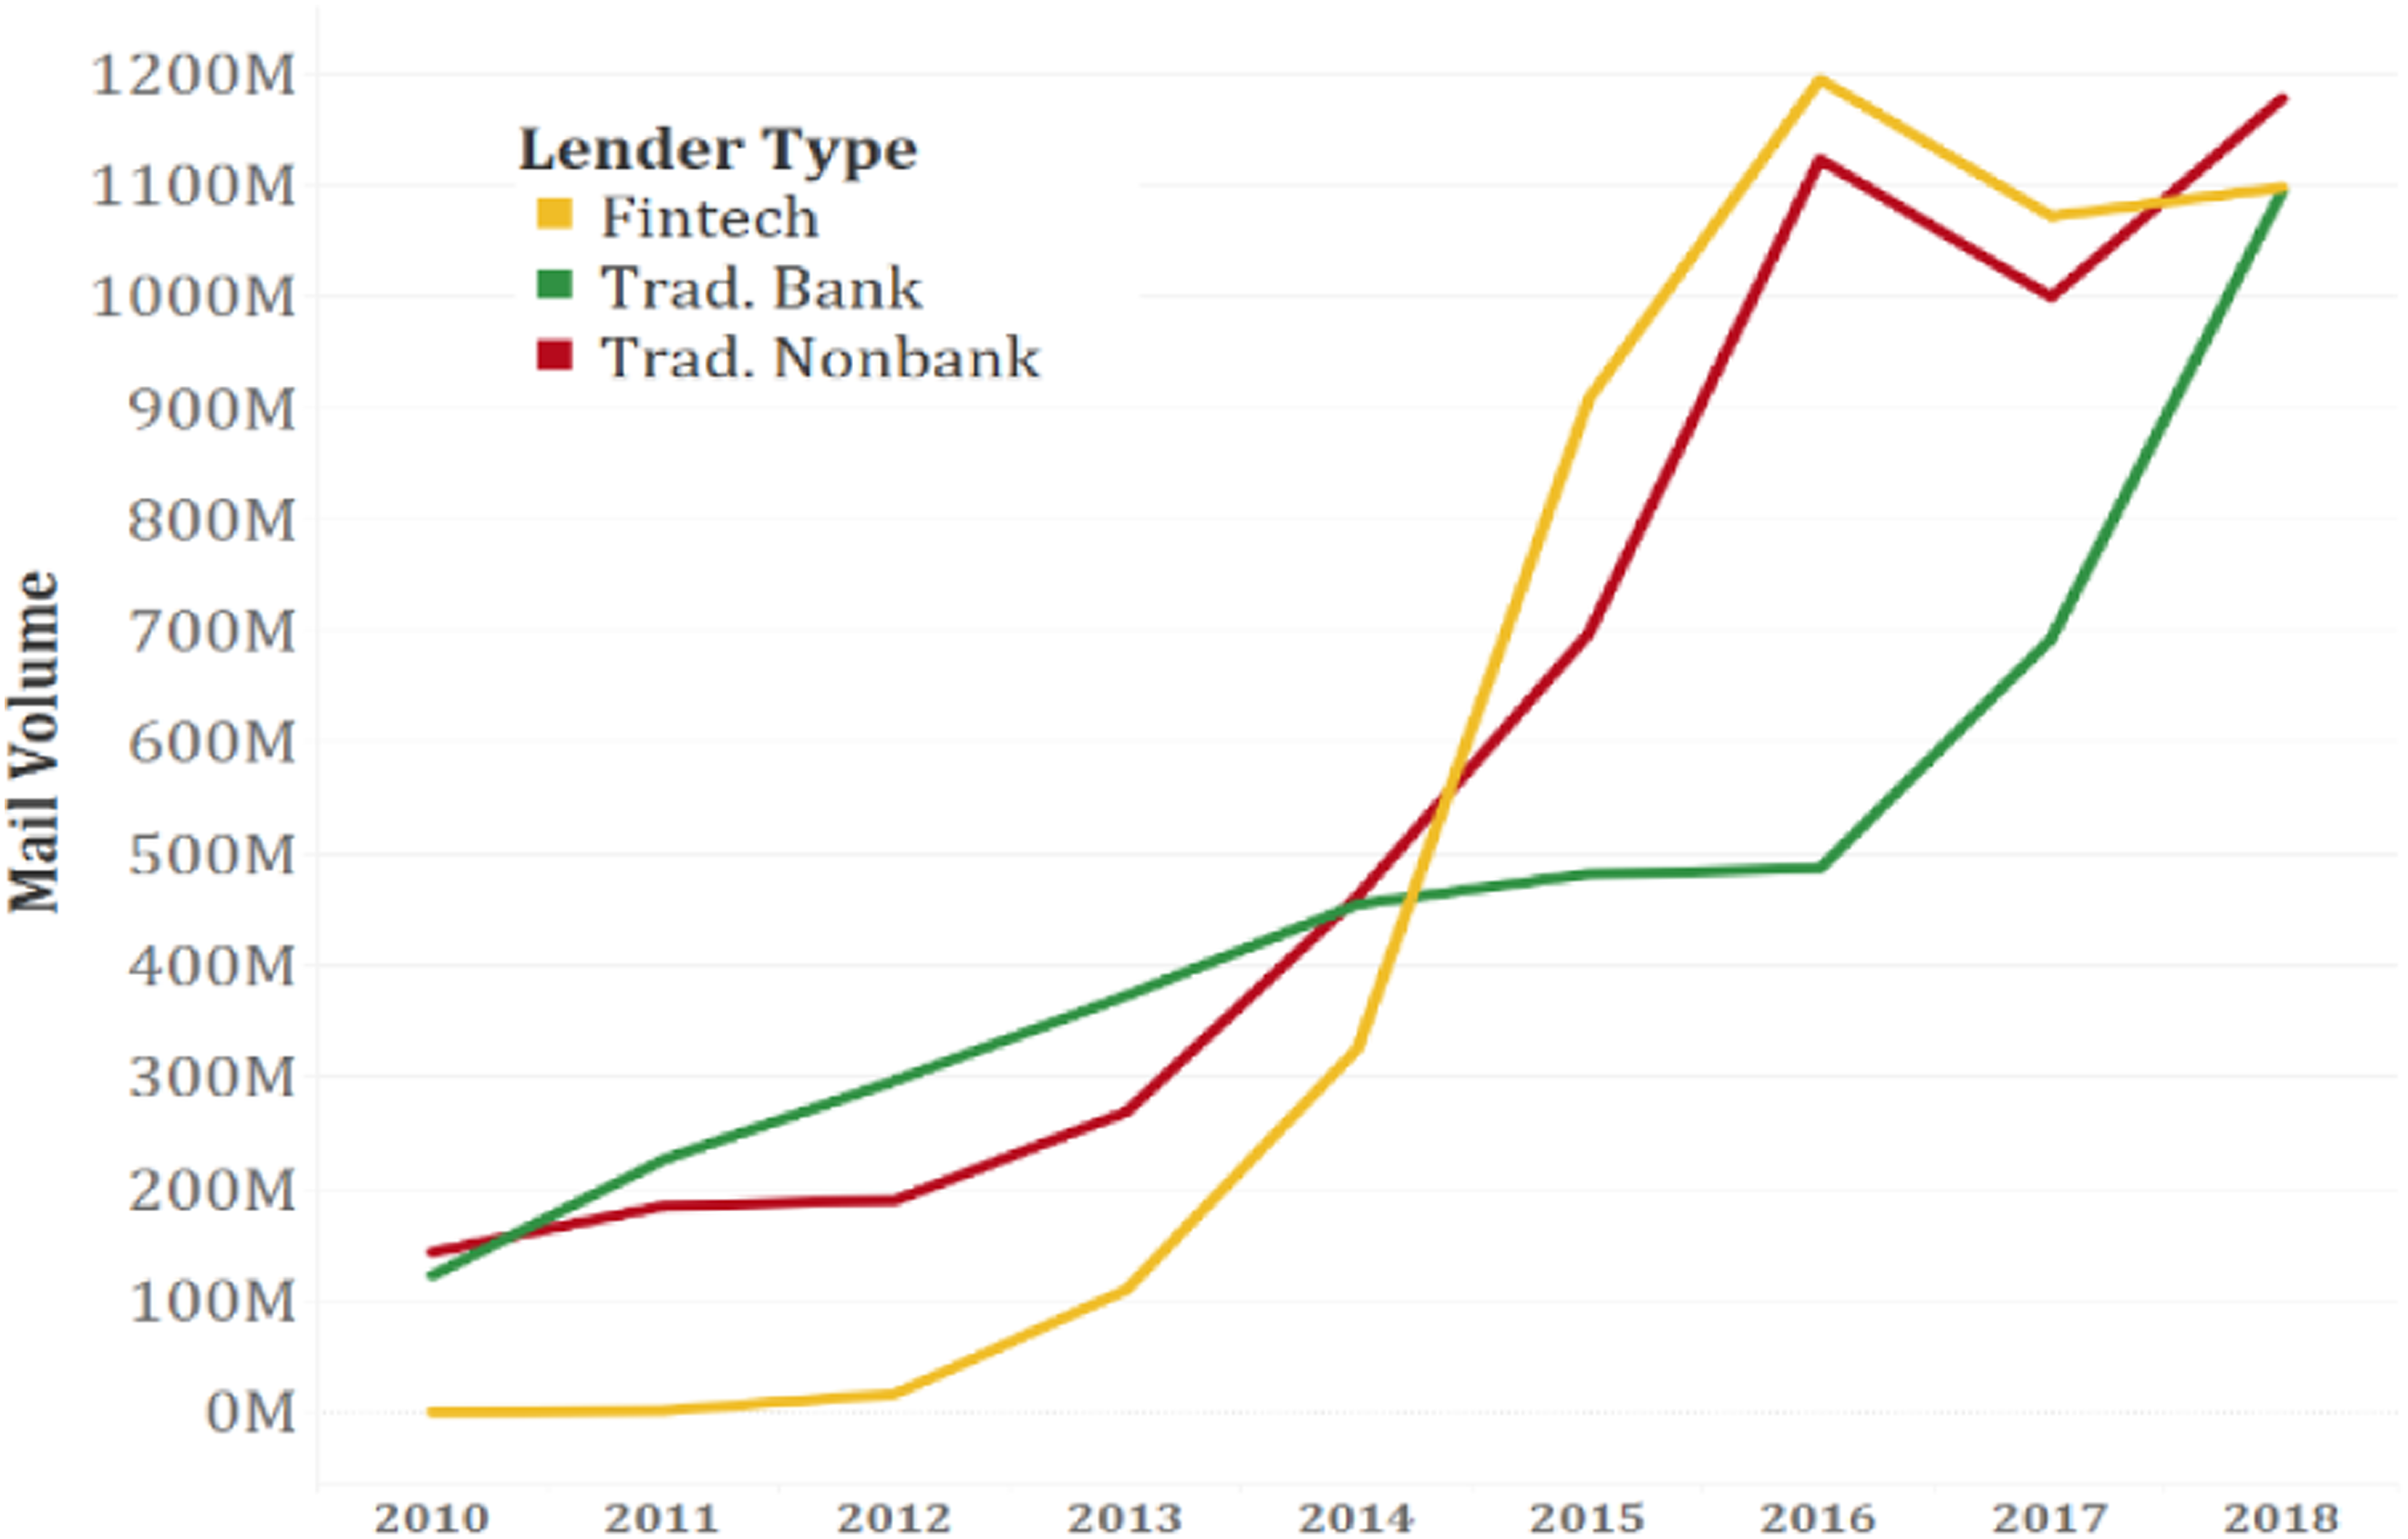
The goal of this paper is to explore the role of fintech lenders in expanding credit access to underserved consumers in the personal lending and mortgage lending space. We focus on lenders’ willingness to lend (as measured by their credit offers) to underserved consumers, using a unique data set containing consumer risk characteristics, the financial products offered, and the lenders’ characteristics that allow us to examine details about the financial product offered to different types of consumers (with varying credit scores, income, etc.). Specifically, we ask these questions. First, are fintech lenders targeting underserved consumers in the personal loan and/or mortgage markets more so than other types of lenders? Second, are consumers paying a higher or lower interest rate (measured in annual percentage rate (APR)) to fintech firms compared with banks and traditional nonbank lenders?
In short, we find that fintech firms do appear to reach out to consumers with less access to credit along some dimensions more so than banks, but the findings differ across product types. For both personal loans and mortgages, we show that fintech firms reach out to lower-score consumers more so than banks do, potentially identifying creditworthy borrowers (who are not well-served by banks) from the subprime pool of borrowers. Fintech firms also reach out to consumers who have recently been denied credit. In addition, fintech firms are much more likely to send out offers for FHA (Federal Housing Administration) mortgages, which is a product that is often used by lower-income and possibly credit-constrained consumers. We also find that some of the previously well-served consumers (with higher loan balances and higher incomes), who later became credit-constrained, have been getting credit offers from fintech lenders as well.
Our study is unique in several ways. First, we focus solely on the supply side of credit — to explore fintech lenders’ willingness to offer credit to those who may not have been able to access credit otherwise. It would be then up to consumers to choose whether to take up the offer from fintech lenders or traditional lenders. Most research studies so far have focused on loan origination, which is determined by both supply and demand. For example, Jagtiani and Lemieux (2018) find evidence supporting the hypothesis that fintech (personal loan) lenders penetrate areas that are underserved by traditional lenders. In addition, Jagtiani et al. (2021) find similar evidence for fintech mortgage lenders where mortgage loans are more likely to be originated by fintech lenders in areas that experience higher mortgage denial rate by traditional lenders. 2 We fill the literature gap by exploring credit offers (rather than origination) and providing additional insights into fintech firms’ commitment and lending decisions.
Second, we compare fintech lenders with both traditional banks and traditional nonbanks (other nonbank lenders) to also control for the regulatory environment to which lenders are subject. All lenders, whether banks or nonbanks, are subject to some regulations, such as fair lending and consumer protection. Banks, with access to federal deposit insurance, are subject to more stringent regulations, and they are subject to periodic onsite examination by the banking regulators (the Federal Reserve, the Office of the Comptroller of the Currency, state banking regulators, and the Federal Deposit Insurance Corporation). Nonbank lenders operate in a more similar environment, regardless of whether they are fintech lenders or traditional nonbank lenders. The primary difference is that fintech lenders would leverage alternative data and more complex artificial intelligence/machine learning (AI/ML) modeling in their risk evaluation and pricing and in their fully digitized credit-decisioning process. 3
Third, we use a diverse and extensive set of measures of access to credit at both the anonymized individual consumer level and the geographic (zip code) level to gain a robust understanding of the potential roles of fintech lenders in filling the credit gaps and enhancing consumer credit access overall.
The remainder of the paper proceeds as follows. The following section provides a brief review of the literature, highlighting recent research on fintech lending and focusing on mortgages and personal loans. Thereafter, we discuss the data used in this paper. The empirical approach is then presented, afterwhich we present our results for both mortgages and personal loans. We then discusses limitations, and the final section provides implications and concludes.
Related Literature and Our Contribution
The current literature posits two potential explanations for fintech loan growth, with mixed empirical results. On the one hand, fintech firms may be reaching out to consumers with little access to formal financial markets, thus filling a credit gap. Specifically, fintech lenders may be able to identify good borrowers of the subprime pool, using more complex, proprietary algorithms, and alternative data. These “hidden prime” consumers may appear high risk using traditional metrics (such as credit scores) but who have a high likelihood of repayment, especially those with a short credit history whose credit score may not reflect their creditworthiness. Beyond targeting subprime borrowers, fintech lenders could also try to reach other consumers with less access to formal financial services, such as those in rural areas, those with limited access to bank branches, and consumers in low-income and minority communities. On the other hand, fintech firms may simply be reaching out to the same consumers that are well-served by banks, wooing consumers with faster service and potentially lower rates -- poaching the best borrowers from banks.
Jagtiani and Lemieux (2019) demonstrate how fintech lenders could potentially fill the credit gap through their superior ability to identify creditworthy borrowers from the subprime pool. Furthermore, Jagtiani et al. (2023) examine whether the best customers (those in the highest credit score segments) are getting better treatment by fintechs. They find no evidence that the highest-rated consumers are getting unusually lower loan rates than what other consumers could get from the same fintech lender. Other previous studies also explore the roles of fintech in expanding credit access and the price they offer, using different data sets and different methodologies, and they arrive at different results. Numerous studies find that fintech firms seem to compete for the same consumers that banks serve, although they target the lower-credit-quality portion of the bank’s borrower pool.
Cornaggia et al. (2018) show that the expansion of fintech firms in the unsecured loan market leads to declining loan volumes for traditional banks, driven largely by declines in the higher-risk segment. This implies that fintech firms compete for bank customers, especially those higher-risk borrowers. Despite higher-funding costs at fintech firms, Cornaggia et al. (2018) conclude that fintech lenders could offer a lower rate of interest than banks because of their cost advantage driven by smaller overheads and other operational costs.
Similarly, Di Maggio and Yao (2019) use account-level consumer credit panel data, focusing on unsecured installment personal loans, and they find that consumers who receive fintech personal loans tend to, on average, have a higher income, have a better credit history, live in more affluent neighborhoods, and have significantly more credit accounts, but they tend to have higher credit-utilization ratios than a matched sample of bank borrowers. These borrowers might have already maxed out their ability to get credit from traditional lenders, given their large credit lines and high utilization ratios. These seem to be borrowers who were previously well-served but later became credit constrained.
Tang (2019) examines whether fintech and traditional bank loans are substitutes or complements. The author notes that if they are complements, fintech lenders and banks would be serving different segments of customers, with fintech firms serving the lower-quality (lower-score) segment. Any negative exogenous change in bank credit supply would result in a higher quality of the fintech firms’ borrower pool, as the least creditworthy bank consumers (but higher quality than the fintech segment assuming they are complements) would be denied loans by traditional banks and migrate to fintech lenders, thereby raising the average quality of the fintech pool. Using an exogenous constriction in bank credit supply resulting from a change in regulations, Tang (2019) finds that banks and fintech firms are most likely substitutes rather than complements. They conclude that both fintechs and banks serve the same borrower pool (based on credit scores), providing potential evidence against the claim that fintech lenders serve credit-constrained consumers.
In contrast, De Roure et al. (2016) examine whether fintech and bank loans serve the same pool of borrowers, using data from the German peer-to-peer (P2P) lending market, and they find that these lenders tend to serve a riskier segment of the market that traditional banks are unwilling to serve. Fintech lenders charge a higher price to compensate for the extra risk that they assume. In this sense, fintech firms operate as a complement to traditional banks, expanding their access to consumers who would not be served by traditional credit markets. However, Friedline et al. (2020) suggest that limited access to internet could serve as an obstacle for low-income consumers to access fintech credit.
Jagtiani and Lemieux (2018) find that fintech firms provide access to credit to borrowers in areas that are underserved by traditional banks. The authors use account-level data from the LendingClub consumer lending platform, account-level data from Federal Reserve Y-14M stress test data (reported by large banks that are subject to CCAR stress testing), and other data sources to explore the relationship between fintech lending activity and various measures of credit gaps, such as banking market concentration, bank branches per capita, and local economic conditions. Their results indicate that the ratio of personal loans originated by LendingClub is proportionately larger in zip codes with highly concentrated banking markets and in areas with fewer bank branches per capita, thus fintech lenders have a potential to expand credit access in areas that are underserved by traditional banks. Similarly, Maskara et al. (2021) show that in a rural community, fintech loan requests increase when number of bank branches decrease, suggesting that fintech could enhance financial inclusion of those lacking traditional banks.
Studies of the mortgage sector paint a slightly different picture, with some evidence that fintech firms draw customers away from traditional banks. Fuster et al. (2019) find no evidence that fintech firms disproportionally target consumers in traditionally underserved demographic groups in the mortgage market. The authors find that fintech firms reduce processing time by about 10 days with an even larger effect for refinances. The main draw of fintechs appears to be the faster loan process, particularly for refinances. Similarly, Buchak et al. (2018) do not find dramatic differences between consumers who obtain mortgages from fintechs and those who obtain them from banks. They do find, however, that the average income of fintech borrowers is about $1000 lower than traditional bank borrowers. They also find that fintech firms charge a premium of 14–16 basis points, concluding that the main driver of the fintech expansion is added convenience and changing consumer tastes, rather than cost savings or the expansion of credit to previously underserved consumers.
Conversely, Jagtiani et al. (2021) find suggestive evidence that fintech firms are expanding credit access to those likely to be underserved by traditional lenders. They show that mortgage loans are more likely to be fintech loans in zip codes that experience higher mortgage denial rates by traditional lenders (banks and nonbank lenders) in the previous period. In addition, they find a larger market share of fintech mortgage origination in areas with lower average credit scores, and that fintech firms tend to market more to borrowers in nonurban areas than other nonbanks. They point out that interest rates on mortgages are expected to vary by product types, thus producing different findings across previous studies that focus on different mortgage products. Studies that focus on FHA mortgage data would find different results than those that use conventional mortgage data. Conventional mortgage borrowers are not likely to be underserved by banks, but they may choose to go with fintech lenders and be willing to pay a premium rate in exchange for faster and better service.
Outside the United States context, several cross-country studies have shown that fintech lenders are more present in areas where businesses and consumers may have a harder time accessing credit. For example, Cornelli et al. (2022) find that the fintech credit volumes are large in countries that have fewer bank branches per capita and higher bank mark-ups (indicating more concentration in the banking sector). Similarly, Haddad and Hornuf (2019) and Kowalewski and Pisany (2023) find that there are more fintech start-ups in countries where consumers and businesses have a harder time accessing loans.
Another potential benefit of fintech lending is reducing discrimination in credit markets. The limited face-to-face interaction allowed by online applications may limit a lender’s ability to discriminate against minority borrowers. Bartlett et al. (2019) investigate discrimination in the mortgage market and find some evidence of discrimination for mortgage loans originated by fintech lenders. Interestingly, they find that the degree of discrimination is significantly reduced when the mortgages are originated by fintech lenders, although they do not eliminate discrimination completely. Fintech lenders charge African Americans 5.3 basis points more than other applicants on average, while traditional banks charge 7.9 points more. In our paper, we investigate whether fintech firms are more likely to reach out to areas with higher percentages of minorities to provide additional evidence on this question. 4
Our paper builds on the previous literature and extends it in three main ways.
The Data
Data on Credit Offers — Personal Loans and Mortgage Loans
The main data source used in this paper is the Mintel Comperemedia, Inc. Direct Mail Monitor Data and TransUnion LLC Match File (hereafter referred to as Mintel-TransUnion) data set, which is anonymized data from monthly surveys of credit offers that households receive. Mintel collects this data by sending a survey to a random sample of 8000 households every month. The data set contains a wealth of information on each of the credit offers sent to consumers, including the type of financial product offered (mortgage offers, personal loan offers, credit card offers, etc.), name of the offering lender, characteristics of the consumer, and detailed information about the offer (e.g., loan amount and interest rates). Our analysis, using data from Mintel, automatically excludes consumers who were not included in the survey. Our conclusions on the characteristics of credit offers from different lender types are drawn from those consumers who receive credit offers only. 5 Of the overall 98,379 credit offers in the sample, 34.9% are from fintech lenders, 31.3% are from banks, and the remaining 33.8% are from traditional nonbank lenders. 6
Credit offer data are then merged with TransUnion (TU) data on the consumers’ credit characteristics, such as credit score, location, and number of credit accounts past due, and anonymized. This merged data set provides a detailed picture of the supply side of financial product offerings, allowing us to compare who gets offers from banks, fintech lenders, and other nonbank lenders, controlling for a range of important characteristics of the offers and other relevant factors.
From the Mintel data set, we define the two main dependent variables of interest: (1) a binary indicator of whether an offer is from a fintech firm or traditional lenders, and (2) the interest rates offered to consumers. 7 Mintel reports a range of interest rates for the loan in each mail offer: the lower bound interest rate and the upper bound interest rate mentioned in the mail piece. For the pricing analysis, we calculate two separate spread variables (spread_low using the lower-bound offer rate and the variable spread_high using the upper-bound offer rate), which is the difference between the rates offered and the Treasury bill rate (risk-free rate) of the same time to maturity from the same month and year. If the loan period is missing, which is often the case, we use the three-year Treasury rate. We perform the analysis separately for each set of the spreads, and the results of these analyses and their implications shed light on our understanding of the roles of fintech lenders in the current financial landscape.
Underserved Population Indicators
We are interested in understanding whether fintech firms are reaching out to consumers who have less access to credit or are typically underserved by traditional lenders. As such, we create several indicators that are intended to proxy for whether a consumer is being underserved, based on two different approaches: (1) demographic variables, and (2) measures that proxy consumers’ ability to access credit. All the demographic data referenced throughout the figures and tables and in the appendices are derived from the U.S. Census Bureau’s American Community Survey (2017).
Using Demographic Indicators to Proxy for Being “Underserved”
Previous studies have documented that minorities, low-income individuals, and those who live in low-income areas or areas with high-minority populations tend to have a harder time accessing credit (higher loan-denial rates) than more affluent and nonminority consumers, and this is true across a wide variety of financial products; see Federal Reserve Board (2007), Weller (2007), Desilver and Bialik (2017), and Fairlie et al. (2020). In addition, there have also been concerns among policymakers about credit access in rural areas, given there are often fewer bank branches in these areas. We use these demographic data contained within the Mintel data set, along with data from the U.S. Census Bureau’s American Community Survey, to examine whether fintech lenders are reaching out differentially to these groups of consumers, compared with banks and other nonbank lenders.
Household Annual Income
We use the household income variable in the Mintel data set to group consumers into four segments based on their household annual income: (1) less than $25,000, (2) $25,000 to $49,999, (3) $50,000 to $74,999, and (4) more than $75,000. We consider consumers with incomes of less than $25,000 to be low income and those with incomes between $25,000 and $50,000 to be moderate income. The other groups are considered higher income.
Rural Versus Urban
We also create a rural indicator to identify consumers in rural areas, based on the rural‒urban continuum codes developed by the U.S. Department of Agriculture’s Economic Research Service. Each county is assigned a code ranging from 1 to 9, with 1 being the most urbanized (counties in metro areas of 1 million or more) and 9 being the most rural (nonmetro, completely rural, or less than 2500 in urban population, not adjacent to a metro area). From these codes, we create a dummy for whether a county is in the two most rural categories, both of which are classified as nonmetro rural.
Minorities
We use Census Bureau data to calculate the ratio of zip code’s population that is minority and the zip code’s median income as geographic measures of areas that typically have more limited access to mainstream finance.
Other Measures of Consumer’s Ability to Credit Access (Proxy for Being Underserved)
We construct six different measures to proxy consumer’s ability to access credit. Two of these are at the geographic (zip code) level: (1) bank branches per capita at zip code level, and (2) average credit scores of consumers in the zip code. And four of which are at the individual consumer level: (3) credit score (grouped into buckets), (4) number of credit card offers received (for the personal loan analysis), (5) number of credit accounts and total loan balances, and (6) total number of recent credit requests that were denied. (i) Proximity to Bank Branches: We use the number of bank branches per 100,000 population (at the zip code level) to proxy for amount of brick-and-mortar banking/financial services in the local area. We collect bank branch data from the FDIC Summary of Deposits and population data from the American Community Survey (ACS). This serves as an indicator of credit access in a geographic sense; consumers who live in an area with more banks may find it easier to go to the bank to get a loan and may obtain lower rates because of increased competition. Fintechs’ online nature may give them an advantage in reaching out to consumers in areas with fewer bank branches, which we investigate directly with this measure. (ii) Average Credit Scores at Zip-Code Level and Credit Scores at Consumer Level: We calculate the average Equifax Risk Score of consumers who live in the zip code as one of the variables that proxy for consumer’s credit access. This variable allows us to observe the impact of an individual consumer’s credit score versus the consumer neighborhood’s average Equifax Risk Score on the probability of getting credit offers from fintech and other lenders. In attempting to reach low-score consumers through direct mail offers, some lenders might have chosen to use the bulk-style mailing (e.g., doing indiscriminate dumps) to reach out to underserved consumers. The consumer-level variables on credit score and other credit access are collected from the Mintel-TransUnion merged data, which contains not only the Mintel mailing information but also many variables related to a consumer’s creditworthiness. The average Equifax Risk Score of the zip code is calculated based on anonymized consumers in the zip code, using a separate data set from the FRBNY Consumer Credit Panel/Equifax Data (CCP). (iii) Total Number of Credit Offers Received: For the personal loan analysis, we calculate the number of credit card offers that each consumer receives each month, using Mintel data. This is used as a proxy for the consumer’s ability to access unsecured credit. We perform a similar calculation to derive average total number of credit card offers that consumers in each zip code received. This allows us again to explore potential differences at the geographic zip-code level versus individual consumer level. (iv) Total Number of Credit Accounts and Total $ Loan Balances: We use the merged Mintel-TransUnion data set to create two additional measures of credit access at the consumer level: the number of all financial accounts (bankcard and non-bankcard accounts) and the log of the dollar amount of account balances (separated into revolving and nonrevolving balances). The number of accounts and the balance amount variables are direct measures of each consumer’s credit access, at least for the recent past; consumers with better access to credit are likely to have more financial accounts (and thus higher balances), and they tend to receive offers with larger loan amount (or credit limits).
8
(v) Total Number of Credit Requests Being Denied: This is a categorical variable for how many loan denials a consumer has had in the last 6 months. This variable is calculated by subtracting the number of accounts opened in the last 6 months from the number of credit inquiries in the last 6 months. We convert this into a categorical variable with the following categories: (1) consumers who have had no denials, (2) consumers with one denial, (3) consumers with two to five denials, and (4) consumers with more than five denials. We also estimated separate models using a dummy variable for whether a consumer had any denials and using a continuous variable for the number of denials. The results are robust across these additional model specifications.
Summary Statistics — Personal Loan Offers Data Period: 2015‒2018.
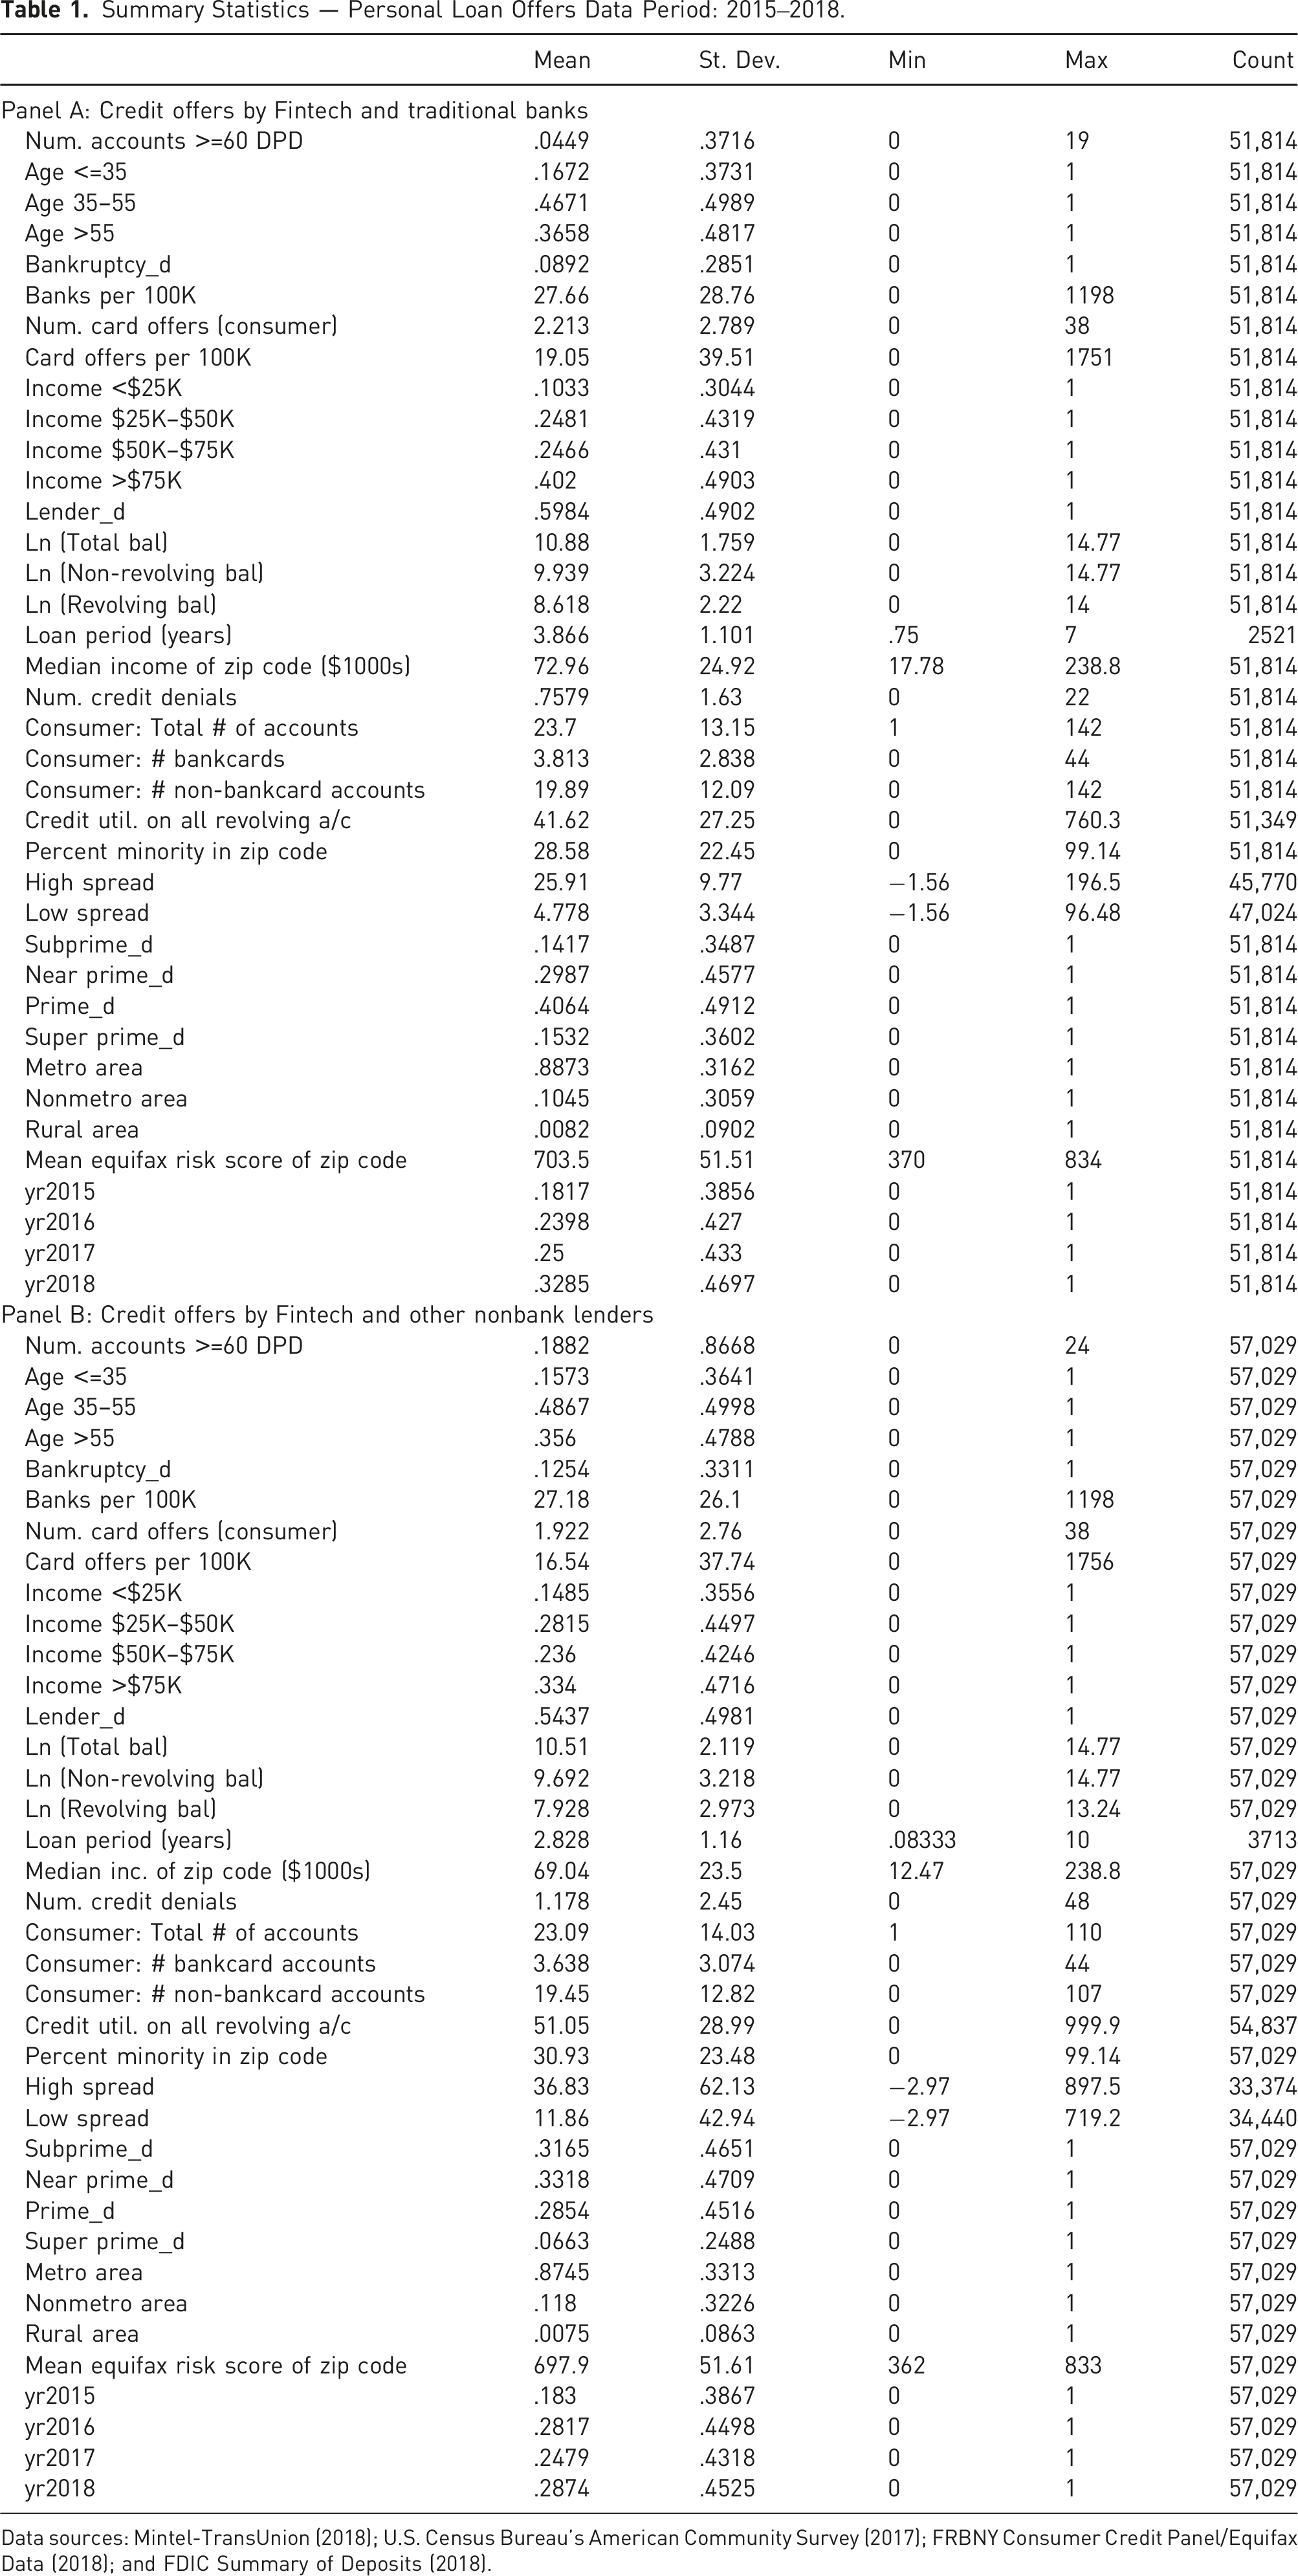
Data sources: Mintel-TransUnion (2018); U.S. Census Bureau’s American Community Survey (2017); FRBNY Consumer Credit Panel/Equifax Data (2018); and FDIC Summary of Deposits (2018).
Summary Statistics — Mortgage Loan Offers Data Period: 2015‒2018.
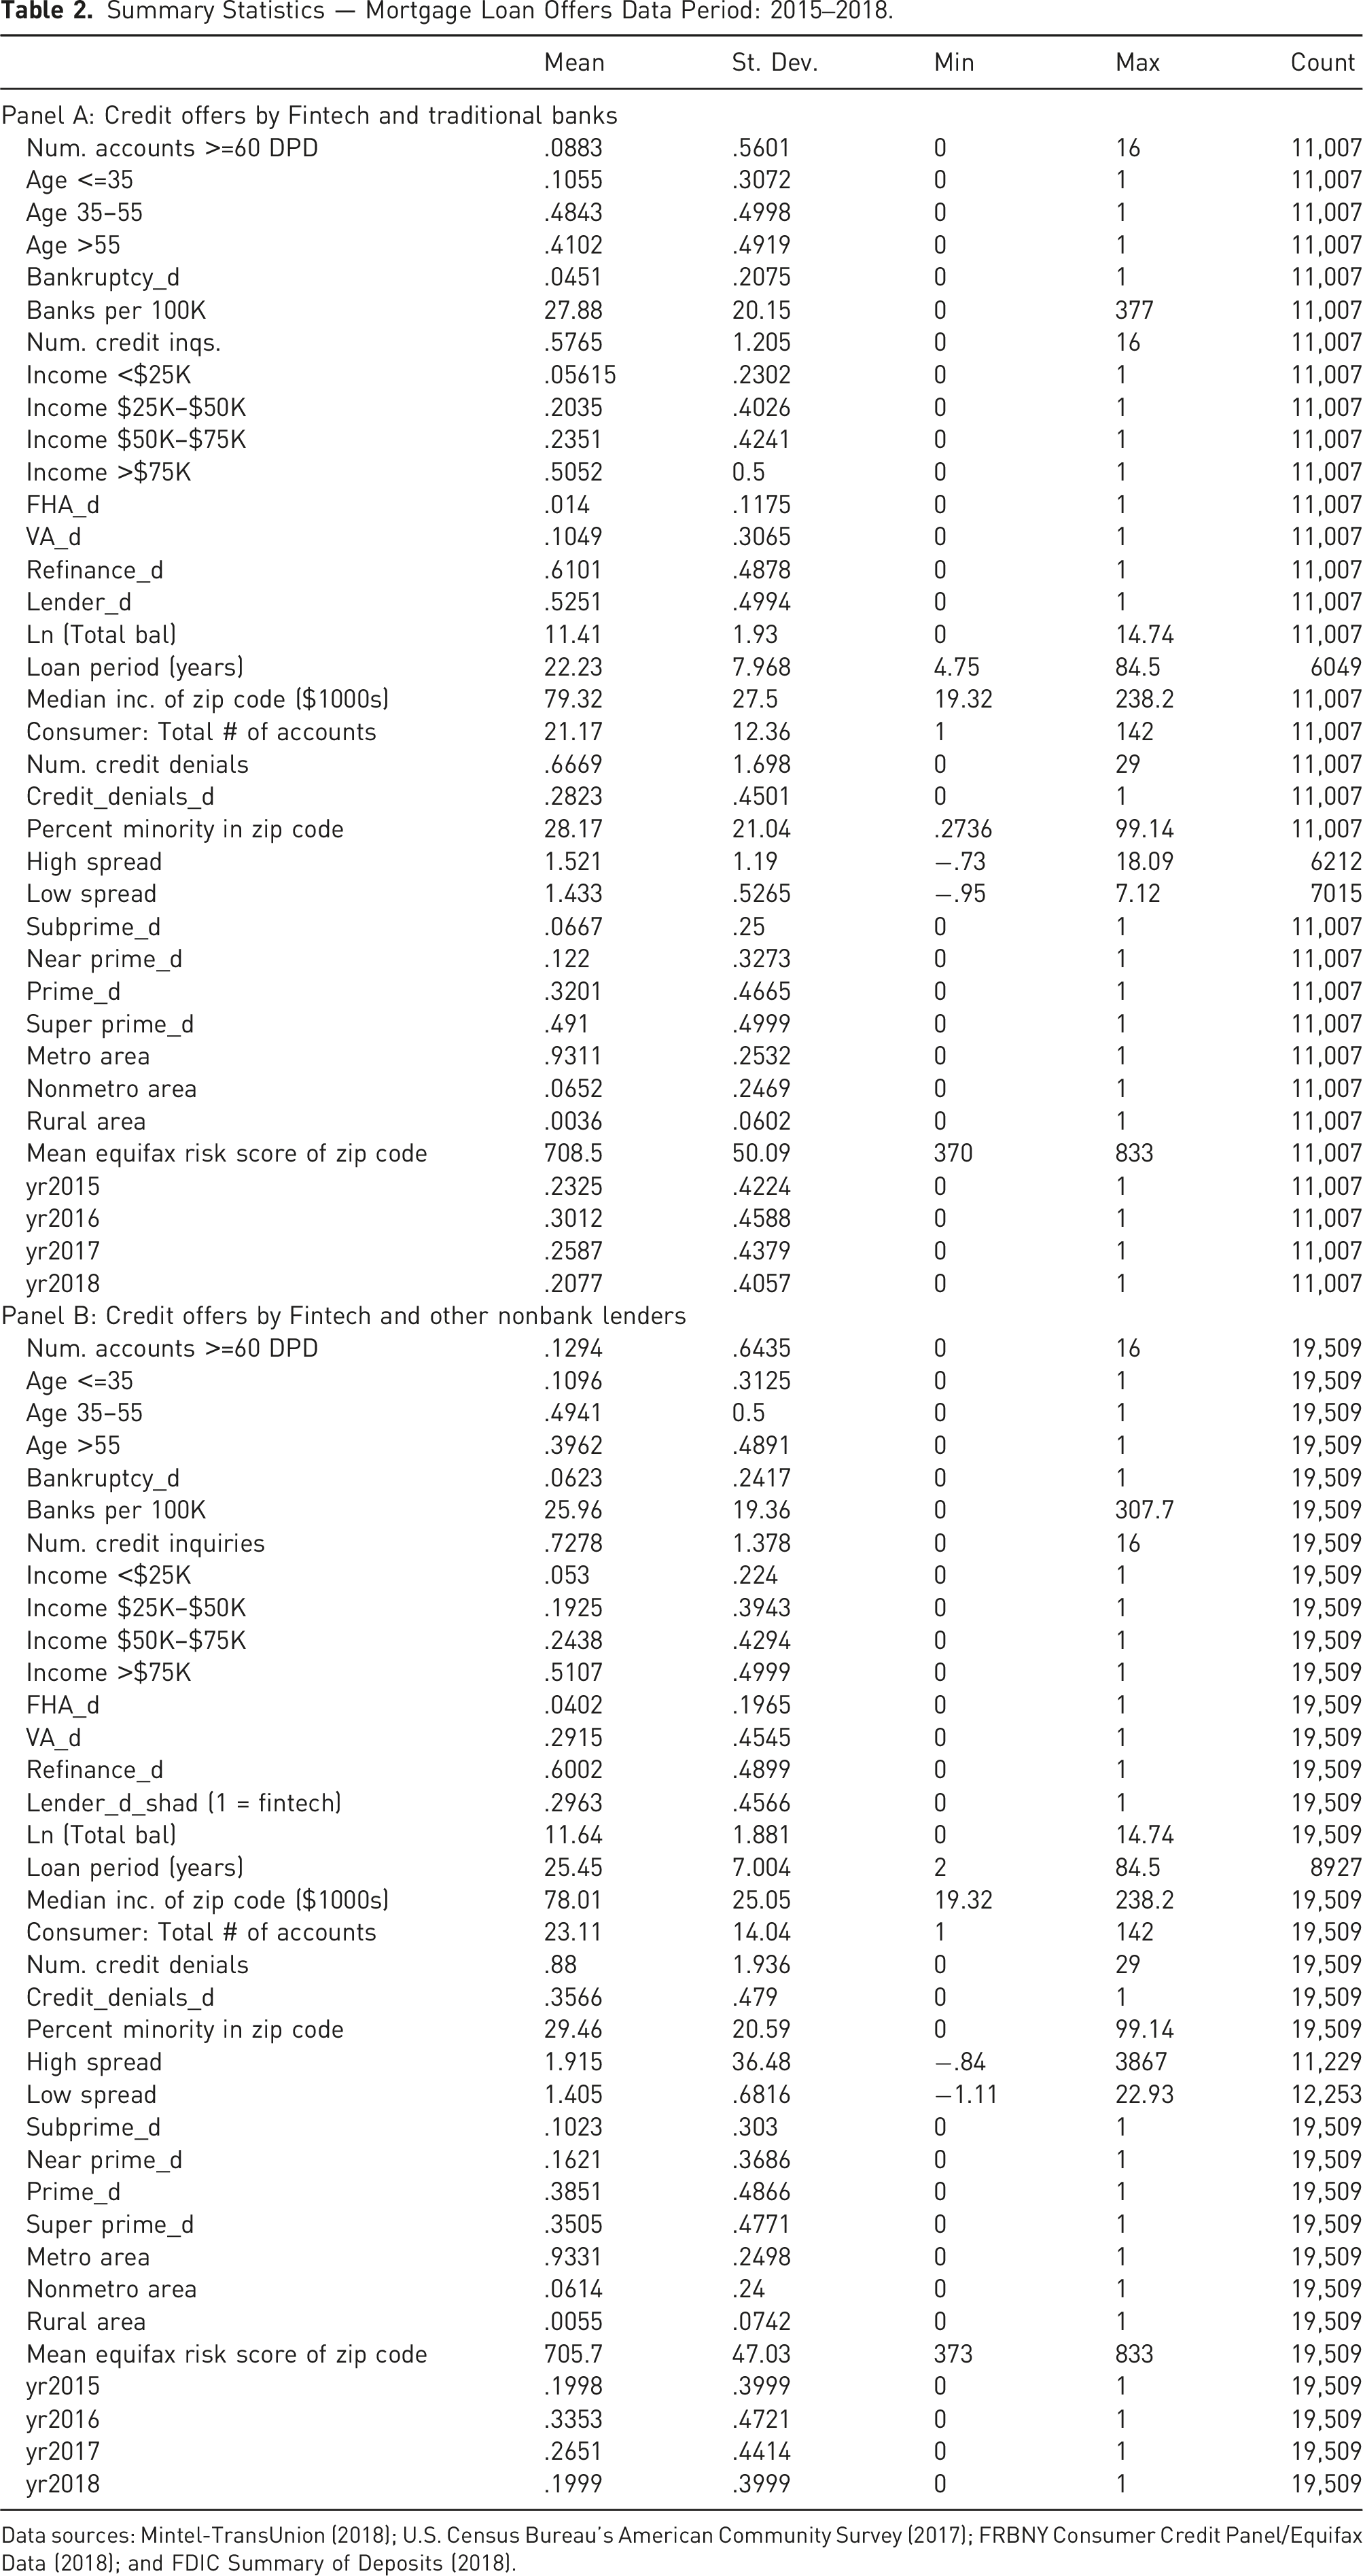
Data sources: Mintel-TransUnion (2018); U.S. Census Bureau’s American Community Survey (2017); FRBNY Consumer Credit Panel/Equifax Data (2018); and FDIC Summary of Deposits (2018).
Preliminary Analysis
Before delving into the statistical analysis, we perform a graphical analysis to establish an intuitive understanding of the types of consumers that fintech lenders attempt to reach through their mail offers. Mintel creates an estimate of nationwide mail volume from its sample of consumers, which we use to analyze personal loan and mortgage mail volume, segmented by consumer groups (such as income brackets) and lender type (banks, fintech, or other nonbank lenders).
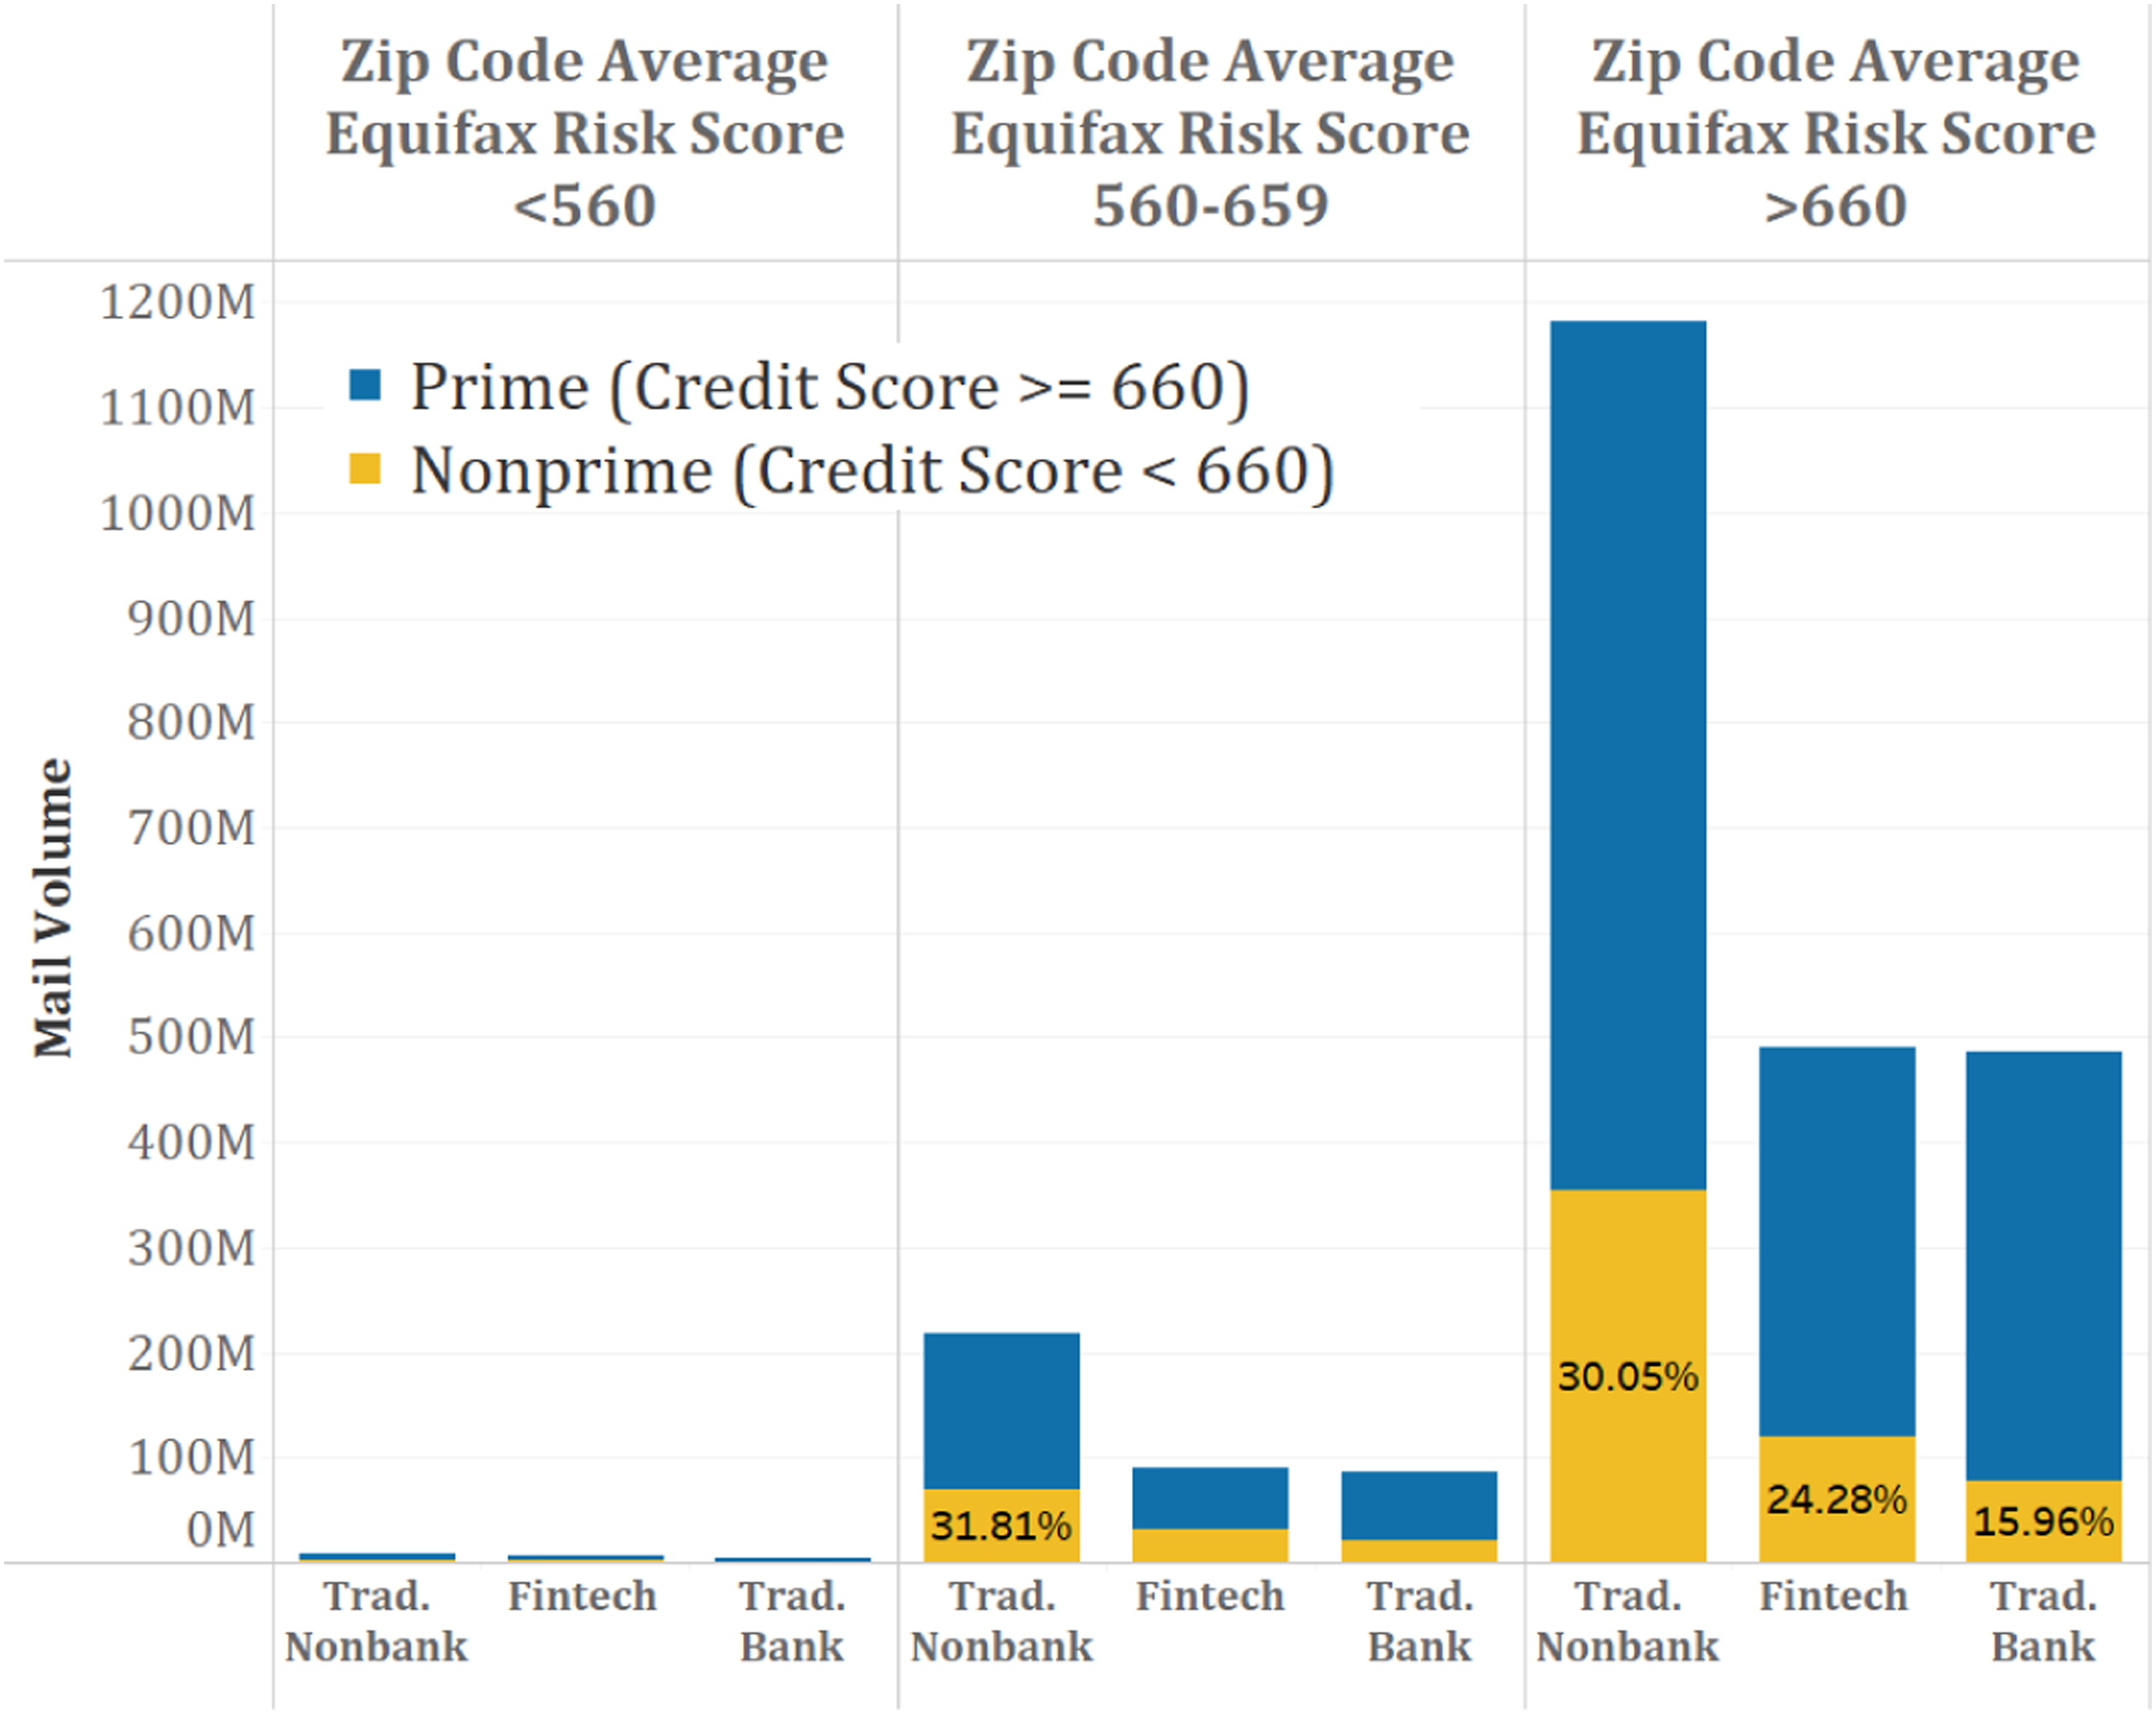
Personal Loan Sample: Figures 2–4 picture mail volume trends by various consumer characteristics. Three key facts emerge from this analysis. First, Figure 2 shows that fintech firms are clearly reaching out to nonprime consumers (those with credit score less than or equal to 660) more so than banks, and this is true for all income categories. Then, Figure 3 shows that most of the credit offers are mailed to consumers who are not in the low-and moderate-income (LMI) areas, and this holds for all lenders (banks, fintech firms, and other nonbank lenders). Fintech firms do not seem to be targeting LMI areas more than banks, probably because banks tend to receive Community Reinvestment Act (CRA) credits for making loans in LMI neighborhoods. Interestingly, although most of fintech mail is sent to zip codes with average Equifax Risk Scores that are in the prime range (scores above 660), the majority (about 60%) of these mail offers are sent to nonprime consumers in the prime zip codes. Note that banks and other nonbank lenders also send most of their offers to prime zip codes, but only about 27% of these mail offers by banks are sent to nonprime consumers (see Figure 4). Personal loan mail volume by income bracket and prime/nonprime status. Data source: Mintel-TransUnion (2018). Personal loan mail volume by LMI status (zip code) and household income. Data source: Mintel-TransUnion (2018) and U.S. Census Bureau’s American community survey (2017). Personal loan mail volume by average equifax risk score (zip code) and prime/nonprime status. Data source: Mintel-TransUnion (2018) and FRBNY consumer credit panel/equifax data (2018).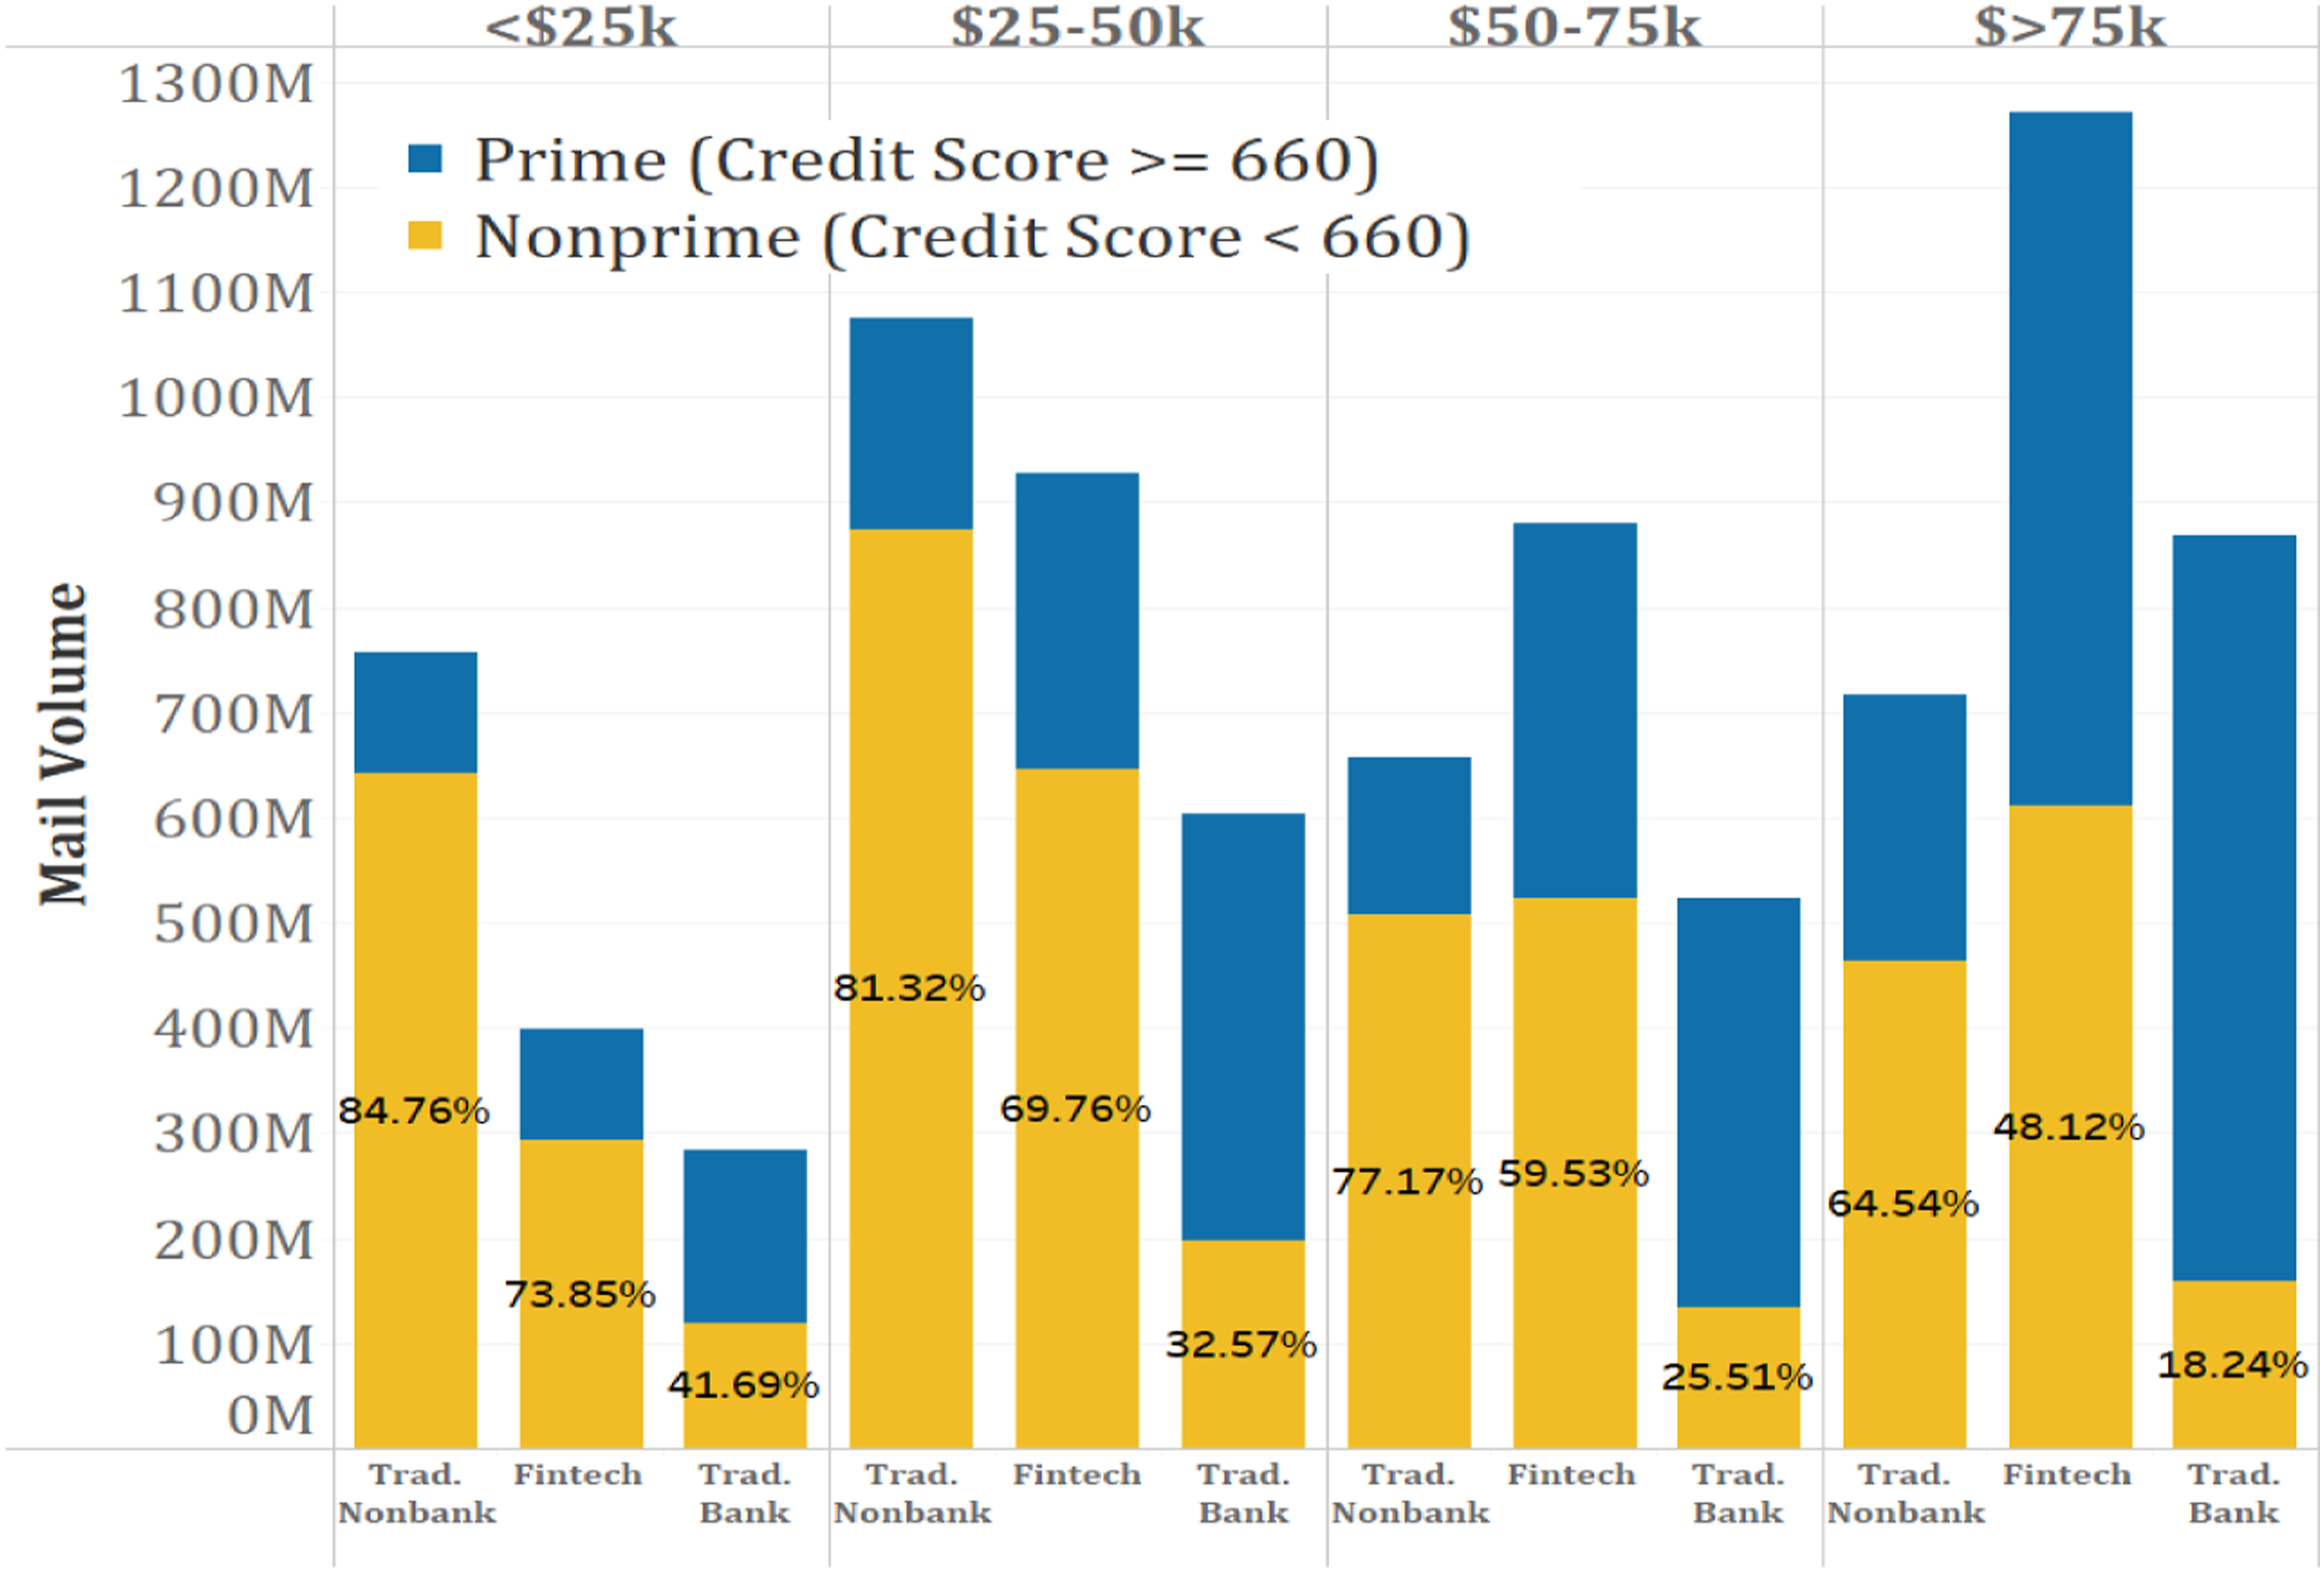
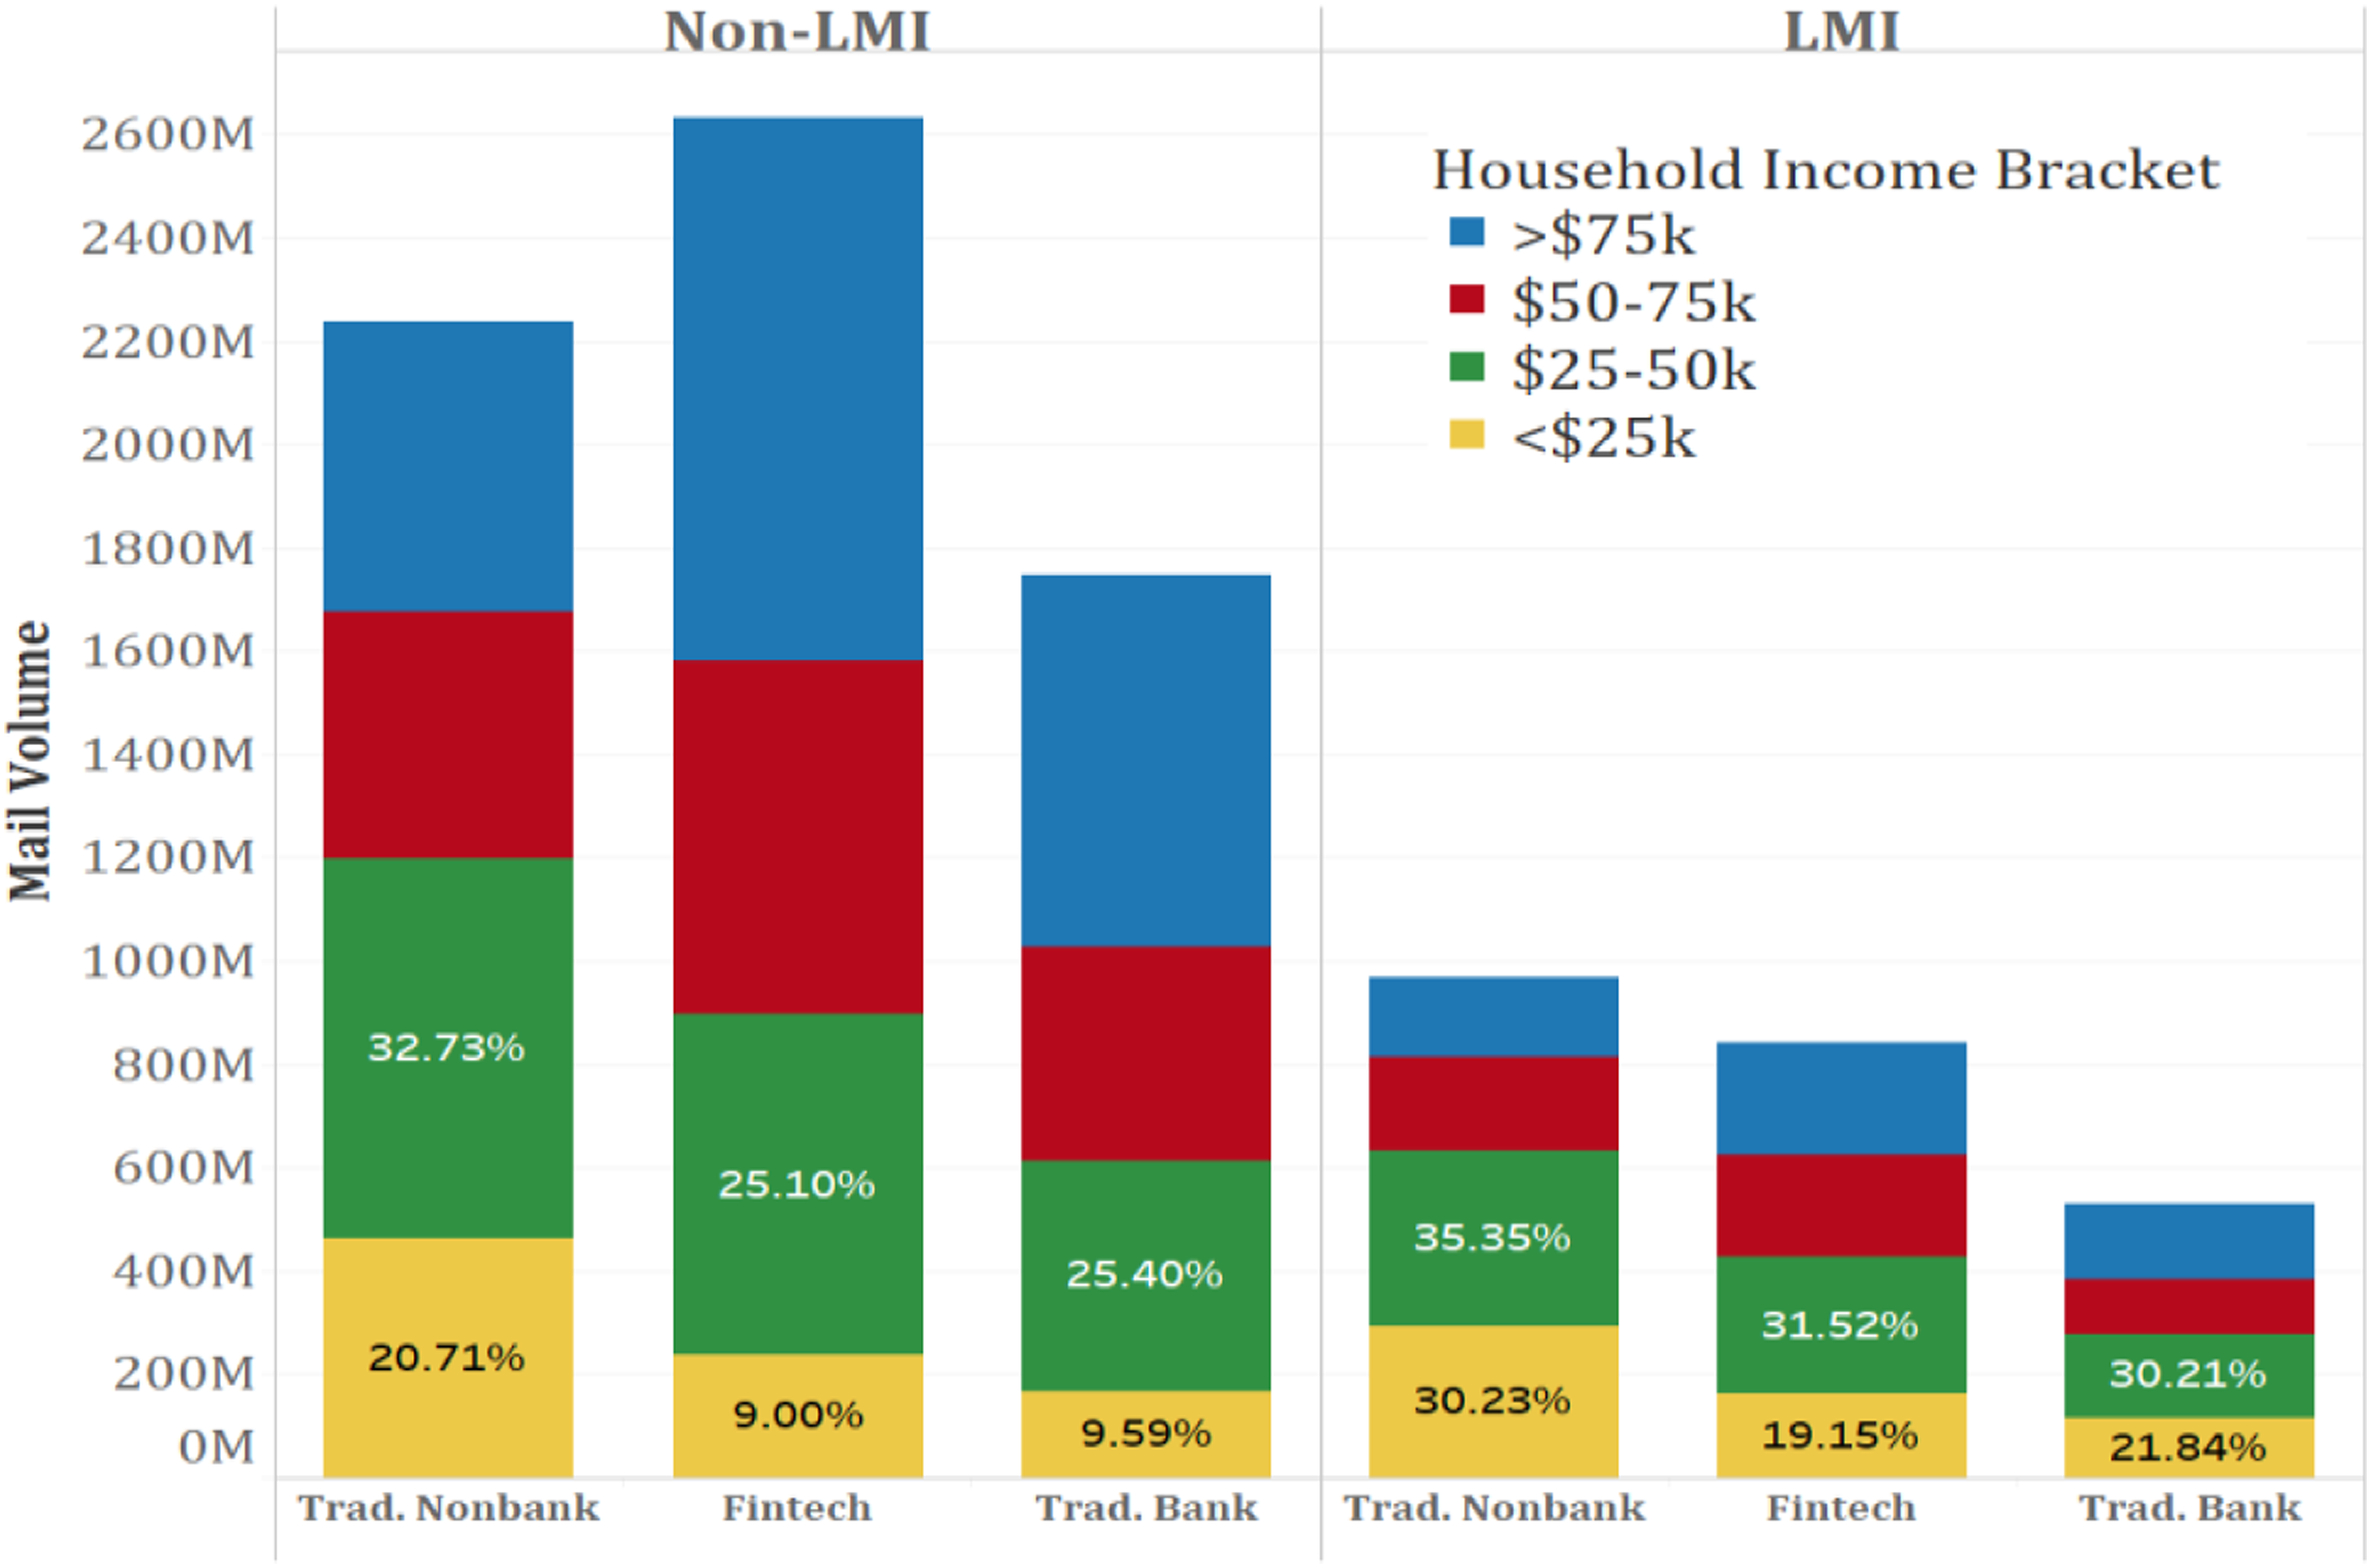
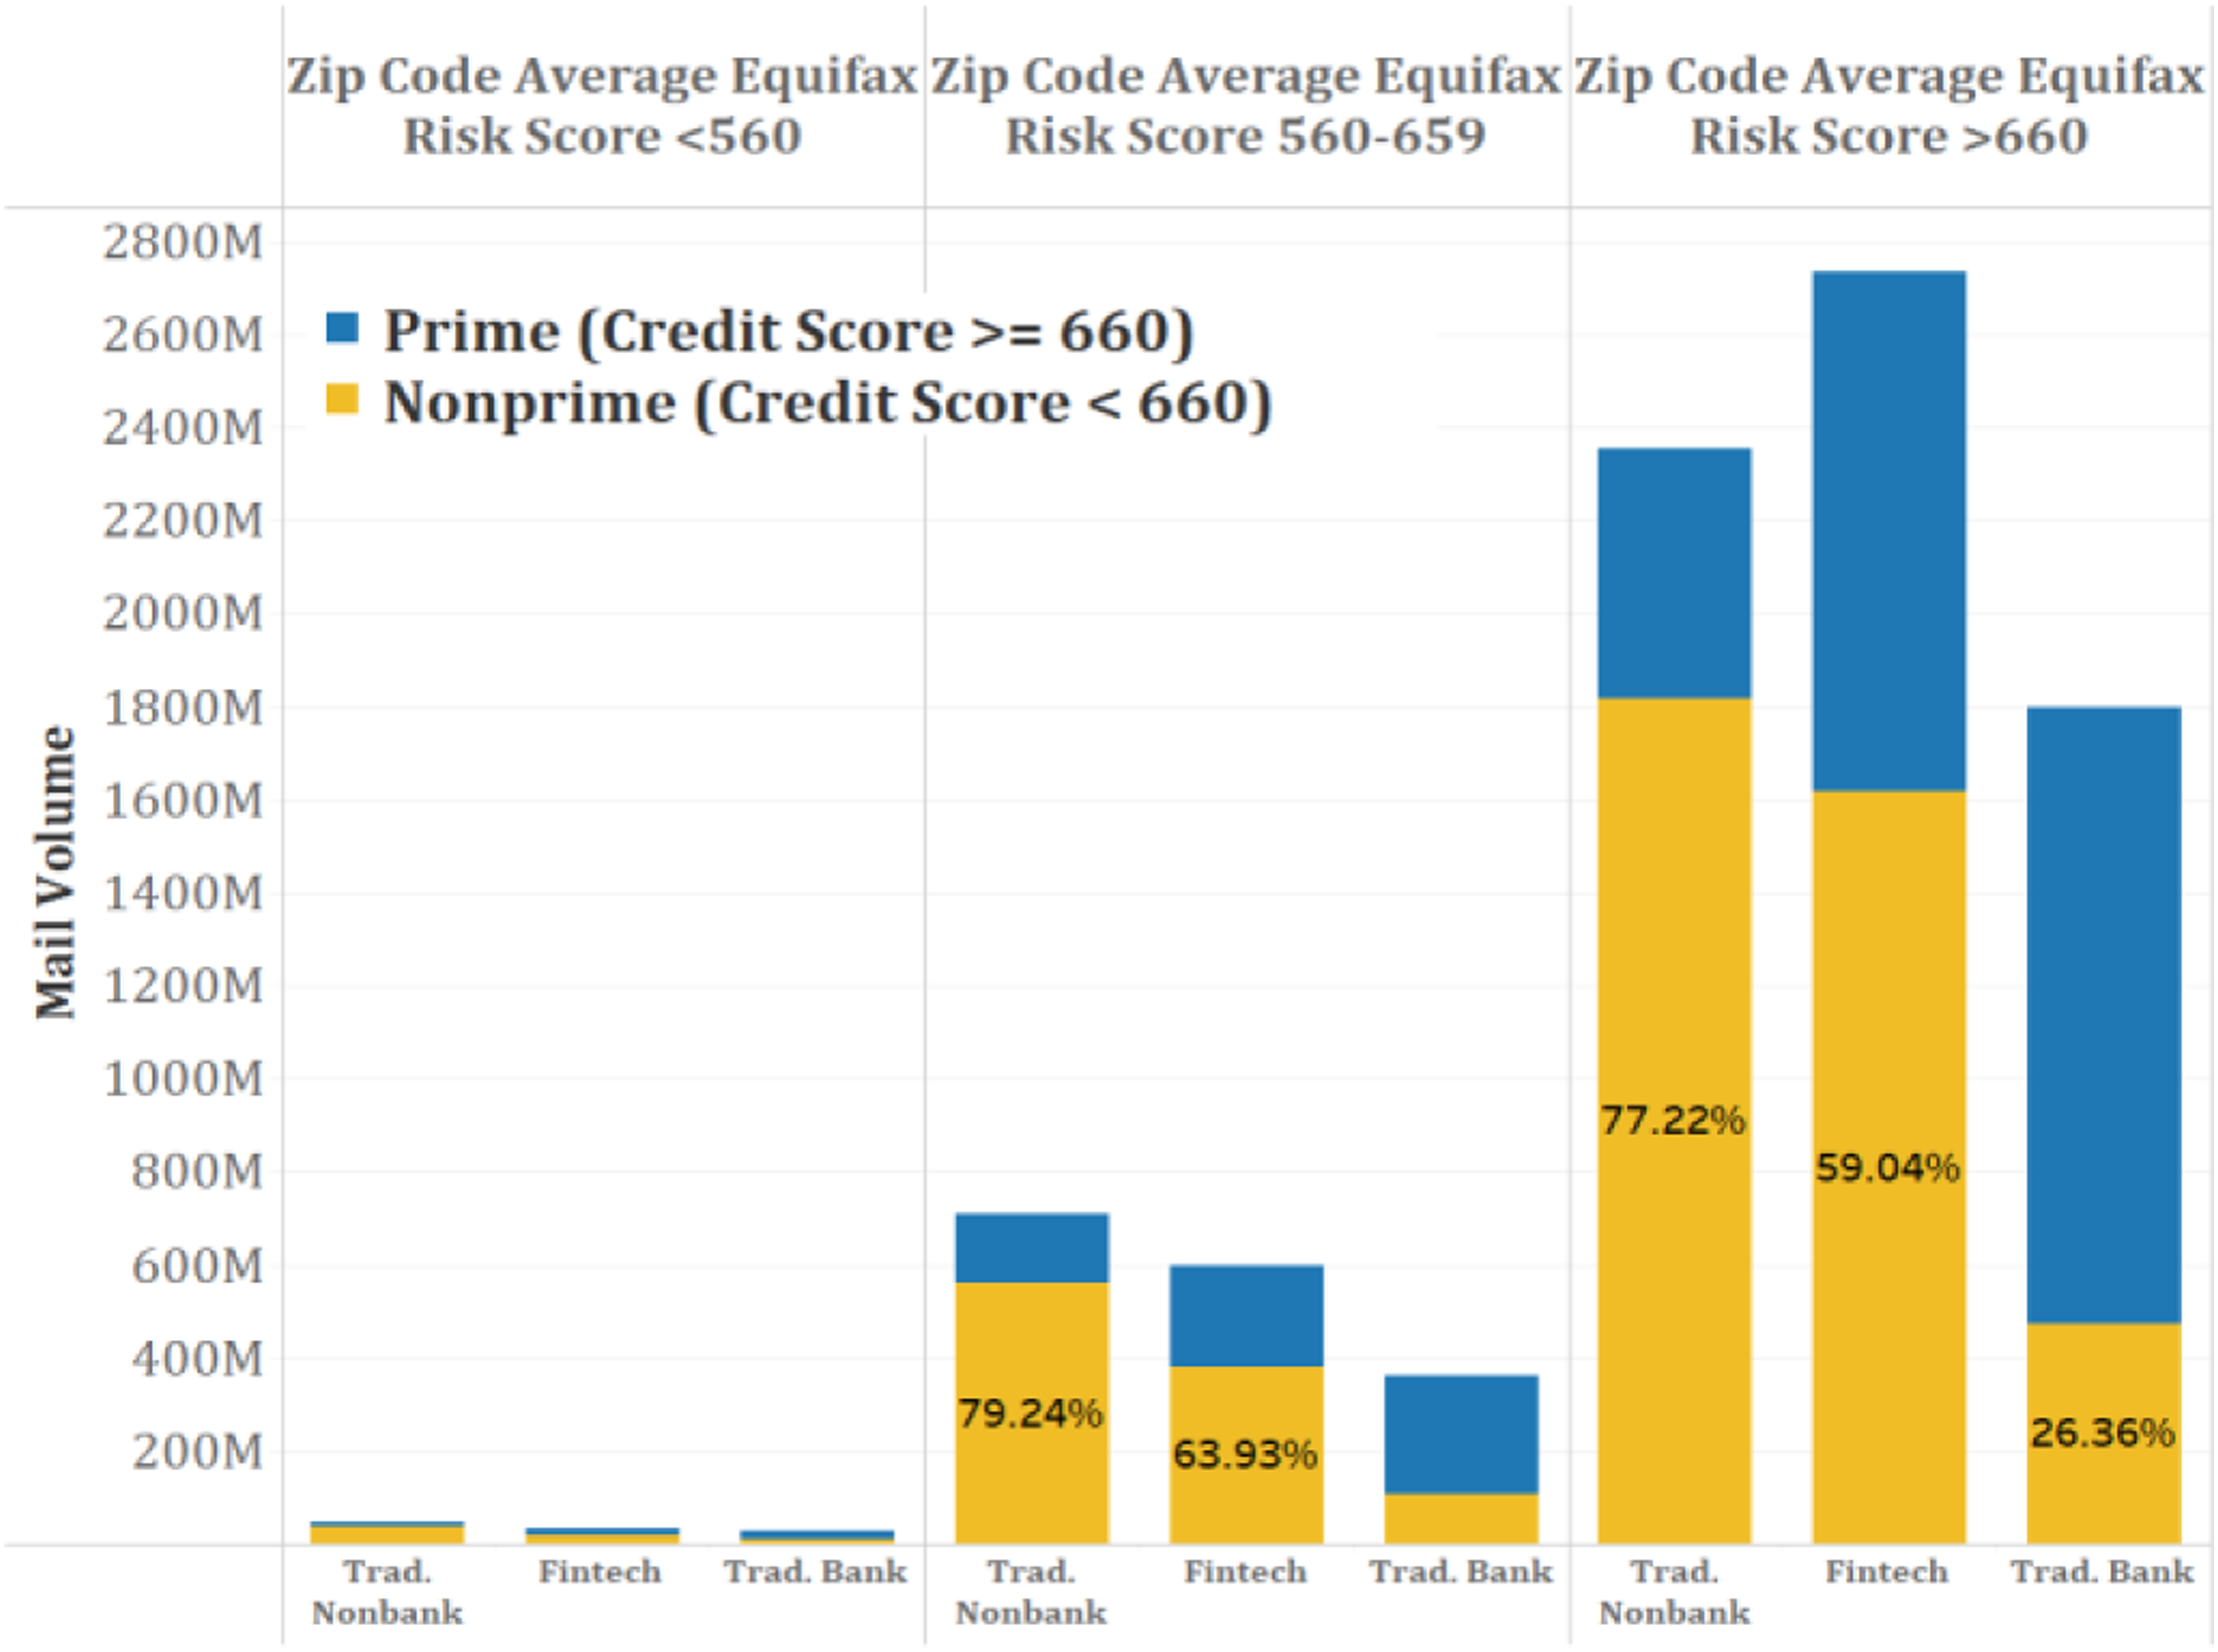
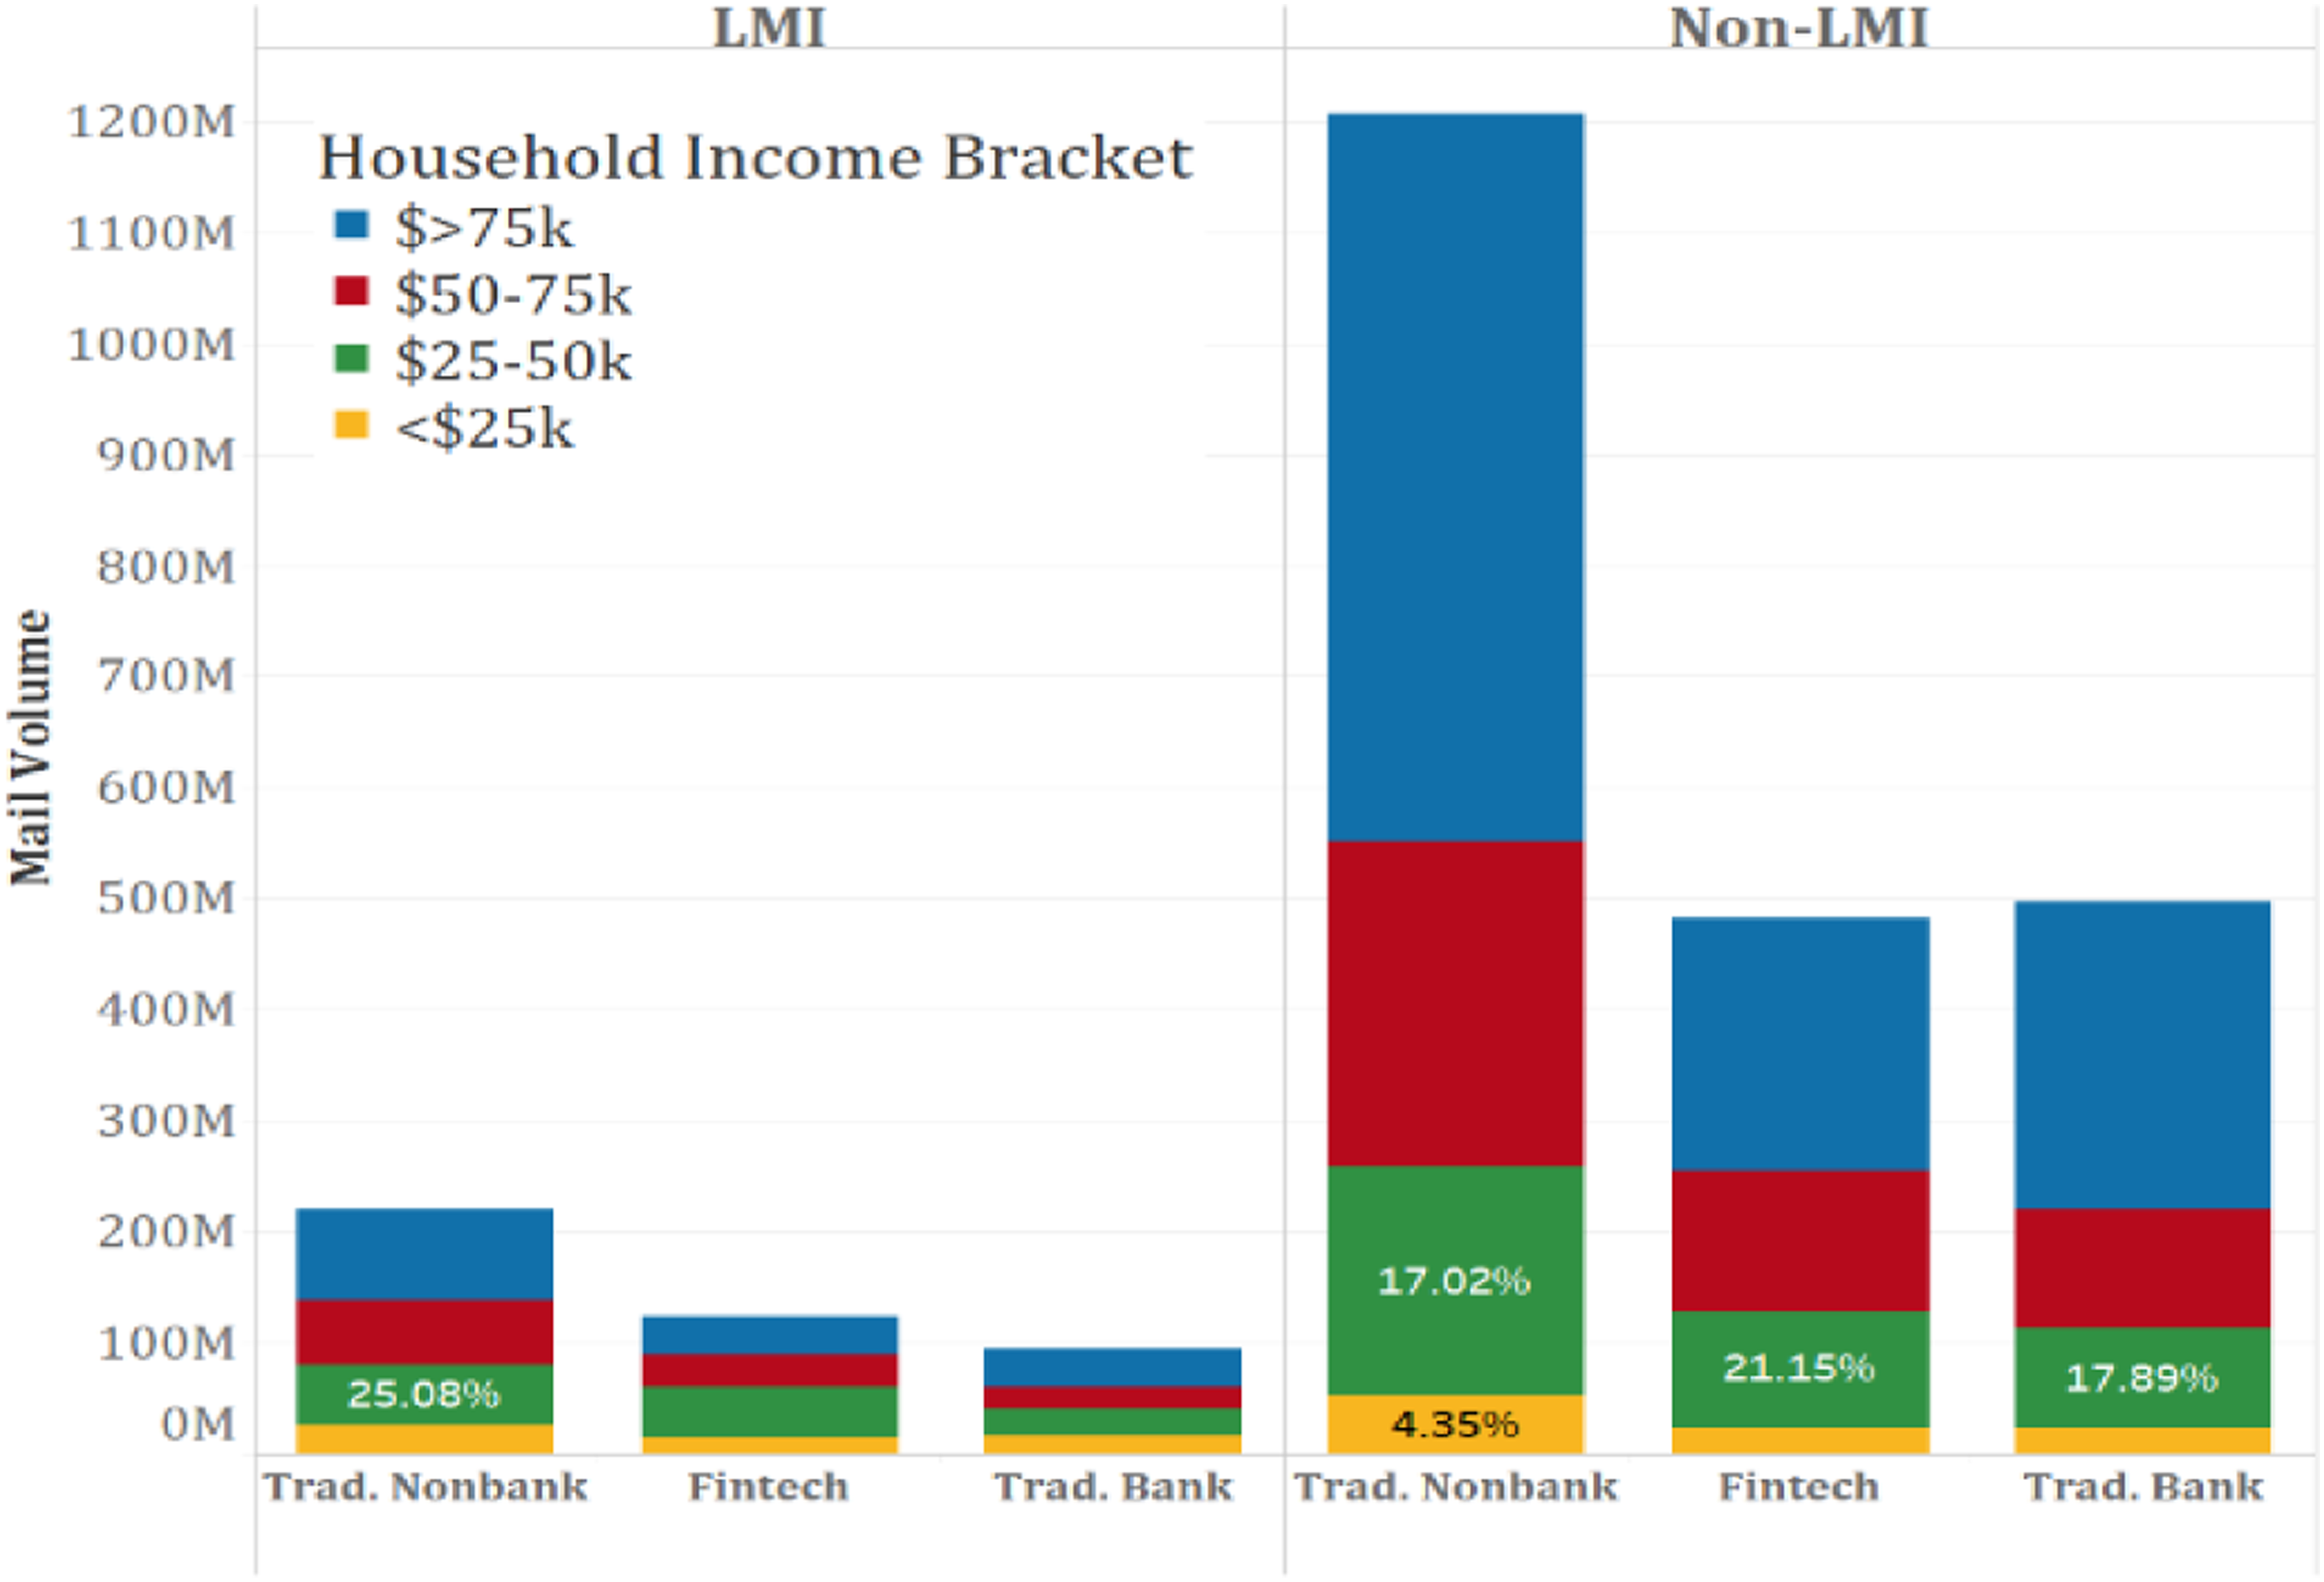
Mortgage Loan Sample: Figures 5–7 show a similar analysis for the mortgage offers, although the story is less clear cut, probably because of the nature of mortgage products which are more regulated for government-sponsored enterprise (GSE) approvals. From Figure 5, we see less of an emphasis on nonprime consumers, which makes sense given that there is typically a minimum credit score required to qualify for a mortgage. Even so, fintech firms still have a clear focus on nonprime consumers relative to traditional banks. Figure 6 pictures mail volume to LMI and non-LMI areas, by consumer income segments. Fintech firms seem to have a larger focus on LMI areas than banks, and even within non-LMI areas, over one-quarter of fintech mail still goes to lower-income (<$50k) individuals. Traditional nonbank lenders reach out more extensively to LMI consumers than both fintechs and banks. Looking at mail volume by average zip code’s Equifax Risk Score, Figure 7 shows that the vast majority of the mail goes to prime zip codes. Despite this, fintech firms appear to be reaching out to nonprime consumers in these prime zip codes more than banks do – about 22% for fintech compared with 17% for banks. Mortgage mail volume by income bracket and prime/nonprime status. Data source: Mintel-TransUnion (2018). Mortgage mail volume by LMI status and income bracket. Data source: Mintel-TransUnion (2018). Mortgage mail volume by average equifax risk score (zip code) and prime/nonprime status. Data source: Mintel-TransUnion (2018) and FRBNY consumer credit panel/equifax data (2018).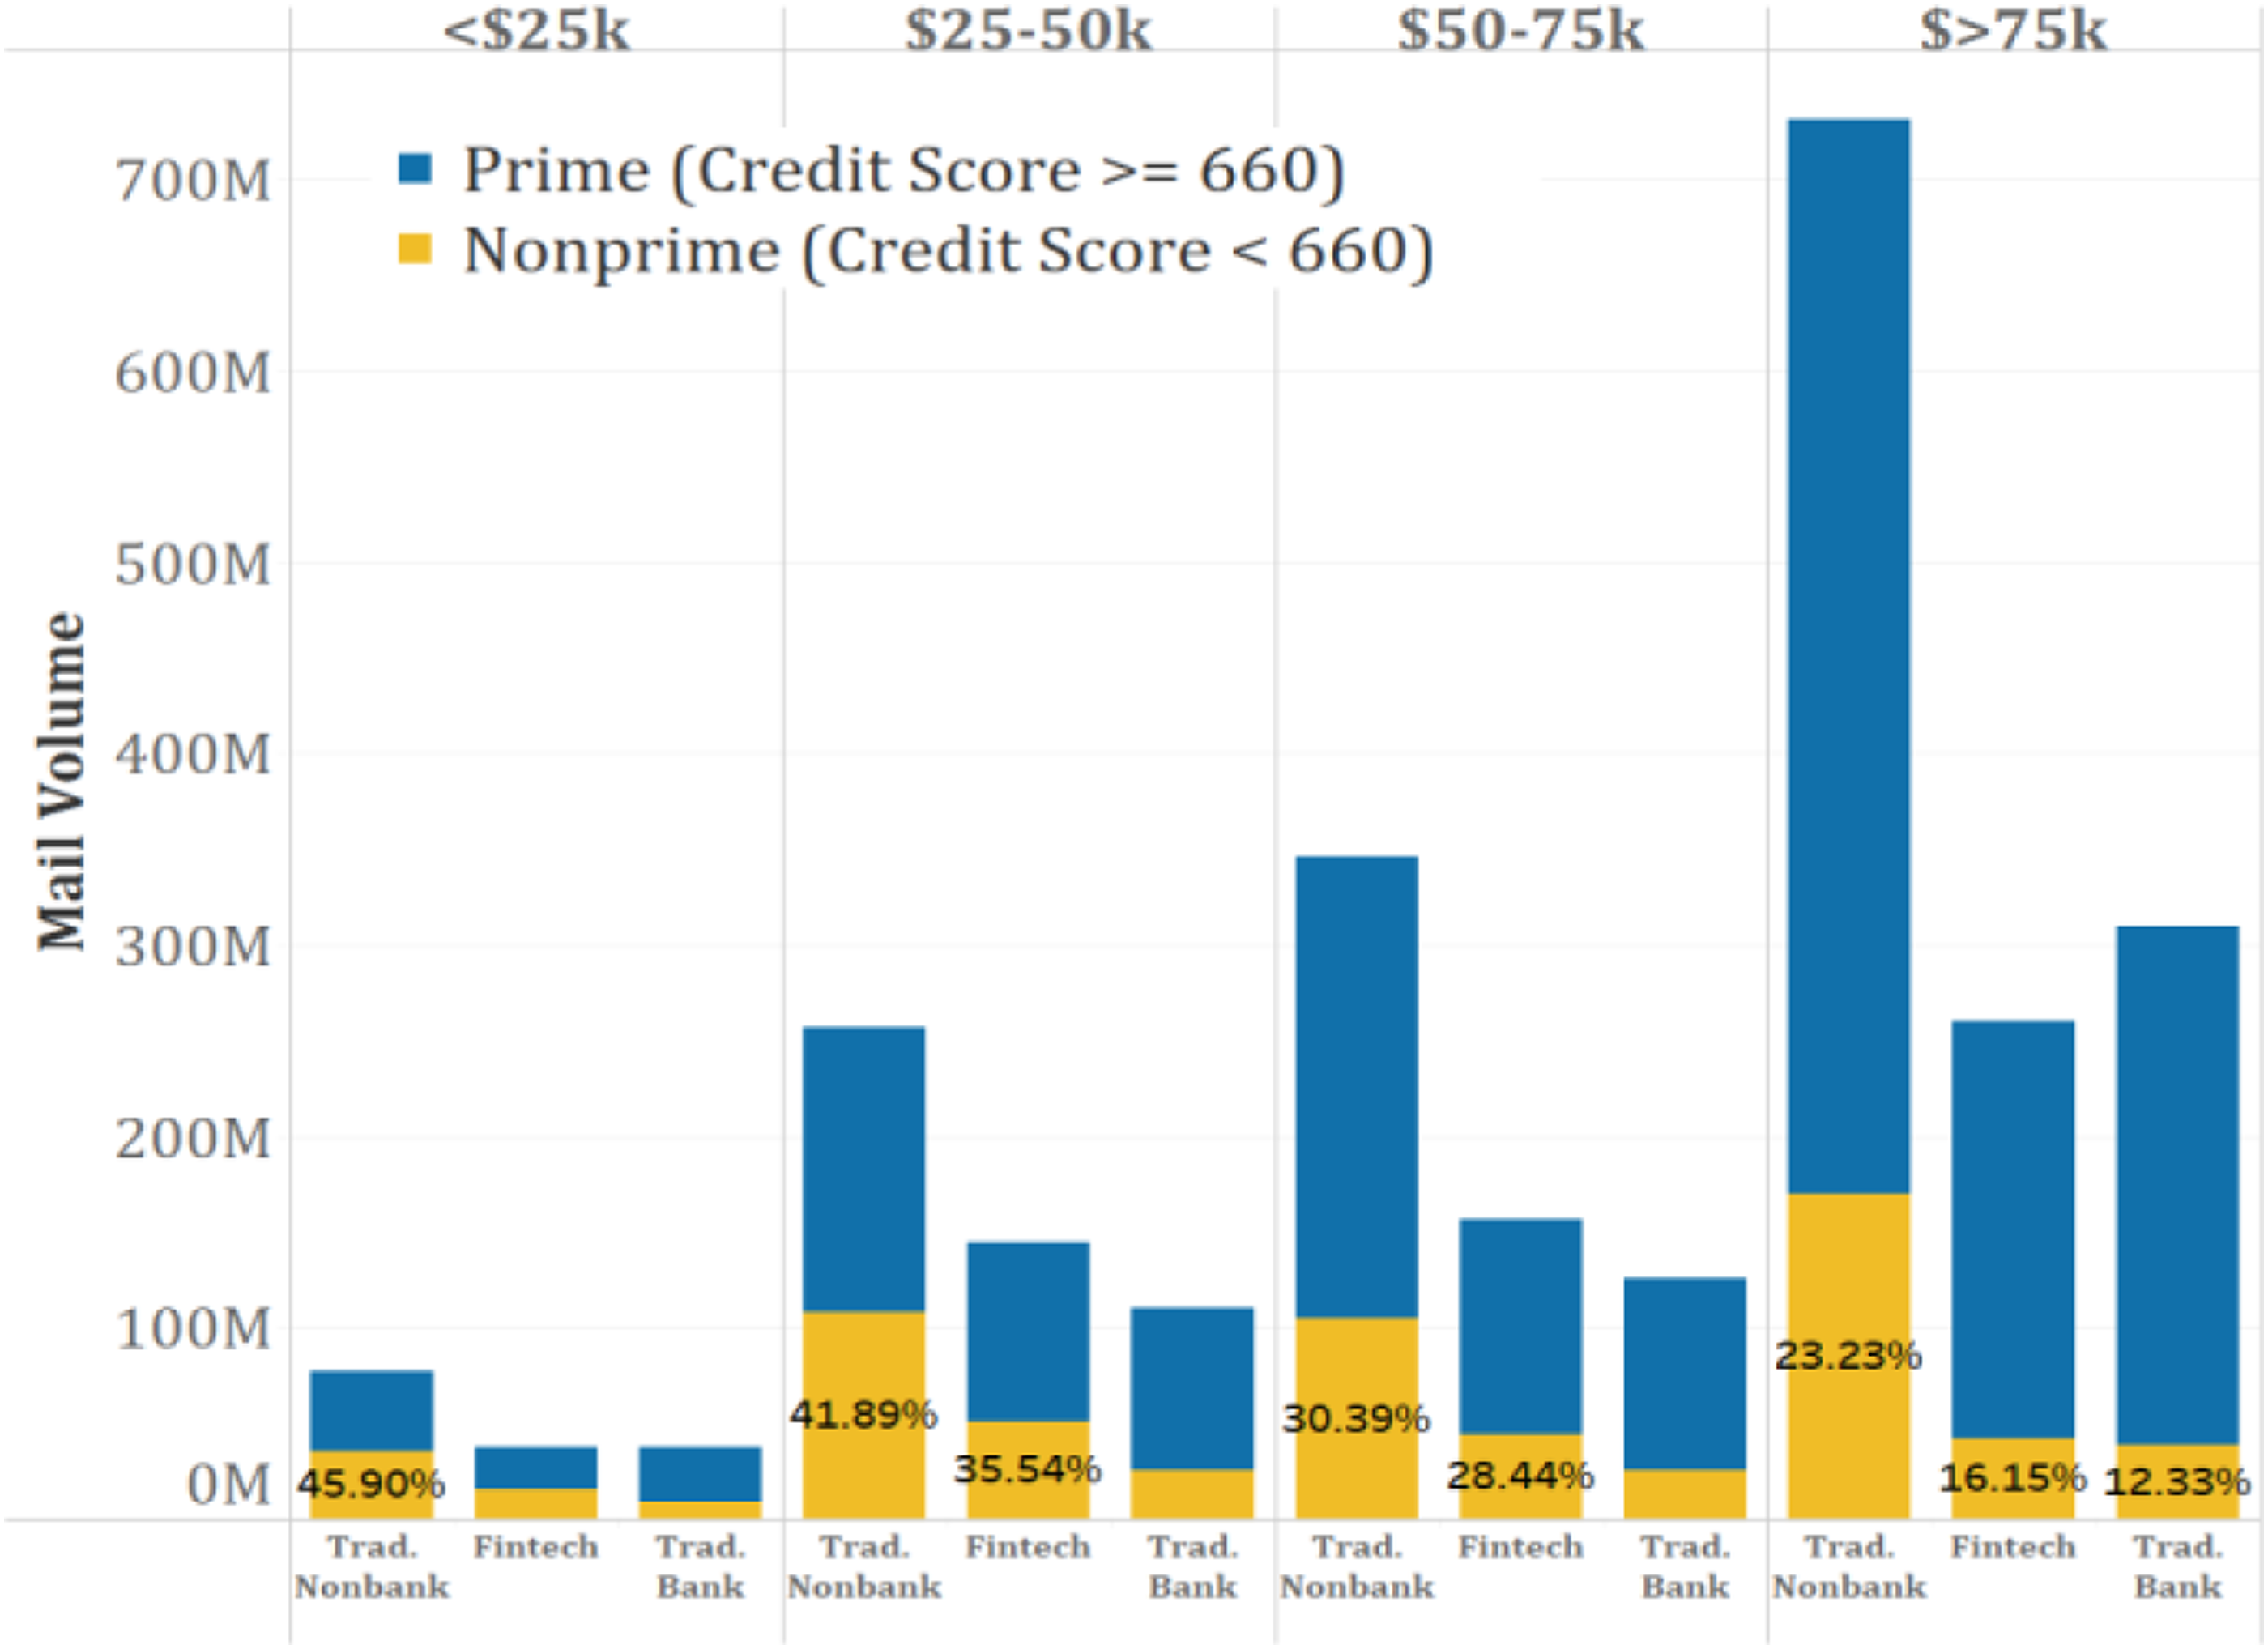
Empirical Methodology
Are Fintech Lenders Targeting Underserved Consumers/Communities?
Our first analysis in this study addresses the question of what types of consumers fintech firms target, relative to banks and other nonbank lenders. To investigate this question, we estimate a simple logistic regression model that relates a series of consumer characteristics to the probability of a received offer being sent by a fintech firm — relative to banks and relative to traditional nonbank lenders in separate analyses. We estimate an equation of the following form: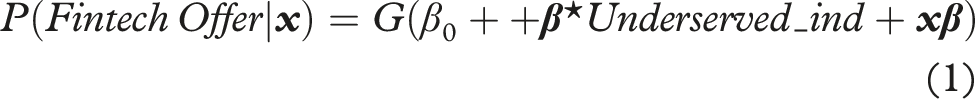
The independent variable
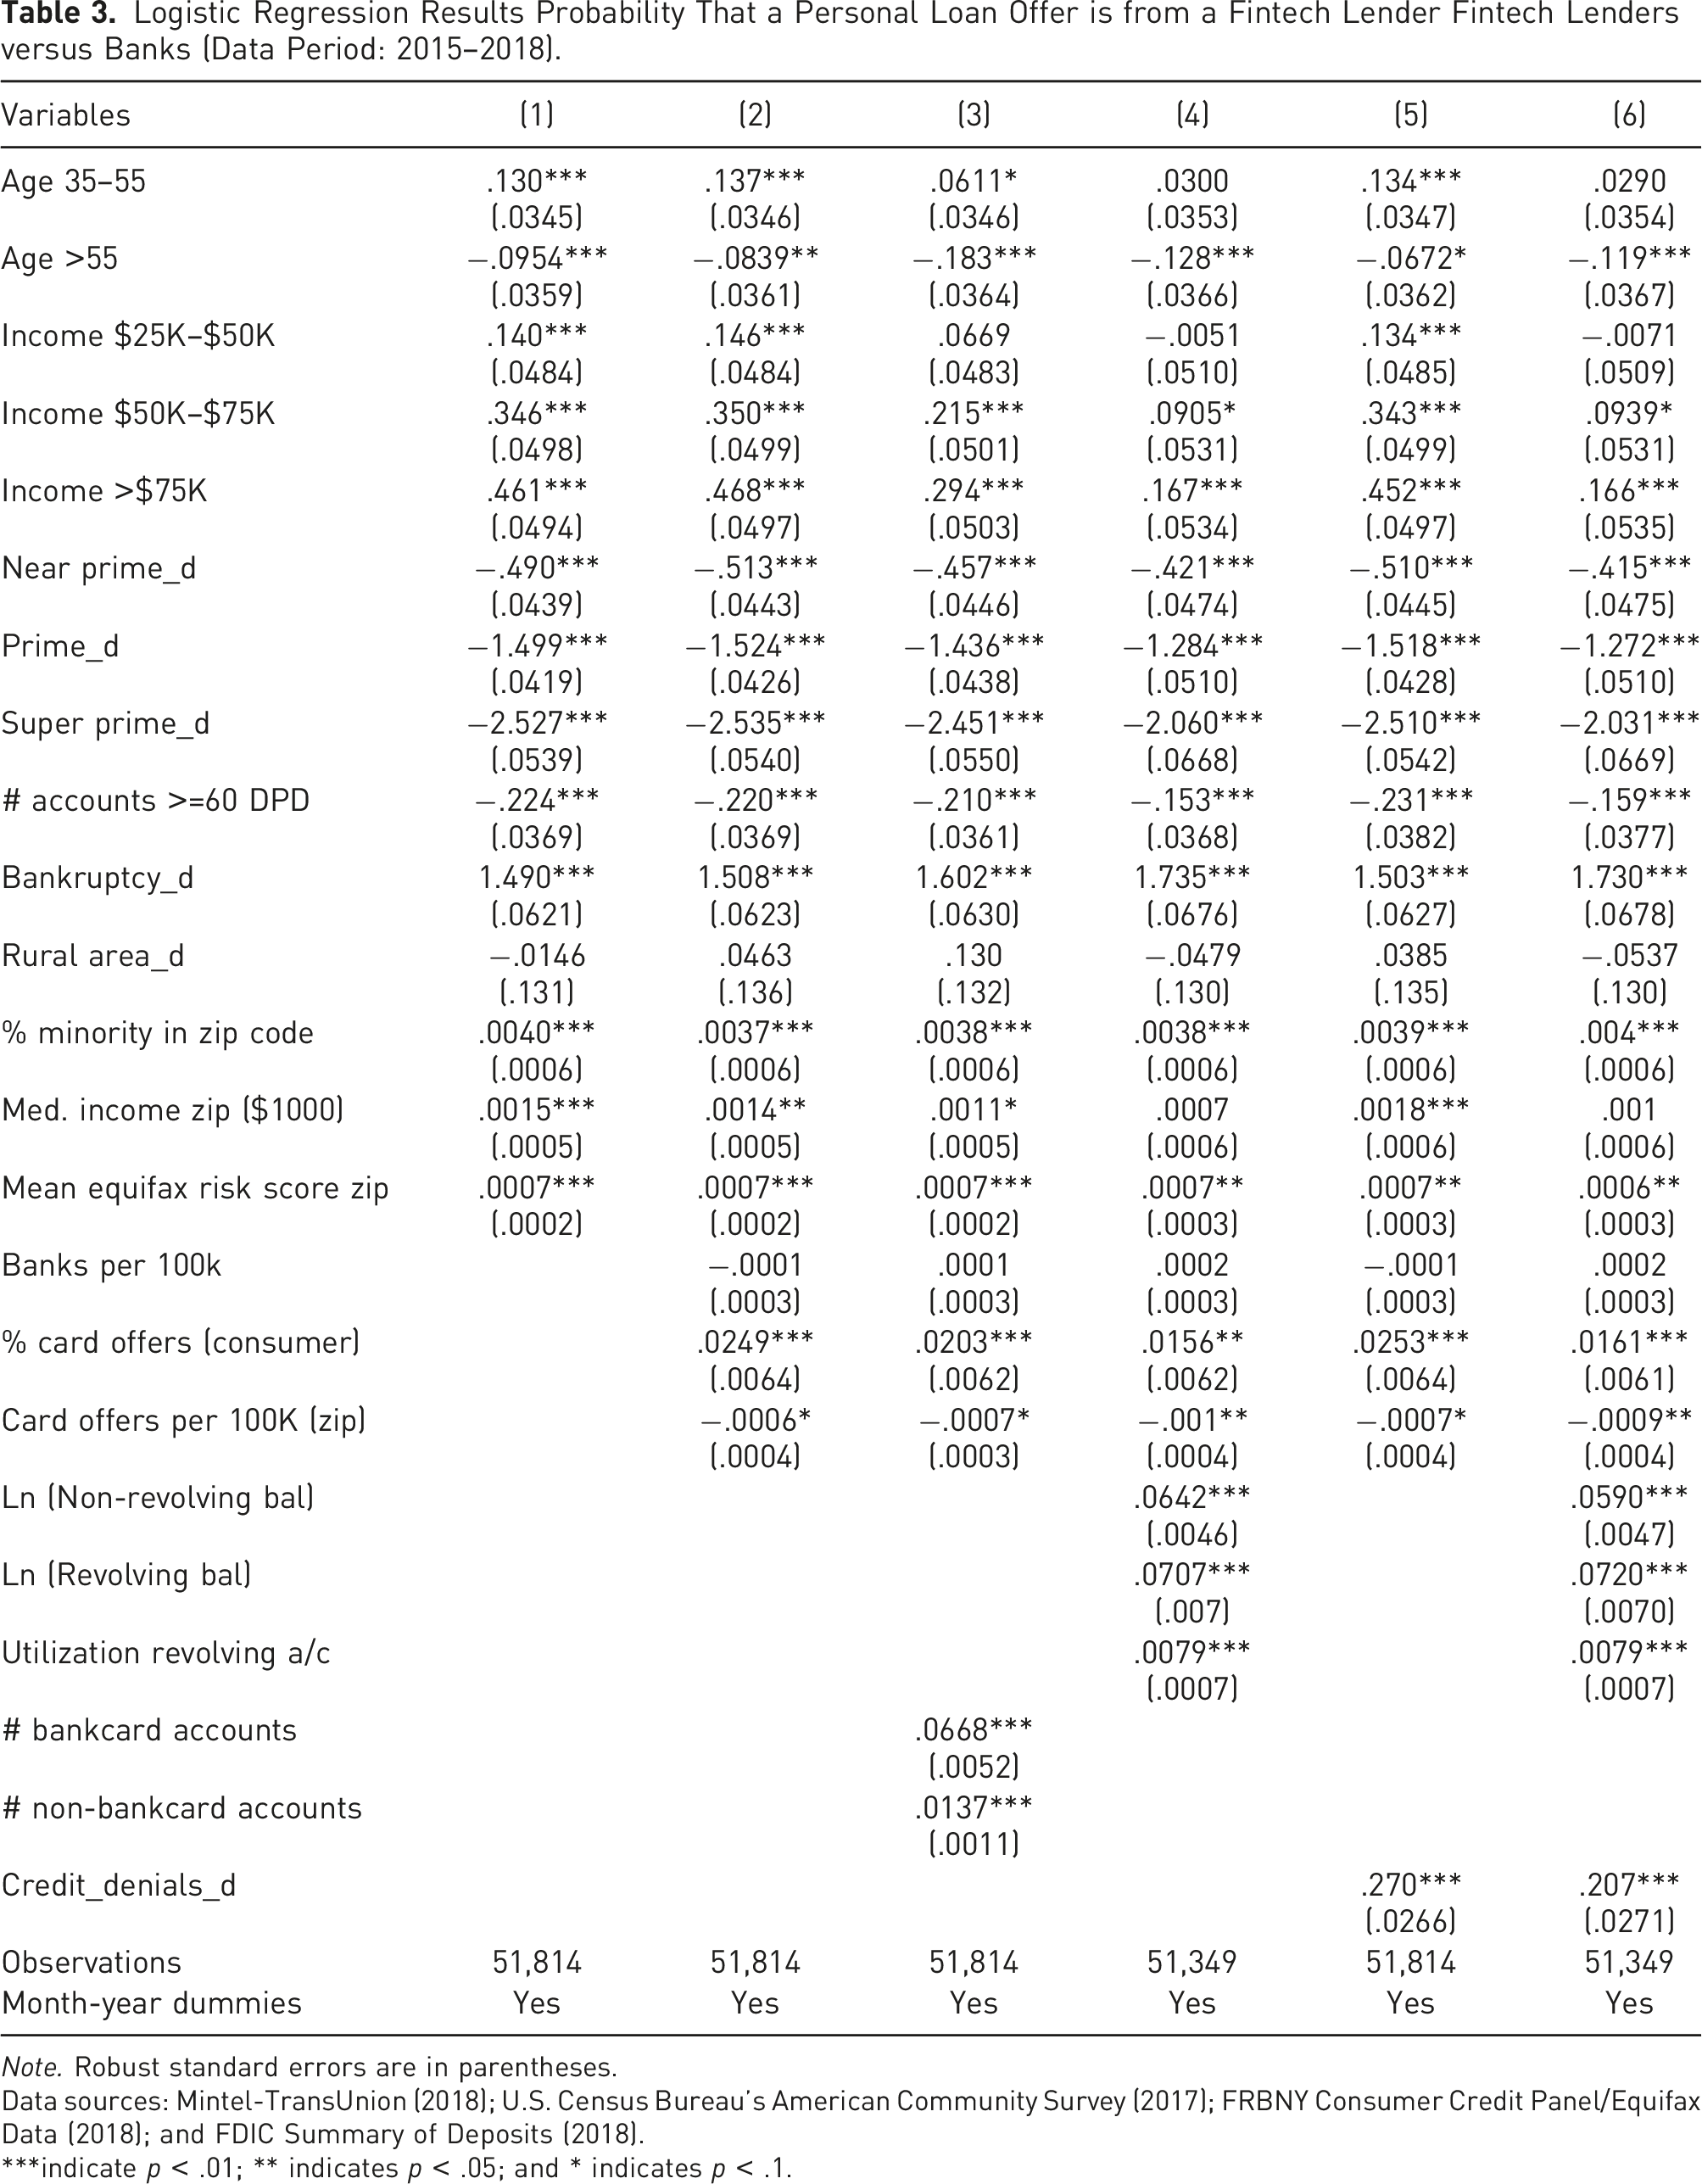
Logistic Regression Results Probability That a Personal Loan Offer is from a Fintech Lender Fintech Lenders versus Banks (Data Period: 2015–2018).
Note. Robust standard errors are in parentheses.
Data sources: Mintel-TransUnion (2018); U.S. Census Bureau’s American Community Survey (2017); FRBNY Consumer Credit Panel/Equifax Data (2018); and FDIC Summary of Deposits (2018).
***indicate p < .01; ** indicates p < .05; and * indicates p < .1.
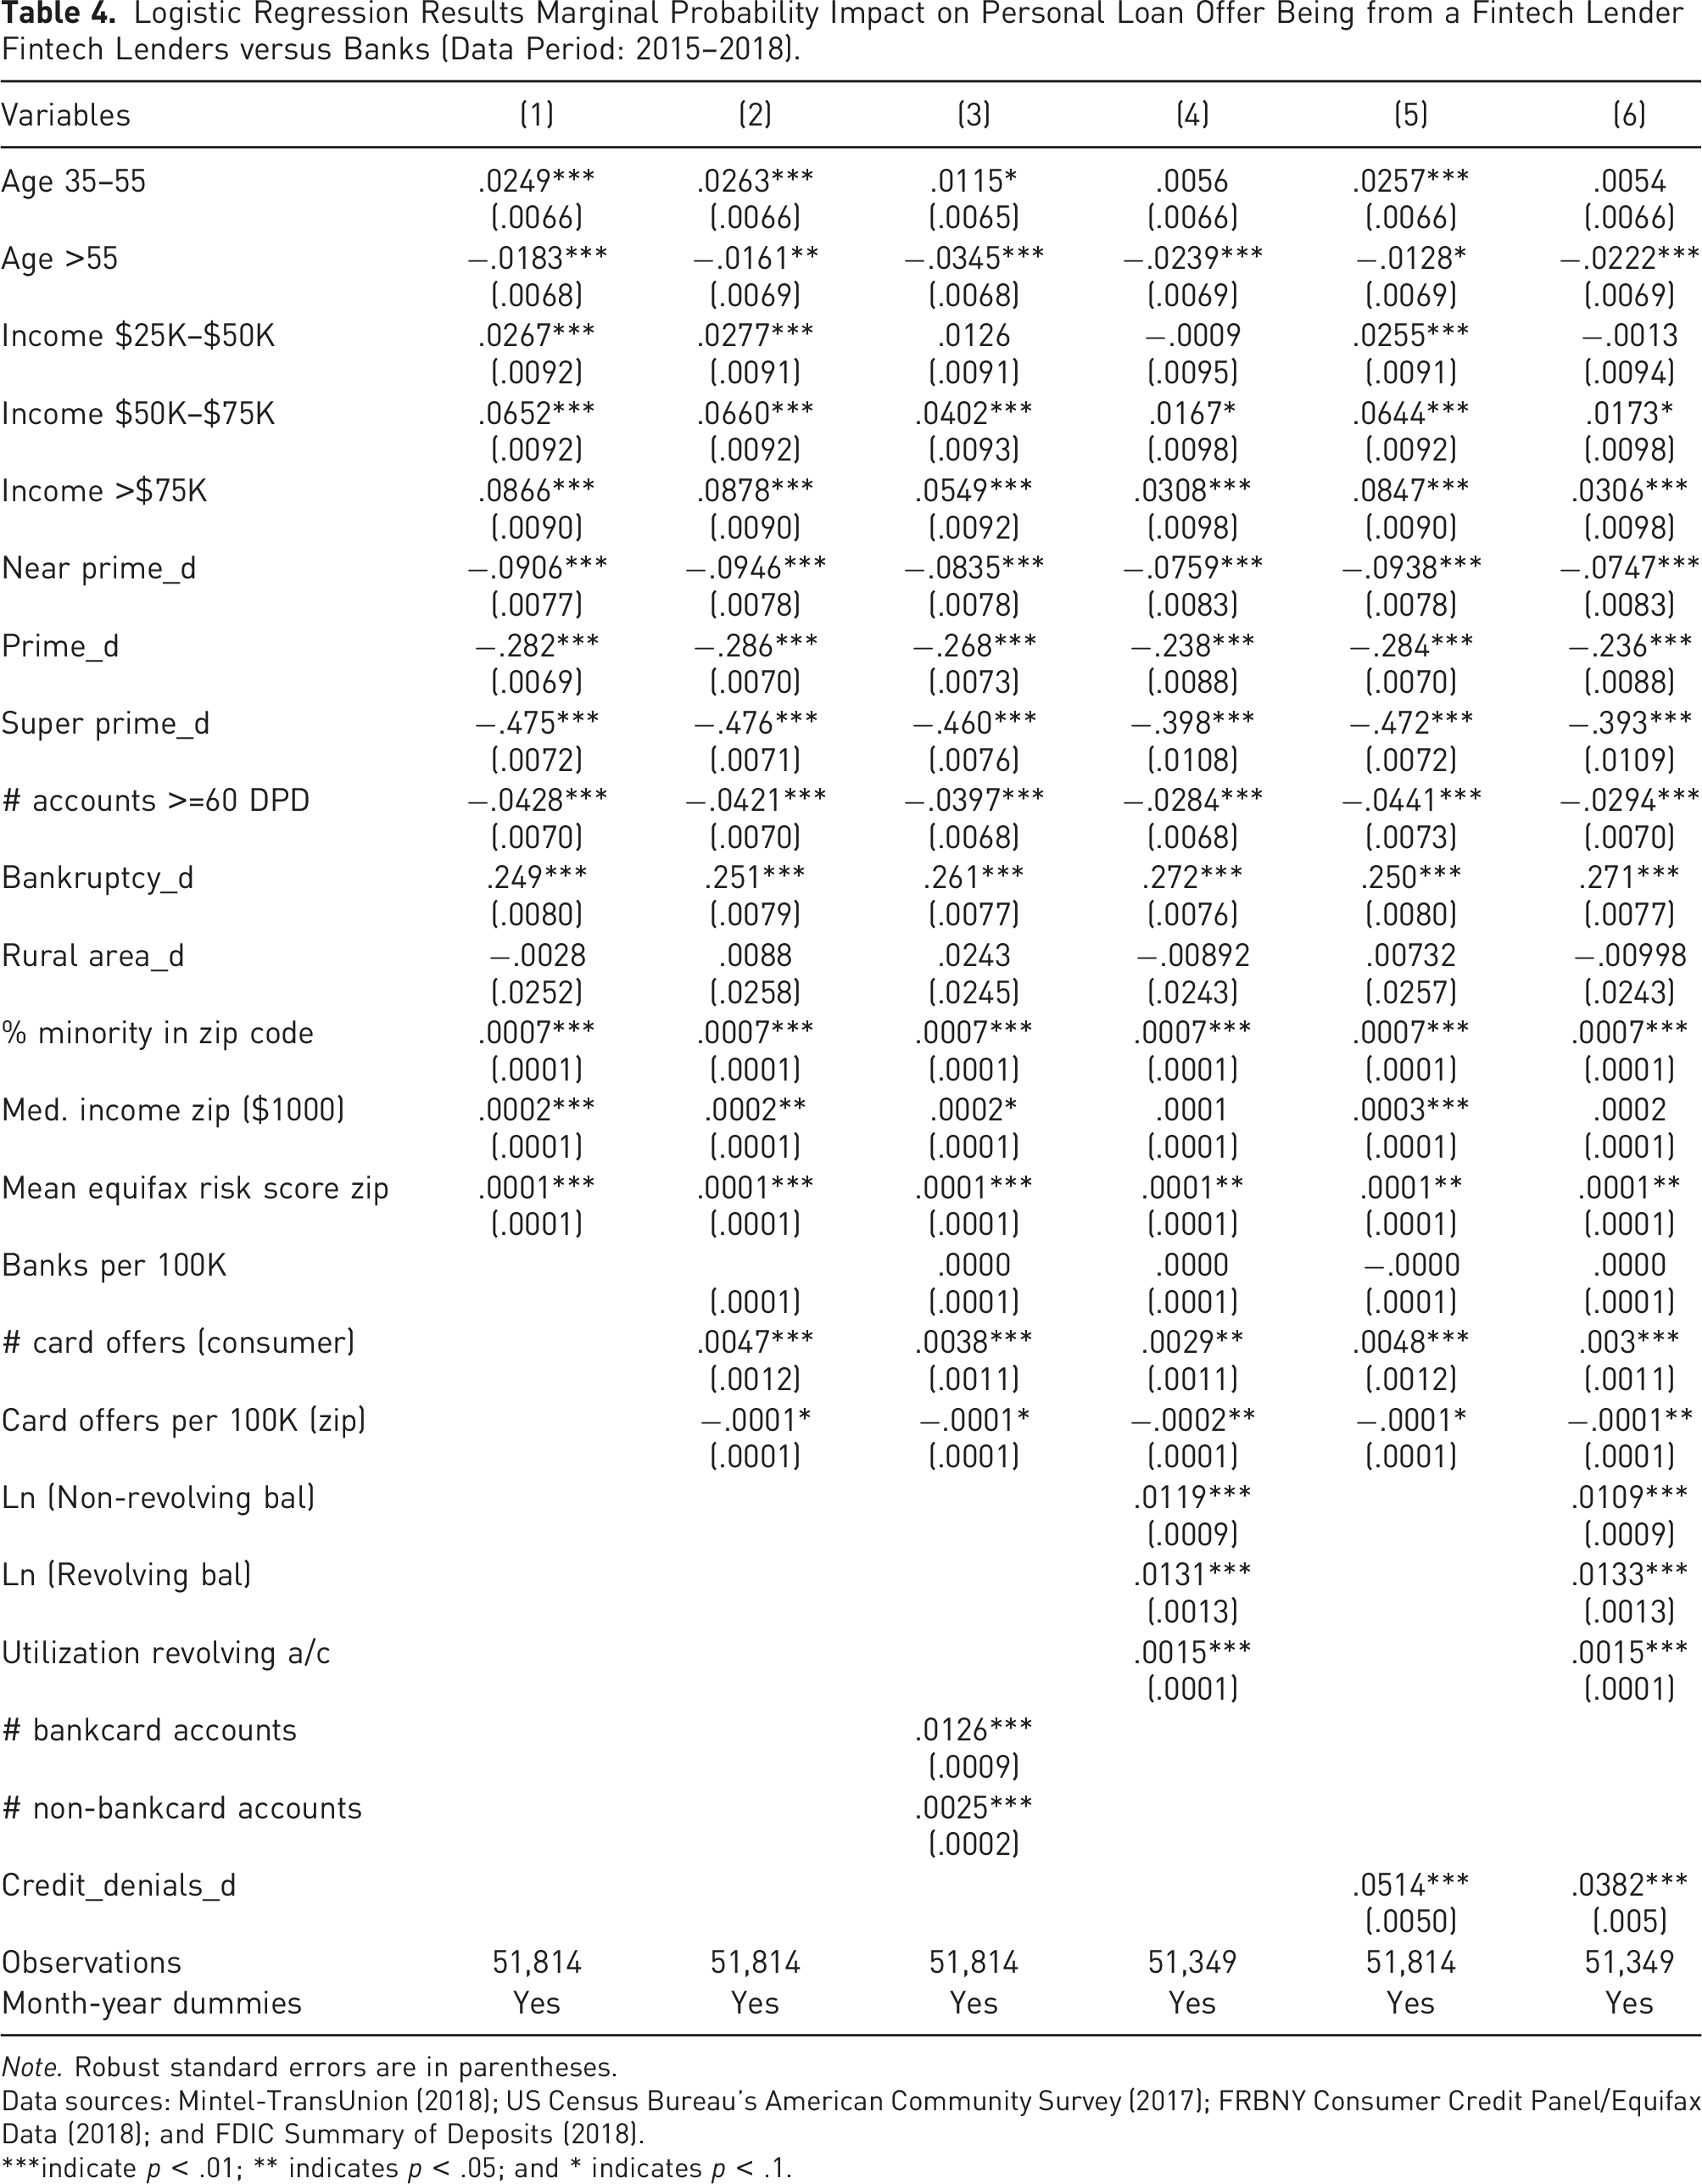
Logistic Regression Results Marginal Probability Impact on Personal Loan Offer Being from a Fintech Lender Fintech Lenders versus Banks (Data Period: 2015–2018).
Note. Robust standard errors are in parentheses.
Data sources: Mintel-TransUnion (2018); US Census Bureau’s American Community Survey (2017); FRBNY Consumer Credit Panel/Equifax Data (2018); and FDIC Summary of Deposits (2018).
***indicate p < .01; ** indicates p < .05; and * indicates p < .1.
Logistic Regression Results Probability That a Personal Loan Offer Is from a Fintech Lender Fintech Lenders versus Other Nonbank Lenders (Data Period: 2015–2018).
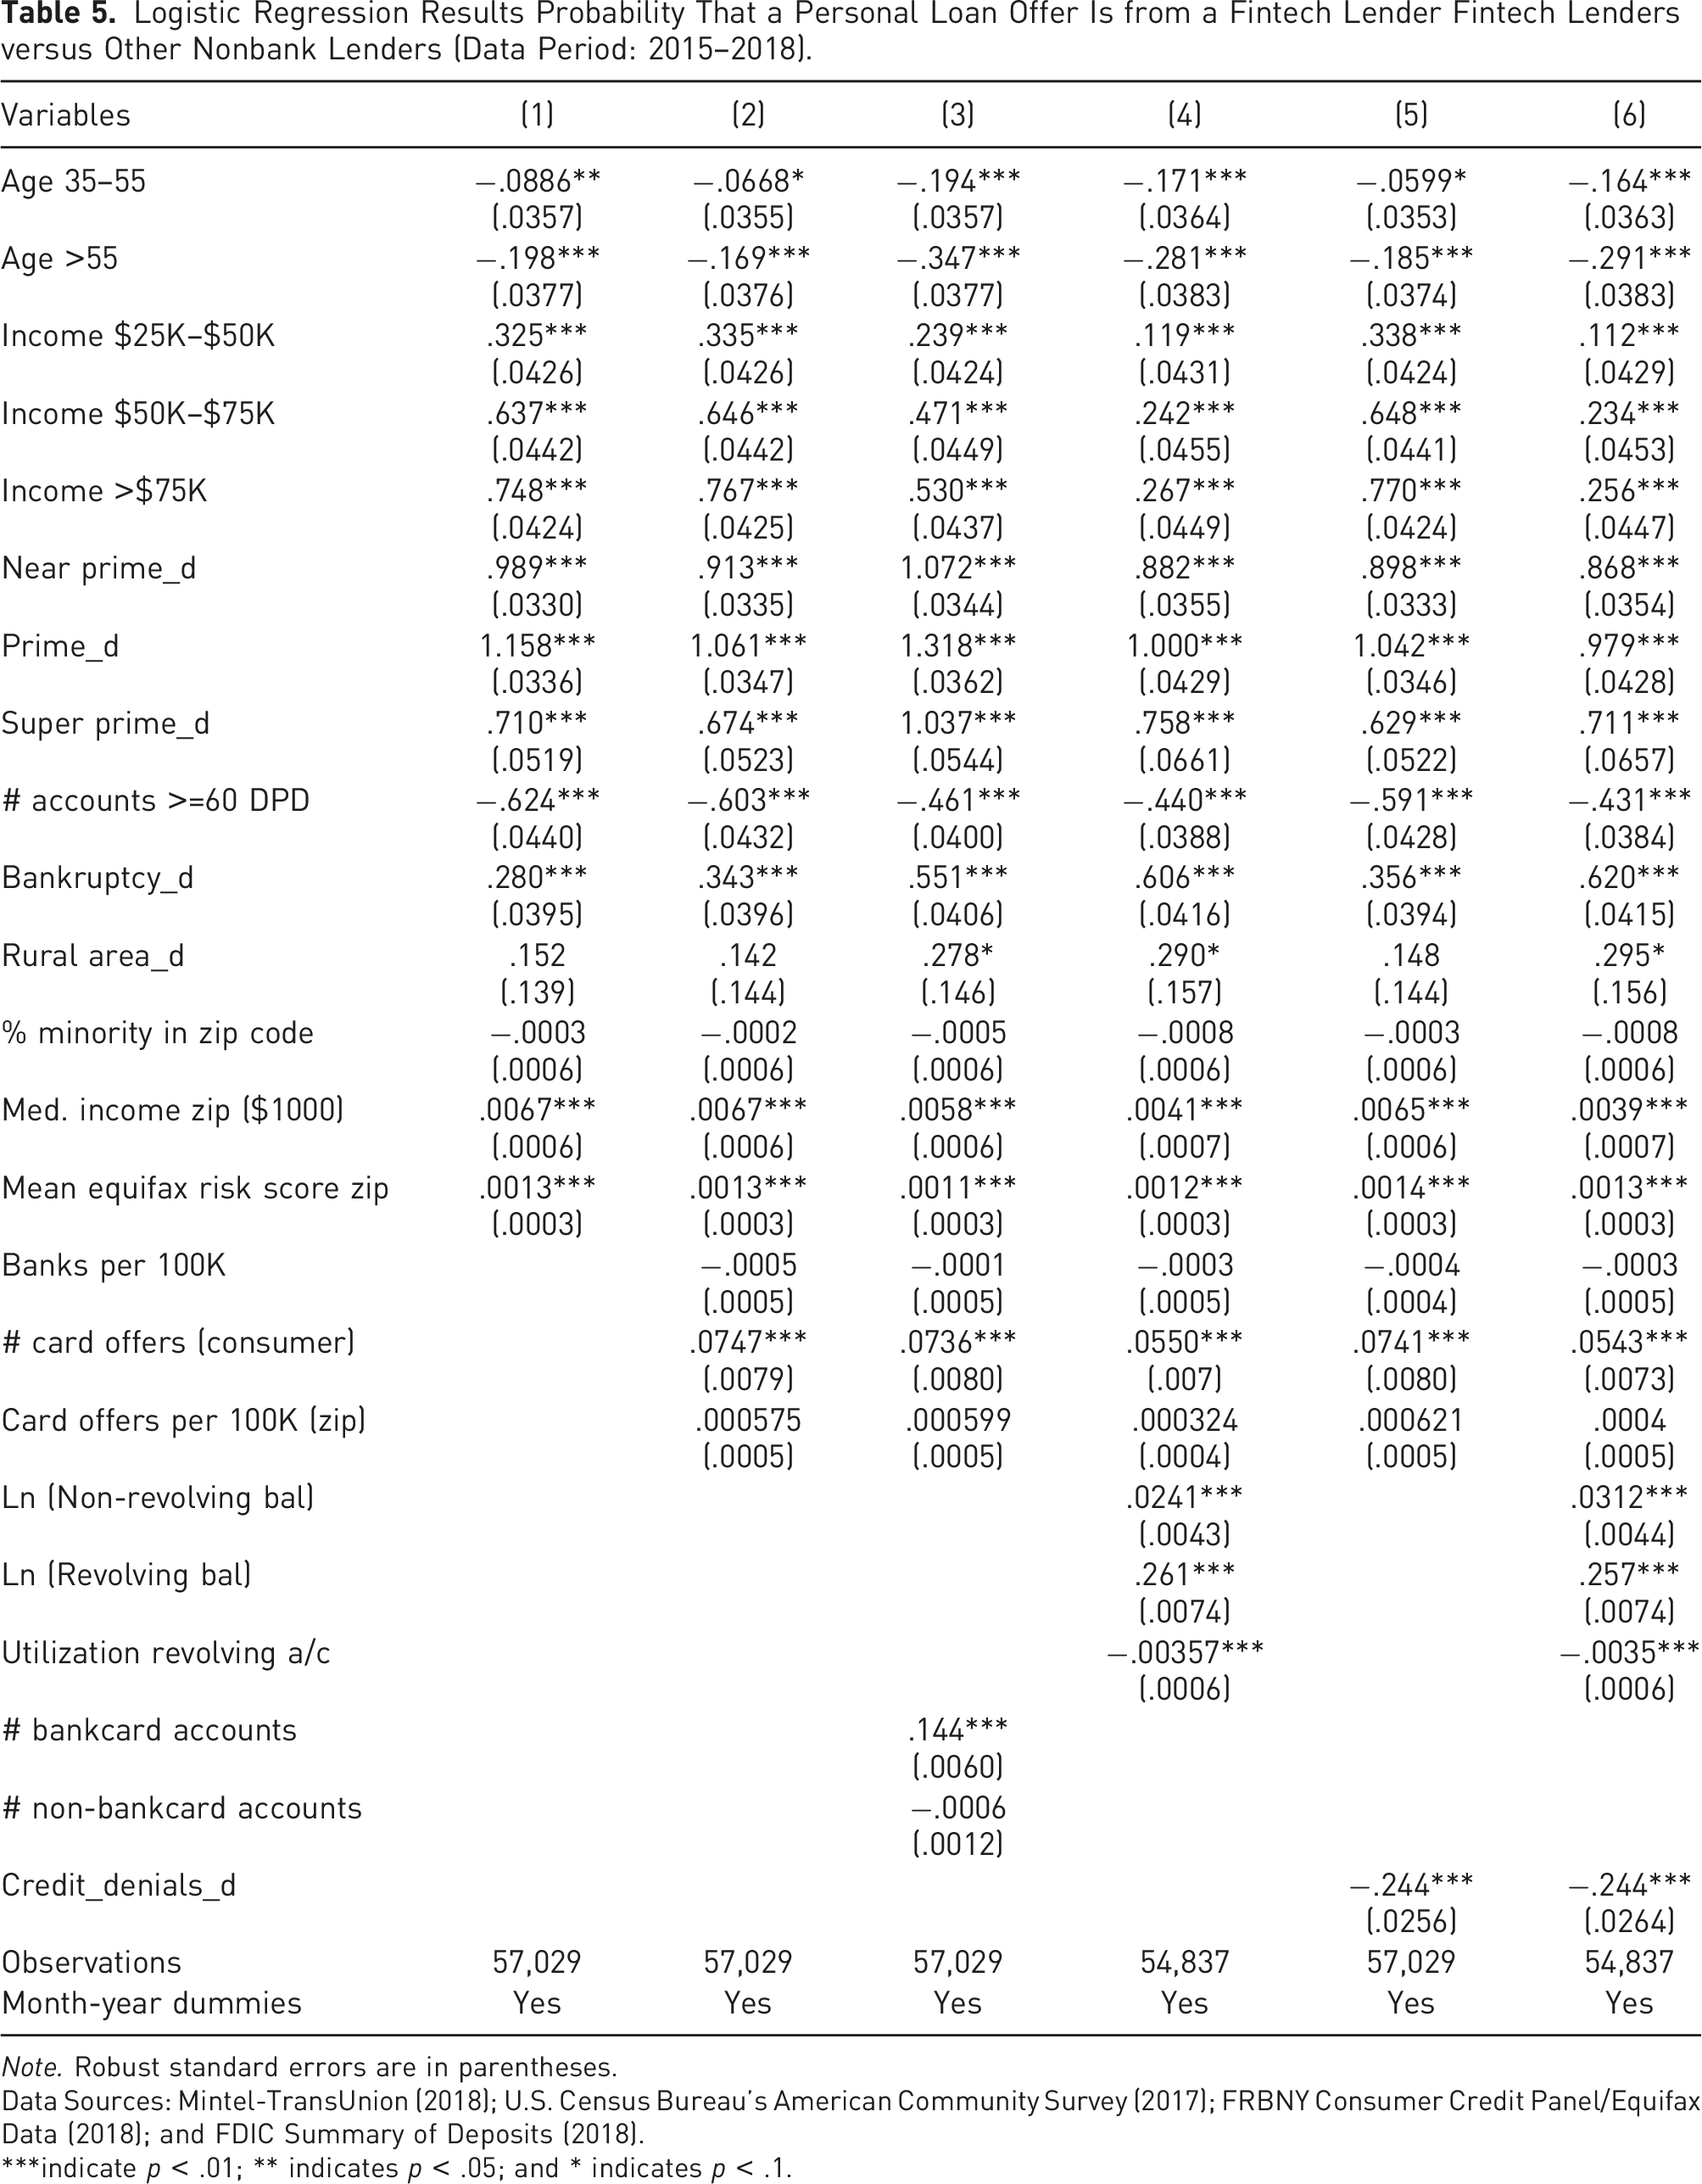
Note. Robust standard errors are in parentheses.
Data Sources: Mintel-TransUnion (2018); U.S. Census Bureau’s American Community Survey (2017); FRBNY Consumer Credit Panel/Equifax Data (2018); and FDIC Summary of Deposits (2018).
***indicate p < .01; ** indicates p < .05; and * indicates p < .1.
Logistic Regression Results Marginal Probability Impact — on Personal Loan Offer Being from a Fintech Lender Fintech Lenders versus Other Nonbank Lenders (Data Period: 2015–2018).
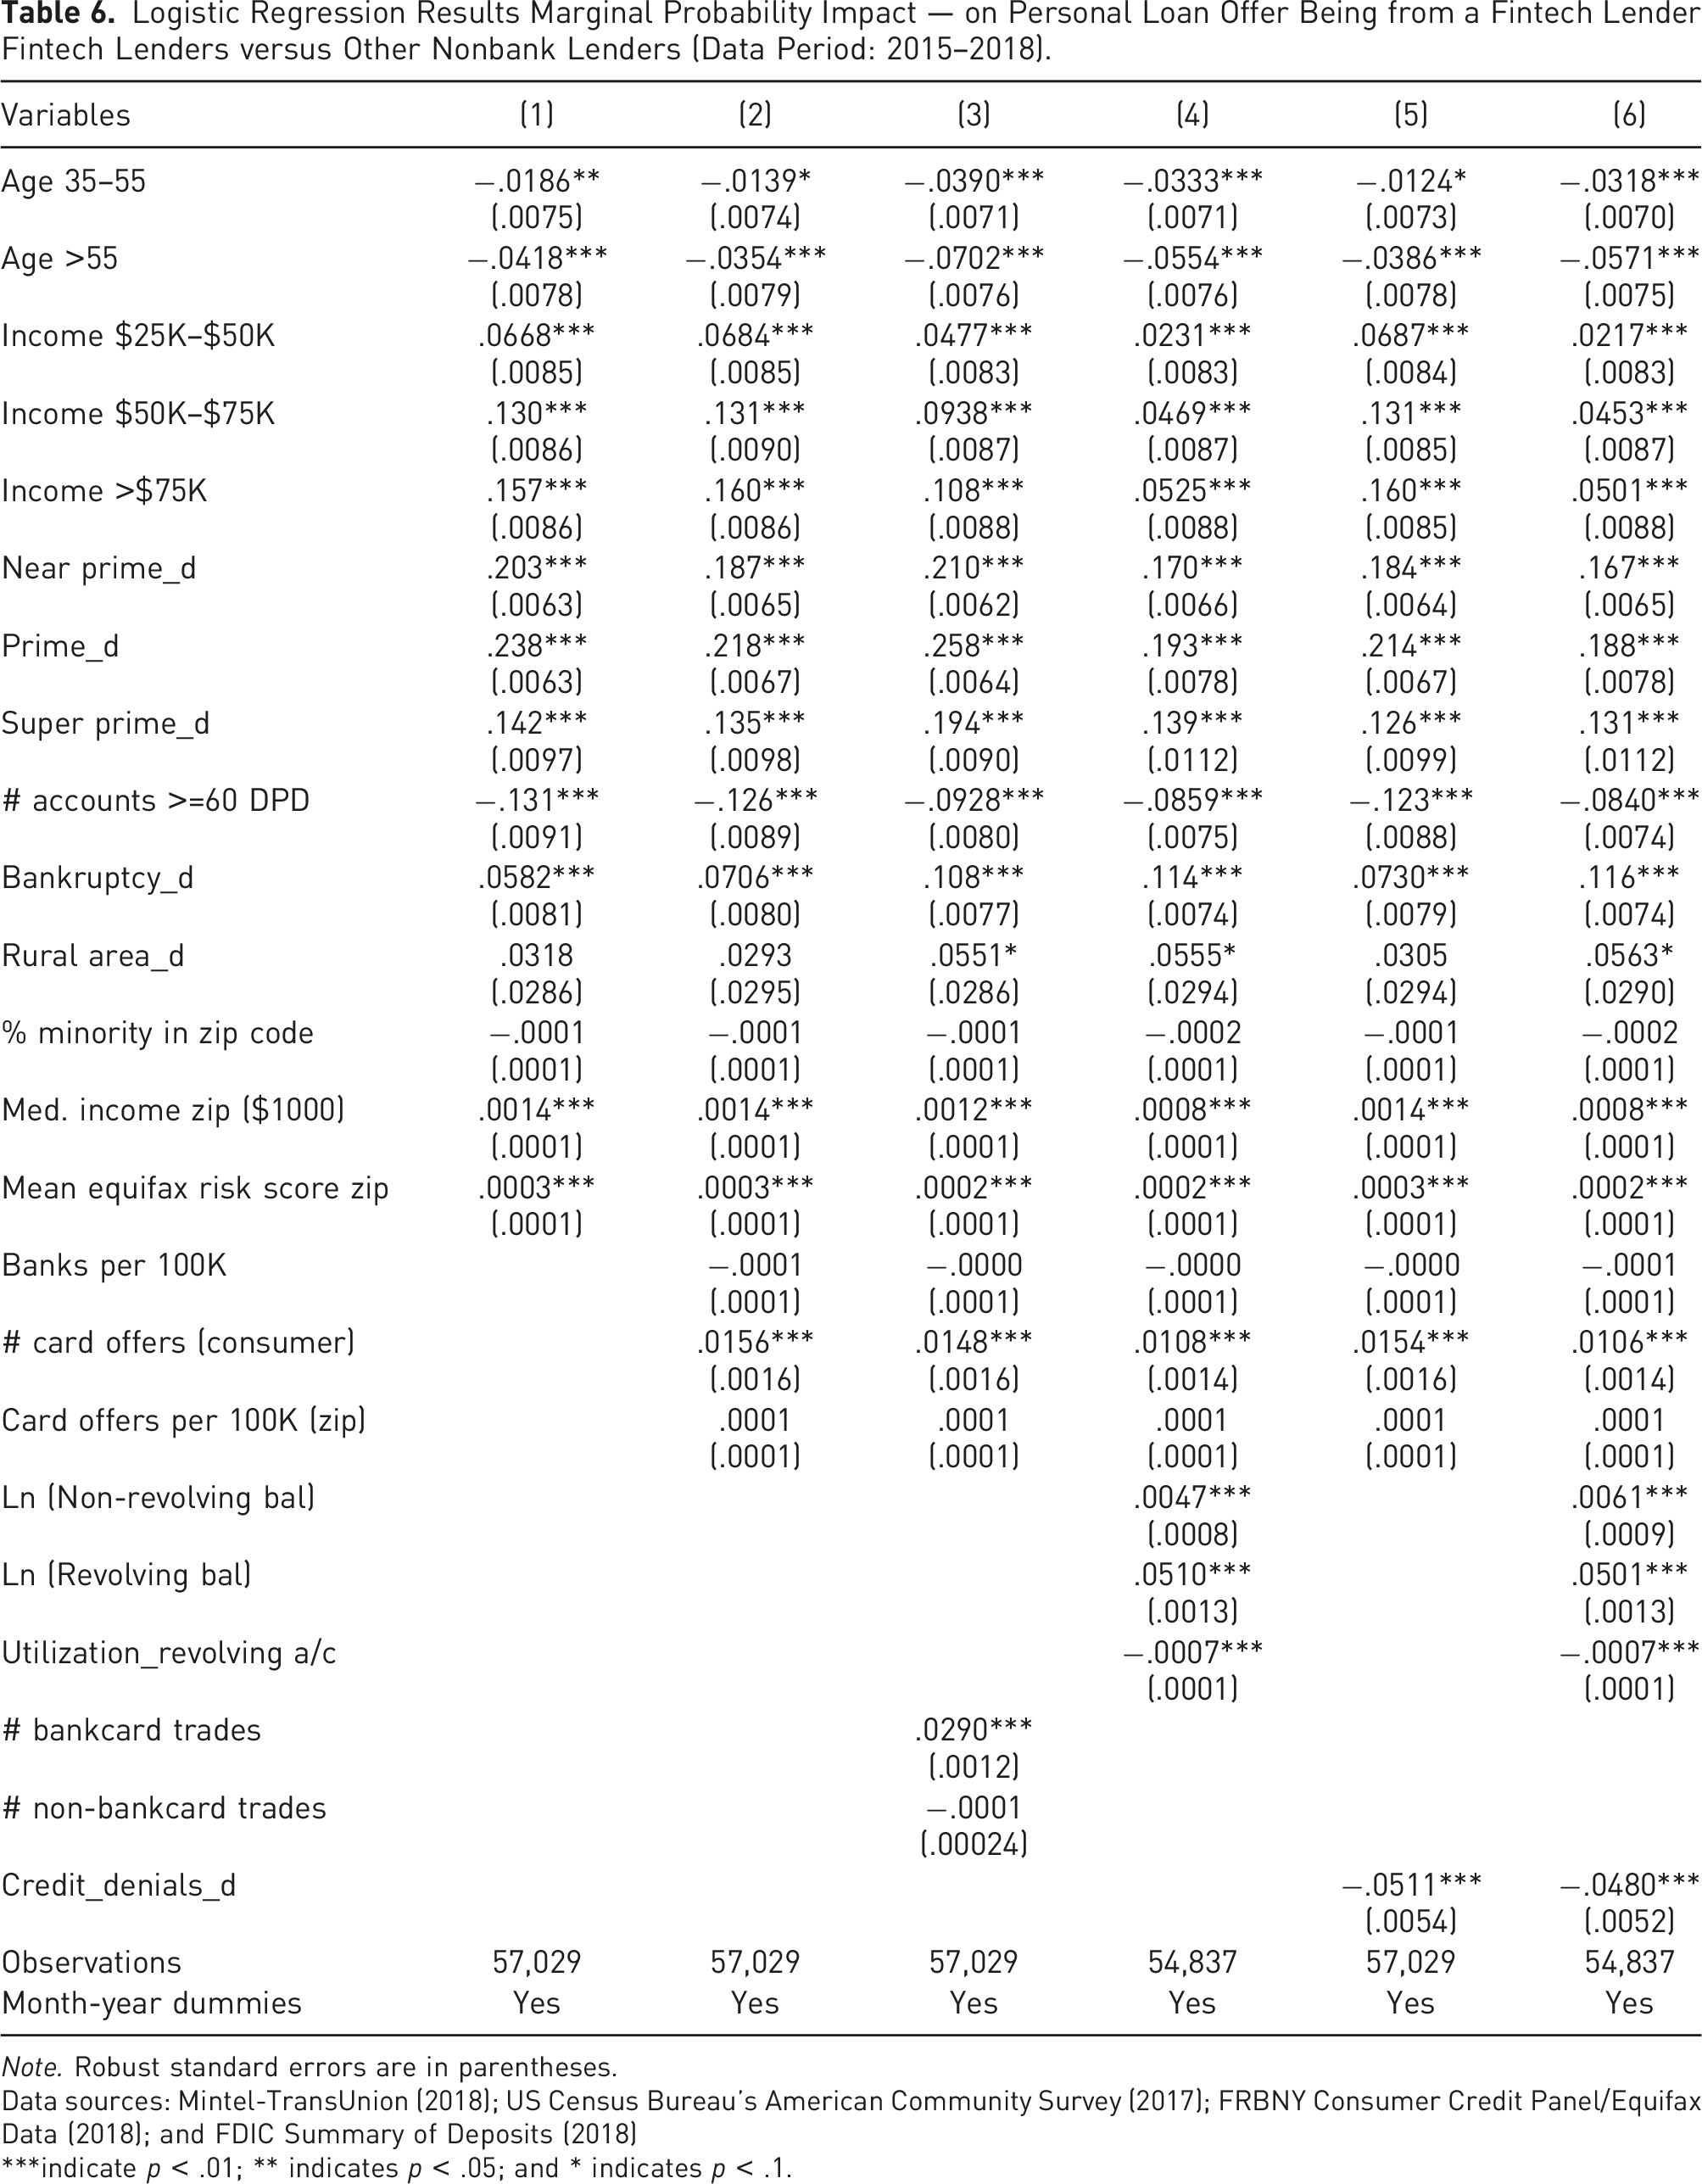
Note. Robust standard errors are in parentheses.
Data sources: Mintel-TransUnion (2018); US Census Bureau’s American Community Survey (2017); FRBNY Consumer Credit Panel/Equifax Data (2018); and FDIC Summary of Deposits (2018)
***indicate p < .01; ** indicates p < .05; and * indicates p < .1.
Logistic Regression Results Probability That a Mortgage Loan Offer is from a Fintech Lender Fintech Lenders versus Banks (Data Period: 2015–2018).
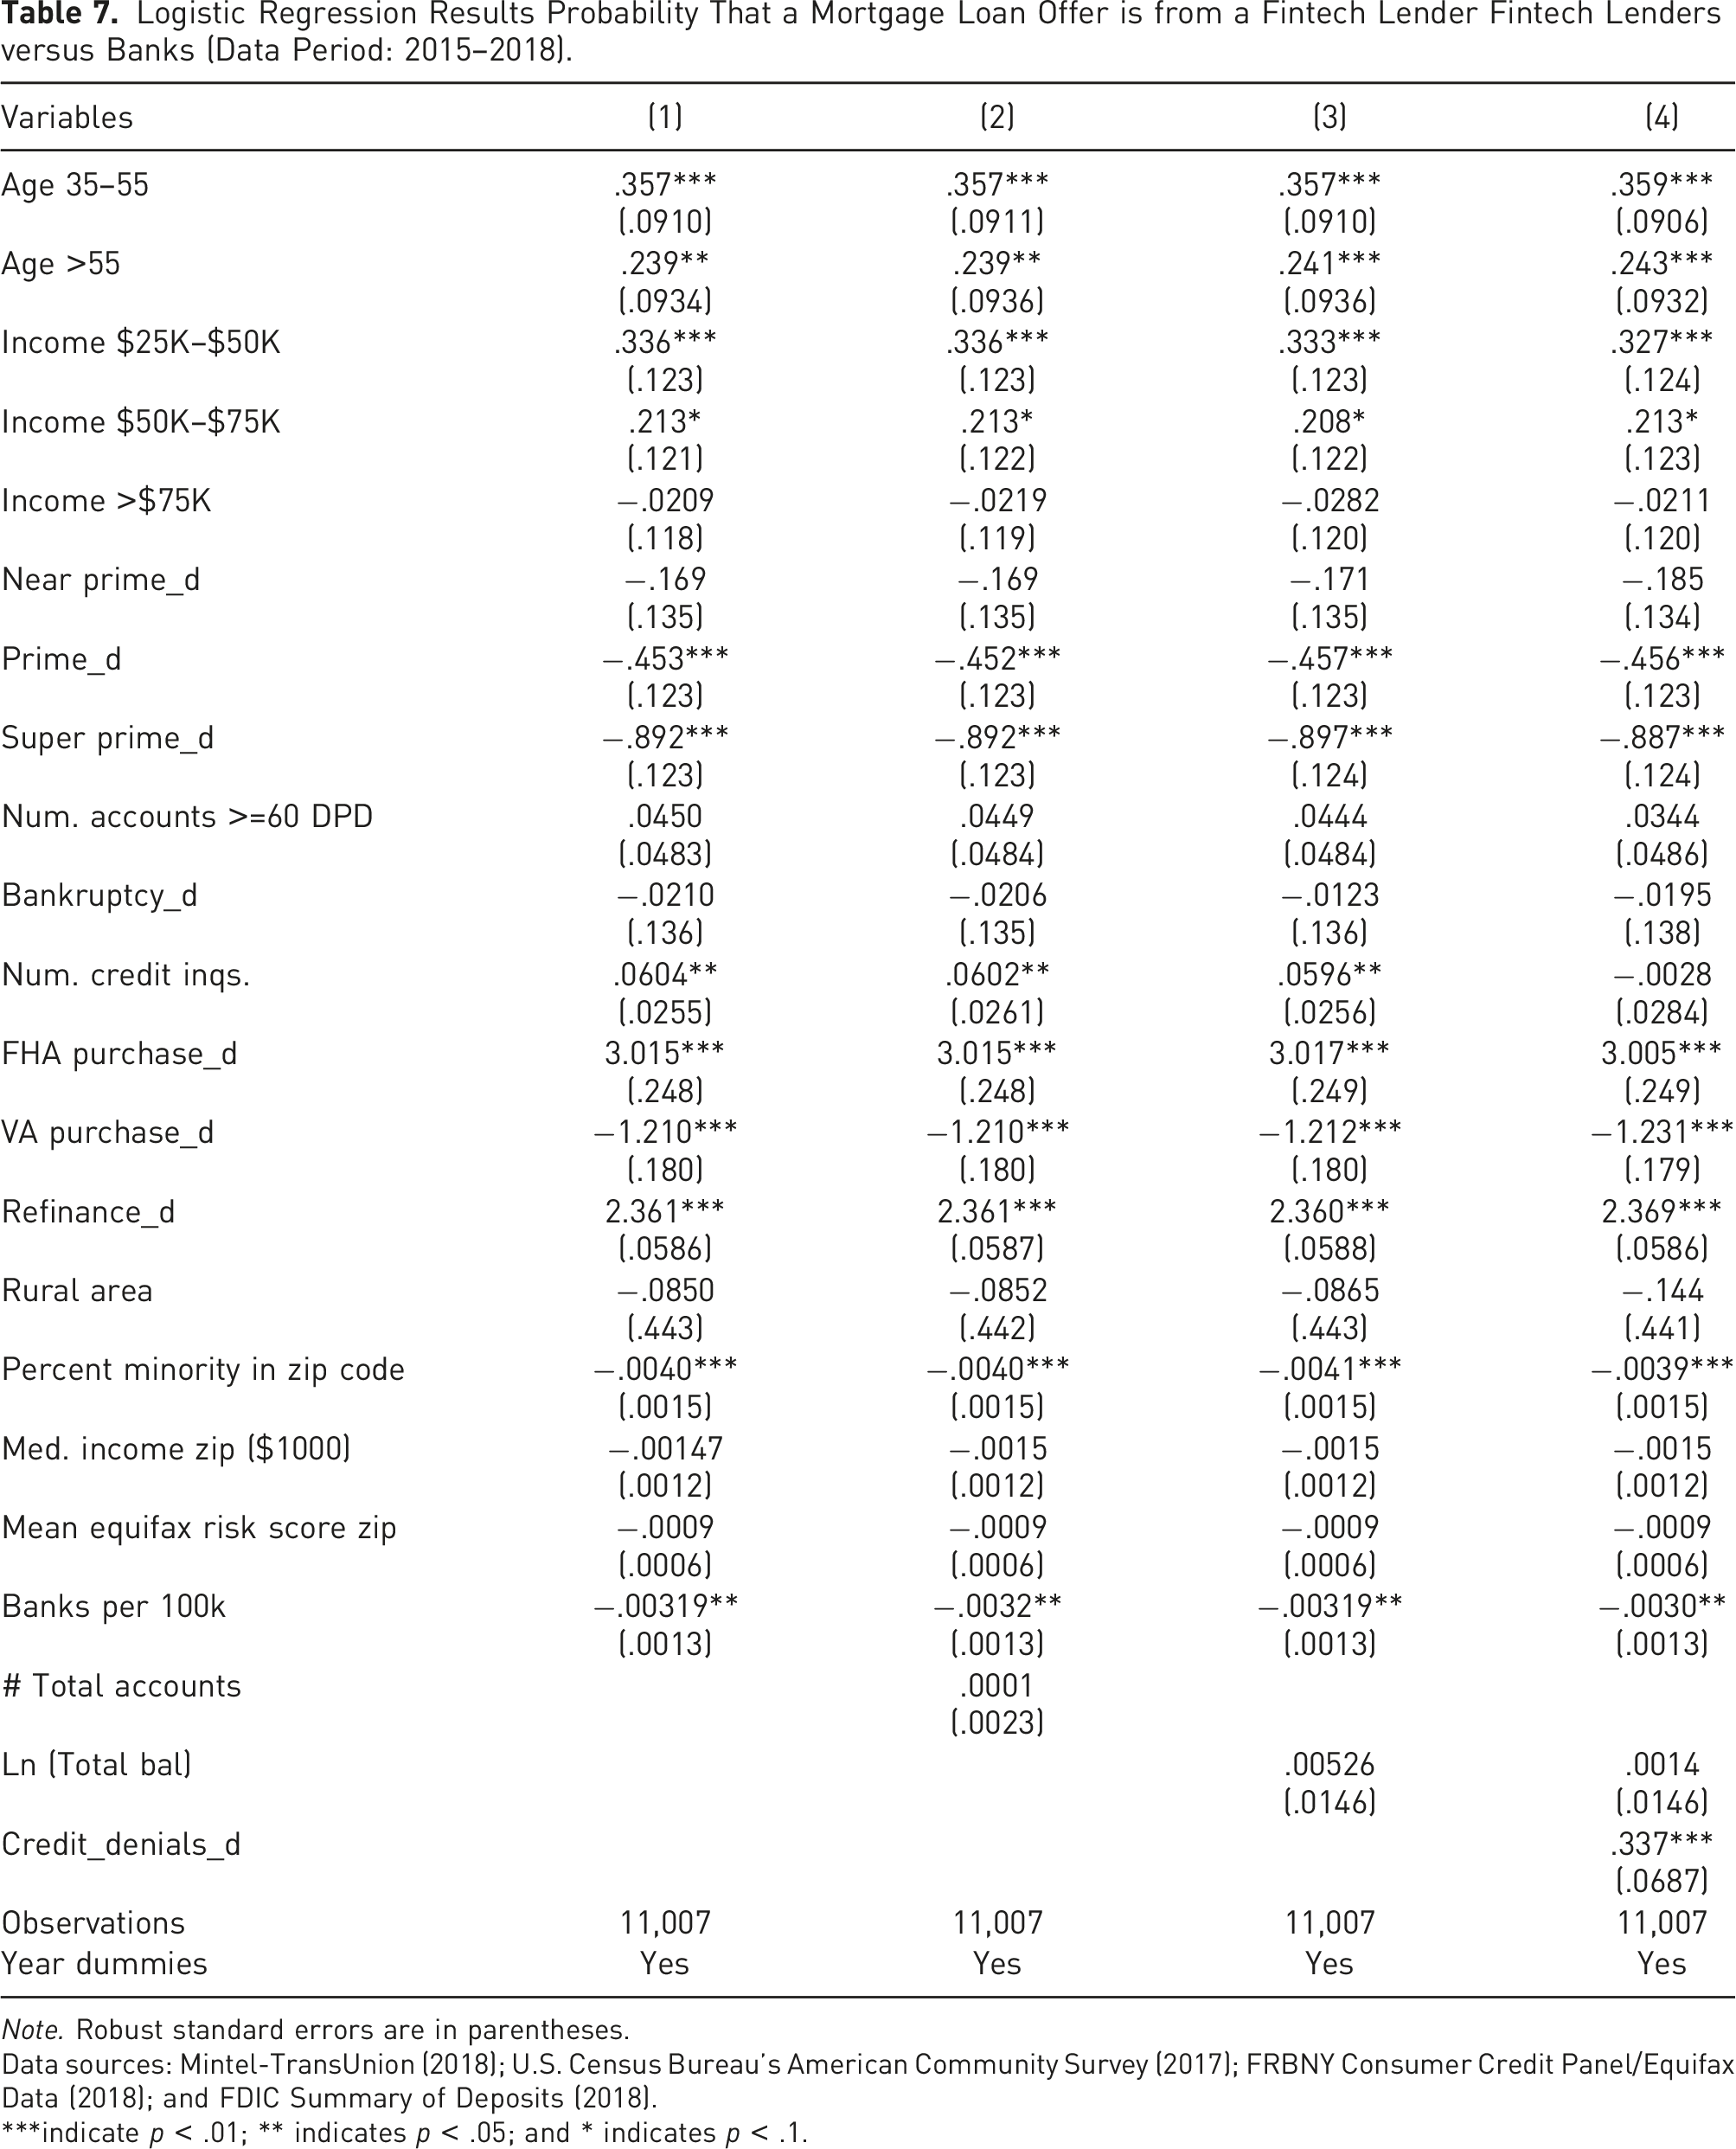
Note. Robust standard errors are in parentheses.
Data sources: Mintel-TransUnion (2018); U.S. Census Bureau’s American Community Survey (2017); FRBNY Consumer Credit Panel/Equifax Data (2018); and FDIC Summary of Deposits (2018).
***indicate p < .01; ** indicates p < .05; and * indicates p < .1.
Logistic Regression Results Marginal Probability Impact — on Mortgage Offer Being from a Fintech Lender Fintech Lenders versus Banks (Data Period: 2015–2018).
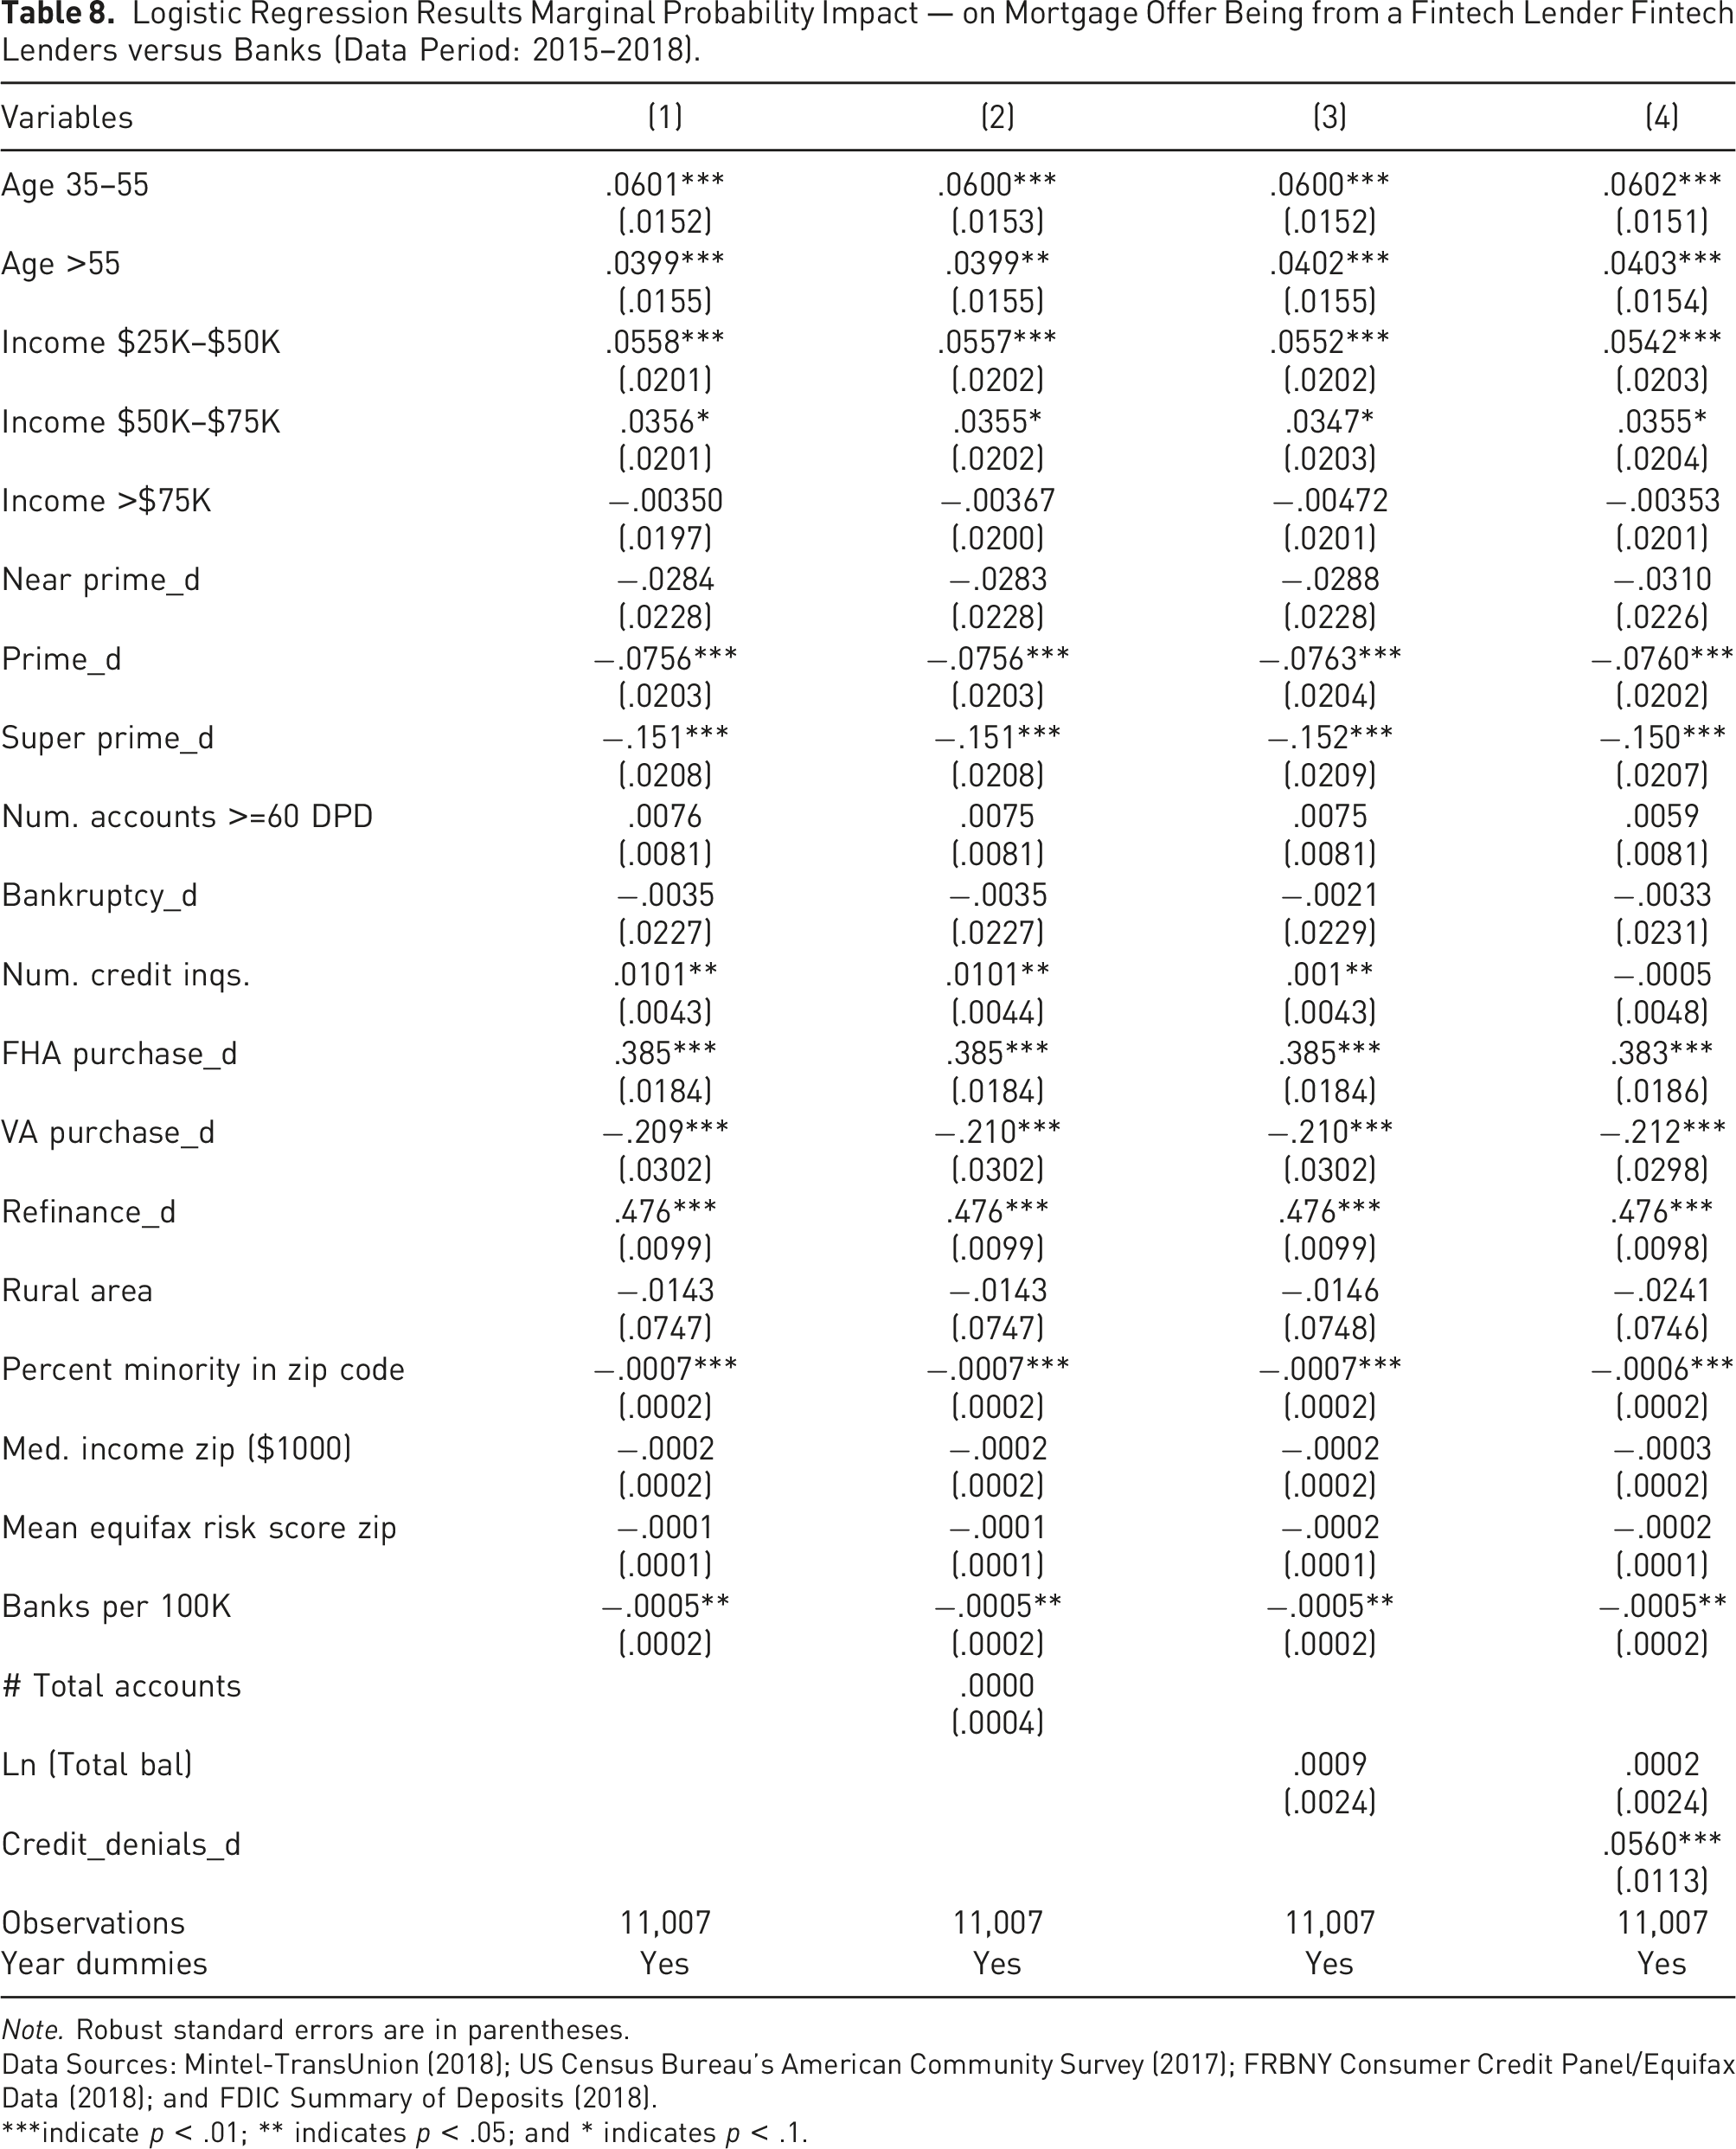
Note. Robust standard errors are in parentheses.
Data Sources: Mintel-TransUnion (2018); US Census Bureau’s American Community Survey (2017); FRBNY Consumer Credit Panel/Equifax Data (2018); and FDIC Summary of Deposits (2018).
***indicate p < .01; ** indicates p < .05; and * indicates p < .1.
Logistic Regression Results Probability That a Mortgage Offer is from a Fintech Lender Fintech Lenders versus Other Nonbank Lenders (Data Period: 2015–2018).
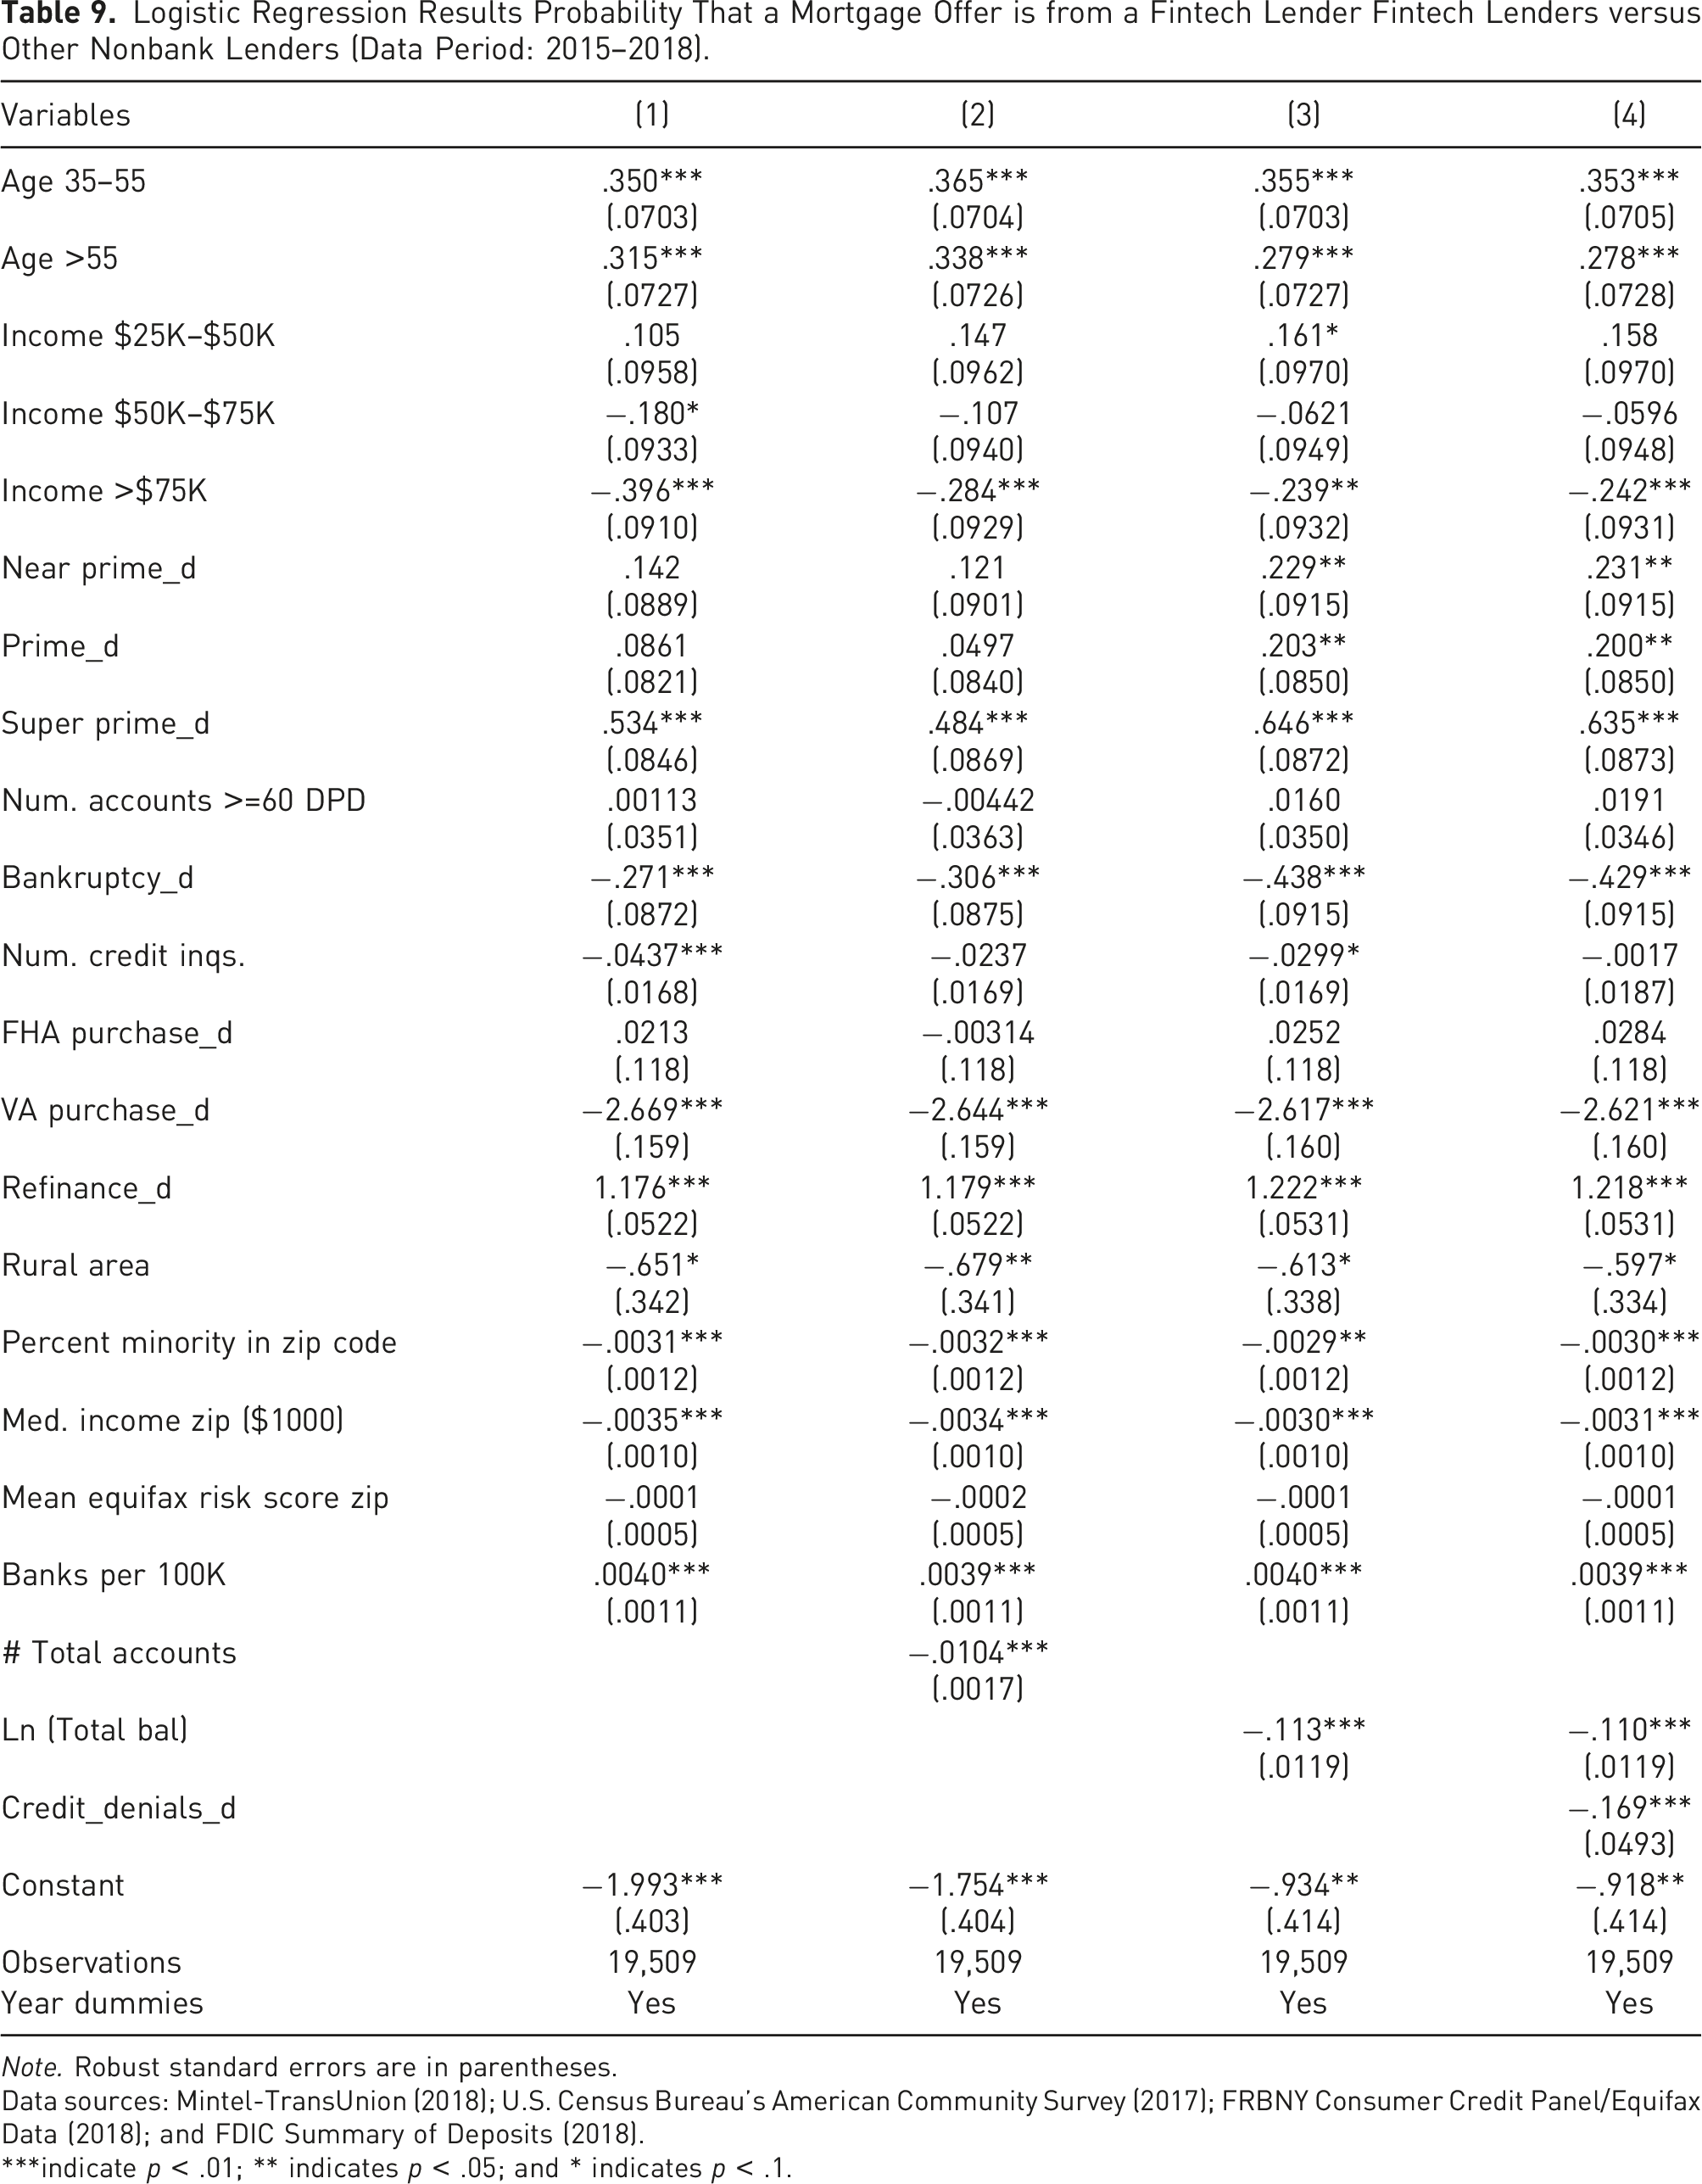
Note. Robust standard errors are in parentheses.
Data sources: Mintel-TransUnion (2018); U.S. Census Bureau’s American Community Survey (2017); FRBNY Consumer Credit Panel/Equifax Data (2018); and FDIC Summary of Deposits (2018).
***indicate p < .01; ** indicates p < .05; and * indicates p < .1.
Logistic Regression Results Marginal Probability Impact — on Mortgage Offer Being from a Fintech Lender Fintech Lenders versus Other Nonbank Lenders (Data Period: 2015–2018).
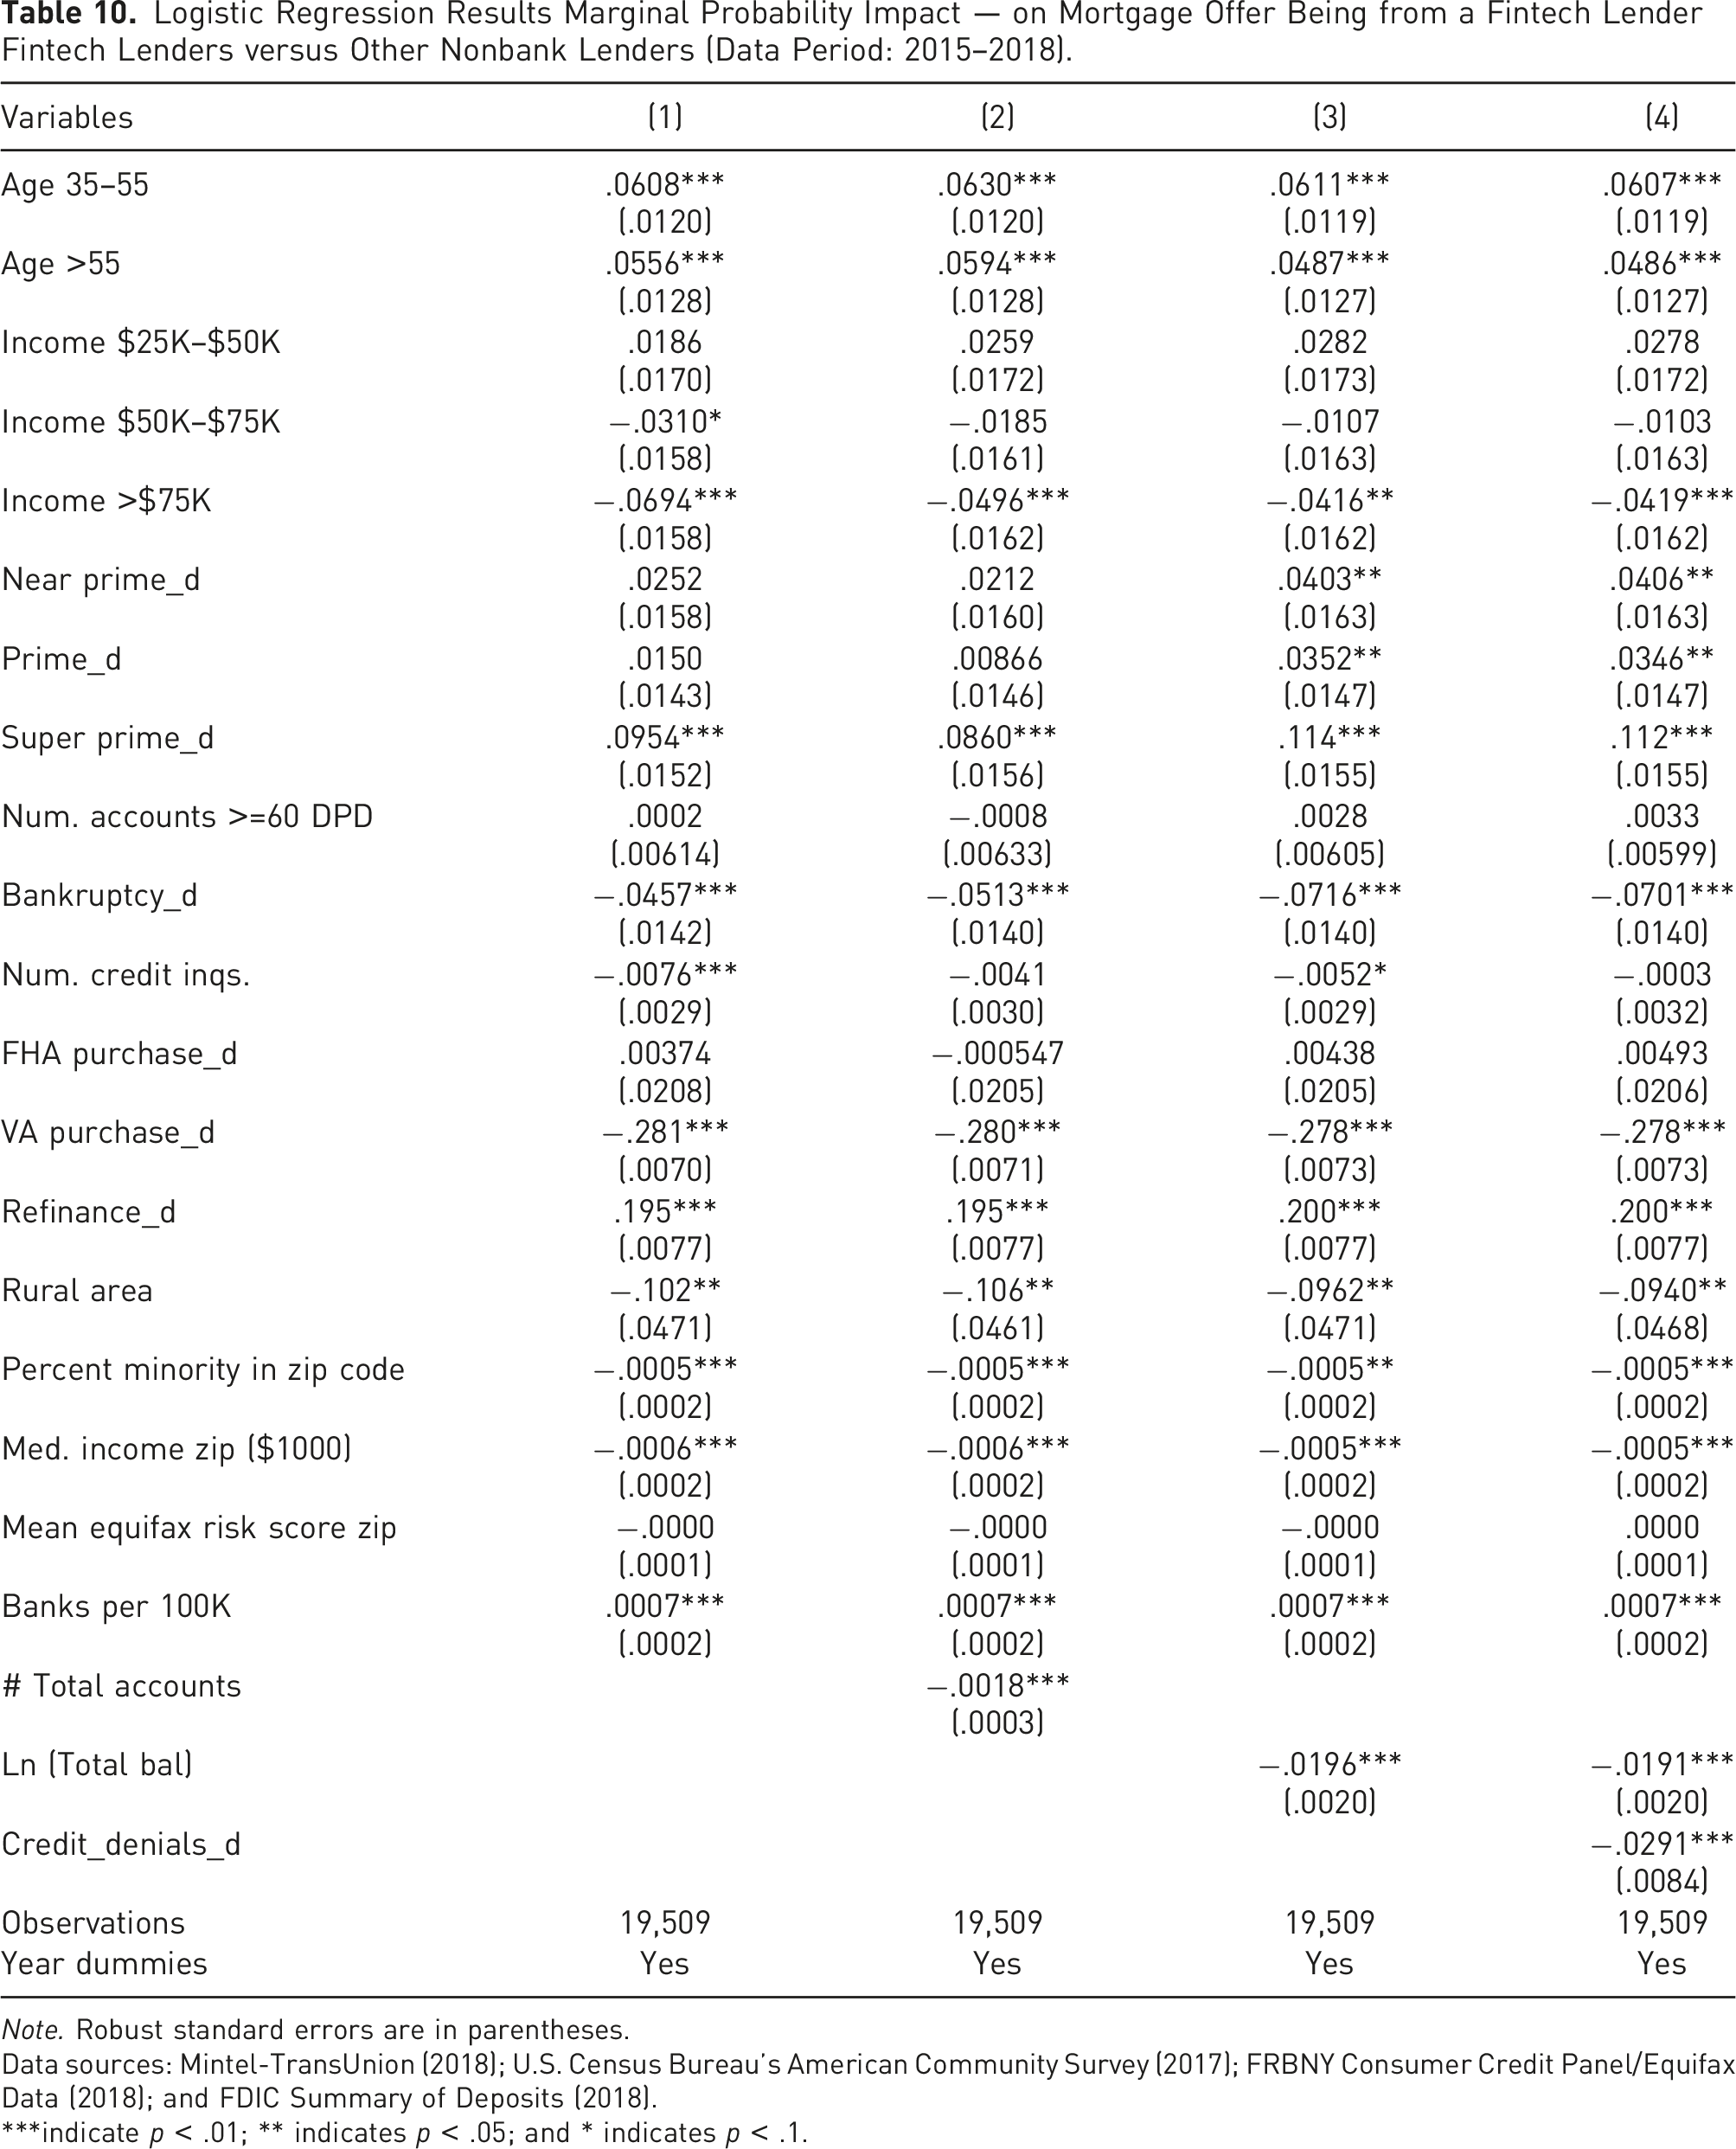
Note. Robust standard errors are in parentheses.
Data sources: Mintel-TransUnion (2018); U.S. Census Bureau’s American Community Survey (2017); FRBNY Consumer Credit Panel/Equifax Data (2018); and FDIC Summary of Deposits (2018).
***indicate p < .01; ** indicates p < .05; and * indicates p < .1.
Robustness Testing
We perform three additional analyses that provide further evidence to support our main findings from the previous section. These robustness results are presented in the Appendix.
First, we recognize credit card offers (by banks) as a potential substitute for personal loan offers. We run a multinomial logistic regression for the personal loan analysis, using the full sample of both credit cards and personal loans. We do this to account for the fact that credit cards and personal loans are highly substitutable. So, ignoring credit cards in our earlier specification may not paint the full picture of who fintech firms are targeting relative to traditional banks, particularly since the majority of traditional banks’ mail are in the form of credit card offers (rather than personal loan offers). In this extended analysis, we use credit cards as the base group and compare both traditional and fintech personal loan offers with the base group and to each other.
Second, we differentiate between mortgage offers for refinance versus for home purchase. We rerun our initial specification for the mortgage offers but restrict the sample to only purchase offers (excluding refinance offers). We do this because consumers who receive refinance offers already own a home, and they are therefore likely to systematically differ from consumers who receive purchase offers in a number of respects. Most notably, homeowners typically already have relatively easy access to credit, so including this group in our original regressions may cause bias in the estimates of the credit access variables.
Third, we apply more complex algorithms to reevaluate the main findings. We run ML algorithms, specifically random forest and decision tree models, using the same variables we included in our logistic regression models (presented in Tables 3‒10) to better understand the factors that are most important for predicting whether a credit offer is from a fintech or a traditional lender. We then perform a feature importance calculation for each variable to determine the importance of each variable based on its contribution in predicting the outcome (whether a credit offer is from a fintech or traditional firms).
Empirical Results: Personal Loan Offers
Main Results on Personal Loan Offers — Logistic Regressions
We first compare fintech firms with traditional banks. The sample observations only include credit offers made by banks or fintech lenders during the period 2015‒2018. Nonbank offers are excluded in this section of the analysis. The results will help us understand the potential for fintech to fill the credit gaps in the banking sector. However, banks and fintech firms are not subject to the same regulatory requirements. To compare lending incentives among similar lenders, we also compare fintech lenders with other nonbank lenders in a separate analysis.
Personal Loan Offers — Fintechs versus Banks
In comparing credit offers by fintech lenders versus banks, we find that fintech firms target subprime consumers more than banks do. In addition, fintech lenders tend to reach out to consumers who may have difficulty accessing credit, such as those who have experienced a bankruptcy and those whose credit applications have been denied (in the last 6 months) by traditional lenders, more than banks do. We also find that some of the consumers who received credit offers from fintech firms might have had access to credit through traditional lenders previously, because of their existing loan balance (either revolving or nonrevolving accounts).
Table 3 shows the results from the logistic regressions that estimate the probability that a personal loan offer is a fintech offer, rather than a bank offer. Table 4 presents the marginal impact probabilities calculated from the logistic results presented in Table 3.
Consumer Credit Scores
In column 1 of Table 3, the coefficient of dummy indicators for being near prime, prime, and super prime (with subprime being the base case) are significantly negative, and they are in rank order with coefficients getting more negative from near prime (−.49), prime (−01.45), to super prime (−2.53). The results indicate that credit offers to subprime consumers are almost 30 percentage points (50 percentage points) more likely to be from a fintech firm, rather than a bank, compared with offers to prime (super prime) consumers. The coefficients and the marginal impacts remain significantly negative and in rank order even when additional risk characteristics and control factors are also included in the models, as presented in columns 2‒6 of Tables 3 and 4. These results are consistent with an argument that fintech lenders attempt to reach out to subprime borrowers, and those consumers are not well served by banks.
Household Income
The effect of income is much more muted. The marginal impacts of income, as shown in column 6 of Table 4, are relatively small and mostly insignificant. The results on the marginal impact (in the full model in column 6 of Table 4) indicate that there is no significant difference between fintech offers and bank offers with regard to the zip code’s median income of consumers.
Underserved Consumers
Aside from credit score, there are other indications that fintech firms are specifically reaching out to consumers with significant difficulty accessing credit. The coefficients of bankruptcy indicators and credit denial indicators are consistently positive and significant in Tables 3 and 4. From column 6 of Table 4, in the full model where all the risk and control factors are included, the results indicate that credit offers made to consumers who had experienced bankruptcy are 27 percentage point more likely to be from a fintech firm, rather than from a bank. And credit offers made to consumers whose credit applications have been denied at least once in the past 6 months are 3.8 percentage points more likely to be from a fintech firm, suggesting once again that fintech lenders attempt to reach out to consumers who are credit constrained or have trouble obtaining credit through the traditional channels.
Consumers with more credit accounts and those with higher loan balances (had previously adequate access to credit) are also more likely to receive credit offers from fintech firms. In our full specification, a 10% increase in a consumer’s nonrevolving balance is associated with a 11% increase in the probability of an offer being from a fintech firm, and a similar increase in revolving balances leads to a 13-percentage point increase. The number of credit card offers variable and the number of accounts variable are also significantly positive but with much smaller magnitude. Fintech firms seem to also reach out to consumers who may have had good access to credit previously (since the loan balances may be carried over from earlier periods) but who may have recently seen their credit scores drop and are now credit constrained.
Lastly, the coefficients of ratio of minorities in the zip code are also consistently positive and significant, as shown in columns 1‒6 of Tables 3 and 4. The marginal impacts reported in Table 4 indicate that a credit offer is more likely to be an offer from a fintech lender, rather than from a bank, when the offer is sent to consumers who live in a zip code with higher ratio of minorities.
Personal Loan Offers — Fintechs versus Other Nonbanks
Both fintech and other nonbank lenders are not subject to the regulatory requirements that banks are subject to. In comparing fintech lenders with other nonbank lenders, we control for the regulatory landscape in this section. The results are in line with what we have observed earlier from raw data in Figures 2‒5. The full results of our analysis comparing fintech and other nonbanks are presented in Tables 5 (logistic regression coefficients) and 6 (the associated marginal probabilities based on the coefficients presented in Table 5).
Consumer Credit Scores
In column 1 of Table 5, where we only include demographic variables without the indicators of credit access, the coefficient of dummy indicators for being near prime, prime, and super prime (with subprime being the base case) are significantly positive. The results indicate that credit offers to subprime consumers are about 24 percentage points (14 percentage points) less likely to be from a fintech firm, rather than other nonbanks, compared with offers to prime (super prime) consumers. The coefficients and the marginal impacts remain significantly positive when additional risk characteristics and control factors are also included in the models, as presented in columns 2‒6 of Tables 5 and 6. The results show that (traditional) nonbank lenders are even more aggressive than fintech firms in reaching out to less creditworthy (subprime) consumers. And, as discussed earlier, Tables 3 and 4 show that fintech firms are more likely to do so than banks do. Overall, our results indicate that all nonbank lenders (both fintechs and traditional nonbanks) are more willing than banks do to serve the less creditworthy consumers.
Household Income
Similarly, in column 1 of Table 5, we find the coefficients of income to be all significantly positive. However, the coefficients are muted when additional risk characteristics and other control factors are also included, as shown in column 6 of Table 5. The marginal impacts of income, as shown in the full model in column 6 of Table 6, are .021 (for $25K‒$50K), .045 (for $50K‒$75K), and .050 (for more than $75K), suggesting that credit offers to the lowest-income consumers (with household income below $25K) is about 5 percentage points less likely to be a fintech offer, rather than an offer from other nonbanks, compared with offers to consumers in the highest-income bracket of more than $75K. Overall, there is only a small marginal difference across lender types with regard to consumer household income.
Underserved Consumers
We find evidence that fintech lenders are more committed to serve some groups of underserved consumers than other nonbank lenders. The coefficients on the bankruptcy indicator are consistently positive and significant in Tables 5 and 6. From column 6 of Table 6, in the full model where all the risk and control factors are included, the results indicate that credit offers made to consumers who had experienced bankruptcy are about 12 percentage points more likely to be from a fintech firm, rather than from other nonbanks. We also observed earlier the same impact when comparing fintech with banks. Overall, the results indicate that fintech firms are making a significant effort to serve consumers who had filed for bankruptcy, above and beyond what other lenders are willing to do.
Unlike when we compare fintech with banks, we find that the coefficients of the ratio of minorities in the zip code are consistently insignificantly different from zero, as shown in columns 1‒6 of Tables 5 and 6. The marginal impacts reported in Table 6 indicate that a credit offer is equally likely to be an offer from a fintech lender or other nonbanks, regardless of the ratio of minorities in the zip code where consumers reside. There is, however, a significant marginal impact when considering rural versus urban consumers. The full model (column 6 of Table 6) indicates that credit offers made to consumers in rural areas (which tend to be less likely to have good access to traditional financial services) are about 6 percentage points more likely to be a fintech offer, rather than one from other nonbanks.
Overall, the results on bankruptcy and rural indicators are consistent with an argument that fintech lenders attempt to reach certain types of less-served consumers and penetrate underserved areas, even when comparing with other nonbank lenders. These findings are consistent with Jagtiani and Lemieux (2018), which explore the roles and fintech lenders using the actual loan origination (data from LendingClub’s personal lending platform). They find that LendingClub personal lending activities penetrate areas that are likely to be underserved by traditional banks.
Robustness Testing on Personal Loan Offers
Multinomial Logistic Regression Model
In this section, we consider an additional financial product, which is relatively substitutable to personal loan offers: credit card offers. It has been documented that more than 80% of personal installment loans have been used by consumers to pay off their credit card balance. We include credit card offers in the sample, using a multinomial logistic regression to compare the characteristics of offers across the three groups: fintech personal loans, bank personal loans, and bank credit cards. The marginal probabilities for an offer being from a fintech firm are not presented here but it is available in Table A1 of the Appendix.
The results of our robustness test confirm many of our main results, even when we compare fintech loan offers with the overall credit offers from banks (including both bank personal loan and credit card offers). Specifically, credit offers to subprime consumers are 11 percentage points more likely to be from fintech firms than from banks when considering all credit offers from banks. Similarly, the results on the bankruptcy indicator remain robust when including credit cards. In addition, we find that credit offers to consumers in rural areas are 5 percentage points more likely to be from fintech firms than from banks, although the effect of being located in a rural area was not significant in the main results. The percent minority and zip code median income effects are still either very small or insignificant. The effect of credit denials is now somewhat more muted, with offers to consumers with credit denials in the last 6 months around 2 percentage points more likely to be from fintech firms than from banks. These findings provide additional evidence of fintech firms’ marketing efforts in the personal loan sector and echo our main results. Overall, we find that fintech firms are significantly more likely to reach out to subprime consumers and those who have recently been denied credit, compared with traditional banks.
Machine Learning Algorithm
We rerun Models 5 and 6 from Table 3, using ML algorithms, specifically random forest and decision tree algorithms, to examine the most important factors that determine whether an offer is from fintech firms or from traditional lenders. Figure A1 (in the Appendix) shows the 10 most important factors in the model, in terms of their ability to correctly classify observations as being either fintech offers or bank offers. The ML algorithms find that the dummy variables for credit score bins have the most impact, which is in line with our logistic regression estimates. Interestingly, when credit utilization and balances are included in the model (Model 6), we find that credit utilization becomes the single-most important variable in predicting whether an offer is from a fintech lender. The bankruptcy indicator was another one of the most important variables in the ML models, typically the second-most important. This confirms the results of our logistic model, which showed a very strong positive effect of bankruptcy on determining whether an offer is from a fintech lender. Some variables were determined to be somewhat stronger predictors of an offer being from a fintech lender when using ML models, despite having very small coefficients (although still statistically significant) in the logistic models. The variables are the percentage of minorities in the zip code, the median income of the zip code, and the number of bank branches per 100,000 people in the county.
Interest Rates Offered by Fintech versus Banks versus Other Nonbanks
We perform a basic comparison of the rates offered by different types of lenders, controlling for consumer credit risk as proxied by credit score ranges. As mentioned earlier, interest rates are generally offered as a range, such as 15% (lowest rate) to 24% (highest rate).
Figure 8 (left panel) compares the rates offered by different lender types for personal loans graphically. Note that we only include personal loans in these calculations, (credit cards are excluded). Fintech firms offer the least expensive rate when considering the lowest rate — generally between 75 and 400 basis points lower than the rate offered by traditional lenders. The interest rates offered by traditional nonbank lenders are a great deal higher than that of fintechs and banks — typically many times higher, especially for subprime and near-prime consumers. The potentially lower rates offered by fintech firms, particularly to subprime consumers, indicate that fintech lenders are more willing to serve certain subprime consumers than banks — the so-called hidden prime, who have a high likelihood of repayment despite their low credit scores. Interest rate spreads (using lowest rate and highest rate) offered by different lender types (banks, fintechs, other nonbanks) controlling for consumer credit scores -- for personal loans (Left) versus mortgage loans (Right). Data source: Mintel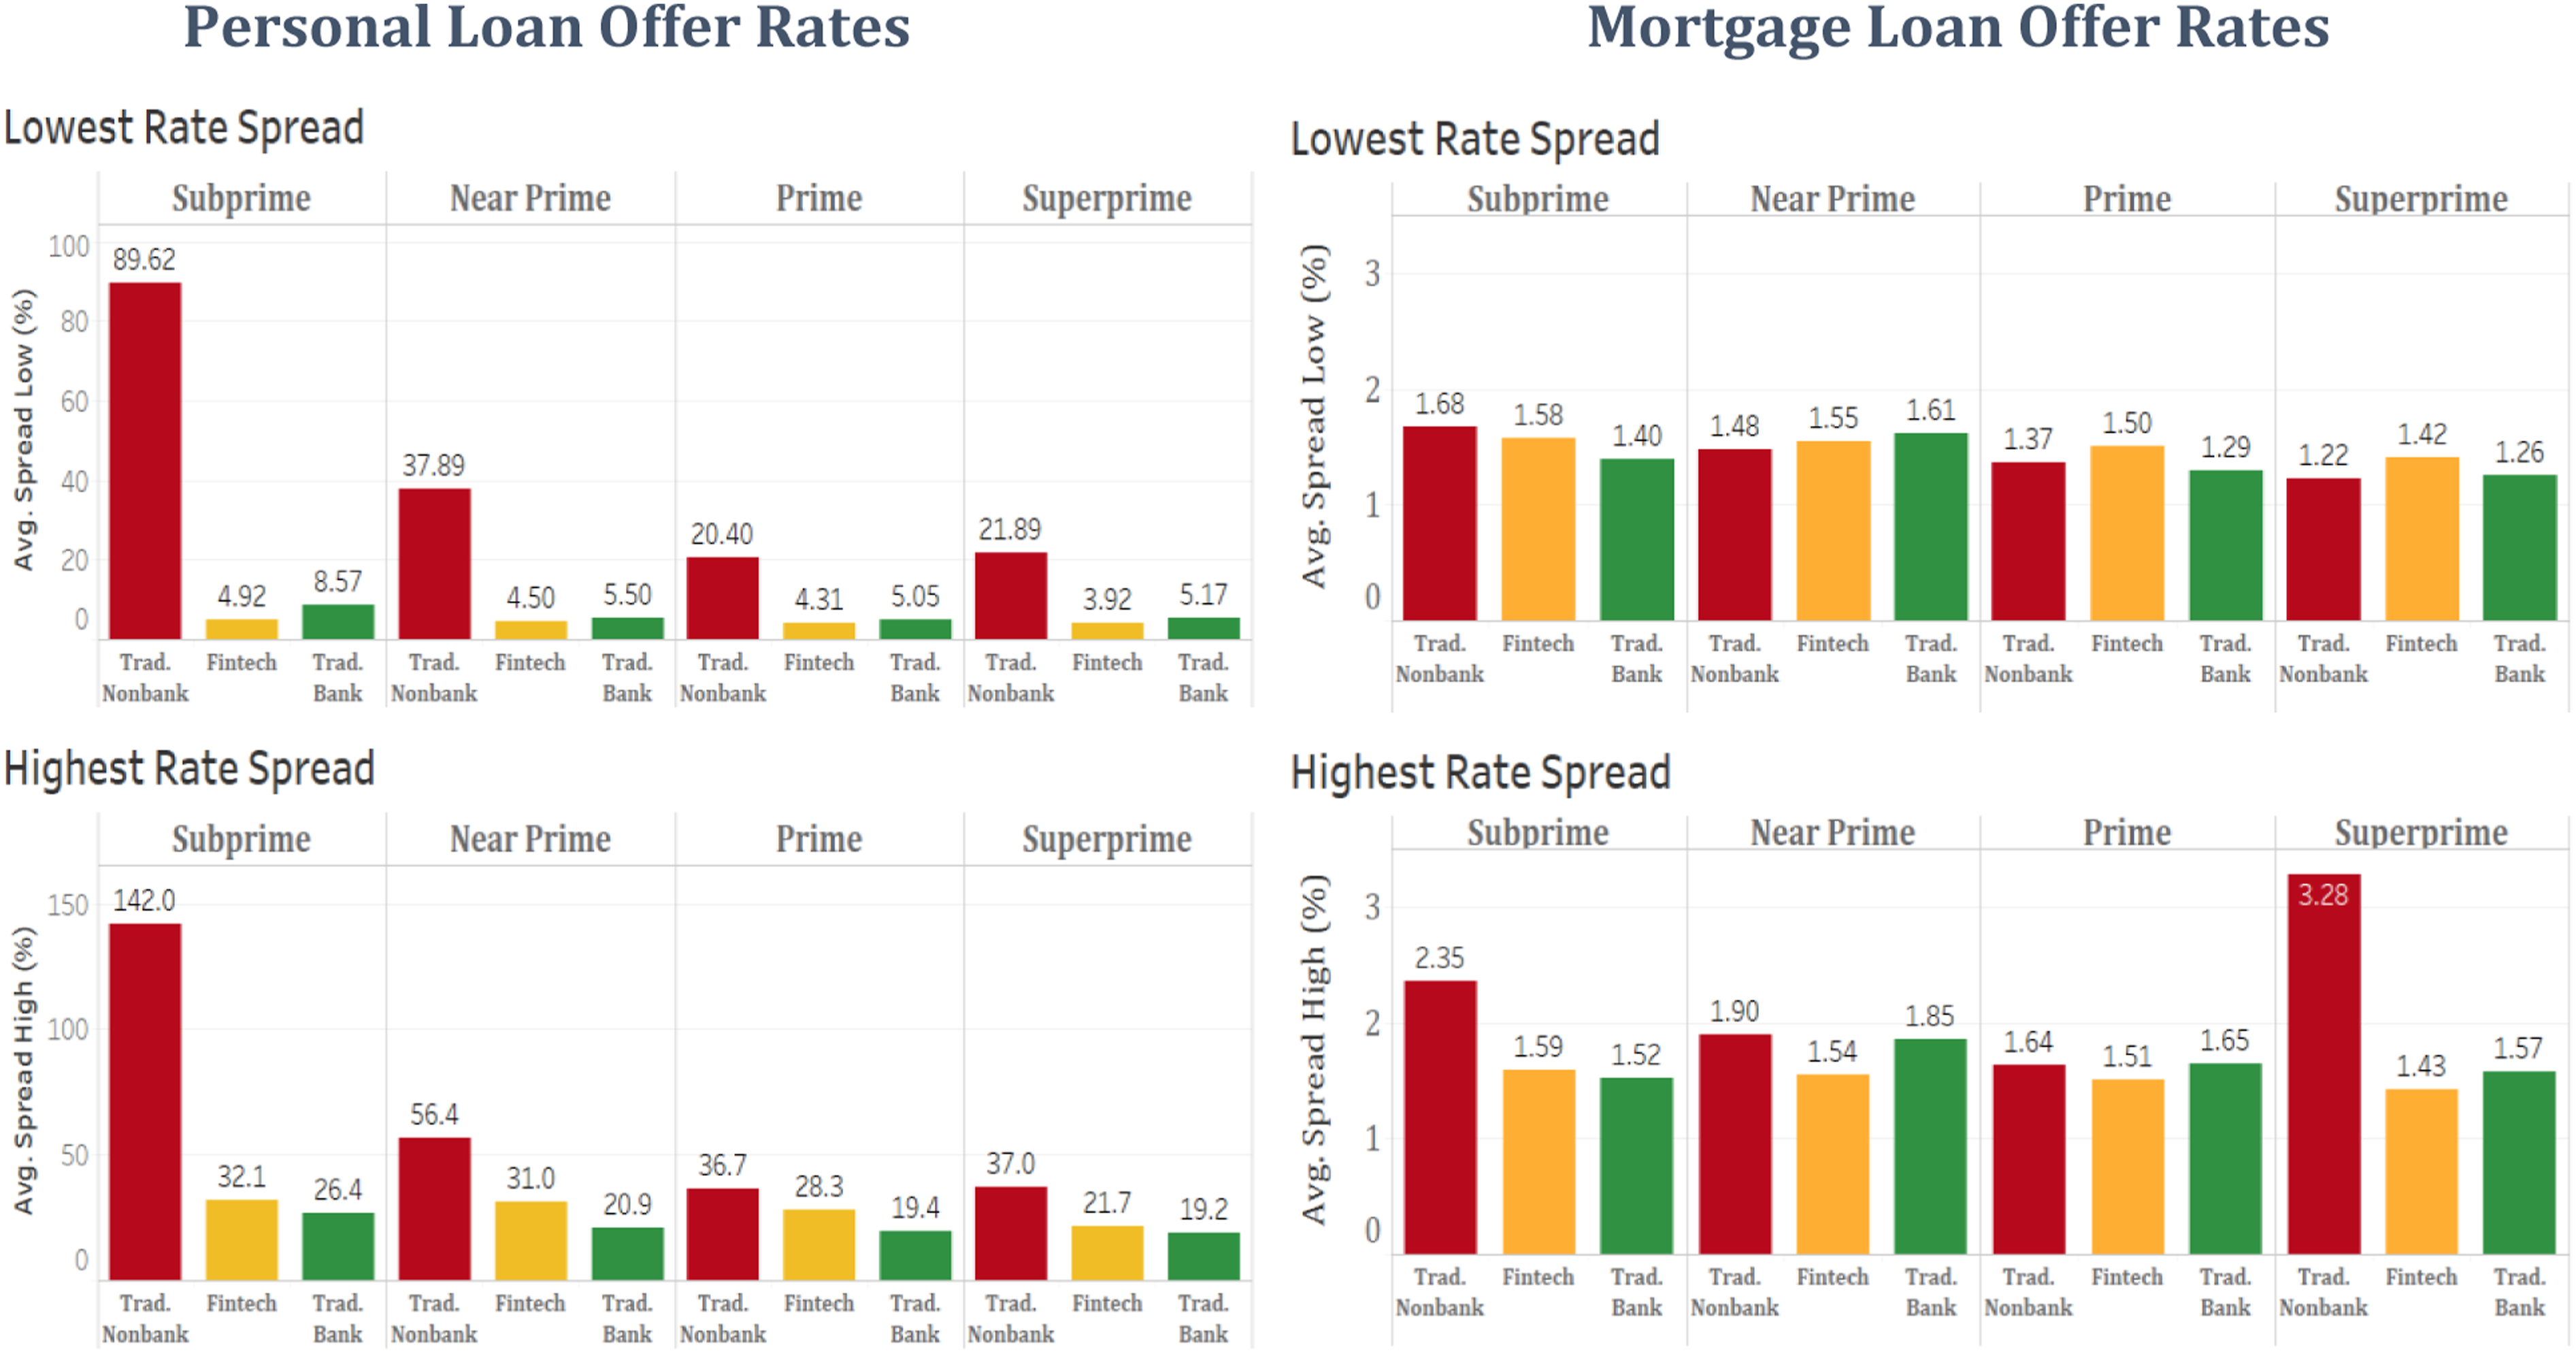
For personal loan offers, when considering the upper bound (highest) rate offered, the APR offered by fintech lenders tends to be higher than that offered by banks. In addition, the highest offered rate from other (traditional) nonbank lenders are the highest of all. Fintech firms tend to offer a rate range that is wider than that of traditional firms. This potentially indicates that fintech firms may be able to provide loans at a lower cost than traditional firm to consumers they deem as the most creditworthy but may also be reaching out to very risky borrowers that traditional banks do not serve, compensating for this risk with higher interest rates.
A regression analysis of interest rate offers (in APR) are presented in Tables A6.1 and A6.2 in the Appendix for credit card offers and for personal loan offers, respectively. The dependent variable is the highest APR offered in Column (1) and the lowest APR offered in Column (2). The analysis examines the difference in the APRs offered by banks, fintechs, and other nonbanks, controlling for basic risk characteristics that are likely to impact the APRs.
For credit card APR, when considering the Lower Bound (Lowest) of the APR offered on credit cards, fintech lenders seem to offer the lowest APR for their credit card offers, compared to banks and other nonbank lenders, after controlling for risk characteristics -- such as consumer’s credit score, income, and loan amount (credit limit for credit cards). For personal loan APR, when considering the Lower Bound of APR offered on personal loans, we find no significant difference between the APR offered by fintechs versus traditional banks. In addition, we find that the APR offered by other nonbanks are the highest rate compared to banks and fintechs, after controlling for the risk characteristics.
Empirical Results: Mortgage Loan Offers
Main Results — Logistic Regressions
A mortgage is a very different product than a personal loan, which is unsecured and generally much smaller in loan size and with a much shorter term to maturity. In addition, most mortgages qualify for federal guarantee through the GSEs. As documented in Jagtiani et al. (2021), fintech lenders have been part of the recent growth in mortgage origination in the nonbank sector. In fact, more than 80% of all FHA mortgages originated in 2018 were originated by nonbank (including fintech) lenders. We explore whether fintech lenders attempt to reach out to underserved consumers more than other types of lenders, based on their credit offers. We first compare fintech lenders with banks, and then compare fintech lenders with other nonbank lenders.
Mortgage Loan Offers — Fintechs versus Banks
We use monthly data on mortgage credit offers during the period 2015‒2018, excluding offers by traditional nonbank lenders in this analysis. The logistic regression results are presented in Table 7, and the marginal impacts are reported in Table 8.
Consumer Credit Scores
In columns 1‒4 of Table 7, the coefficients on the dummy indicators for being prime and super prime (with subprime being the base case) are significantly negative across all models from column 1‒4. The results indicate that mortgage credit offers to subprime consumers are about 15 percentage points and 8 percentage points more likely to be from a fintech firm, rather than a bank, compared with offers to super prime and prime consumers, respectively. The coefficients and the marginal impacts remain significantly negative and in rank order even when additional risk characteristics and control factors are also included in the models, as presented in columns 2‒4 of Tables 7 and 8. We find evidence that mortgage fintech lenders attempt to reach out to subprime borrowers more so than banks.
Household Income
The effect of household income is also strong. From columns 1‒4 of Table 7, the coefficients for those with income in the $25K‒$50K and $50K‒$75K brackets are significantly positive, but the coefficients for those with the highest income bracket is insignificant. Mortgage offers to the low-to moderate-income population are more likely to be from fintech lenders than from a bank. While mortgage credit offers to consumers in higher household income brackets are equally likely to be from fintech or banks, those offers sent to the low-to moderate-income bracket ($25K‒$50K) are about 5 percentage points more likely to be from a fintech firm than from a bank, compared with offers to the lowest income bracket (<$25K).
Underserved Consumers
We find evidence that fintech lenders reach out to consumers in areas where there is less access to banking services. From Table 7, the coefficients of bank branch density (number of bank branches per 100K people in the zip code) are consistently significantly negative. In addition, we find that credit inquiries and credit denial factors are also important. The coefficients of number of credit inquiries (in the past 6 months) and the coefficient for the dummy indicator for being denied credit at least once (in the past 6 months) are all significantly positive. Using the marginal impact estimated in Table 8, we find that mortgage offers to those who have been denied credit are 6 percentage points more likely to be from fintech firms than from banks. These results are consistent with Jagtiani et al. (2021), who find that mortgage loans are more likely to be originated by fintech lenders in zip codes where mortgage denial rates are higher in the previous period.
In addition, the coefficients for FHA mortgages are consistently significantly positive, indicating that mortgage offers for FHA purchases (generally a smaller loan amount and for lower-score borrowers) are more likely to be fintech offers, rather than bank offers. Mortgage credit offers associated with an FHA purchase are 40 percentage points more likely to be from a fintech lender rather than from a bank. Refinancing is another significant factor for mortgage offers, and it is controlled for in our models. Fintech lenders are likely to send offers to those who already have a mortgage to refinance at a better rate. Mortgage offers associated with refinancing are almost 48 percentage points more likely to be from a fintech firm than from a bank. 9
Overall, recipients of fintech mortgage offers are generally lower-income, subprime, have more need to access more credit (through number of inquiries), have been denied credit recently, and tend to live in areas with fewer bank branches. Fintech firms appear to be stepping in to fill this credit gap, potentially providing significant benefits to underserved consumers.
Mortgage Loan Offers — Fintechs versus Other Nonbanks
Fintech lenders appear to target a lower-income population, relative to banks and other nonbank lenders. Mortgage offers to consumers with high incomes (greater than $75,000) are 4 percentage points less likely to be from a fintech firm than from other nonbank lenders. The full results of the analysis comparing mortgage mailing offers of fintechs and traditional nonbanks are shown in Tables 9 and 10.
The results from Model 1 indicate that credit offers to low-to moderate-income consumers are around 4 percentage points more likely to be from a fintech lenders than from other nonbank lenders. We also find that credit offers from fintech firms are more likely to be for a refinance, a finding that mirrors our results in the fintech versus bank sample. Regarding credit access, fintech firms appear to be targeting consumers with limited access to credit, as evidenced by the negative coefficients on the number of accounts and total loan balances variables. Despite their efforts to reach credit-constrained consumers, fintech firms are slightly less likely (3 percentage points) to target subprime consumers than other nonbanks do. The focus of traditional nonbank lenders on subprime consumers does not come without cost, however. As shown later, they offer consistently higher interest rates to subprime consumers than fintech lenders do, highlighting that traditional nonbank lenders charge a large premium relative to both banks and fintech firms.
Robustness Testing -- Mortgage Loan Offers (Excluding Refi)
For robustness, we further test our main findings reported earlier in Tables 7‒8 (fintech vs. banks) and Tables 9‒10 (fintech vs. traditional nonbanks). Given that the majority of mortgage mail offers are for refinances rather than purchases and that consumers who already have a mortgage tend to be relatively more creditworthy, it could be argued that the results from our main analysis are not generalizable to less creditworthy populations, the very group we are interested in studying. To remedy this, we rerun our main analysis but exclude refinance offers — to focus on new purchase offers only. This allows us to isolate offers to potentially credit-constrained consumers to better understand who fintech firms are targeting within this group, as compared with banks and traditional nonbanks. The findings are shown in Tables A2 in the Appendix (for fintechs vs. banks) and Table A3 in the Appendix (for fintech vs. traditional nonbank lenders).
From Table A2, some of our earlier findings no longer hold (or less significant) in this reduced-sample regression. The point estimates for our highlighted findings are in the same direction as our main analysis, but few results remain significant, probably because of the much smaller sample size. The coefficient on the $25K‒$50K income group dummy is still positive. The credit score dummies also remain in the same direction. The bank branches concentration variable (branches per 100,000 people) is also in the same direction as our main analysis but no longer significant. The finding that fintech firms target consumers who have experienced a credit denial is still strong and significant, with offers to these consumers are 8 percentage points more likely to come from fintech firms. The finding that FHA offers are much more likely to be from fintech firms, compared with traditional banks, also remains significant and strong. These results suggest that fintech has allowed the underserved consumers to access mortgage credit and potentially has a role to play in promoting homeownership for purchase transactions by first-time homebuyers.
From Table A3, comparing fintechs to traditional nonbank lenders, the results are qualitatively similar to those in the main analysis, although few of the coefficients remain significant. The point estimates for the coefficients from this additional set of regressions are generally in the same direction as in the main analysis, indicating robustness of our main results. One should be cautious when generalizing our mortgage offer results to the wider population of credit-constrained consumers.
Additional Analysis: Machine Learning Algorithms
Again, we rerun the previous analysis (Models 1 and 4 from Table 7) using ML algorithms, specifically the random forest and the decision tree algorithms, to determine the best predictors for whether a mortgage offer is from a fintech or other lenders. Figure A2 in the Appendix shows the 10 most important variables in the model, in terms of their ability to correctly classify observations as being either fintech or traditional. The results from both the logistic and the ML models indicate that loan type indicators (refinance loan, VA, or FHA loan) are the most important determinants for whether a mortgage offer is a fintech offer. Both models also place a relatively high importance on consumer credit scores and the bank branch concentration. This gives us confidence that our logistic models accurately represent the most important factors affecting mortgage fintech mailings.
There are some notable differences between the models. Although a zip code’s median income is generally not significant in the logistic regression analysis, this variable is in the top five for importance in the decision tree and random forest models for both specifications. Similarly, zip code average Equifax Risk Score and percent minority are deemed somewhat important indicators of fintech status by the ML algorithms, but the coefficients on these variables are either small or insignificant in the logistic regression. These differing results could be due to nonlinear relationships between zip code risk score and percent minority and the probability of a mortgage offer being from a fintech firm.
Comparison of Mortgage Interest Rates Offered
Figure 8 (right panel) compares the average interest rates spreads offered by lender types. It is interesting to note that the range of mortgage rates offered by fintechs is much narrower on average than in the unsecured personal loan sector — typically within 50 basis points of each other and within 25 basis points comparing fintech versus traditional nonbanks. This may mean that fintech firms have less of an efficiency advantage in the highly complex and bureaucratic mortgage market.
Unlike in the personal loan sector, the lowest offered APRs observed for mortgage loans do not vary much across lenders. They also do not vary much across consumers in different credit score segments. For the highest offered APR, banks’ offered APR was the highest for both subprime and super-prime credit score segments. Fintech firms seem to have maintained some advantage in the subprime segment and offering lower APRs than banks do. Our regression analysis of interest rate offers (in APR) for mortgages are presented in Table 7 in the Appendix. The dependent variable is the highest APR offered in Column (1) and the lowest APR offered in Column (2). The regression results are consistent with Figure 8, which shows that there is hardly any difference in the lowest APR offered by bank, fintech, or other nonbanks regardless of consumer credit scores. The regression analysis which examines the difference in the APRs offered by banks, fintechs, and other nonbanks, controlling for basic risk characteristics that are likely to impact the APRs, show insignificant coefficients. 10
Conclusions
Our goal in this paper is to explore whether fintech firms have been reaching out to underserved consumers to expand credit access and to fill credit gaps. We focus on a few financial products: unsecured personal loans, mortgage loans, and credit cards. We identify underserved consumers or underserved communities based on their demographic characteristics, geographic locations, and other indicators of limited credit access. Consumers who are minorities, with low credit scores and low income, and those who have filed for bankruptcy may have been sidelined from mainstream finance. In addition, those who reside in a low-to moderate-income neighborhood, in rural areas, or in areas where there are few bank branches may also have limited access to credit, thus potentially being underserved.
Given the growing prominence of fintech firms in the financial landscape and their potential to improve credit access, it is important to understand the supply side of fintech lending. Our paper is among the first to focus on the supply of fintech credit, comparing fintechs with banks and other nonbank lenders. We find evidence that fintechs do reach out to certain groups of “underserved” consumers more than banks, particularly subprime consumers, and this is true for both unsecured personal lending and mortgage lending. Subprime consumers usually apply for smaller loans, which are expensive for traditional lenders to originate, thus, making it much more likely that their loan applications would be denied. Unlike traditional lenders, fintech firms do not face significant origination cost for small loans because their end-to-end loan origination system is fully digitized.
Specifically, for mortgage lending, we find that fintech firms reach out to marginalized consumers more than banks do. Among all mortgage products, FHA loans are more likely to be used by lower-income and lower-credit score consumers. We find that FHA loan offers are much more likely to be offered by fintech firms than banks. Similarly, mortgage offers to lower-income consumers ($25K‒$50K annual household income), consumers who have been denied credit in the recent past, and consumers in areas with fewer bank branches are also more likely to come from fintech lenders, as opposed to banks. Comparing fintechs with other nonbank lenders, we find that fintech firms seem to target a more credit-constrained group, specifically lower-balance and lower-income consumers. And the results in general hold even when we only consider mortgage loans for purchase transactions (excluding refinancing).
For unsecured personal lending, we find that fintech firms target lower-score consumers, those who have experienced a bankruptcy, and those with a recent credit denial, compared with banks. We also find that some consumers who might have been previously well-served (as proxied by their higher existing loan balances, higher incomes, and more credit accounts) are also likely to receive personal loan offers from fintech firms. These consumers seem to have had adequate credit access in the past but may have overextended themselves, missing a few payments or otherwise blighting their credit history and saw their credit score drop significantly.
We are also able to paint a nuanced picture of the types of consumers that fintech firms market with their direct mail. Much of our evidence points to fintechs driving credit expansion for particular groups of credit-constrained consumers — lower-income, low-score, and those with recent credit denials for mortgage credit — and consumers with low scores, large debt carried over from the past, and bankruptcy for personal loans. Taken together, our results demonstrate that fintech firms could help to expand access to credit for consumers who have difficulty accessing credit from mainstream channels.
These results may be specific to the sample used in the analysis and might not be generalized to the entire U.S. consumer population or the global population. Our analysis is based on the survey of consumers who received a mortgage or personal loan or credit card offers, implying that some of the most credit-constrained consumers may not be included in our sample. In addition, similar analysis could produce different results for the rest of the world, where banks, fintech, and other nonbank lenders play different roles in the specific regions and are subject to different regulatory environment than in the U.S. market. This presents an opportunity for potential future research to explore similar questions more broadly in international markets with different institutional contexts and credit market maturity levels. In addition, since our data and analysis also do not differentiate urgent consumer loans (for medical needs or disaster relief purposes) and non-urgent consumer loans, there are opportunities for future research to further explore the role of fintechs in fulfilling consumers’ urgent financial needs. This would be particularly interesting since AI/ML based credit decisions (at least in some countries) could potentially be made in seconds and loans could be made available within hours.
Our findings overall suggest that the rapid entry and expansion of fintech firms into the personal lending and mortgage lending space in the U.S. market have delivered potential benefits to subprime and other credit-constrained consumers. In terms of competition with traditional banks, we note that both fintechs and other nonbank lenders compete with banks in offering personal and mortgage loans without being subject to the same regulatory constraints. 11 Mester (2020) points out that existing regulatory and supervisory structures need to adapt to keep pace with the new financial landscape. Financial regulators have contemplated activity-based (if it walks like a duck and quacks like a duck, it should be treated like a duck) rather than entity-based) regulations.
Financial regulators in the U.S. have also contemplated other ways to facilitate successful integration of fintech into the traditional banks -- see Bowman (2020a, 2020b, 2021). Partnership between banks and fintechs could expedite digitization in banking and help banks to offer new products and services, expand customer base, increase portfolio diversification through a greater geographic footprint, improve operational efficiency, and enhance customer satisfaction overall. Bowman (2020b) points out that “AI is becoming more prevalent in customer service and ML can offer real opportunities to assess risk and find new customers.” Our results imply that with access to technology and better data through fintech partnerships, small banks would be in a better position to compete and more likely to identify good borrowers from the subprime pools. As a result, we would likely see more direct mail credit offers from banks to subprime consumers as well.
Supplemental Material
Supplemental Material - Which Lenders are More Likely to Reach Out to Underserved Consumers: Banks Versus Fintechs Versus Other Nonbanks?
Supplemental Material for Which Lenders are More Likely to Reach Out to Underserved Consumers: Banks Versus Fintechs Versus Other Nonbanks? by Erik Dolson and Julapa Jagtiani in Journal of Alternative Finance
Footnotes
Acknowledgements
The authors thank Drew Taylor and Andes Lee for their research assistance. William W. Lang, Joseph Hughes, Christine Cumming, Brian Knight, Beau Brunson, Mitchell Berlin, Robert Hunt, William Spaniel, participants at the FDIC Research Seminar, and the anonymous referees provided helpful comments and suggestions.
Author’s Note
Erik worked on this paper while he was a Senior Analyst at the Federal Reserve Bank of Philadelphia.
Declaration of Conflicting Interests
The author(s) declared no potential conflicts of interest with respect to the research, authorship, and/or publication of this article.
Funding
The author(s) received no financial support for the research, authorship, and/or publication of this article.
Disclaimer
The views expressed in this paper are solely those of the authors and do not necessarily reflect the views of the Federal Reserve Bank of Philadelphia or the Federal Reserve System. Any errors or omissions are the responsibility of the authors.
Supplemental Material
Supplemental material for this article is available online
Notes
Author Biographies
References
Supplementary Material
Please find the following supplemental material available below.
For Open Access articles published under a Creative Commons License, all supplemental material carries the same license as the article it is associated with.
For non-Open Access articles published, all supplemental material carries a non-exclusive license, and permission requests for re-use of supplemental material or any part of supplemental material shall be sent directly to the copyright owner as specified in the copyright notice associated with the article.