
Abstract
Households in socially marginalized settings often face disproportionate energy burdens to attain thermal comfort, driven by weak building envelopes, climatic stress, and uneven tariff structures. This study quantifies those burdens across Mexico's climatic diversity using dynamic building simulations (TRNSYS) for a non-insulated reference household at 13 locations spanning Köppen climate types. We estimate hourly heating/cooling loads, translate them into electricity use with fixed COPs (3.2 cooling; 2.8 heating), and monetize costs under location-specific CFE residential tariffs. Annual electricity consumption ranges from 3924 to 7377 kWh per household (mean 5910 kWh), with cooling accounting for ∼53% of use. Despite universal residential status, effective prices diverge markedly ($0.064–$0.182 USD/kWh), reflecting subsidy rules tied to summer temperatures rather than year-round thermal needs; colder sites incur up to 371% higher costs than heavily subsidized warm regions. Coupling energy results with state-level income data (ENIGH 2022) shows that 77% of modeled cases would require >10% of annual household income for thermal comfort, reaching 44% in extreme instances (e.g., Puerto Escondido). The work contributes a portable assessment framework that fuzes high-resolution thermal simulations with socioeconomic indicators, enabling more equitable targeting of subsidies and retrofits in climates with contrasting heating and cooling demands. Findings are broadly transferable to other countries confronting climatic heterogeneity, constrained housing quality, and subsidy misalignment.
Introduction
Air conditioning is one of the fastest-growing contributors to global energy consumption, driven by rising incomes and increasing global temperatures. Current estimates suggest that air conditioning accounts for approximately one-fifth of total electricity use in buildings worldwide (Greco et al., 2022), and in some commercial facilities, it can represent between 40% and 70% of total energy demand (Ghenai et al., 2018). The growing energy demand in the residential sector represents a critical challenge globally, particularly due to the increasing need to maintain thermal comfort in the face of more frequent and intense extreme weather events linked to climate change. Worldwide, energy consumption for residential heating and cooling has become a major factor driving both greenhouse gas emissions and economic pressure on households. The escalating frequency and severity of climate-related phenomena have intensified the energy demands associated with space conditioning, thereby raising economic burdens and exacerbating issues of energy accessibility, especially among socioeconomically vulnerable populations (van Ruijven et al., 2019). In this context (marked by high energy costs, widespread poverty, and social marginalization) meeting thermal comfort needs in homes becomes a significant challenge, posing risks to both health and overall well-being.
Energy poverty is increasingly linked to thermal discomfort, adverse health outcomes, and mortality associated with extreme temperatures, forcing many families to choose between food and maintaining adequate indoor thermal conditions (Mazzone, 2020). In recent years, rising energy costs have contributed to inflation in various countries, pushing additional households into poverty (Barrella et al., 2025; Global Energy Crisis – Topics - IEA, n.d.). Despite notable progress in expanding access to electricity globally (with 91.6% of the global population having access as of 2023 World Bank, 2023), an estimated 1.18 billion people remain in conditions of energy poverty (Min et al., 2024). This condition is often defined as the necessity to allocate a substantial share of household income to energy services. Some authors suggest a threshold of more than 10% of household income spent on energy as an indicator of energy poverty (Che et al., 2021), although alternative approaches have been proposed based on access to a broader range of energy services (Nussbaumer et al., 2012).
Robles-Bonilla and Cedano (2021) conducted a regional comparison of energy poverty in Mexico using the Multidimensional Energy Poverty Index (MEPI), incorporating the dimension of thermal comfort. MEPI, a widely used indicator originally proposed by Nussbaumer et al. (2012), does not include heating and cooling as essential energy services due to the lack of available data for their assessment (Robles-Bonilla and Cedano, 2021). However, Robles-Bonilla and Cedano concluded that when regional temperature needs for space conditioning are considered, the extent of energy poverty significantly increases, highlighting the critical role of thermal comfort in this context. In addition, Soriano-Hernández et al. (2022) examined energy poverty in Mexico using affordability and accessibility metrics. Using 2014 data, they estimated that 61.3% of the population experiences energy poverty; moreover, 38.84% of households face access constraints to meet all energy needs, 34% struggle with affordability of energy services, and 11.54% encounter both issues. Cervantes and Solís (2024) further argue that distributed electrical systems (especially for remote or off-grid communities) offer a practical pathway to alleviate energy poverty and reinforce consumer rights.
Similarly, Gouveia et al. (2019) proposed the Energy Poverty Vulnerability Index (EPVI), which focuses explicitly on space heating and cooling needs to map energy-scarce regions and identify priority areas for targeted interventions. This index combines socioeconomic variables with building energy efficiency characteristics to identify locations with a high probability of energy poverty. Applying this methodology to all 3092 civil parishes in Portugal, the authors demonstrated that inadequate thermal comfort (particularly related to heating) can lead to increased energy demand and pose serious health risks.
Pérez-Fargallo et al. (2020) introduced the Poverty Adaptive Degree Hourly Index, which integrates the number of inhabitants in poverty with hourly heating and cooling degree data derived using the adaptive thermal comfort limits defined by ASHRAE Standard 55-2017. This approach enabled the evaluation of energy poverty in relation to local climatic conditions. When applied to the Chilean context, the index successfully identified priority areas for implementing strategies aimed at reducing energy poverty.
In a similar vein, Castaño-Rosa et al. (2020) developed the Index of Vulnerable Homes (IVH), which effectively assesses household vulnerability to energy poverty by integrating economic, energy, and thermal comfort dimensions. This index employs the adaptive thermal comfort model defined by the UNE EN 15251:2007 standard to evaluate thermal conditions in relation to energy poverty.
The absence of thermal comfort in homes and buildings has significant implications for the health, well-being, and daily life of occupants. It can exacerbate both physical and mental health issues, reduce productivity, and diminish overall quality of life, particularly for vulnerable populations (Ormandy and Ezratty, 2016; Simões et al., 2025; Sousa et al., 2023). Valente and Gouveia (2024) highlighted that children and adolescents are especially susceptible to the impacts of energy poverty in terms of thermal comfort. Their study examined the effects of poor thermal conditions in homes and schools across Portugal, revealing that between 4.2% and 14% of students live in a state of persistent thermal discomfort, lacking adequate thermal conditions both at home and in educational settings. These findings underscore the urgency of incorporating these populations into energy-related policies and school renovation programs.
Matos et al. (2022) emphasized the link between low household income and limited energy affordability as a core indicator of energy poverty. Their findings demonstrated that retrofitting buildings and enhancing their energy performance and thermal comfort are essential strategies for reducing heating and cooling costs and, consequently, mitigating energy poverty.
Poor thermal performance in affordable housing is a major driver of energy poverty, with outcomes strongly influenced by local climate conditions, building quality, and occupant behavior. Economic crises and the intensification of urban heat island effects further exacerbate these vulnerabilities (Delgado et al., 2022; Jayalath et al., 2024). In this context, Porras-Salazar et al. (2020) investigated the correlations among thermal comfort, infrastructure quality, heating systems, energy expenditures, respiratory illnesses, and medical costs in Chile, in order to understand their collective relationship to energy poverty. Their findings revealed that one-third of the surveyed population was unable to maintain adequate thermal comfort in their homes for at least 80% of the time. Moreover, among those who managed to maintain thermal comfort for more than 90% of the required period, nearly 10% spent just under $40 USD per month (equivalent to 10% of Chile's minimum wage) on heating or cooling.
Jayalath et al. (2024) reviewed studies on thermal comfort, energy consumption, and improvement strategies in low-income housing. They concluded that poor thermal performance and widespread energy poverty in affordable homes are common across most countries. Their findings suggest that energy poverty patterns and energy efficiency practices are largely shaped by local climate conditions, the physical condition of housing stock, and specific energy use behaviors among occupants. Through a quantitative content analysis of the literature, the authors advocate for further studies focused on energy modeling, cost optimization, and life cycle analysis as essential tools for addressing energy poverty in vulnerable housing sectors.
In Mexico, several studies have examined how energy poverty and thermal comfort affect the population. Macías et al. (2023) assessed the impact of the residential electricity tariff structure (focusing on seasonal transitions linked to ambient temperature) and proposed a mathematical adjustment to lower electricity costs. Their findings indicate that energy poverty could be reduced in 166,318 households and that 9,535,367 additional users could benefit economically. Jiménez-Torres et al. (2023) analyzed, across all 32 states, how household air-conditioning needs influence energy demand, with projections to 2050 and 2100; they estimate increases of 20% and 35% in cooling-related energy consumption by those years, respectively. In a related study, Jiménez-Torres et al. (2024) evaluated how passive design measures in typical dwellings across eight southeastern states can mitigate energy poverty from a thermal-comfort perspective. They report that projected air-conditioning demand may push 70% of the analyzed population into energy poverty due to comfort requirements, while passive strategies could cut space-conditioning energy use by up to 50%, helping to alleviate this condition.
In summary, the current challenge lies in the growing economic and energy vulnerability faced by households in marginalized conditions, particularly as a result of the need to maintain thermal comfort in the face of intensifying extreme weather events and steadily rising electricity costs. Although multiple studies have examined energy poverty from multidimensional perspectives, significant knowledge gaps remain regarding the specific economic impact of thermal comfort on low-income households (especially considering the typical construction features of vulnerable dwellings, diverse climatic conditions, and the variability of electricity tariff structures).
This manuscript contributes to the state of the art by providing a detailed analysis of the economic burden associated with thermal comfort across different climatic regions of Mexico. It simultaneously evaluates the influence of electricity subsidies and regional household income levels on energy poverty. Moreover, by examining households with construction deficiencies—such as building envelopes with poor thermal performance—we show that these communities are more exposed to climatic conditions and their impacts on thermal comfort, not only in terms of cooling needs but also heating demands in colder regions. Furthermore, the energy requirements for space conditioning in these locations are assessed comprehensively, without imposing economic constraints that would underestimate the actual energy needed. The analysis also incorporates the state-level average monthly income reported by National Survey of Household Income and Expenditure (ENIGH) to contrast the direct cost of thermal comfort with households’ ability to pay and to benchmark across regions with different income levels and energy needs. Taken together, these three dimensions have received limited attention in the literature, particularly in Mexico, a country that combines pronounced climatic diversity with marked regional income disparities. This integrated perspective allows for the identification of critical areas where current energy policies prove insufficient or inequitable, underscoring the urgent need for targeted and context-sensitive interventions.
The remainder of this article is structured as follows: the methodology section describes the process used to select the study locations, outlines the construction characteristics of the reference housing model, and details the energy-economic framework employed, including dynamic simulations performed using TRNSYS software. The results section presents a quantitative analysis of thermal loads, annual electricity consumption, and associated costs for heating and cooling across each region and evaluates their economic impact relative to average household income. Finally, the discussion section interprets these findings within the context of energy poverty, highlighting implications for public policy and identifying opportunities for future research.
Methodology
The methodology of this study comprises four main components. The first involves the selection of study locations with distinct climatic conditions, based on the Köppen climate classification system as applied to Mexico, and ensuring a variety of residential electricity tariffs. The second component focuses on the development of an architectural model of a representative dwelling, including a detailed description of its construction features. The third part outlines the thermo-energy and economic modeling approach. Finally, the fourth component describes the simulation process used to obtain the results.
Selection of study locations based on the Köppen climate classification
According to the Köppen climate classification (Köppen-Geiger Explorer, 2025), Mexico exhibits a broad diversity of climates, grouped into four main categories: A (tropical), B (dry), C (temperate), and E (polar). These are further subdivided into 15 climate types: Af, Am, Aw, BWh, BSh, BWk, BSk, Cfa, Cwa, Csa, Csb, Cwb, Cfb, Cwc, and EF (highlighting the country's climatic richness). Table 1 presents the selected study locations, along with their climate classifications and specific characteristics.
Study sites with their characteristics and Köppen climate classification.
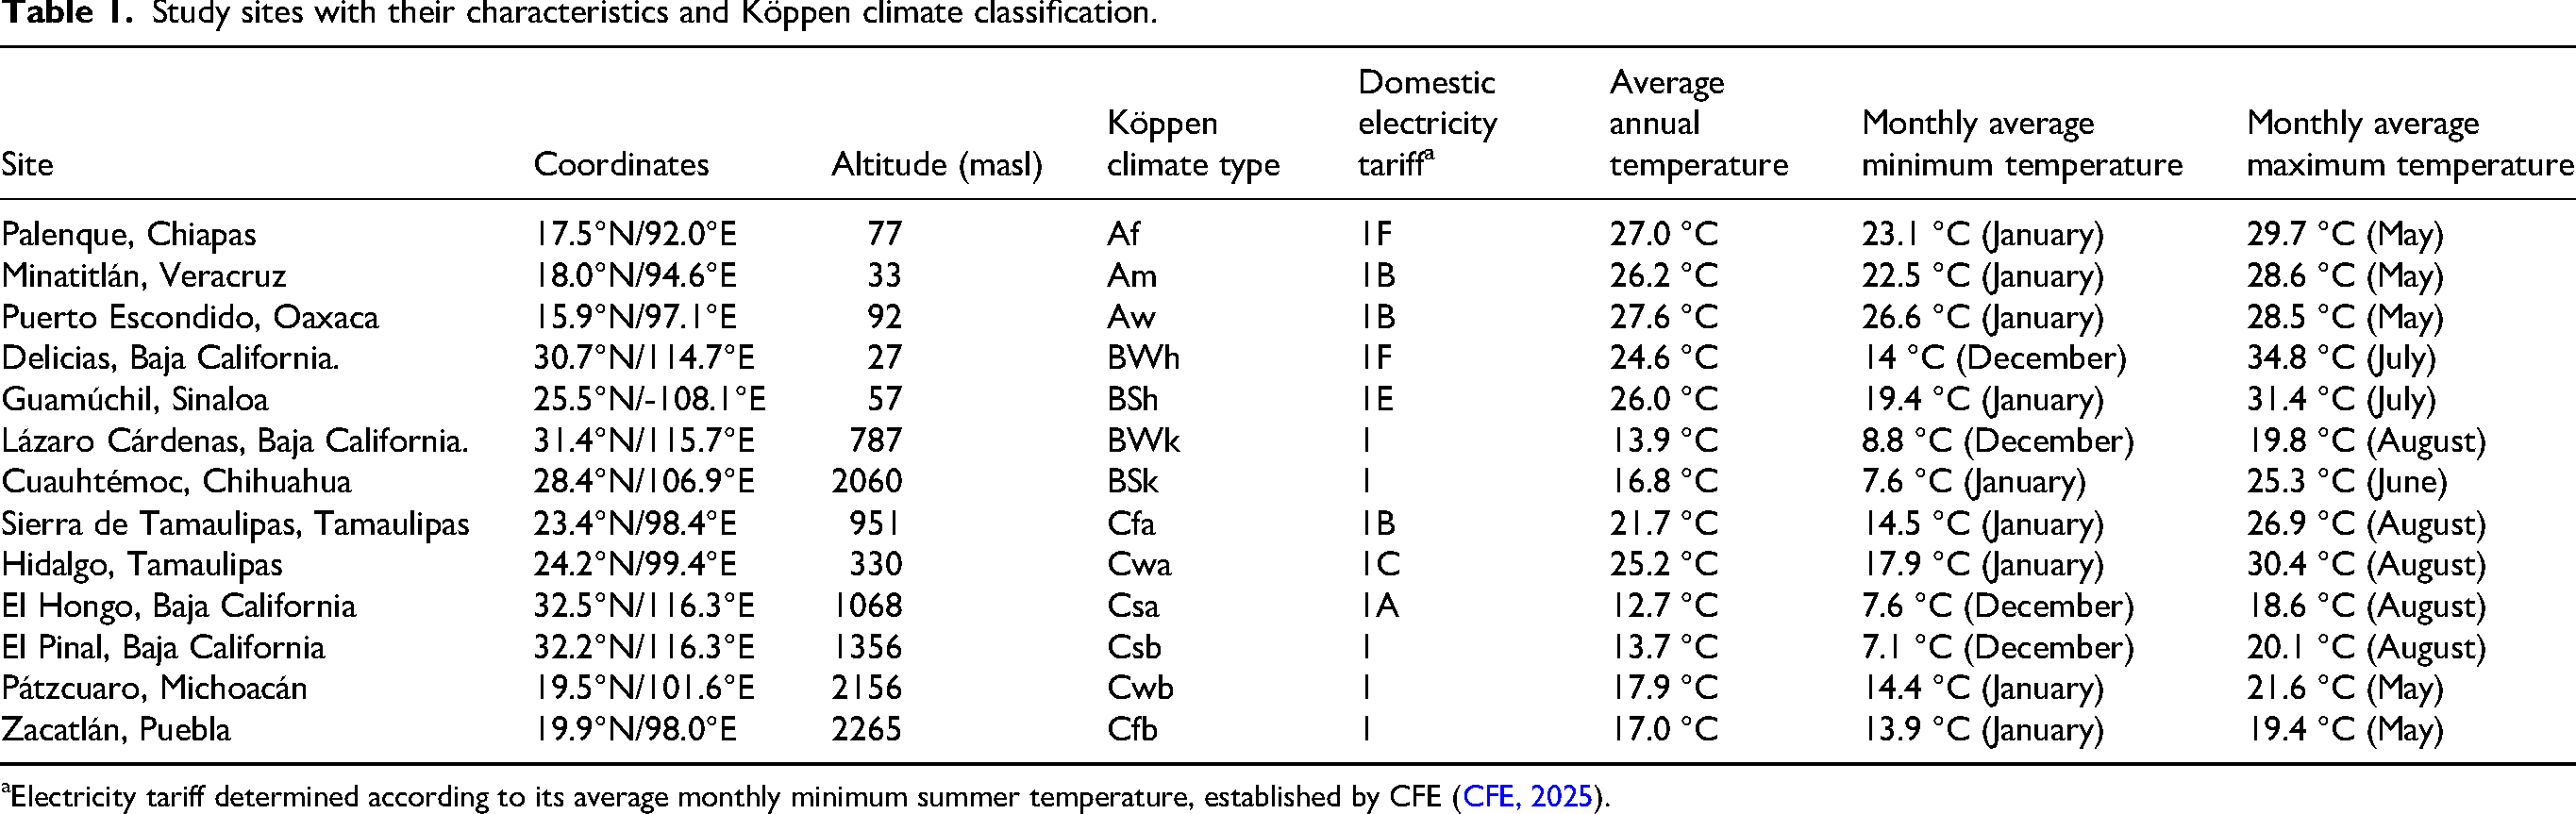
Electricity tariff determined according to its average monthly minimum summer temperature, established by CFE (CFE, 2025).
The climate types Cwc and EF were excluded from the analysis, as they occur only in unpopulated or sparsely populated volcanic areas and are not representative of typical residential conditions. The selected locations are distributed throughout the country and reflect a wide range of ambient temperature profiles throughout the year. Climatic data for each site were obtained using Meteonorm software (Meteonorm, 2025) which was also used to generate Typical Meteorological Year (TMY) weather files for use in the simulations. The reference historical period for the selected location corresponds to 1991–2020.
In Mexico, residential tariffs from the Federal Electricity Commission (CFE) use a tiered (block) and seasonal structure with government subsidies. In general, monthly household consumption is billed in ascending price blocks: a basic and an intermediate block with subsidized rates, followed by a higher-priced excess block. In warm regions, summer brings expanded subsidized blocks to mitigate cooling costs, whereas this preference is reduced outside the summer period. Additionally, the High-Consumption Domestic Tariff (DAC) applies when a user exceeds a zone-specific threshold; under DAC, kWh receive no subsidy, resulting in a substantially higher unit cost. Climate-based tariff assignment (1, 1A–1F) depends on local temperature thresholds and determines block sizes and subsidy levels. Overall, this design makes the effective price ($/kWh) vary across regions and seasons, and households with greater heating or cooling needs experience different degrees of economic protection. For instance, Tariff 1 applies to areas with summer monthly average minimum temperatures below 25 °C, while Tariff 1F applies to areas where this value exceeds 33 °C. In general, the higher the minimum summer temperature, the greater the electricity subsidy provided (CFE, 2025). Assignment is made by CFE at the locality/municipal level, reflecting temperature thresholds and administrative resolutions in force. Consequently, localities with similar climatic conditions can legally be billed under different tariff bands. For each study site we used the official tariff assigned to that city and the rates in force between May 2024 and April 2025, as published by CFE. Results are therefore city-specific and should not be extrapolated to entire states without verifying local assignment.
Reference housing model for comparative thermal load analysis
To establish a reference housing model for the comparative analysis of thermal loads, this study considered typical features of dwellings found in vulnerable or highly marginalized communities. Based on field visits conducted by this research group, it was observed that such homes often lack thermal insulation in their walls and roofs, primarily due to the high cost of implementation. Consequently, these dwellings are more exposed to heat gain and loss, increasing the energy required for both cooling and heating.
To ensure uniform comparison criteria for energy requirements, a single housing model was used across all study sites. Figure 1 shows the layout of the model, while Table 2 lists the construction details and material properties. The main façade, which contains the entrance door, faces west and has a surface area of 15.4 m2. It includes a window with a surface area of 4 m2 and a thickness of 0.004 m. The rear wall, oriented east, has the same surface area and an identical window. The side walls, facing north and south, each have an area of 26.2 m2 and no windows.

Dimensions of the housing model used in this study.
Construction characteristics of the reference housing model (Ríos-Arriola et al., 2024).
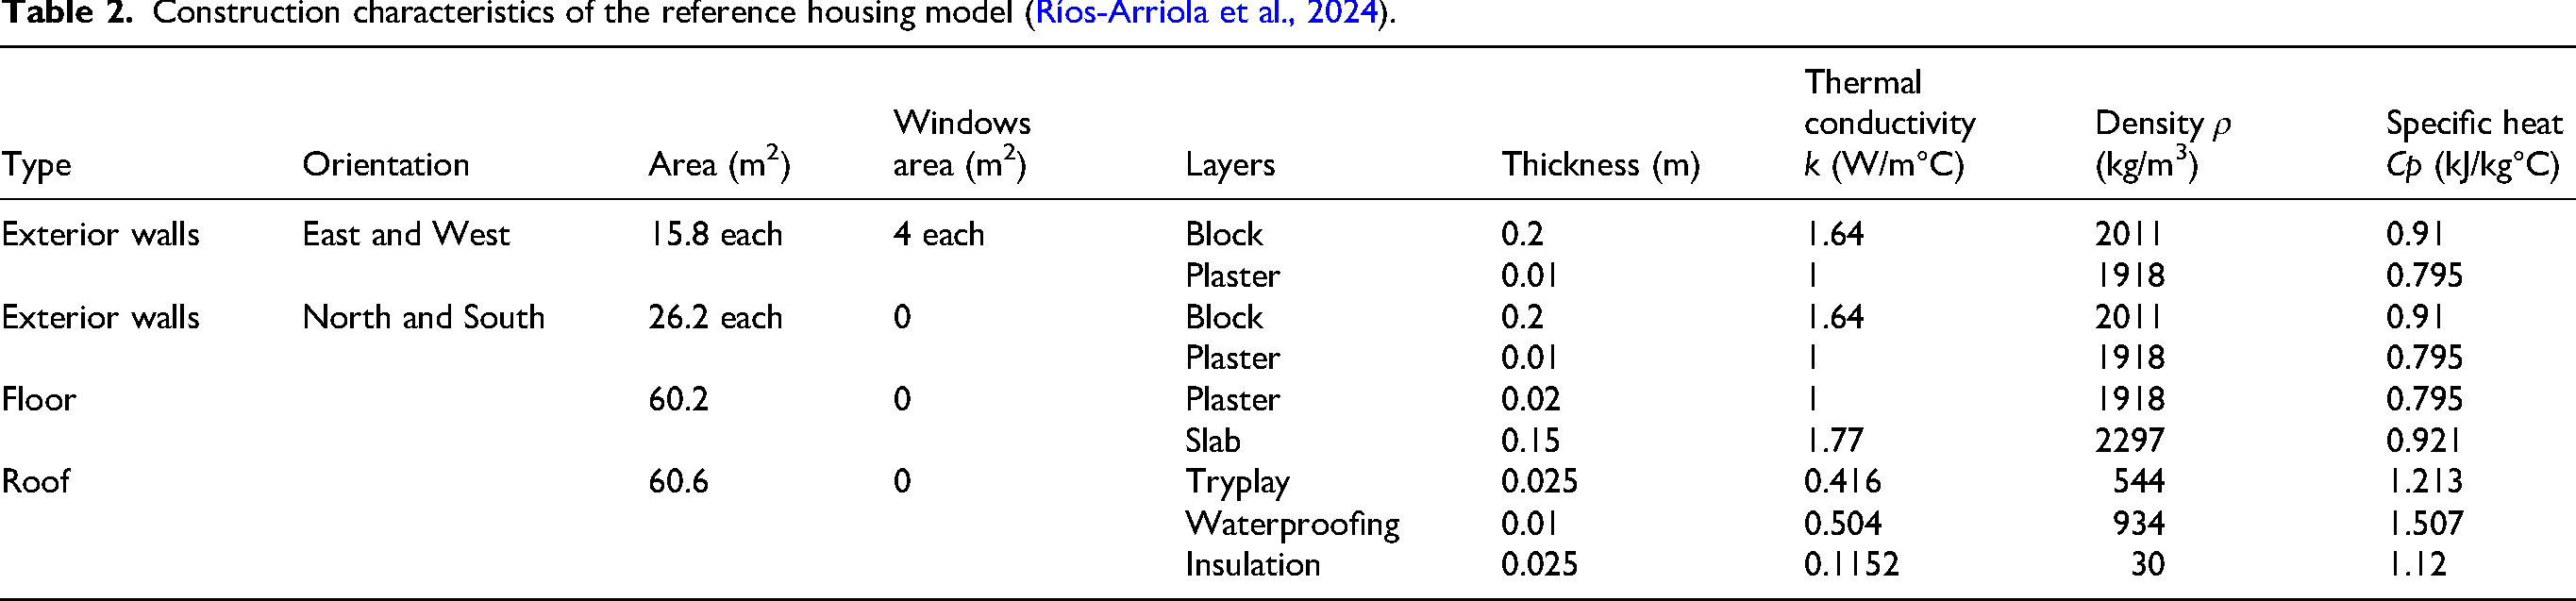
All exterior walls are composed of concrete blocks with a plaster finish and no thermal insulation. The floor spans 60.2 m2 and is built from concrete with a ceramic tile overlay. The roof covers an area of 60.6 m2 and is constructed with three layers: a waterproof membrane, plywood sheathing, and a 0.025 m-thick expanded polystyrene insulation layer. The total internal volume of the dwelling is 165.63 m3. It is important to note that, to preserve a consistent basis for comparison across locations, the orientation and construction characteristics were kept constant for all climate zones considered in this study. Likewise, other model inputs—such as ventilation, and occupancy—were held identical across all locations. Consequently, the differences observed in thermal loads arise solely from the site-specific climatic conditions (e.g., ambient temperature, solar radiation incident on the envelope, wind speed, among others).
Within the dwelling's thermal load study, the internal gains listed in Table 3 were included in the load estimation. It is worth noting that three occupants were considered, and lighting and appliance gains were applied continuously (24 h a day) across all scenarios analyzed.
Internal heat gains considered in the simulation study.

The dwelling used in this study is a reference archetype intended to support comparative analysis across climates and tariffs under harmonized assumptions. It reflects a non-insulated, small single-story envelope frequently encountered in marginalized contexts, with constant orientations, window openings, ventilation assumptions, occupancy, and comfort setpoints applied uniformly to all locations. We emphasize that this geometry is not meant to represent a unique or dominant national typology. In particular, we acknowledge that many formal social-housing units in Mexico have smaller built areas (≈40 m2) and flat roofs, and that construction practices vary by region. Our choice of a ∼60 m2 envelope, limited roof insulation, and fixed window layout provides a transparent and conservative baseline that avoids underestimating thermal exposure while enabling like-for-like comparisons. The policy-relevant findings reported here (e.g., relative cost burdens by climate/tariff and the role of tiered/seasonal blocks) derive from relative differences that are robust to reasonable variations in compactness and roof form, while precise absolute values may shift with specific local typologies.
Estimation of heating and cooling loads
The estimation of thermal energy consumption required for heating and cooling the studied dwellings was carried out using dynamic simulations in the TRNSYS software (Transient System Simulation Program) (Klein, 2015). A three-dimensional model of the reference house was first developed in SketchUp and subsequently imported into TRNSYS using the Type56 module, which is specialized for multizone building energy simulations.
To ensure thermal comfort, fixed setpoint temperatures were defined: 21 °C for heating and 26 °C for cooling, based on standard comfort ranges commonly used in the literature (ASHRAE, n.d.). The simulations incorporated the dwelling's specific construction and thermal properties, together with representative annual climate data for each Mexican region. Notably, this study estimates the annual cooling and heating loads across all locations without imposing economic constraints that might understate the energy required. In marginalized settings, households often adopt strategies to curb air-conditioning use (such as operating at setpoints that deviate from ASHRAE recommendations) to reduce expenses. Our aim, however, is to quantify the actual energy and cost requirements under comfort conditions, so that the resulting evidence can inform programs and policies designed to improve thermal comfort in vulnerable households. The mathematical model used in the Type56 module is based on a global energy balance of the building, accounting for internal convective and radiative exchanges, infiltration and ventilation losses, and both direct and indirect solar gains. The thermal response of walls and windows is calculated using the transfer function method developed by Mitalas and Stephenson (1967; Stephenson and Mitalas, 1967), which accounts for thermal inertia and variable heat transfer coefficients depending on surface and ambient air temperatures.
As output, TRNSYS provided thermal energy values in kilowatt-hours (kWht) required to maintain indoor temperatures within the specified comfort range, distinguishing between the energy to be extracted (for cooling) and the energy to be supplied (for heating).
In addition, annual Cooling Degree Hours (CDHs) and Heating Degree Hours (HDHs) were analyzed. These indicators represent the cumulative sum of the positive differences between the outdoor temperature and the respective indoor comfort setpoints (Keçebaş et al., 2024). Degree hours are effective indicators for assessing a building's potential thermal energy demand, regardless of its specific construction or the performance of its HVAC system (Bolattürk, 2008). The analysis is analogous to the commonly used degree-days approach, with the main distinction being that degree hours are based on hourly average temperatures rather than daily averages. The equations used are:
For cooling (setpoint = 26 °C):
For heating (setpoint = 21 °C):
Determination of electrical consumption and economic cost
Once the annual heating and cooling thermal loads (in kWht) were obtained, the corresponding electrical energy required to deliver these loads was calculated. The hourly electricity consumption was determined using equation (3):
To determine the total annual electricity consumption, the hourly values were summed over the entire year, as shown in equation (4):
Equations (3) and (4) thus provide the hourly and annual electrical energy consumption for cooling or heating, based on the thermal load and the assumed coefficients of performance (COP) values. For this study, a COP of 3.2 was used for cooling,
The cost of electricity for both heating and cooling services was calculated based on the specific CFE tariff applicable to each study site, as indicated in Table 1 and available on the utility provider's official website (CFE, 2025). It is important to note that residential electricity in Mexico is subsidized by the federal government according to the average ambient temperature during the summer. The higher the average summer temperature, the greater the amount of subsidized electricity provided.
However, these subsidies are designed primarily to reduce electricity expenditures related to cooling during the summer months, overlooking the economic support needed for households whose primary thermal comfort requirement is heating during the winter season.
Relationship between thermal comfort and annual household income
To quantify the economic impact of electricity consumption required to maintain thermal comfort year-round in the studied housing type, the average total current household income per state was considered. These values were obtained from the 2022 ENIGH (INEGI, 2022), published by the National Institute of Statistics and Geography (INEGI) in Mexico, which provides a comprehensive statistical overview of household income and expenditure.
The ENIGH categorizes Mexican households into deciles based on their quarterly total current income, dividing the population into ten equal groups (10% each), ranked from the lowest to the highest income. Decile I represents the 10% of households with the lowest income, while Decile X includes the 10% with the highest.
To estimate a representative income level for the marginalized communities analyzed in this study, the average quarterly income of the first three deciles was calculated and annualized for each corresponding state. This approach was selected because these strata more accurately reflect the socioeconomic conditions of households most vulnerable to energy poverty, thus avoiding the overestimation that would result from using national averages.
Additionally, to account for regional economic variability and provide a more contextualized analysis, the average quarterly household income per state was also considered and annualized. This territorial disaggregation allows for identifying substantial differences in purchasing power across states, which is essential for accurately assessing the proportion of household income required to cover energy expenditures in each region.
General considerations
The following considerations were taken into account in the development of this study:
Annual simulations were performed using hourly Typical Meteorological Year (TMY) climate data for each study site with the housing model presented in Figure 1. Heating and cooling loads were estimated considering all hours of the year, not only the summer season for cooling or the winter season for heating. The COP for both cooling and heating were assumed to be constant throughout the year. Electricity cost data correspond to the rates published between May 2024 and April 2025 (CFE, 2025).
Results
To present the results, the various study locations (classified according to the Köppen climate classification) were compared in terms of annual cooling and heating degree hours, thermal loads for cooling and heating, and the corresponding electricity consumption and costs required to achieve year-round thermal comfort. Additionally, the cost of electricity associated with maintaining thermal comfort was analyzed relative to the average total current household income in the 2022, in order to estimate the proportion of family income that must be allocated to meet these comfort needs.
Annual cooling/heating degree hours
Figure 2 presents a comparison of annual heating and cooling degree hours for 13 locations in Mexico, classified according to their Köppen climate types. A clear variability is observed across regions, driven by the country's diverse climatic conditions. Locations with predominantly warm climates (such as BWh (Delicias, Baja California), BSh (Guamúchil, Sinaloa), and Aw (Puerto Escondido, Oaxaca)) exhibit significantly higher cooling demands, as reflected in their elevated CDH, which greatly exceed their heating degree hours. Delicias has 28,200 CDH, the highest among the 13 locations studied. It exceeds Puerto Escondido, the location with the second highest CDH, by 23.9%, with 22,762 CDH per year.
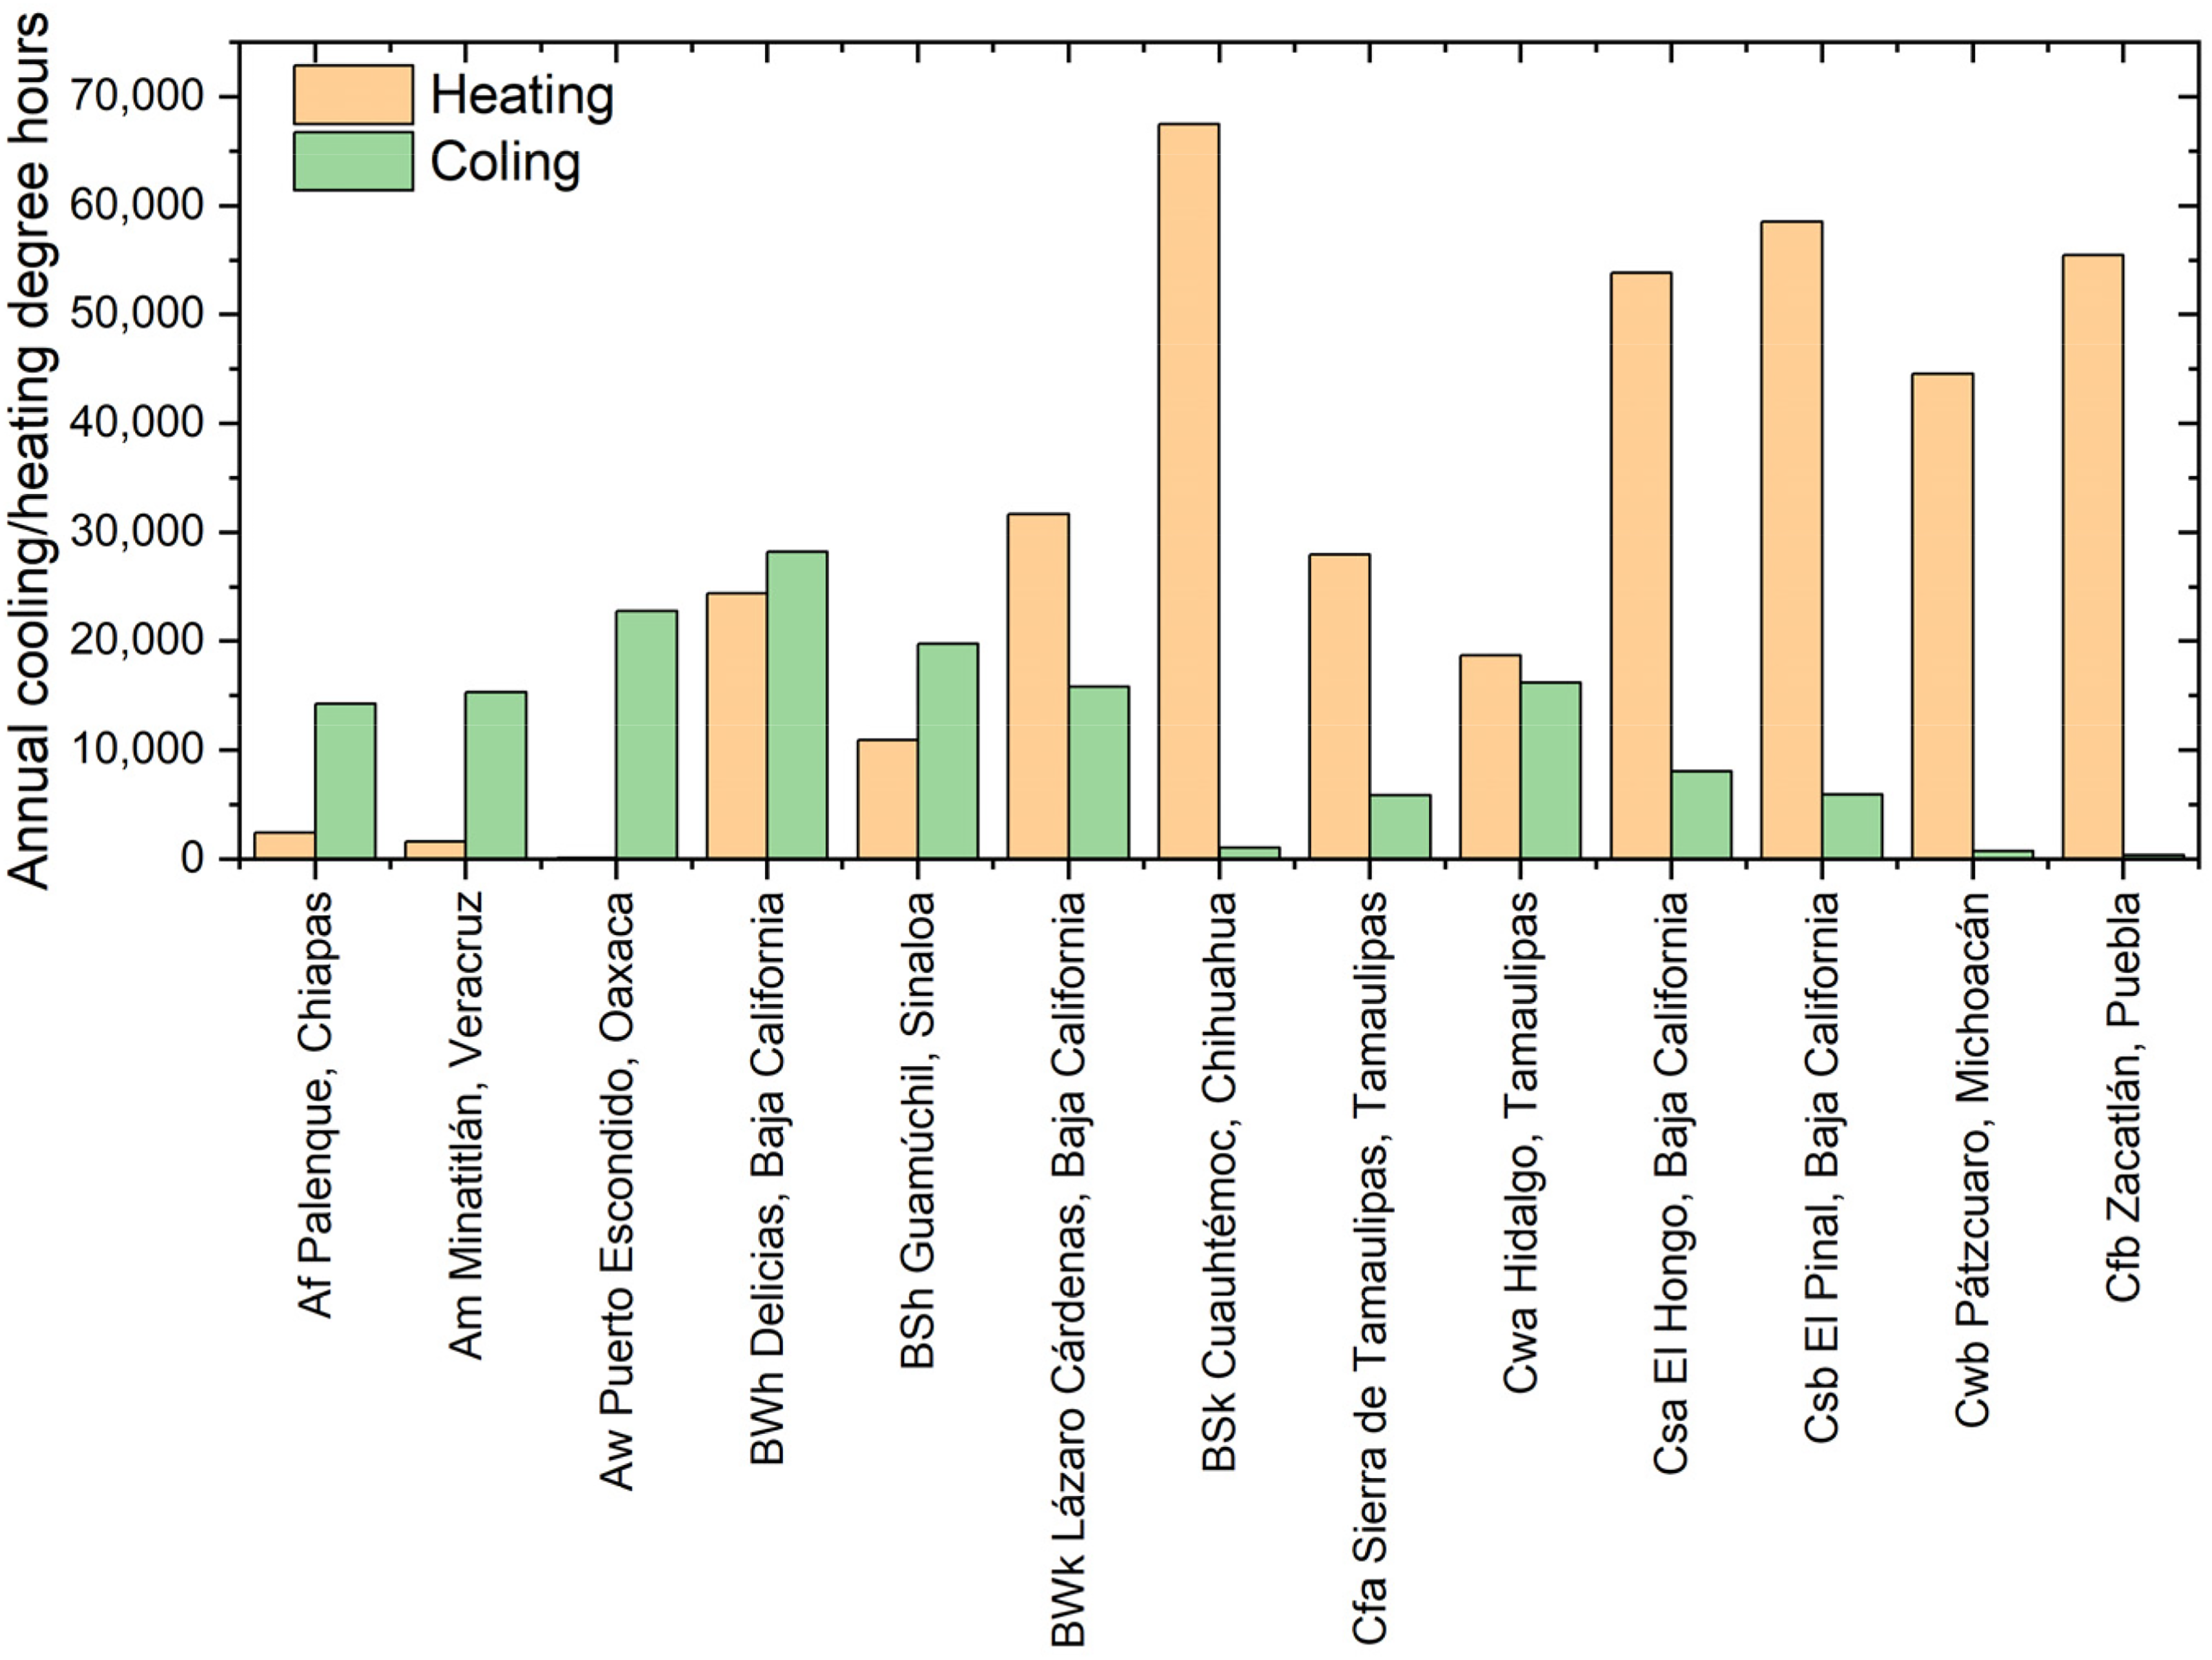
Annual cooling/heating degree hours for the study locations.
In contrast, areas classified as BSk (Cuauhtémoc, Chihuahua), Cfb (Zacatlán, Puebla), Csa (El Hongo, Baja California), and Csb (El Pinal, Baja California) display a clear predominance of HDH, indicative of cooler or temperate climates with notably cold winters, with values above 44,557 HDH.
Particularly noteworthy is the case of Cuauhtémoc, Chihuahua (BSk), which registers the highest number of HDH among all analyzed locations, con un total de 67,480 HDH, suggesting considerably colder and more prolonged winter conditions, while CDH are minimal, with 1, 077. A similar trend is observed in Zacatlán, Puebla (Cfb), and El Pinal, Baja California (Csb), with 55,464 and 58,546 HDH, respectively, where high HDH indicate a consistent thermal demand focused on space heating.
On the other hand, locations such as Palenque, Chiapas (Af), and Minatitlán, Veracruz (Am) (typically associated with humid tropical climates) show minimal heating demands but substantial cooling requirements, with 14,266 and 15,316 CDH, respectively, highlighting the prevalence of warm conditions throughout the year. It is worth noting that 8 out of the 13 studied locations exhibit higher annual HDH than CDH, reflecting a general trend in the study toward greater heating needs.
Monthly cooling/heating load
Figure 3 illustrates the monthly cooling thermal loads (in kWht) for the 13 Mexican locations included in the study, classified by their Köppen climate types. A clear monthly variability is observed, closely tied to geographic location and climatic classification. Delicias, Baja California (BWh), exhibits the highest cooling load during the warmest months of the year, reaching a peak of approximately 3960 kWht in July. This location shows a marked seasonal variation, with elevated thermal demands beginning in March and extending significantly through October, indicating a prolonged cooling season.
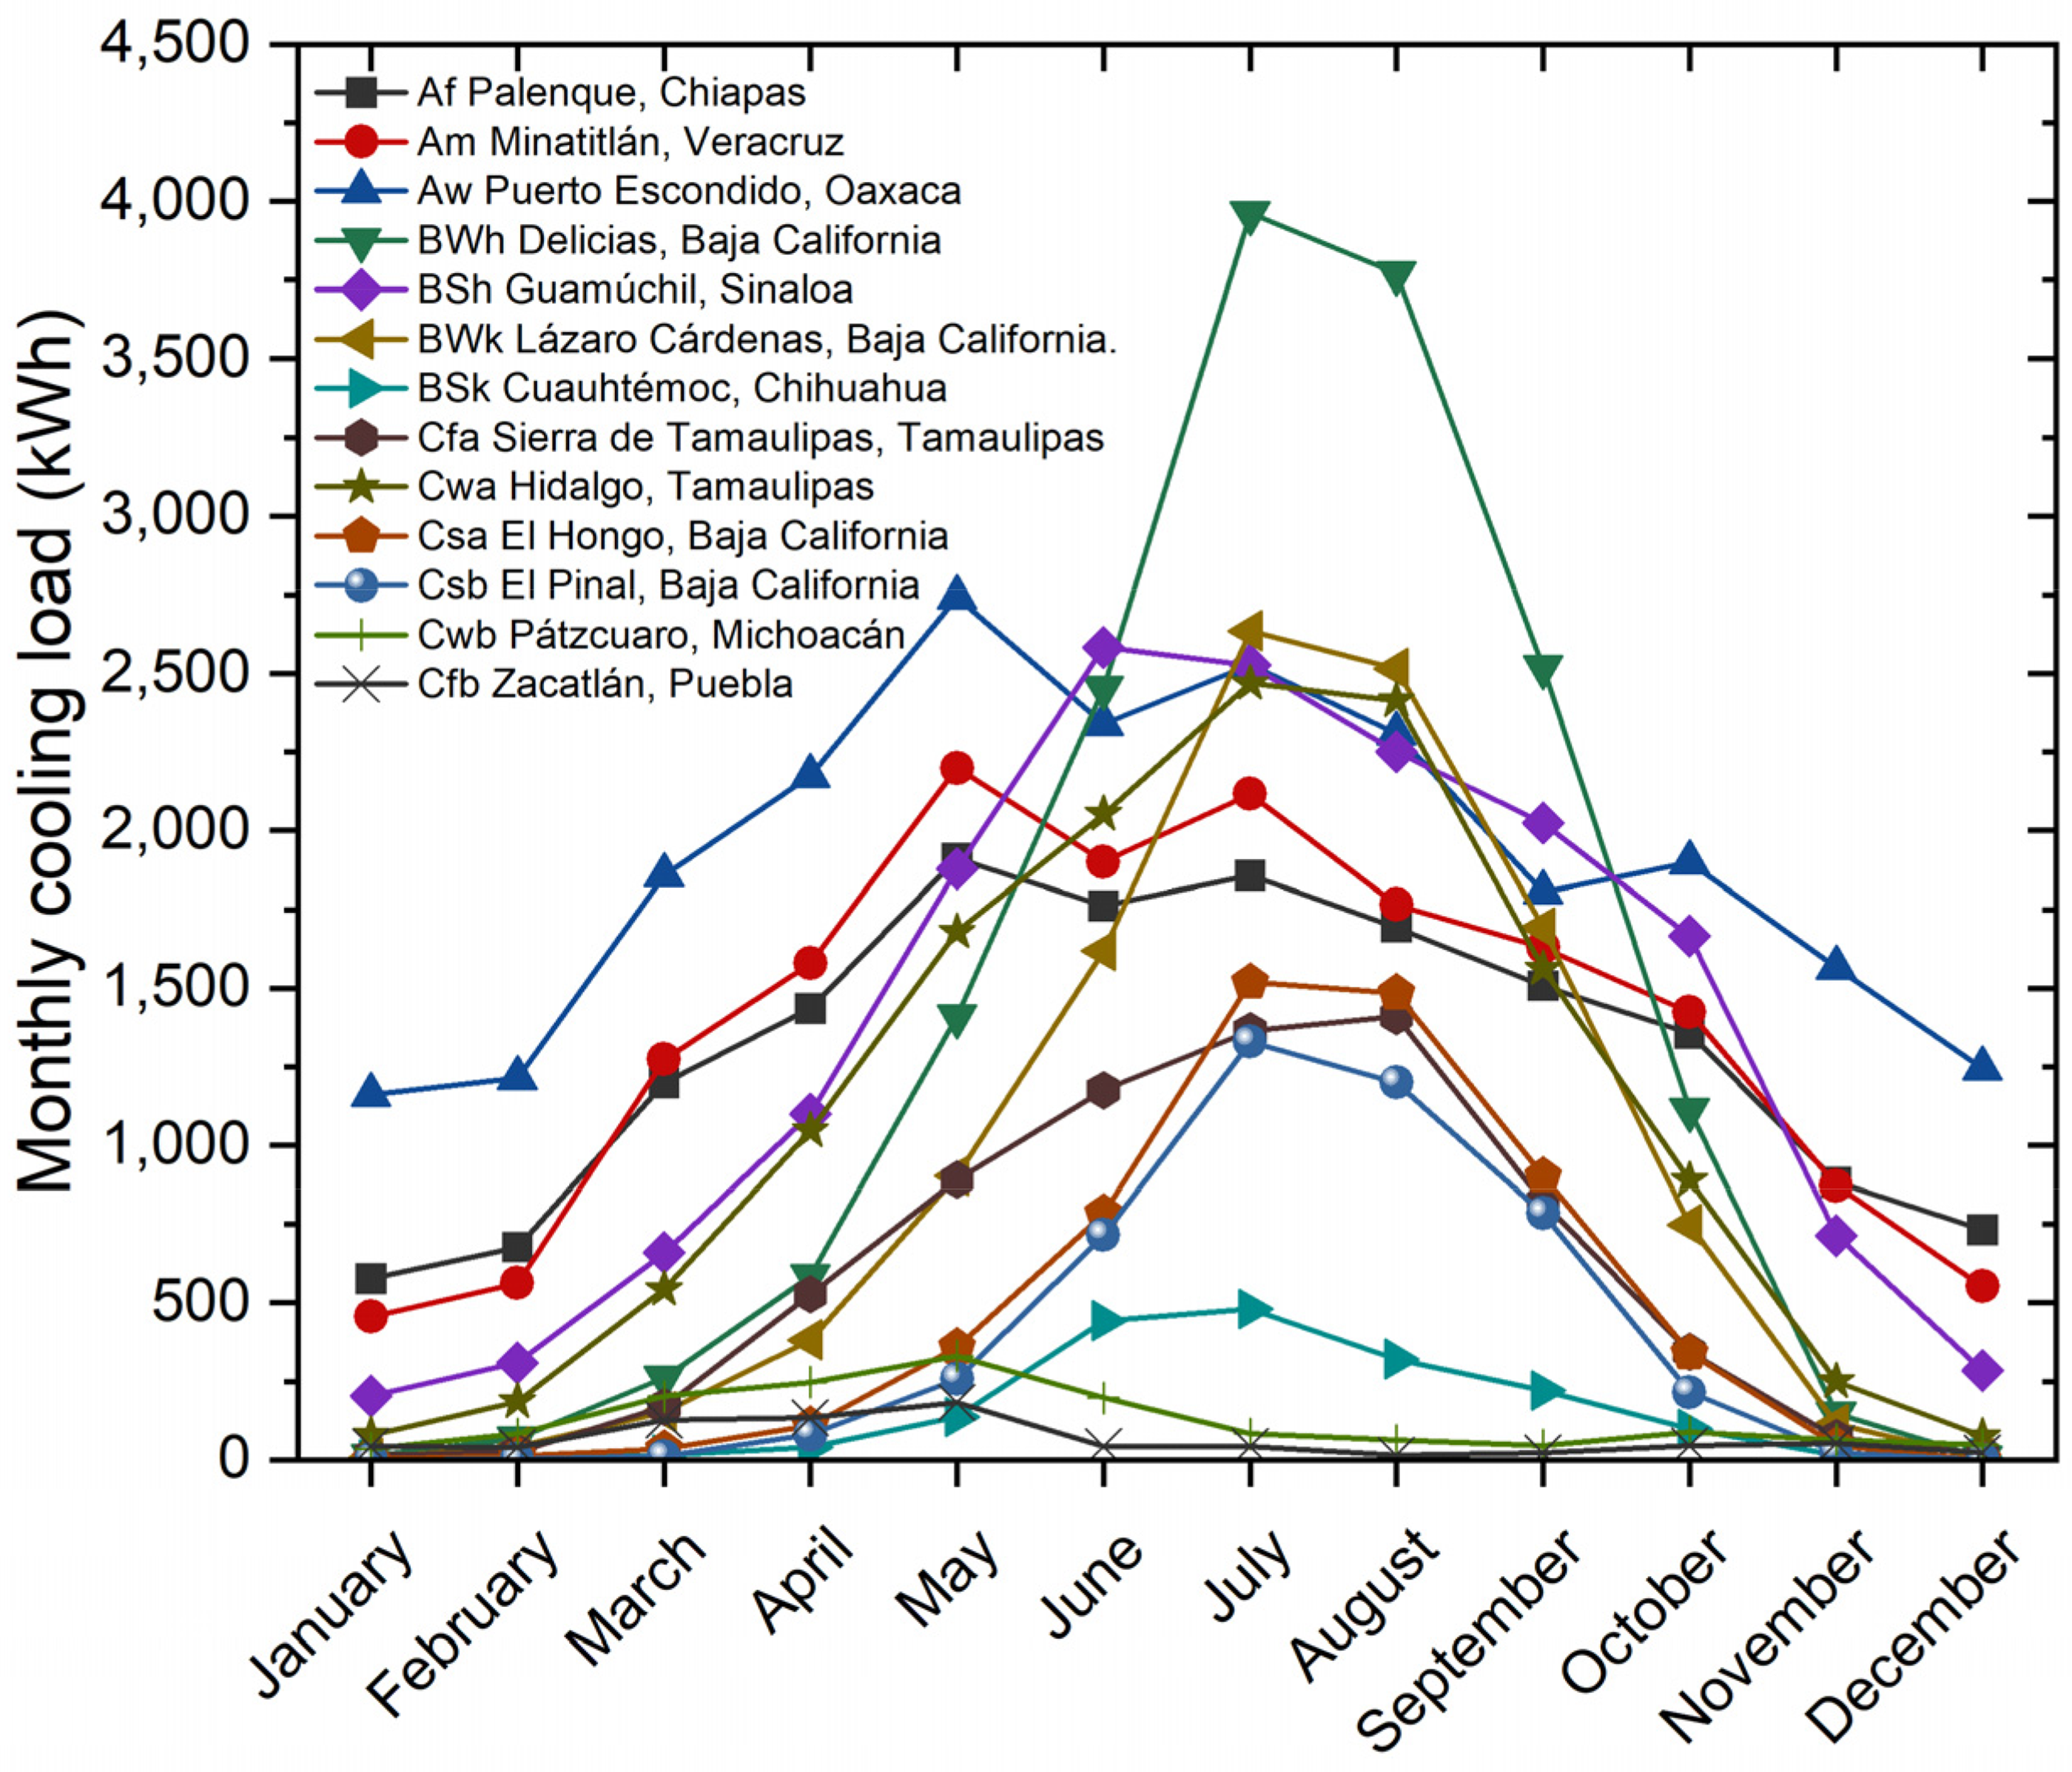
Monthly cooling load for the study locations.
Guamúchil, Sinaloa (BSh), Puerto Escondido, Oaxaca (Aw), and Lázaro Cárdenas, Baja California (BWk) follow similar patterns, with peak loads ranging between 2500 and 2750 kWht during the mid-year months. These regions show significant cooling demands from April to September, with minor differences in magnitude attributed to local temperature variations. In humid tropical areas such as Palenque, Chiapas (Af), and Minatitlán, Veracruz (Am), cooling loads remain relatively constant throughout the year, with less pronounced fluctuations and peak values between approximately 1800 and 2200 kWht from May to August. This behavior reflects a warm-humid climate with persistent thermal demand year-round.
In contrast, temperate or cooler zones such as Zacatlán, Puebla (Cfb), Pátzcuaro, Michoacán (Cwb), and Cuauhtémoc, Chihuahua (BSk), exhibit substantially lower cooling loads. Peak values rarely exceed 500 kWht during the summer months, indicating a brief warm season that does not require significant annual cooling effort. Overall, the quantified monthly thermal loads clearly illustrate how cooling energy demand varies significantly across local climates, with peak requirements generally occurring between June and August in the warmer locations (July being the most critical month in terms of cooling energy needs).
Figure 3 reveals three robust patterns. First, warm-humid climates (Af/Am) show relatively flat, year-round cooling loads with shallow seasonality. This reflects persistently high outdoor temperatures, modest diurnal swings, and sustained internal gains, which together keep indoor conditions close to (or above) the cooling setpoint across most months. Second, hot-arid climates (BWh/BSh/BWk) exhibit pronounced summer peaks, driven by high ambient temperatures, strong solar gains on low-insulation envelopes, and larger diurnal ranges that elevate daytime sensible loads; shoulder months descend more quickly than in warm-humid sites. Third, temperate/high-altitude climates (Cfa/Cwa/Csa/Csb/Cfb/Cwb/BSk) register limited cooling needs concentrated in short warm periods, with months of negligible cooling.
From a planning perspective, these profiles inform equipment sizing (e.g., peaking capacity is most critical in hot-arid locations), tariff exposure (cooling-dominant sites benefit most from expanded summer blocks), and retrofit priorities (e.g., shading/roof reflectance and solar-gain management in hot-arid zones; envelope tightening is comparatively less urgent where cooling is seasonal and short). These inferences follow directly from the monthly shapes, holding operational assumptions constant across sites.
Figure 4 shows the monthly heating loads, expressed in kWht, for the same 13 Mexican locations classified according to the Köppen climate system. It is evident that these thermal demands vary significantly with the seasonal climate patterns of each region. Cuauhtémoc, Chihuahua (BSk), El Pinal, Baja California (Csb), and El Hongo, Baja California (Csa), exhibit the highest heating loads, with peak values exceeding 3000 kWht during the coldest months (December and January). These regions are characterized by long and cold winters, with significant heating demand extending from November through March, indicating prolonged periods of indoor thermal comfort requirements.

Monthly heating load for the study locations.
Lázaro Cárdenas, Baja California (BWk), and Sierra de Tamaulipas, Tamaulipas (Cfa), also show substantial heating loads during winter, with maximum values approaching 2000 kWht, primarily concentrated in December and January. This reflects intense but shorter-duration winters with significant thermal demands over a condensed period.
Locations such as Pátzcuaro, Michoacán (Cwb), and Zacatlán, Puebla (Cfb), display a more consistent need for heating throughout the year. Even during the summer months, these locations require considerable heating energy, with minimum monthly values around 300 kWht and 580 kWht for Pátzcuaro and Zacatlán, respectively. While they do not exhibit the highest monthly heating peaks, their year-round thermal demand positions them among the locations with the highest annual heating loads. Although classified as summer months, Pátzcuaro (Cwb) and Zacatlán (Cfb) exhibit non-zero heating loads in June–August. This behavior is consistent with their high-altitude temperate climates, where nighttime and early-morning outdoor temperatures often drop below the fixed heating setpoint (21 °C). Given the reference envelope (uninsulated walls and limited roof insulation) and the uniform model assumptions across sites, Type56 yields positive hourly heating loads to preserve the indoor setpoint. Periods of reduced solar gains (cloudiness/precipitation) and elevated wind speeds further increase convective losses. Consequently, the observed ‘summer’ heating reflects diurnal temperature swings relative to the setpoint rather than a modeling artifact.
In contrast, tropical regions such as Palenque, Chiapas (Af), Minatitlán, Veracruz (Am), and Puerto Escondido, Oaxaca (Aw), show minimal heating requirements, with values close to zero throughout the year. This is consistent with their warm climates, where space heating is not a significant energy concern.
Practically, this implies that heating-dominant sites face higher exposure to weaker winter subsidies, making them priority candidates for winter lifeline blocks and envelope retrofits (insulation, airtightness) to curb sustained seasonal demand.
Annual electrical energy for cooling/heating
Figure 5 presents the annual electricity consumption required to meet the heating and cooling demands across the 13 study locations. The calculation of electrical energy use was based on the COP values defined in the methodology: 3.2 for cooling and 2.8 for heating. In locations with predominantly hot or arid climates (such as Delicias, Baja California (BWh), Puerto Escondido, Oaxaca (Aw), and Guamúchil, Sinaloa (BSh)) cooling electrical energy demand is significantly higher, with annual electrical consumption reaching or exceeding 6000 kWh. In contrast, heating energy requirements in these same locations are negligible or marginal.

Annual electrical energy for heating/cooling for the study locations.
On the other hand, regions with temperate or colder climates (such as Cuauhtémoc, Chihuahua (BSk), El Hongo, Baja California (Csa), and El Pinal, Baja California (Csb)) show considerably higher annual electrical energy consumption for heating. Cuauhtémoc stands out with values nearing 7000 kWh, while cooling demands in these regions remain relatively low. This reflects harsh winters that drive electrical energy consumption primarily toward heating, with milder summers requiring limited cooling. Transitional regions like Sierra de Tamaulipas (Cfa) and Hidalgo, Tamaulipas (Cwa), display more balanced and moderate energy demands. In these cases, annual electricity use for cooling is typically slightly higher than for heating, yet both represent meaningful contributions that must be considered in comprehensive residential energy planning.
When considering total electricity consumption for both heating and cooling, annual values range from 3924 to 7377 kWh across the locations, with an average of 5910 kWh. Pátzcuaro (Cwb), characterized by a temperate climate with dry winters, records the lowest annual electricity use for thermal comfort at 3924 kWh (of which 88.2% is for heating). In contrast, Delicias (BWh), with a hot desert climate, exhibits the highest total consumption at 7377 kWh, with 69.1% of that dedicated to cooling. Notably, Delicias consumes 88% more electricity than Pátzcuaro. Other locations such as El Pinal (Csb), El Hongo (Csa), Cuauhtémoc (BSk), and Puerto Escondido (Aw) also surpass 7000 kWh annually (between 18% and 24% above the average consumption).
Annual electricity cost
To analyze the economic impact of maintaining thermal comfort in the home, Figure 6 presents the annual electricity cost required to meet heating and cooling demands. When incorporating the economic factor, notable differences emerge compared to Figure 5. Some locations with relatively low energy consumption, such as Pátzcuaro (Cwb) and Sierra de Tamaulipas (Cfa), do not exhibit the lowest total annual costs for thermal comfort. Instead, Guamúchil (BSh) and Palenque (Af) show the lowest annual electricity expenditures for thermal comfort, at $363 and $377 USD/year, respectively (nearly all of which is attributed to cooling).

Annual cost of electric power to meet cooling and heating demand for the study locations.
Five locations (El Pinal (Csb), El Hongo (Csa), Cuauhtémoc (BSk), Lázaro Cárdenas (BWk), and Puerto Escondido (Aw)) stand out for having both high energy demands and the highest costs to meet thermal comfort needs. These sites require between 32% and 58% more financial resources than the average of $851.51 USD/year to maintain comfortable indoor conditions throughout the year.
El Pinal (Csb) registers the highest electricity cost, at $1348 USD/year (371% higher than that of Guamúchil (BSh)), with the majority of this expense attributed to heating. In contrast, Delicias (BWh) presents a notable case with an electricity cost of $632.01 USD/year, which is 26% below the average, primarily due to its dominant cooling load, as it is the location with the highest total electricity consumption.
The main factor influencing these electricity cost variations (and the discrepancy between cost and energy consumption) is the residential tariff scheme applicable in each location. As detailed in the methodology section, the cost of electricity varies across regions, even though all sites fall under domestic tariff categories. This is because the level of government subsidy depends on the region's ambient temperature conditions: the higher the average summer temperature, the greater the electricity subsidy provided. However, this subsidy is applied exclusively during summer months and is intended to mitigate cooling costs, offering little to no economic relief for households with predominant heating needs in winter.
Across the 13 studied locations, total annual thermal loads were estimated at 41,375 kWh for cooling and 35,456 kWh for heating (a 17% higher cooling load). However, in economic terms, annual electricity expenditures were estimated at $4883 USD for cooling and $6186 USD for heating, meaning that 27% more financial resources are required to meet heating demands. In interpreting the result that total heating costs exceed cooling costs, two study assumptions and one contextual factor are decisive. First, the reference COP values used throughout (2.8 for heating and 3.2 for cooling) imply that heating requires more electricity per unit of thermal energy delivered than cooling. Second, the residential tariff context in Mexico prioritizes summer cooling subsidies, so locations with heating-dominant needs tend to face higher effective unit prices during the months when heating is required. The cost gap between heating-dominant and cooling-dominant locations is reinforced by the tariff structure. Under tiered pricing, households pay a low rate for the first block of monthly consumption and progressively higher rates for additional blocks. Under seasonal blocks, hot-weather months in warm regions typically receive larger or cheaper subsidized blocks to offset cooling, while colder months in temperate/cold regions do not receive the same relief. As a result, winter heating in those regions more often spills into higher-priced tiers, raising the effective average price per kWh—even when total annual heating loads are smaller than cooling loads elsewhere.
Relationship between electricity expenditure and household income
To contextualize the economic burden of maintaining thermal comfort across the 13 locations analyzed in this study, Table 4 presents economic indicators based on average annual household income. As a complement to Figure 6, the average electricity cost (USD/kWh), calculated as the annual electricity expenditure divided by the total annual electricity consumption for cooling and heating, varies considerably by location, ranging from $0.064 to $0.182 USD/kWh. This variation highlights the differing economic impacts of operating air conditioning systems depending on the local climate: in areas where cooling needs are dominant due to high summer temperatures, electricity tends to be more affordable due to subsidies; conversely, in colder regions with a predominant demand for heating, electricity costs are significantly higher. This disparity is directly linked to the region-specific residential tariff schemes.
Economic indicators as a function of average annual household income.

Additionally, data from the ENIGH reveal substantial variation in average annual household incomes across the 13 study locations, ranging from $2797 to $7133 USD/year per household. These differences in income significantly influence the share of household income that must be allocated to thermal comfort. The most critical case is Puerto Escondido, Oaxaca (Aw), where the high electricity rate ($0.174 USD/kWh), combined with the lowest average annual household income ($2797 USD/year), results in 44.29% of the household income being required to maintain thermal comfort. This location, characterized by persistently warm temperatures throughout the year and limited energy subsidies, exemplifies the challenges low-income households face in achieving thermal comfort.
Other locations with similarly high burdens include Minatitlán, Veracruz (Am), Cuauhtémoc, Chihuahua (BSk), and Zacatlán, Puebla (Cfb), where 24.05%, 23.28%, and 21.04% of household income, respectively, would need to be spent on thermal comfort. In 77% of the locations studied, households like the one modeled would need to allocate more than 10% of their annual income to maintain thermal comfort. According to certain energy poverty indicators, this would classify these households as energy poor solely based on thermal comfort needs, without accounting for other essential energy services such as cooking, water heating, and entertainment. Interestingly, Palenque, Chiapas (Af), Delicias, Baja California (BWh), and Guamúchil, Sinaloa (BSh), despite having high electricity consumption levels, show a lower economic burden when electricity costs are compared with household incomes, with less than 10% of income required for thermal comfort.
Differences in effective $/kWh observed between warm-humid locations (e.g., Chiapas vs. neighboring states) reflect local tariff assignment, not solely climatic similarity. Because CFE assigns bands at the locality level, two places with comparable Köppen classifications may face different subsidized blocks and price levels. Our estimates adhere to the official tariff for each city, which preserves internal consistency but implies that state-level generalizations can over- or under-estimate costs where municipal assignments differ.
The above can also be analyzed from another perspective of energy poverty, such as indicator 2M. The 2M metric classifies a household as energy-poor when its observed share of energy expenditure in income exceeds twice the national median share, providing a relative, expenditure-based perspective. By contrast, our analysis prices the energy actually required to maintain thermal-comfort setpoints (21 °C heating; 26 °C cooling) and expresses that modeled cost as a share of income, using the 10% rule as an absolute benchmark. These approaches are complementary: 2M highlights households whose recorded bills are unusually high relative to national spending patterns, whereas our method can reveal suppressed demand where usage is curtailed below comfort to limit bills. Read together, they anchor both the observed and latent sides of energy poverty and reinforce our main findings regarding high-altitude heating-dominant climates and low-income warm-humid regions.
Discussion of results
The results of this study demonstrate that dwellings with typical characteristics of socially vulnerable or marginalized communities are subject to high thermal loads (both for cooling and heating) due to their poor construction quality. These homes often lack insulation materials in walls and/or roofs, which significantly increases the internal thermal load required to maintain comfort conditions, particularly under extreme climatic conditions. Consequently, the electricity consumption associated with space conditioning is substantially elevated.
Across the 13 studied locations in Mexico (selected to cover the full range of Köppen climate classifications present in the country) the electricity tariff scheme plays a crucial role in determining the cost of thermal comfort. Despite all tariffs being designated for residential use, regional differences in climatic conditions, especially average summer temperatures, significantly influence the level of government subsidies and thus the final cost of electricity. In regions where average monthly summer temperatures exceed 30 °C, the government subsidy is higher (CFE, 2025), which results in lower electricity costs despite high consumption for cooling. However, this tariff structure benefits cooling needs exclusively, neglecting the economic support for households in colder climates where heating is the primary energy requirement.
An illustrative case is Puerto Escondido, Oaxaca, which experiences consistently high temperatures throughout the year but does not qualify for significant subsidies because its average monthly summer temperature remains below 28 °C. As a result, households in this location face disproportionately high electricity costs to maintain cooling, despite their substantial year-round thermal demands.
When incorporating the local economic context (specifically the average annual household income) the findings reveal a critical energy affordability issue. In certain locations, households must allocate a substantial share of their income (up to 44%) exclusively to achieve thermal comfort. As reported in the previous section, 77% of the locations studied would require more than 10% of the annual household income to meet cooling and heating needs, while in 30% of the cases, this share exceeds 20%. This level of expenditure is unsustainable, especially for low-income families, who must prioritize essential needs such as food, healthcare, and education. As a result, many households are forced to endure extreme indoor temperatures, adversely impacting their health and quality of life.
Because housing in Mexico is heterogeneous (roof form, footprint, window-to-wall ratio, materials, and informal vs. formal construction), our archetype should be viewed as a stylized baseline rather than a census-level representative unit. Future work can expand external validity by defining families of archetypes (e.g., flat-roof 40 m2 social housing, progressive self-built units, mixed roof forms) and testing alternative window configurations and infiltration rates. These extensions would refine absolute load estimates while preserving the core comparative insights on climate-tariff-income interactions that motivate the policy recommendations.
These findings underscore the limitations of current energy subsidy policies based solely on summer temperatures. A more inclusive approach should incorporate additional variables, such as heating requirements in cold climates and average household income in marginalized communities. In policy terms, we propose a general, replicable framework that complements summer cooling subsidies with winter seasonal lifeline blocks for heating and targets assistance by household income to prioritize the most vulnerable. Resource allocation should be guided by observable criteria—the effective price ($/kWh) faced by households and annual energy use for thermal comfort—prioritizing where both indicators are high. This approach should be paired with a building-envelope retrofit program (insulation, air sealing, shading, and efficient ventilation) for households with the largest thermal loads to structurally reduce demand. To ensure effectiveness and accountability, we recommend a monitoring system based on three metrics: (i) effective $/kWh, (ii) comfort expenditure as a percentage of income, and (iii) the seasonal mix of heating and cooling loads, enabling periodic resizing of seasonal lifeline blocks and retargeting of support as conditions evolve. Finally, to avoid regressive effects, the most generous incentives should be conditioned on reasonable income and consumption thresholds and complemented with efficiency and passive strategies that do not compromise minimum comfort.
By reallocating subsidies based on comprehensive indicators of thermal demand and economic vulnerability, public policies could more effectively address energy poverty and promote equitable access to thermal comfort across diverse climatic regions.
Conclusions
This study provides a comprehensive evaluation of thermal and electrical energy consumption, as well as the associated economic costs of maintaining thermal comfort in households representative of vulnerable communities across different climatic zones in Mexico. By modeling a thermally non-insulated household (common in highly marginalized contexts) the study effectively identifies the influence of climatic conditions, electricity tariffs, and household income levels on the affordability of thermal comfort.
The results reveal a high variability in heating and cooling thermal loads depending on climate type, with significantly higher cooling demands in arid and tropical zones, and greater heating needs in temperate and cold regions. However, the deficient construction quality of these households exacerbates these demands, leading to elevated electricity consumption to achieve indoor comfort. Annual electricity usage was found to reach up to 7377 kWh per household, with average values exceeding 5900 kWh/year, of which approximately 53% is allocated to cooling.
The evaluation of electricity costs highlighted that, despite government subsidies targeted at the residential sector, electricity tariffs do not equitably reflect the thermal comfort needs across different regions of the country. While warmer regions with high subsidies experience moderate costs, areas with high heating demand and limited subsidies incur the highest expenses (up to 371% more than other locations). Moreover, the unit cost of electricity for thermal comfort varies widely, ranging from $0.064 to $0.182 USD/kWh, depending on the local tariff and the predominant energy demand (cooling or heating).
From a social perspective, the analysis of the relationship between electricity expenses and average household income reveals a pressing issue of energy inequity. In 77% of the cases analyzed, households would need to allocate more than 10% of their annual income solely for thermal comfort, which, according to several international criteria, constitutes a condition of energy poverty. A particularly critical case is Puerto Escondido, Oaxaca, where up to 44.29% of household income would be required to maintain thermal comfort throughout the year.
These results advance literature in three ways. First, they integrate high-resolution building simulations with observed tariff structures to quantify how tiered/seasonal pricing shapes effective $/kWh and total bills under uniform comfort setpoints. Second, they connect technical outcomes to socioeconomic exposure by using state-level income data to estimate the share of income devoted to comfort. Third, they translate quantified burdens into a policy framework that is general and transferable: complement summer cooling subsidies with winter seasonal lifeline blocks for heating; target assistance by household income; prioritize support where effective prices and/or annual comfort use are high; and pair subsidies with building-envelope retrofits (insulation, air sealing, shading, efficient ventilation) to structurally curb demand. A simple monitoring triad—effective $/kWh, comfort expenditure as a share of income, and the seasonal mix of loads—can guide periodic resizing of lifeline blocks and retargeting of support while avoiding regressive effects. Taken together, these contributions provide a replicable pathway to make subsidy design and retrofit programs more equitable in countries facing climatic diversity, constrained housing quality, and uneven affordability.
Building on these findings, several extensions can strengthen the evidence base and policy relevance: sensitivity analyses of COPs, setpoints, and envelope upgrades to quantify marginal cost and income-share reductions; dynamic tariff scenarios that explicitly model lifeline resizing for winter heating and income-indexed quantities; finer income granularity (household-level or sub-state) and distributional metrics to assess equity impacts; and empirical validation through monitored pilots that couple targeted subsidies with envelope retrofits, tracking ex-post bill relief and comfort outcomes. These extensions would enhance the forward-looking perspective of this work and support evidence-based design of equitable, climate-aware energy policies.
Thermal comfort is a critical but often underrepresented factor in energy poverty assessment. Including it in measurement tools reveals higher levels of deprivation and highlights the need for targeted interventions. Addressing energy poverty through the lens of thermal comfort can improve health, well-being, and social equity, especially for vulnerable groups and in diverse climatic contexts.
Footnotes
Acknowledgments
The authors of this work would like to thank the Secretariat of Science, Humanities, Technology, and Innovation for its support through project PEE-2025-G-39 of the Call for Scientific and Humanistic Research Projects in Strategic Areas 2025. We also acknowledge the support provided by the Autonomous University of Baja California through internal project 111/4106.
Funding
The authors received no financial support for the research, authorship, and/or publication of this article.
Declaration of conflicting interests
The authors declared no potential conflicts of interest with respect to the research, authorship, and/or publication of this article.
Declaration of generative AI and AI-assisted technologies in the writing process
During the preparation of this work the author(s) used ChatGPT in order to improve language and readability. After using this tool/service, the author(s) reviewed and edited the content as needed and take(s) full responsibility for the content of the publication.