
Abstract
Hospitals are energy-intensive buildings, but they also have potential for applying strategies for solar energy use (SSEU), such as photovoltaic systems (PVS) and/or solar thermal systems (STS). However, existing regulations and incentive schemes rarely consider the specific conditions of healthcare networks, where centralized management, heterogeneous building typologies, and strict sanitary requirements shape energy use. This study proposes a general and adaptable framework to guide the implementation of SSEU in hospital networks. The framework includes the selection of hospital facilities, definition of objectives, diagnosis of current energy and sanitary conditions, assessment of existing systems, formulation of SSEU, and evaluation of energy, environmental, and economic impacts. The methodology is applied to the provincial hospital network of the Micro-Region Gran La Plata (Buenos Aires, Argentina), focusing on replacing natural gas consumption for domestic hot water (DHW) with STS. The analysis incorporates architectural and operational data, DHW demand estimation, theoretical performance of STS using the F-Chart method, and a simplified economic evaluation. Three goals guide the assessment: compliance with WHO recommendations for Legionella prevention, a 27% reduction in GHG emissions, and economic viability. Results show that two strategies combining STS with existing or efficient water heating systems meet the proposed objectives. The study highlights that low natural gas prices and high upfront costs of STS remain major barriers, suggesting the need for targeted subsidies and policy instruments. The proposed framework provides a replicable tool for decision-makers to design energy transition policies in healthcare infrastructure and to promote the broader adoption of renewable energy in public buildings.
Introduction
Due to the current energy and climate context, agendas have been drawn up by international organizations, in which country leaders have committed, among other objectives, to reducing greenhouse gases (GHG) emissions (González Ríos, 2023). The construction sector is responsible for 30–40% of energy consumption in developed countries (Tan et al., 2025), whose building stock is expected to double by 2060 (Sepúlveda, 2023). In this regard, decarbonization practices have been initiated in buildings, which derive from policies aimed at reducing GHG emissions. Thus, the replacement of highly polluting sources (oil, coal, and gas) with renewable ones (solar, wind, and biomass) can offer 90% of the CO2 reductions required by 2050 (IRENA, 2025). The most prominent technologies currently available for installation in buildings are solar thermal systems (STS), photovoltaic systems (PVS), small wind turbines, geothermal heat exchangers, biomass technologies, and micro-hydroelectric power plants (Aljashaami et al., 2024).
In the field of construction, it is common to apply strategies for solar energy use (SSEU). The architects and engineers integrate PVS (Haghighi et al., 2021) and STS (Wei & Skye, 2021) in design of buildings. This resource provides them with, in addition to contributing to formal aspects, the replacement of energy from fossil fuels and the reduction of GHG. Usually, building-integrated solar systems are used as an auxiliary energy source to supplement electricity and heating consumption. Therefore, significant savings can be achieved by combining SSEU with other efficient building systems (Li et al., 2022).
Hospitals are energy-intensive buildings (Blažević et al., 2025), which is explained by the nature of their operation. Certain hospital areas operate 24/7, 365 days a year (Gaspari et al., 2019), and also remain under strict hygrothermal and aseptic conditions, especially those corresponding to critical care. Another particularity of hospital facilities lies in the period of their construction. Currently, there are hospitals that were built before the twentieth century, a time when architectural design was not conditioned by the context of energy crisis and technologies for efficient operation were not available. Therefore, from the genesis of the project, several healthcare buildings have been conditioned in terms of energy performance (Basualdo & Czajkowski, 2018).
In relation to the above, it can be observed that hospital buildings usually have a considerable space area for the incorporation of technologies such as PVS and/or STS to transform solar energy into secondary energy (electrical) and usable energy (thermal), which allows hospitals to be characterized as potential buildings for the application of SSEU. Previous studies have demonstrated the versatility for installing PVS on various surfaces of hospital buildings, as well as in parking lots (Kassem et al., 2021). In addition, STS can be installed on horizontal surfaces such as roofs and eaves (Atienza-Márquez et al., 2022, 2024; Fondoso Ossola et al., 2023).
Despite the potential seen by hospital facilities and the need to take advantage of SSEU, there are few mechanisms in place to develop policies that facilitate its implementation. In terms of PVS in urban areas, in many countries there are incentives from the State for concessionary companies to incorporate smart grids for distributed generation. In this way, buildings would be efficiently integrated into the electricity system, both as consumers and prosumers (Alonso-Frank & Michaux, 2022). As for STS, lines of credit have been made available through public banks to facilitate their acquisition by homeowners (Arraña et al., 2022). These examples show clear policies and incentives for the incorporation of renewable energies in buildings, but without discriminating between types of buildings.
Currently, there are several initiatives for the development of sustainable hospitals (both existing and new ones). The study of Hernandez Palma et al. (2022) analyses energy projects in healthcare service in different countries. First, the authors reflect on the current state of healthcare facilities. Hospitals and healthcare centers are undergoing a process of adaptation and seeking to implement measures to generate more sustainable responses, including the replacement of polluting energy sources with renewable ones. This study also lists exemplary and successful individual cases but, in order to scale up these results, measures are needed to enable mass adoption in healthcare facilities.
Hospital facilities provide services through a network, where a central entity manages supplies, including energy resources. According to the scale of implementation of SSEU, the investor's image may be represented by different management authorities (state authority, general managers, CEOs and hospital directors). Therefore, the incentives and conditions for implementing the SSEU will depend largely on these factors, mainly because the focus on replacing generated energy may have different interests. In the case of energy generated in private facilities, the savings obtained may be for the building itself or for others belonging to the same agency. In the case of savings achieved in public buildings, these can be allocated to the healthcare network or even to sectors not related to healthcare.
As for the installation power, hospital buildings have a particular energy profile, as is the case with peak demand and different type and intensity of uses (Alotaiby & Krenyácz, 2023; Arias & Freire, 2023), therefore an estimated number of panels and collectors must be calculated according to the requirements of these facilities. In addition, authorities related may have different objectives and targets in terms of energy consumption. The National Health Service (NHS), for example, which has a high GHG share, seeks to develop scenarios to reduce its carbon footprint through various strategies (Tennison et al., 2021). For these reasons, it is necessary to consider the particularities of the health sector when developing policies to promote the implementation of SSEU in health networks.
Based on the above, this study focuses on formulating guidelines for the incorporation of SSEU in public hospitals, which not only save energy, reduce emissions, and lower costs, but can also serve as a positive example for the entire community. Due to their visibility and social importance, these buildings have the potential to influence other urban sectors, demonstrating that it is possible to manage energy in a more responsible and sustainable manner. If these actions are successfully implemented, they could be replicated—with the necessary adjustments—in schools, public offices, residential buildings, and other infrastructure, promoting a broader and more lasting culture of energy efficiency. In this way, the aim is to promote the use of renewable energy in the health sector in order to direct and produce knowledge that can be transferred to society, raising awareness for its application in different buildings throughout a city.
Aim
The objective of this study is to develop a framework that provides guidelines for the implementation of SSEU in hospital networks. To do this, it is necessary to take into account the operational logic and specific characteristics of the energy behavior of buildings in the healthcare sector. Consequently, the potential for solar energy use in hospital facilities belonging to the same network must be considered, which can be obtained from architectural and energy data. It is also necessary to consider the savings obtained through different SSEU strategies according to a particular goal. Then, given that the analysis is conducted on an urban-regional scale, testing SSEU strategies does not require in-depth detail, but rather an approximation of results through the application of different systems for harnessing solar energy. In addition, it is expected that, according to the case, the structure developed can be adapted to take into account technological, social, and cultural aspects. Finally, it would provide a useful tool for the relevant authorities to support decision-making in both public and private entities.
Materials and methods
A general workflow for hospital networks is proposed. Based on the selection of administratively linked hospitals and a specific objective, an analysis of the potential of hospitals to use solar energy is carried out. Subsequently, annual values for total electricity consumption and annual values for consumption and requirements for domestic hot water (DHW) and heating are provided by the facility using a simplified theoretical analysis. Next, information on existing SSEU is collected. If they exist, a preliminary energy and environmental diagnosis is carried out, i.e., a theoretical analysis of the replacement of fossil energy sources with solar energy sources. If SSEU does not exist, new ones are evaluated. Subsequently, an analysis is carried out looking at energy, environmental, and economic values. Finally, it is verified whether the SSEU meets the proposed objectives. If they do not, new SSEU will be developed. On the other hand, if the objectives are met, guidelines will be drawn up. Figure 1 shows the workflow.

General workflow for developing SSEU guidelines in a healthcare network.
Case study selection and general steps
To go into detail about the methodology, it is first necessary to define the case study. This is done because the goals established for the development of guidelines vary according to the contextual conditions in terms of energy and environmental policies in the country or region. The health sector in the Micro-Region del Gran La Plata (MRGLP) is adopted as the case study. This healthcare network is in Buenos Aires Province, Argentina. In terms of solar resources, the area under study has an annual solar irradiance value equal to 4.56 kWh/m2 per day (NASA, 2018), a value comparable to those of Spain (one of the best areas in Europe in terms of solar irradiation) (Aristegui et al., 2018). Regarding its political-institutional organization, the hospital network under study is located in “Health Region XI”, one of the areas with the largest number of health buildings (Ministerio Provincial de Salud, 2020). Furthermore, the hospital facilities under study do not have any SSEU.
To apply the methodology developed, attention is focused on the use of STS to replace thermal energy in DHW. This is a key energy end-use for analysis, both in terms of the amount of energy demanded and its generation process. DHW use accounts for 8–11% in hospitals (Atienza-Márquez et al., 2022; Bawaneh et al., 2019) and 17% in natural gas consumption (Alotaiby & Krenyácz, 2023; Shen et al., 2019). This is linked to their demand in the inpatient areas, which have the largest share in terms of the amount of floor space built (Cesari et al., 2018; Fondoso Ossola et al., 2022). In this same line, it should be considered that consumption may be increased in hospital facilities that treat Legionella pneumophila (LP) by means of “pasteurizers” (Atienza-Márquez et al., 2022) or by maintaining a temperature higher than 60 °C in storage water heaters (Yáñez Parareda, 2008). LP bacteria are responsible for most cases of legionellosis, where the susceptible population is more prone to infection when exposed to high concentrations and production of water aerosols in the respirable size range (1–10 µm diameter) (Grimard-Conea et al., 2022). This group of people includes those over 50 years of age, current and former smokers, people with chronic diseases or weakened immune systems, and people with disabilities (Medina et al., 2021). Consideration of the treatment of this bacteria is relevant as its presence has been implicated in the deterioration of the respiratory condition of people more rapidly than other common germs in patients diagnosed with pneumonia (Herrera López, 2019). Based on this, the World Health Organization (WHO) (2022) recommends the following guidelines:
Maintain an appropriate concentration of biocides (e.g., chlorine) in hot tubs and completely empty and clean the entire system at least once a week. Keep hot and cold-water systems clean and maintain hot water above 50 °C (meaning it should leave the heating unit at a minimum of 60 °C) and cold water below 25 °C or, better still, 20 °C, or treat the facilities with a suitable biocide to limit bacterial growth, especially in hospitals, healthcare facilities and nursing homes.
Based on the above, the proposed goals are to comply with the requirements suggested by the WHO regarding the treatment of LP bacteria; reduce GHG emissions by 27% in DHW production (latest update from the Argentine government (Gabinete Nacional de Cambio Climático, 2021)); and propose economically viable projects.
Finally, the energy, environmental and economic results obtained from the strategies formulated are obtained for subsequent comparison with current values.
In summary, five steps are carried out for the case study. First, the healthcare network is defined based on financial dependence and scope, in the case of public networks (i). Next, the objective is determined in relation to the implementation of STS (ii). Then, an analysis of the current situation is carried out, focusing on environmental, productive-health, and architectural data (iii). The next step is to formulate strategies after verifying the existence or absence of existing STS (iv). Subsequently, theoretical calculations are made regarding the formulated strategies. It should be noted that theoretical estimates are made for both the existing situation and the formulated strategies. Finally, the results obtained in the previous step are analyzed in terms of energy consumed, GHG emissions, and the cost of DHW production (v) (Figure 2).

Workflow for the analysis of strategies to use STS and improve the performance of DHW production in a network of hospital facilities.
The following steps are then carried out after ii: Analysis of current situation, Strategies formulation and Analyze results and verification of goals.
Analysis of current situation
In this step, three types of data are collected:
Environmental Productive-sanitary Architectural
Environmental data are obtained from the analysis of urban codes, considering land use, density values and building height. To assign values the categorization by Jensen (2018) (rural, peri-urban, semi-urban or urban) is used. In this way, it is possible to estimate solar radiation losses due to building obstructions.
The productive-sanitary data, in this case, correspond to the number of beds available. Public sources such as websites of the municipalities or entities in charge of managing the selected facilities are consulted to obtain them. These correspond to beds actually installed in a hospital, regardless of their occupancy (Ministerio Nacional de Salud y Ambiente, 2005). For the case study this information was consulted in the database of the Ministerio Provincial de Salud (2020).
The architectural data corresponds to the types of roofs (sheet metal, tile or slab) and their extension, which will allow calculating the possible amount of STS to be installed. To determine the type of roof, satellite image analysis is used and, to speed up the summation of surfaces, the use of CAD programs such as AutoCAD (Autodesk, 2019) and SketchUp (Trimble, 2013). Figure 3 shows an example developed on the case study.

Example of roof type determination and surface quantification applied to the HIGA “Gral. San Martín”.
For the analysis of the existing technological situation and treatment of LP bacteria, visits and interviews were made to the hospital facilities in the network under study.
To calculate the DHW consumption of the total healthcare network, the equations are as follows (1–4).

Where EDHW (h−network) is the total annual energy consumed to produce DHW in the entire hospital network, expressed in [kWh]; E
(hospital)j
DHW
is the energy consumed by the DHW systems in a j-th hospital facility on i-th month, expressed in [kWh].

Where EDHW (hospital)j,i is the energy consumed by the DHW systems in a hospital facility j in the month i, expressed in [kWh]; QDHW i is the useful energy required to raise the water temperature from the time it enters the k-th water heater system until it leaves for use in i-th month, expressed in [kWh]; and H is the value of the efficiency of the k-th water heater system used, expressed in dimensionless value.

Where QDHW i,k is the useful energy demanded in DHW for a month i to operate a water heating system k, expressed in [kWh]; mwater k is the mass of water that a water heating system k must heat per day, expressed in [kg]; Cwater is the specific heat capacity of water, expressed in [kcal/°C*kg]; and Δt° is the difference in temperature of incoming and outgoing water.

Where mwater k is the mass of water that a water heating system k must heat per day, expressed in [kg]; nbeds j is the number of available beds in the hospital facility j, expressed in [beds]; and DHW (hospital) is the established DHW index value for hospital facilities, expressed in [kg/bed]; and nwhs j is the number of water heating systems in the hospital facility j, expressed in dimensionless value.
For the calculation of GHG emissions, conversion factors are used depending on the source used. For the case study, local sources are used. The report prepared by Lemos (2020) shows that for every kWh of electrical energy 0.486 kg CO2eq are emitted, while in the case of natural gas 1.95 kg CO2eq are emitted for every m3 of natural gas consumed.
In addition, for the provincial hospital network of the MRGLP, DHW production is from storage water heaters (natural gas), with a calorific value of 9300 kcal/m3, an efficiency value (H) corresponding to a “C” label (0.52) (Spahr, 2025) (Figure 4). Thus, the water inlet temperature values are also taken as established in the work of Navntoft et al. (2016), which vary monthly (Table 1). Finally, a value of 47 °C is adopted for DHW outflow, due to the hospital facilities under study opt to treat LP bacteria by applying biocides.

Storage water heaters located at the HIGA “San Roque” (left), the HZGA “Dr. Ricardo Gutiérrez General” (center), and the HIEAC “San Juan de Dios” (right) are shown.
Temperature of the water entering the DHW generation system.

Strategies formulation
The formulation of strategies is aimed at reducing DHW consumption through the installation of STS and improving the efficiency of water heating systems. In addition, alternatives are considered that allow treating LP bacteria by increasing the DHW temperature (70 °C) (Botejara-Antúnez et al., 2025).
For the installation of STS, the effect of technologies that transform solar energy into thermal energy (useful energy) is tested theoretically. The study does not consider details of the installation of STS, which is why the F-Chart method is chosen. Equations (5–13) are used to analyze their impact.
Where f is the annual solar fraction covered by STS, expressed in dimensionless value; QSTS i is the useful energy generated by STS in the i-th month, expressed in [kWh]; QDHW i is the energy required by DHW in the i-th month, expressed in [kWh].


Where Ea i is the energy absorbed by the STS in the month i, expressed in [kWh]; SC is the collector surface, expressed in [m2]; HT i is the monthly average daily irradiation in the month i, incident on the collector surface, expressed in [kWh/m2]; Ni is the number of days of the month i, expressed in dimensionless value; and Fr’(τα) is a dimensionless factor obtained using the equation (10).
Where η0 is the efficiency factor of the collector, it is the value of the ordinate at the origin of the performance curve, expressed in dimensionless value; and Kθ is the incidence angle modifier factor, expressed in dimensionless value.
Where Ep i is the energy lost by the STS in the month i, expressed in [kWh]; Sc is the collector surface, expressed in [m2]; FRUL is the overall collector loss coefficient, expressed in [W/m2*°C]; t°a environmental temperature, expressed in [°C]; Δt period of time considered, expressed in [seconds]; K1 is the storage correction factor, expressed in equation (12); K2 is the DHW correction factor, expressed in equation (13).
Where K1 is the storage correction factor, expressed in dimensionless value; mwater STS is the storage capacity of STS, expressed in [kg]; and Sc is the collector surface, expressed in [m2]. The ratio between mwater STS and the product of 75 kg/m2 and Sc must be between 37.5 and 300.
Where K2 is the DHW correction factor, expressed in dimensionless value; t°ac is the minimum required temperature of DHW, expressed in [°C]; t°r is the temperature of net water, expressed in [°C]; t°a is the environmental temperature, expressed in [°C].
In the provincial hospital network of the MRGLP, the installation of STS is proposed with a technology corresponding to 1 m2 tubular heat pipe collectors with a separate storage tank (0.65 kWp) (Valentin Software, 2013). According to the technology adopted, the value η0 corresponds to 0.564, the value Kθ to 1 and the value FRUL to 0,86 W/m2*°C. For all STS, an inclination of 35° and a North orientation were adopted. In addition, the number of collectors per unit roof area was determined. Testing in SketchUp software (Trimble, 2013) 1 collector/5 m2 was obtained on inclined roofs (sheet metal and tile), and 1 collector/3.12 m2 was obtained on flat roofs (slab). The essays are available at https://doi. org/10.17632/by42d9wzf6.1 (accessed 5/8/24). Finally, a value for the economic analysis of 715 USD/kWp per installed power was considered, a global value obtained from an analysis of the local market (Fondoso Ossola et al., 2023).
The number STS is limited by the thermal energy generated in summer periods in order to avoid overheating and possible breakage of the collectors. In the case study the following guideline is available: the thermal generation should not be higher than the DHW demand in January. Figure 5 shows an example applied to the case study.
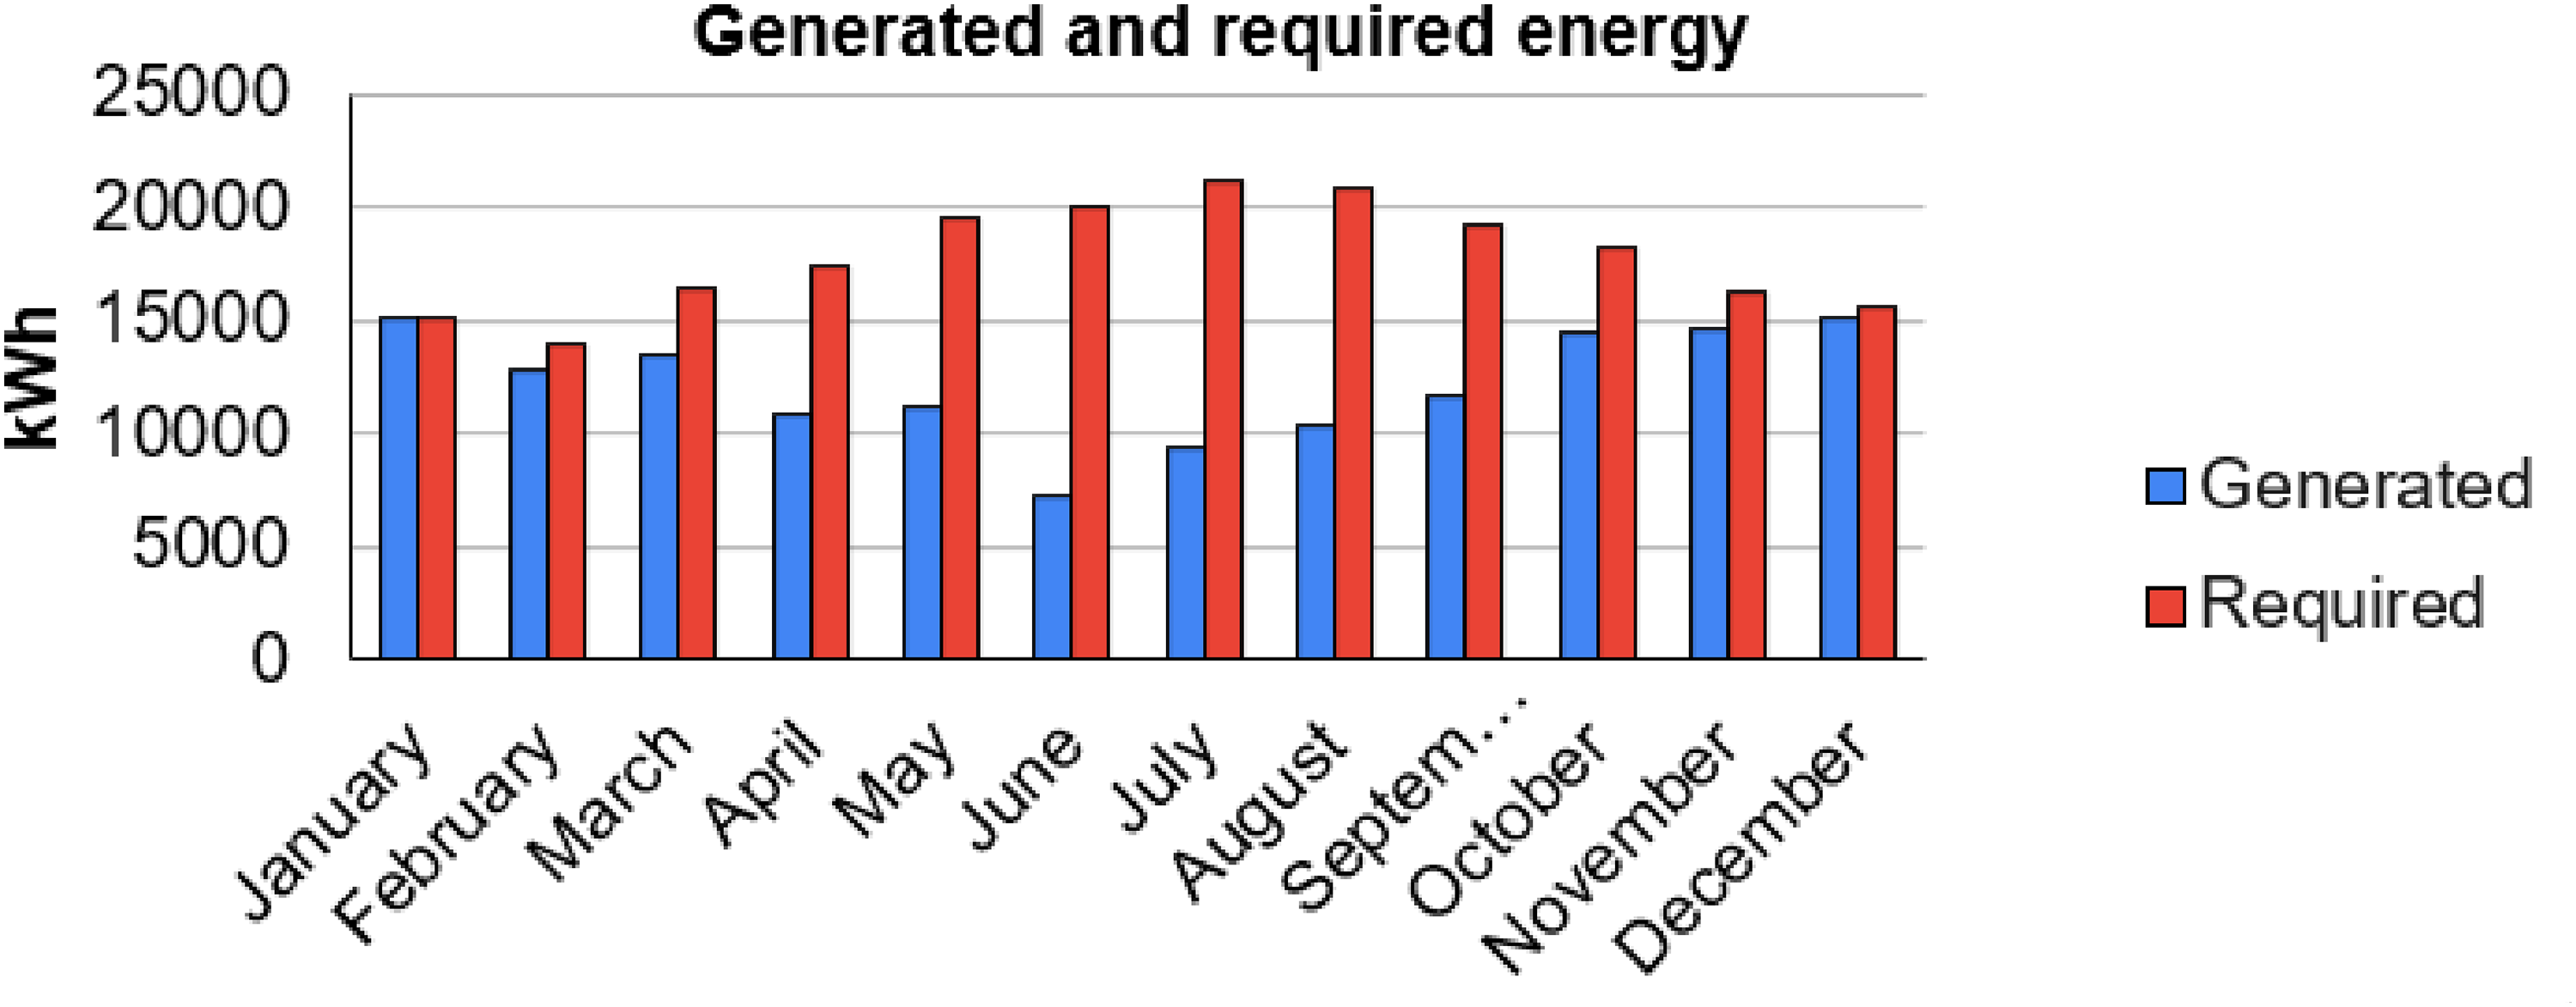
Coverage of DHW generation from STS in one of the hospitals of the network: the HIGA “Gral. San Martín”.
As for energy costs, values corresponding to the year in which the energy data were collected were adopted. Due to the consumption profile of the facilities at the time of analysis, they were charged 0.30 USD/m3 for natural gas (0.027 USD/kWh) and 0.11 USD/kWh for electricity.
In order to improve the efficiency level of water heating systems, the use of performance-related factors is proposed. In terms of economic values, a natural gas storage water heater label “A” (H = 0.58), with a capacity of 180 l, is estimated to cost 900 USD, which includes the installation of internal parts, maintenance and cost of the equipment, while the cost of a storage water heater with the same capacity and label, but with electric energy, is 550 USD (Iannelli & Gil, 2022). It should be added that the H value to label “A” is 0.83 (Spahr, 2025) for electric storage water heaters.
Analysis results and verification of goals
In the results analysis stage, energy, environmental, and economic values are evaluated. To do this, bubble charts are used to compare elements based on three factors of interest (one of general interest and two others of particular interest).
For this work, the size of the bubble is used to represent the amount of energy saved per year (factor of general interest), the X-axis to represent GHG emissions avoided per year (factor of particular interest 1), and the Y-axis to represent monetary savings per year (factor of particular interest 2).
In addition, to determine the viability of each strategy, a simplified analysis is performed according to the payback period (PB) according to equation (14).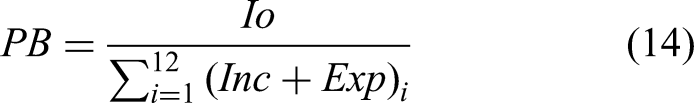
Where PB is the payback period through the application of measures, expressed in [years]; Io is the initial investment, which involves the cost of materials and labor, expressed in [USD]; Inc is the value of the incomes in the i-th month, expressed in [USD]; and Exp is the value of the expenses in the i-th month.
Finally, it is verified whether the proposed goals have been met:
Comply with the requirements suggested by the WHO regarding the treatment of LP bacteria Reduce GHG emissions by 27% in DHW production Propose economically viable projects
Results
The results obtained by applying the previously designed strategies in the provincial hospital network of the MRGLP are presented below.
Analysis of current situation
Table 2 shows the values of the provincial hospital network of MRGLP. It should be noted that the hospital facilities are presented with acronyms that indicate their speciality and influence in the region: HIGA (interzonal general acute hospital), HIAC (interzonal acute and chronic hospital), HZAEP (interzonal hospital specialized in paediatrics), HIEAC (interzonal hospital specialized in chronic and acute), HZGA (zonal general acute hospital) and HZE (zonal specialized hospital).
Provincial hospital network of the MRGLP. Environmental, productive-sanitary and architectural data.

Currently, the network under study is composed of hospitals with different values in terms of DHW demand, which is explained by the diversity of care capacity in each facility. In addition, visits to hospitals determined that most DHW production is carried out using storage water heaters with a “C” label (natural gas) and without systems for harnessing solar energy. Table 3 shows a higher energy demand in the winter period due to the greater difference between the temperature of the water entering and leaving the heating systems (±37 °C). In terms of GHG emissions and costs, the network under study currently generates 437,638.04 kg CO2eq per year, equivalent to the annual use of 430 cars, and represents an expenditure of USD 69,286.39 per year.
GHG emissions and costs in DHW consumption in the provincial hospital network of the MRGLP.
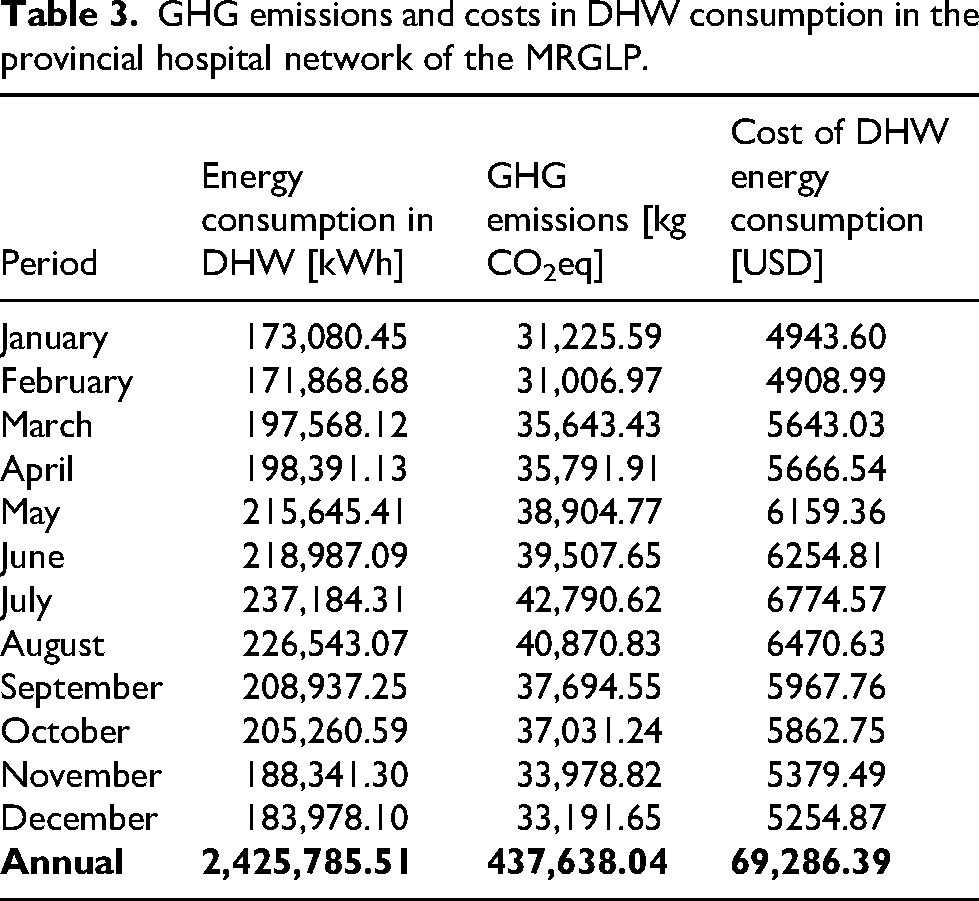
Figure 6 summarizes the situation based on annual values for energy consumption, GHG emissions, monetary investment and treatment of LP bacteria.

Summary of the current situation regarding DHW production.
Strategies formulation
For the application of storage water heaters (Electric) with label “A” the replacement of 525 systems was calculated, with an initial investment of USD 288,902.77. For the application of natural gas water heaters with label “A”, the replacement of the same number of systems was calculated, but with an initial investment of USD 472,750.
For the combination of STS with the storage water heating (Natural Gas) with label “C” an initial investment of USD 619,976.50 were calculated; for the combination of STS with storage water heating (Electric) with label “A”, USD 908,879.28; and for the combination of STS with storage water heating (Natural Gas) with label “A”, USD 1,092,726.50. Figure 7 shows the initial investment according to strategy. For all combinations with STS, a total installed capacity of 867.1 kWp was calculated.
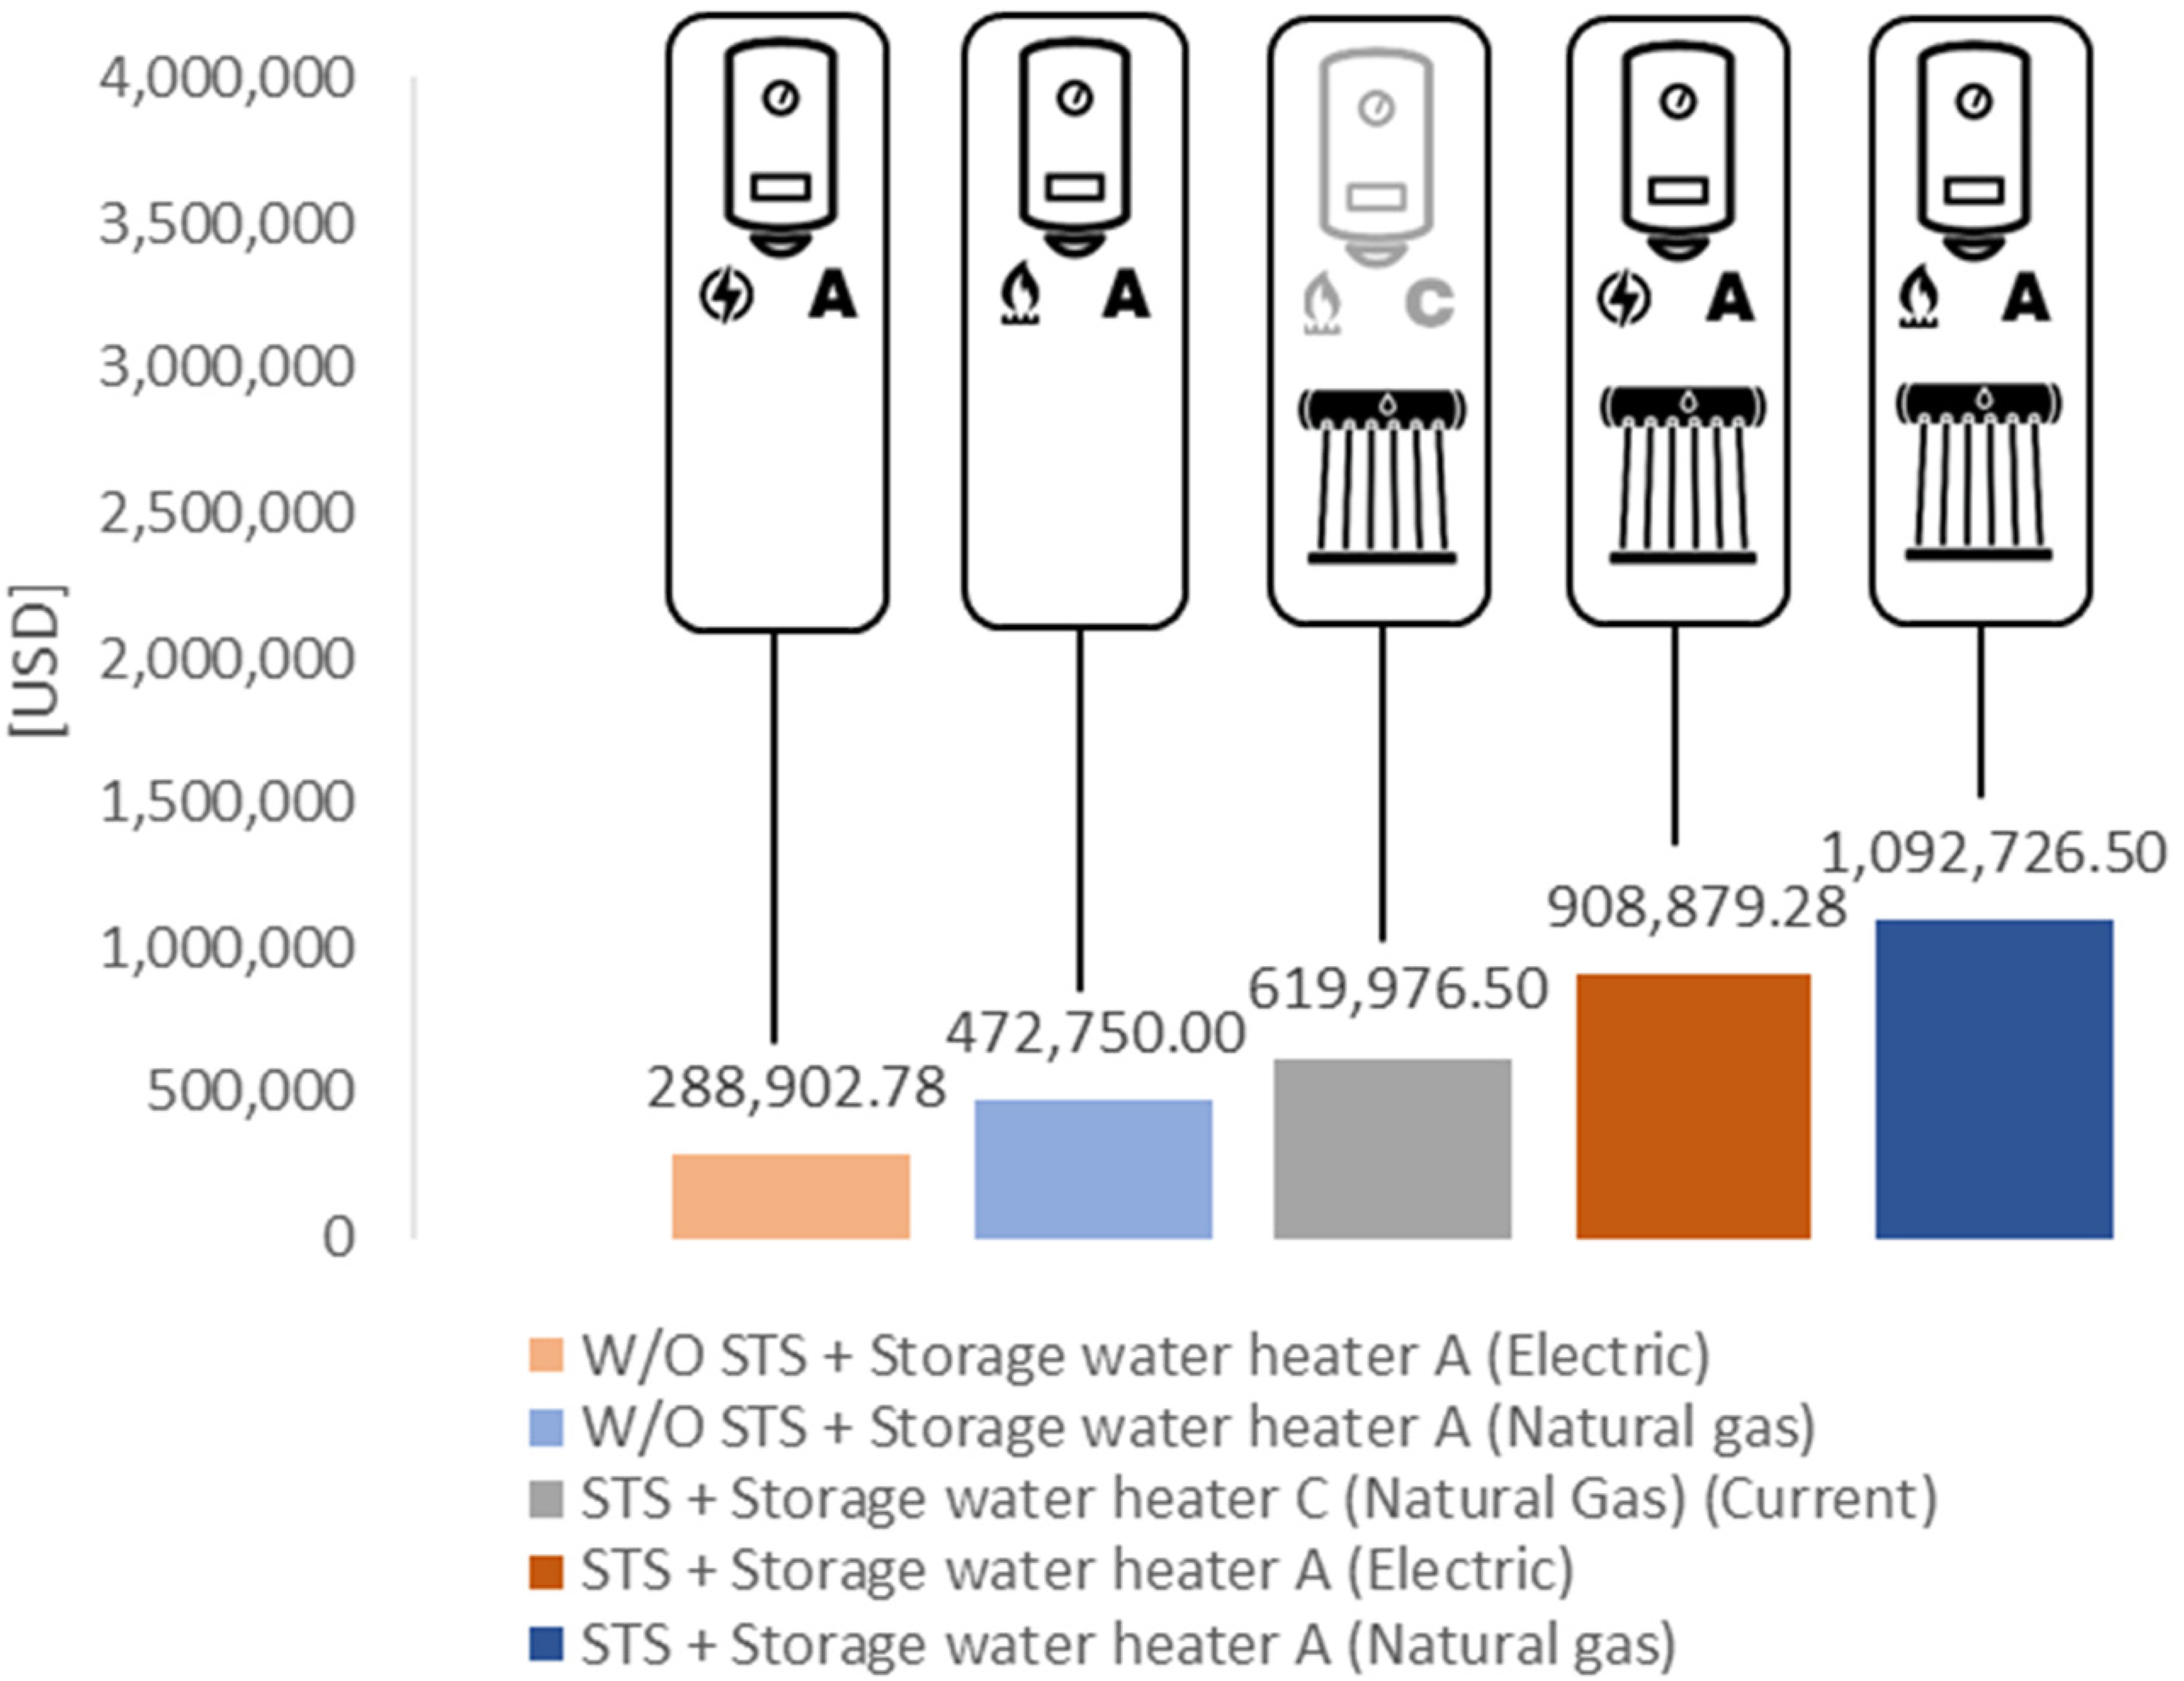
Initial investment according to strategies assayed.
Energy, environmental and economic results were obtained by applying the strategies. In addition, the results of treating the LP bacteria by heating water are presented. Table 4 shows the results of the current situation and of each strategy formulated.
Annual results of alternatives for DHW generation.

Analysis results and verification of goals
Results by treating LP bacteria with biocides
Maintaining a water outlet at 47 °C in DHW production, the results were obtained as shown in Table 5. In Figure 8, each of the attributes is analyzed using a bubble chart, linking the size of the bubbles to the annual energy savings, the vertical axis to the annual monetary savings and the horizontal axis to the annual GHG emissions avoided.

Energy, environmental and economic comparison of alternatives using biocides for the treatment of LP bacteria. Bubble size corresponds to annual energy savings.
Results by treating LP bacteria with biocides (compared to current situation).

The alternative with the highest energy savings is the combination of “A” label electric water heaters and STS (strategy 10). However, it does not represent an alternative that provides significant improvements in avoided GHG emissions or monetary savings. Conversely, the replacement of existing systems with “A” labeled electric water heaters (strategy 6) provides improvements in terms of energy savings but does not offer positive values in terms of monetary savings and GHG emissions. In this sense, the combination of “A” label natural gas water heaters and STS (strategy 8) offers significant energy savings, providing the greatest economic and environmental savings.
Analyzing the PB values (Table 6) of the alternatives formulated, it is obtained that the combination of natural gas water heaters with label “A” and STS (strategy 8) is 21 years. Incorporating STS to the current systems (strategy 2) presents an PB value of 13 years. In the case of replacing only the current storage water heaters with natural gas water heaters with an “A” label (strategy 4), the PB value exceeds the useful life of the technologies (25 years). The same applies to the replacement of current storage water heaters with a combination of “A” labeled electric water heaters and STS (strategy 10). On the other hand, no economic savings are achieved by replacing only the current storage water heaters with “A” labeled electric water heaters (strategy 6).
Pb values for the alternatives with the application of biocides for the treatment of LP bacteria (compared to the current situation).

Results by treating LP bacteria by raising water temperature
Increasing the temperature to 70 °C to ensure the elimination of LP bacteria leads to an increase in the above-mentioned values. Table 7 shows the variation when applying this measure, while in Figure 9 the energy, environmental and economic values are analyzed together using the bubble diagram.

Energy, environmental and economic comparison of alternatives by increasing temperature for the treatment of LP bacteria.
Results by treating LP bacteria by heating the water (compared to the current situation).

As in the previous case, further energy savings can be achieved by replacing existing systems with “A” label electric water heaters and STS (strategy 11). However, only the strategy combining the replacement of “A” label natural gas water heaters and STS (strategy 9) provides significant energy, economic and environmental savings.
Table 8 shows that the pay back in the alternatives exceeds the lifetime of the technologies (strategies 5, 3 and 9) or strategies do not generate economic savings (strategies 7 and 11).
Pb values for the alternatives with increased water temperature for the treatment of LP bacteria (compared to the current situation).

Verification of goals
In the provincial hospital network of the MRGLP, the alternatives that achieve the greatest environmental improvement (+27%) compared with the current situation are “STS + Storage Water Heater C (Natural Gas) with biocides for LP treatment” (strategy 2) and “STS + Storage Water Heater A (Natural Gas) with biocides for LP treatment” (strategy 8). Furthermore, strategies 2 and 8 are the only economically viable options, with payback periods of 13 and 21 years, respectively. However, none of the strategies that treat LP bacteria by heating water to 70°C are economically viable. Figure 10 summarizes the environmental and economic results.

Synthesis of results from the alternative STS + natural gas storage water heater C and biocides to LP treatment (strategy 2) and Synthesis of results from the alternative STS + natural gas storage water heater A and biocides to LP treatment (strategy 8).
Discussion
Based on the results obtained, it is possible to identify, first of all, the difference obtained when treating LP bacteria in the production of DHW in a hospital. In different strategies, the annual values increased considerably. Strategies involving the treatment of LP bacteria by increasing the temperature are 71% higher than the current values and the values of strategy 4, 82% higher than the values of strategy 6 and 211% higher than the values of strategies 2, 8, and 10.
Regarding strategies, the alternatives that require a change of source (natural gas to electricity) show greater energy savings. However, making this change has a greater environmental impact. This is due to the energy transformation and generation processes in the local energy matrix, which results in a higher emission factor for electricity consumption. Conversely, in cleaner electricity matrices, these changes could be beneficial. Also, a lower initial investment is observed when testing the replacement of “A” label electric water heaters, but the low cost of natural gas makes these alternatives economically unviable.
The results obtained lead to certain restrictions or flexibilities in the second stage of the methodology developed: the selection of goals or objectives. In the final phase of the workflow, it was decided that if the results obtained do not meet the proposed objectives, it is necessary to return to the strategy formulation phase and generate new ones until the objectives are met. Although economically viable projects were obtained, they do not meet WHO requirements for the treatment of LP bacteria. However, institutions can address this without strict compliance, as there are no local regulations or standards, which means that incentives could be provided for the acquisition of STS and their incorporation into existing systems, or for the installation of STS and the replacement of current heating systems with efficient gas water heaters.
On the other hand, one of the proposed objectives can be achieved through policy development alone. In other words, if strategies 3 and 9 are not economically viable but meet environmental objectives and WHO requirements, incentives can be proposed to facilitate access to technologies for harnessing solar energy, or energy subsidies in hospitals can be regulated in order to promote the use of renewable energies in conjunction with energy efficiency measures. Therefore, proposing economic viability as an initial objective is dispensable, as it can be addressed in the final stage: Guidelines development.
Current models or processes for evaluating strategies, both for energy efficiency and renewable energy in buildings, usually require specialized software and personnel. In this case, as it is an urban-regional scale study using theoretical calculations, any professional working in the construction sector, such as architects or engineers, could carry out the methodology using a spreadsheet and pre-dimensioning equations to develop strategies. Likewise, the few practical steps of the framework developed make it possible to adapt it to specific case studies.
Furthermore, it should be noted that studies evaluating solar system integration projects in hospitals analyse the building without considering the concept of the network. Public sector buildings, and in many cases private sector buildings, hospitals are managed by centralizing entities, which makes it essential to highlight the potential for solar energy use in all related hospital facilities in order to support decision-making. In this case, based on the results obtained, incentive programs could be created that prioritize certain types of facilities, such as those that are most energy-intensive, for example.
Conclusions
Currently, SSEU are a viable alternative for replacing hydrocarbon-based energy sources with renewable energy in buildings. Although policies based on incentives and regulations have been developed, the specific characteristics of the healthcare sector have not been taken into account. Hospital facilities are energy-intensive facilities with energy profiles that differ from other types of buildings, mainly due to the quantity and peaks in demand. Also, this type of buildings is part of a network within a city, so management to improve their performance is carried out by a centralizing entity.
The objective of this study was to develop an adaptable framework that provides guidelines for the implementation of SSEU in hospital networks, considering the operational logic and specific characteristics of energy behavior.
A methodology was developed that makes it possible to adapt the workflow to different specific cases. For the provincial hospital network of MRGLP, it was proposed to address the implementation of STS to reduce net energy consumption (natural gas or electricity) in DHW by replacing thermal energy from solar sources. The results obtained in the development of the methodology consisted of strategies that meet the objectives stipulated in the second stage of the workflow. For the case study, three initial goals are established: to comply with WHO requirements, to reduce GHG emissions by more than 27%, and to generate economically viable solutions. In this way, the development of guidelines would be oriented toward incorporating STS into current water heating systems, or a more ambitious approach that would not only incorporate STS but also replace current water heating systems with more efficient gas-powered ones.
Although it was possible to adapt the general framework to the specific case, during the results analysis and objective verification stage, it was determined that there could be flexibility in terms of meeting the proposed objectives. It was also determined that economic feasibility objectives should not be established, as these can be addressed in policy development.
Currently, there are countries where the integration of renewable energy sources into buildings remains at an early stage (Banco Mundial, 2020). In these cases, the availability of methodologies that allow for testing the application of renewable energy projects in building networks is useful for drawing conclusions about the economic viability of the projects, as well as for reflecting on the need for incentives and subsidies. The results and processes offered by the methodology developed are relevant for decision-makers, both those who must analyze the investment itself and those who are responsible for energy and tariff policy.
The results obtained in this study provide useful evidence for the design of policies that support the energy transition towards a more sustainable future. In addition, the work contributes to the development of a replicable methodology that can serve as a basis for energy certifications, positioning public hospitals as urban benchmarks capable of promoting good practices in other buildings in the city.
Future research is proposed to examine the effect of efficient alternatives in scenarios that simulate policy shifts toward sustainable development. In this way, energy-environmental values could be compared with different temporary cuts (short, medium and long term). Based on the findings obtained, it is proposed to collaborate with the methodology of labelling by hospital areas and to expand the repository of improvement alternatives (Seltzer, 2024), in the face of possible diagnoses that expose heterogeneous systems for the treatment and production of DHW.
Footnotes
Acknowledgments
We would like to thank the Investigaciones y Políticas del Ambiente Construido (IIPAC), a joint unit of the National Scientific and Technical Research Council (CONICET) and the National University of La Plata (UNLP). We would also like to thank CONICET, which funded the research through Project PIP 2023–2025 “Eficiencia energética y energías renovables en edificios de salud: análisis de medidas de mejoramiento orientadas a la implementación de un programa de certificado edilicio y al análisis prospectivo” Identification code: 11220220100127CO.