
Abstract
The early identification of faults in lithium-ion batteries is essential for enhancing their operational safety and optimizing energy management. Nevertheless, detecting anomalies in the voltage signal is challenging due to the intricate nature of battery dynamics. In this study, we propose a methodology based on digital filtering to detect faults in battery voltage signals. The approach reconstructs the signal by leveraging periodic components identified through prior spectral analysis. To achieve this, a low-pass digital filter was implemented to suppress high-frequency elements unrelated to fault conditions, thus emphasizing anomalous behavior in the reconstructed signal. This approach enhances the detection of critical events, such as overcharge and overdischarge, with greater accuracy. The method was validated using experimental data from the lithium-ion battery charge-discharge cycling database of NASA's Prognostics Center of Excellence (NASA-PCoE), where progressive failures were observed under an accelerated aging protocol. The results demonstrate that the filtered signal enables clearer identification of irregularities, providing an effective tool for early fault monitoring and diagnosis. This approach can be applied to different battery types without depending on their electrochemical structure, making it suitable for advanced real-time management and monitoring systems. Preliminary estimations suggest that the proposed filtering technique can operate in real time with sub-second detection delays and low resource usage, enabling its implementation in embedded systems for online fault monitoring.
Keywords
Introduction
Over the past decade, lithium-ion batteries have emerged as a leading energy storage technology for consumer devices, including smartphones and electric vehicles. Their widespread adoption is attributed to characteristics such as high power density, superior volumetric energy efficiency, minimal maintenance requirements, and extended service life. Nevertheless, the growing need for increased storage capacity, accelerated charging processes, and prolonged operational cycles has raised substantial concerns regarding battery reliability and safety. One of the most pressing issues is the potential for excessive heat generation, which, under extreme conditions, may result in thermal runaway or catastrophic failure. This phenomenon is often exacerbated when the battery undergoes charge-discharge cycles at high current rates (Cong et al., 2021; Yin et al., 2023; Zou et al., 2023).
As a result, the analysis and continuous monitoring of high-capacity lithium-ion batteries remain crucial, particularly from the perspectives of user safety, environmental sustainability, and overall reliability. The scientific literature classifies fault detection and diagnostic methodologies into three primary categories: model-based approaches, which rely on mathematical representations of battery behavior; signal-processing techniques, which analyze voltage, current, and temperature variations; and knowledge-driven methods, which incorporate expert insights and empirical data. Battery faults are typically grouped into three main types (Chen et al., 2018; Iyer et al., 2013; Liu and He, 2017; Ma et al., 2018):
Abuse-related failures: These primarily include internal and external short circuits, overcharging, and deep discharges. Sensor failures: which reflect abnormalities in current transducers, voltage readings, or temperature monitoring systems. Electrical connection issues: often arising from loose or poor interconnections between cells or sensing elements.
Abuse-related and connection failures can cause irreversible battery damage, including thermal runaway, fires, or explosions. To mitigate their impact, it is crucial to implement effective prevention and monitoring strategies (Pan et al., 2020). Currently, there is a significant research opportunity in lithium-ion battery studies, as most reported scientific works rely on diagnostic and fault detection techniques based on static experimental data. This approach presents limitations, as it may not account for complex operational scenarios over time, nor consider external factors such as ambient temperature variations or battery aging (Kang et al., 2021).
Recent studies have responded to these challenges with methods aimed at early fault detection. For instance, incipient short-circuit diagnosis has been explored using hybrid model-based and data-driven frameworks (Meng et al., 2020), while empirical mode decomposition combined with particle filtering has shown promising results for early-stage end-of-life prediction (Meng et al., 2023). These approaches demonstrate the importance of time-frequency and signal-processing tools for anticipating battery degradation.
In line with this trend, Dey et al. proposed a real-time thermal fault diagnosis method for lithium-ion batteries using a model-based approach, where temperature variations were analyzed to detect abnormal thermal behaviors and potential failures. Their work highlights the importance of thermal management in fault prevention (Dey et al., 2016). Similarly, Bosire Omariba et al. (Omariba et al., 2020) developed a parameter identification and state estimation method for lithium-ion batteries in electric vehicles, incorporating temperature and vibration dynamics to improve battery monitoring. Unlike these thermal and dynamic state-based approaches, Zheng et al. introduced a real-time fault diagnosis method using an adaptive unscented Kalman filter (AUKF), which enhances state-of-charge estimation and internal resistance identification, enabling more accurate parameter bias fault detection (Zheng et al., 2017). Additionally, Yao et al. implemented a wavelet neural network-based system for intelligent fault diagnosis in electric vehicle battery packs, demonstrating enhanced performance in detecting and classifying early-stage anomalies across various operating conditions (Yao et al., 2020).
While these methods have proven effective in different aspects of battery fault detection, other approaches have focused on identifying specific failure mechanisms using machine learning and data-driven techniques. Yang et al. (Yang et al., 2018) employed a classification algorithm based on random forests to detect electrolyte leakage failures. Zhao et al. (Zhao et al., 2017) proposed a probabilistic quantitative analysis for battery faults, aiming to detect abnormal cells using operational data collected from a big data platform for electric vehicles. Feng et al. (Feng et al., 2016) developed an estimation algorithm capable of detecting internal short circuits in real time.
This work presents a digital filtering method for fault identification in lithium-ion battery voltage signals using experimental data from cycling tests conducted by NASA-PCoE under a standard charge/discharge protocol (NASA Ames Prognostics Data Repository, Battery Dataset n.d) The filtering thresholds were determined through prior spectral analyses, identifying the critical periodicities preceding failure events. Based on these results, a low-pass digital filter was designed to eliminate high-frequency components unrelated to faults, enabling the reconstruction of the voltage signal and highlighting anomalous patterns associated with overcharge and overdischarge. Unlike previous approaches, the proposed strategy enhances the accuracy of fault detection, reducing operational risks such as explosions or fires and improving battery management safety.
Methodology
The proposed method was developed in four stages, following the structure presented in Figure 1. First, data filtering was performed to preserve data quality and remove outliers and residual noise and artifacts in the raw voltage signal can interfere with the identification of fault-related periodicities by introducing spurious frequency components or masking relevant spectral patterns during FFT and CWT analysis (Fu et al., 2023). To mitigate this, a pre-processing step involving a basic denoising filter was applied to the raw voltage data. This step ensured that the subsequent FFT and CWT analyses emphasized genuine signal characteristics. ensuring that voltage readings reflected only significant variations related to the battery's state (Mahafza, 2016) Next, in the frequency-domain analysis stage, the preprocessed data was transformed using the Fast Fourier Transform (FFT) and the Continuous Wavelet Transform (CWT), allowing the frequency spectrum to be obtained and the main signal components to be characterized (Daubechies, 1990; Rader and Maling, 1967). Subsequently, low-frequency components were identified to recognize frequency patterns associated with fault precursors caused by overcharging or battery degradation. Finally, in the signal reconstruction stage, a digital filter was implemented from the results of the spectral analysis, the Inverse Fourier Transform (IFT) is then employed to highlight anomalies in the voltage signal and facilitate early fault detection (Yang et al., 2004). This approach optimizes the identification of irregularities in lithium-ion batteries without relying on their electrochemical structure, making it applicable to various battery monitoring and management systems.

Schematic of the proposed fault identification methodology for lithium-ion batteries, including data filtering, frequency domain analysis, low-frequency component identification, and signal reconstruction.
The Fast Fourier Transform (FFT) was used to extract the frequency components of the voltage signal. The discrete Fourier transform (DFT) is defined as:

To support this reconstruction process, the selection of relevant frequency bands was guided by a detailed spectral analysis. The continuous wavelet transforms (CWT) revealed high-energy components consistently occurring prior to overcharge and overdischarge events, particularly around a dominant periodicity of one hour. These findings were corroborated by FFT results, confirming the persistence of fault-related harmonics in the low-frequency domain.
Based on this analysis, a Chebyshev Type I low-pass filter was chosen due to its sharp transition band and minimal computational cost. The filter order (1.5) was selected empirically to achieve a balance between roll-off steepness and signal stability. The cutoff frequency was set to 0.12 Hz—equivalent to an 8-h period—encompassing the main periodic components associated with early failure indicators, while effectively suppressing high-frequency noise and measurement artifacts.
The cycling test dataset for two lithium-ion batteries, compiled by the NASA-PCoE research team, was examined (refer to Table 1). The test followed a standardized charge-discharge protocol designed to prevent overcharging (Park et al., 2007), with distinct operating parameters assigned to each battery. The cycling procedure commenced with the Constant Current (CC) charging phase, during which the battery was charged until reaching the cutoff voltage threshold. Subsequently, the Constant Voltage (CV) charging phase was initiated, continuing until the charging current dropped to 13% of its nominal value. An identical sequence was later employed for the discharge process, ensuring the completion of a full-discharge cycle. This sequence was repeated over multiple iterations until the predefined experimental criteria were met.
Specifications of the lithium-ion cells tested.
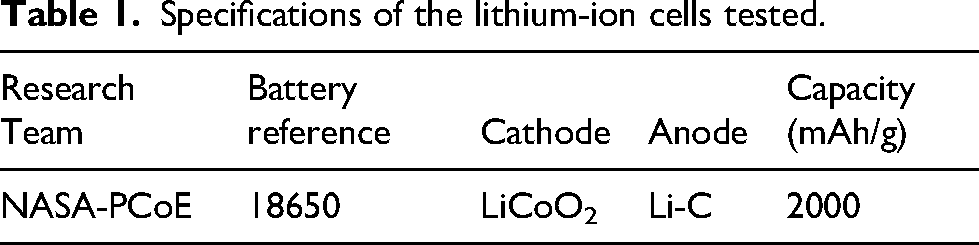
The NASA-PCoE research team carried out cycling experiments on commercial lithium-ion batteries (N-LIB) of the 18650 model, which have a nominal capacity of 2000 mAh (Lee et al., 2007). These batteries incorporate an anode composed of lithiated carbon (LiC) and a cathode made of lithium cobalt oxide (LiCoO2). The N-LIB1 cell was subjected to cycling at 4°C, whereas N-LIB2 was tested under ambient conditions (24°C). Although both batteries followed the same charging protocol, they underwent different discharge procedures (refer to Table 2).
Charging and discharging protocol implemented for the evaluated lithium-ion batteries.

The charging phase commenced in CC mode, applying 1500 mA until the voltage reached 4.2 V. Subsequently, the charging process transitioned to CV mode, where it continued until the current was reduced to 20 mA. Regarding discharge conditions, the N-LIB1 cell was subjected to a stepwise current discharge, varying between 1000 and 4000 mA (corresponding to 0.5C to 2C), until the voltage threshold dropped to 2.5 V. Conversely, N-LIB2 was discharged using a CC of 4000 mA (2C) until the voltage limit reached 2.2 V. The cycling procedure was repeated until the battery capacity decreased to 1400 mAh (30% degradation) for N-LIB1 and 1600 mAh (20% degradation) for N-LIB2.
The voltage signal data from the two selected cells exhibited irregularities during cycling (refer to Figure S1 in the supplementary section). The voltage thresholds were established based on the test protocol, meaning that certain anomalous events can be attributed to overcharge and overdischarge conditions. As shown in Figure 2, the overcharge and overdischarge events in the N-LIB1 battery become more critical after 40 h of cycling, potentially due to the effects of the accelerated aging protocol implemented during the experiment on this battery.
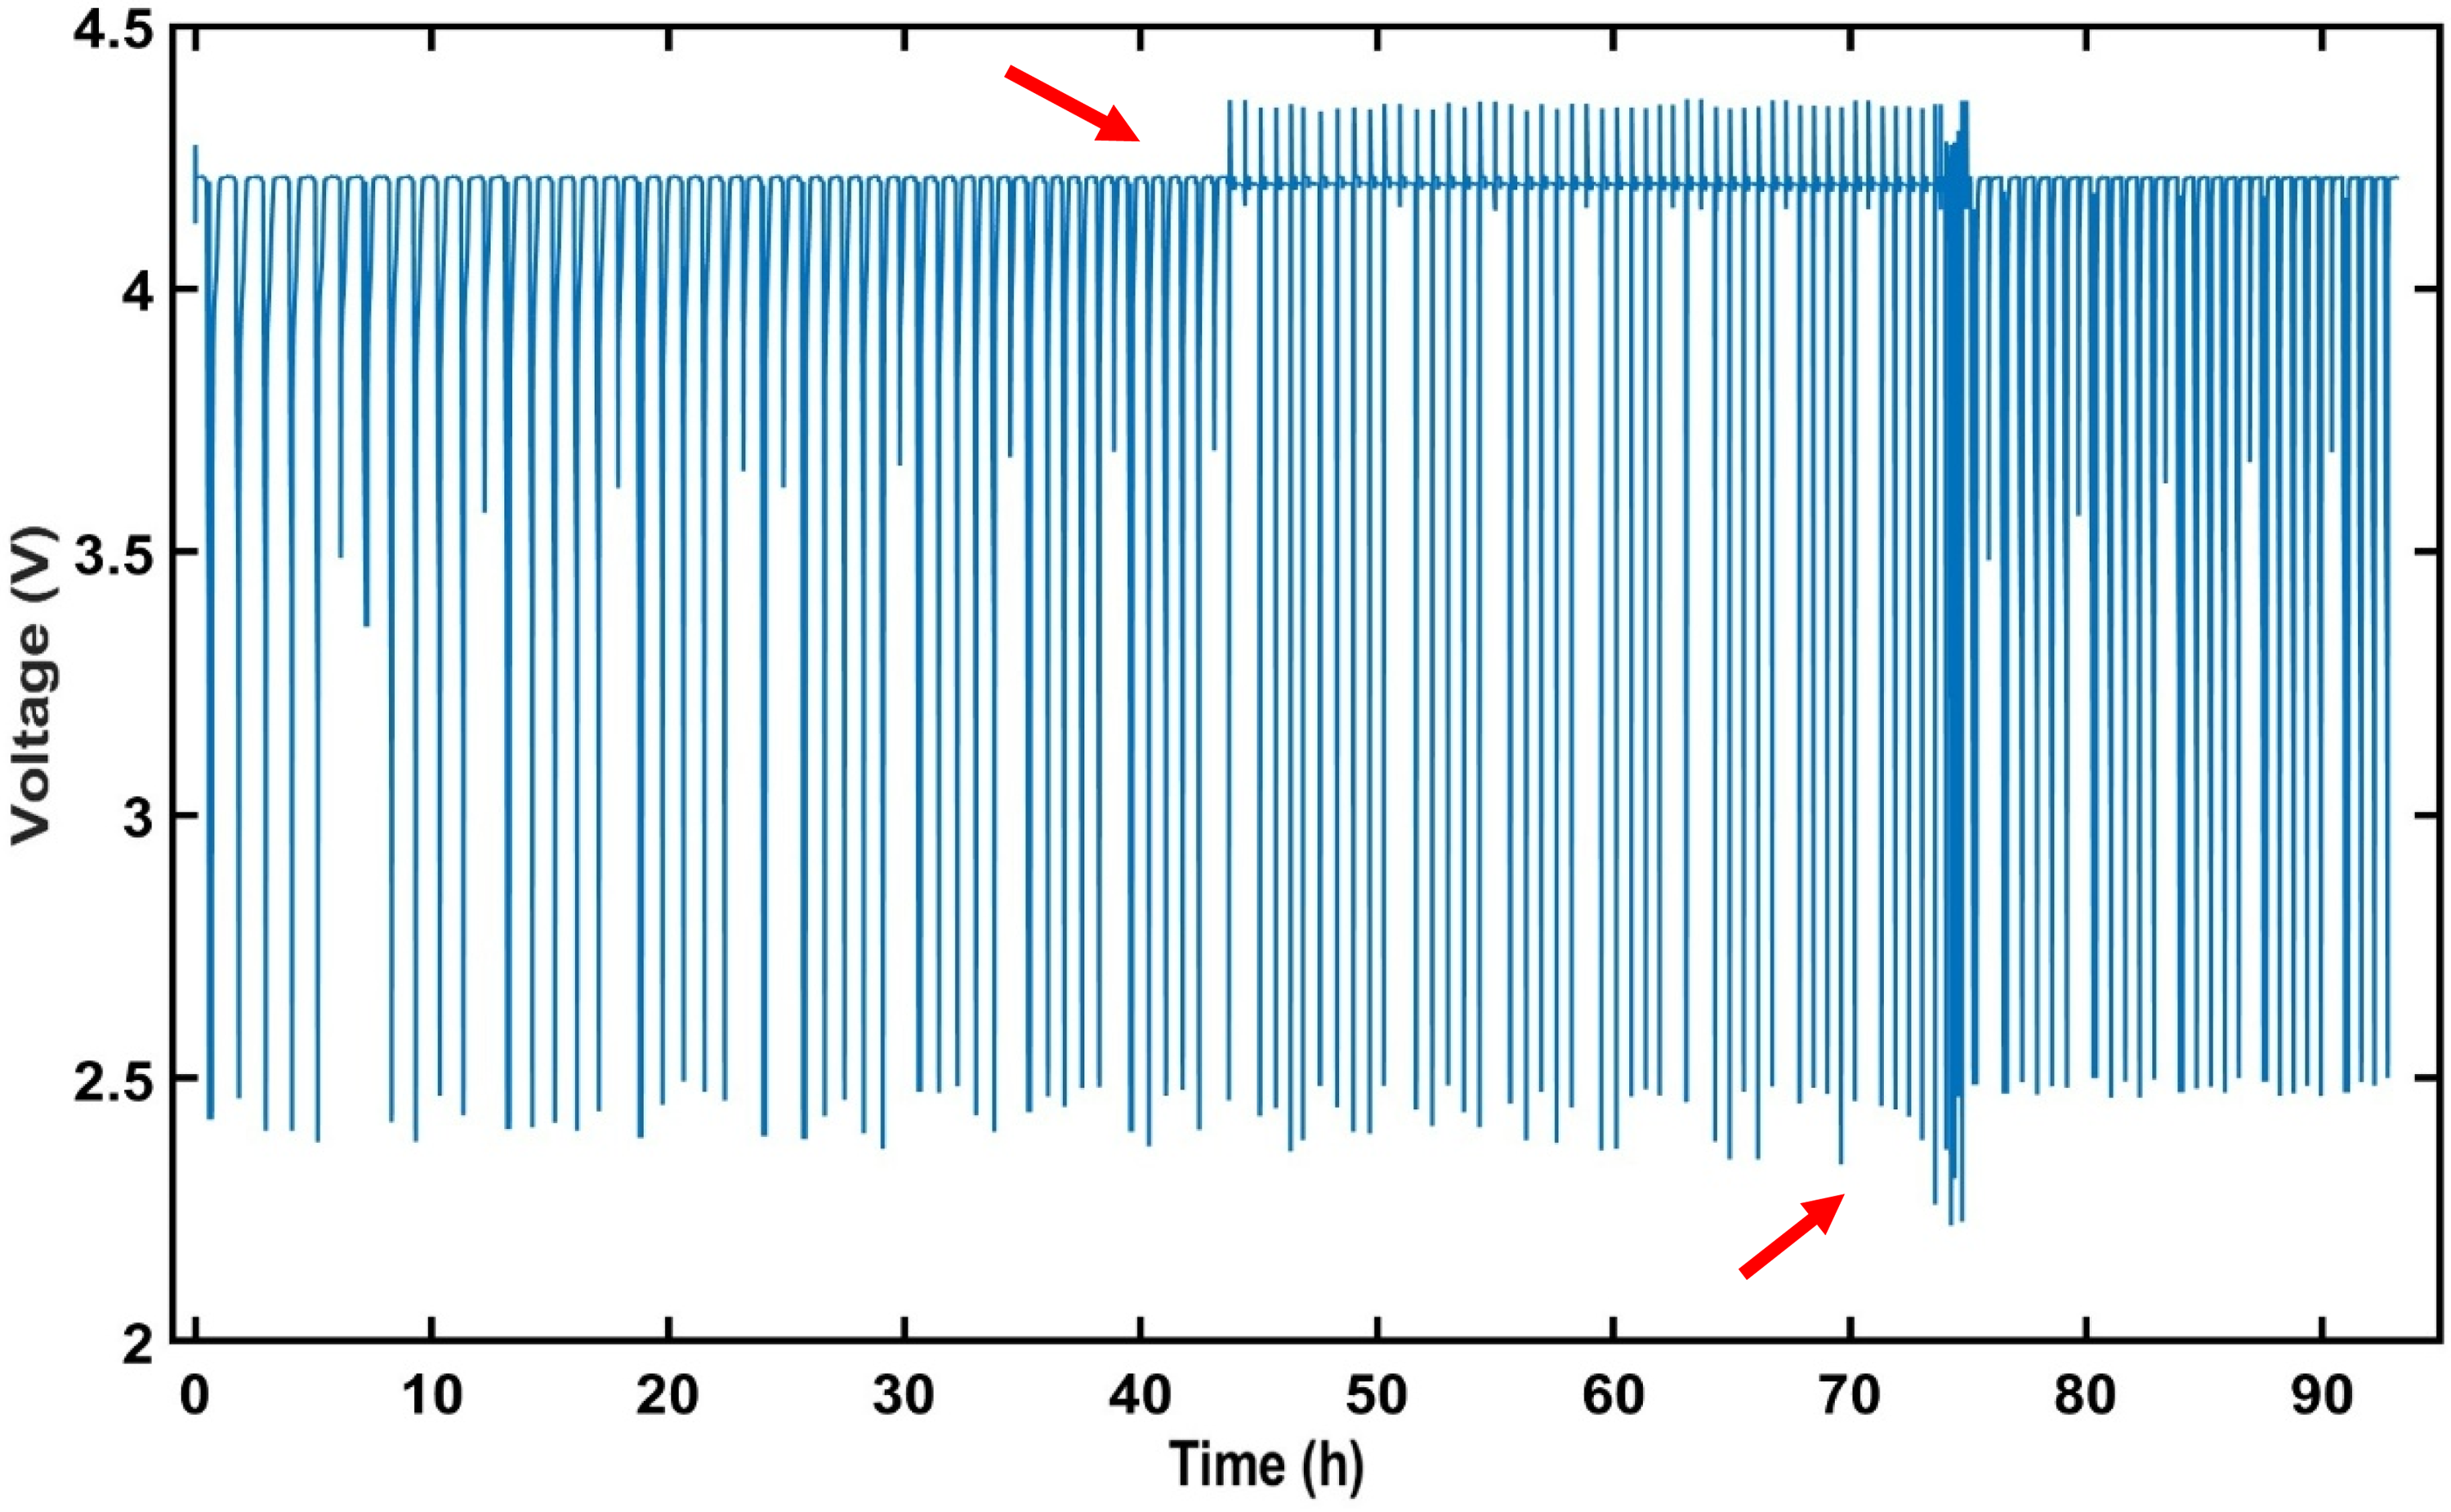
Voltage signal of the N-LIB1 battery cycled by the NASA-PCoE research group. The voltage profile exhibits multiple deep discharge events, characterized by abrupt drops below 2.5 V, as well as intermittent overcharge conditions with voltage excursions exceeding 4.2 V. Notably, around 70–80 h, a period of increased voltage instability is observed, which may indicate the onset of a failure mechanism. These anomalies highlight critical operational stress that can contribute to accelerated degradation and potential safety risks.
Results and discussion
The voltage measurements obtained from the NASA-PCoE cycling tests were processed utilizing the Fast Fourier Transform (FFT) and the Continuous Wavelet Transform (CWT). Additionally, the signal processing algorithm was implemented using MATLAB®. The sampling frequency (SF) for the FFT analysis was configured at 4.1 kHz, following the principles of the Nyquist-Shannon theorem (Lathi and Green, 2014). This frequency was selected as it exceeds twice the maximum frequency detected in the voltage signal, recorded at 1.72 kHz. Such a configuration guarantees that the signal is precisely reconstructed from the sampled data, effectively mitigating aliasing.
Frequency-Domain analysis of the voltage signal
The voltage spectral analysis for the N-LIB1 cell from NASA-PCoE reveals that the Fourier spectrum (Figure 3(c)) exhibits multiple high-amplitude components in the frequency domain, which are closely related to variations in the battery's cycling period. It is observed that this period follows a decreasing trend after approximately 40 h of testing, coinciding with the occurrence of multiple recorded fault events in the cell (Figure 3(a)).

(a) voltage signal during the cycling test, showing periodic fluctuations with noticeable peaks corresponding to overcharge and overdischarge events. (b) Wavelet power spectral density analysis, where the color scale represents the spectral power intensity in arbitrary units, highlighting dominant periodic components and transient events over time. The cone of influence marks the region affected by edge effects. (c) Fourier transform spectrum, displaying the amplitude distribution across frequency components, revealing the dominant frequencies associated with the voltage variations.
Unlike previous studies, where the presence of critical failures generates recurrent and well-defined spectral patterns, the detected frequencies in this case do not exhibit a clear periodic structure, suggesting a more complex degradation dynamic (Carbonó dela Rosa et al., 2023). This behavior becomes more pronounced between 43 h and 74 h, during which recurrent overcharge events were identified, accompanied by simultaneous overdischarge episodes reaching values as low as 2.2 V. These anomalies could be attributed to the accelerated aging protocol applied to the battery, which induces extreme stress conditions that alter its electrochemical performance. Additionally, the spectral analyses of the N-LIB2 cell show similar trends (see Figure S2c in the supplementary information), suggesting that the observed degradation mechanisms may be related to intrinsic design characteristics of these cells or the experimental conditions of the aging protocol.
Time-Frequency analysis using CWT
The wavelet-based power spectral density of the two NASA-PCoE-tested batteries reveals a broad yet non-uniform central frequency band (ranging from approximately 0.25 to 5 h) with intermittent gaps. This expanded frequency distribution stems from the battery's irregular voltage response to the cycling conditions established by the accelerated aging protocol (refer to Table 2).
The dominant periodicity across all tested cells is around 1 h. Figure 3(b) illustrates the wavelet spectrum of the N-LIB1 cell voltage, where the primary periodicity is highlighted as a high-intensity red zone with a black contour, positioned centrally within the band. This pattern exhibits discontinuities and diminishes progressively over time, correlating with the gradual capacity degradation observed in the dataset. Below the primary periodicity, small oval-shaped, lighter-colored marks can be observed, indicating overdischarge events and irregularities in the voltage signal over time. Additionally, dark orange periodic regions between 8 and 32 h are identified, preceding the overcharge and overdischarge events that begin at approximately 43 h of battery cycling (Figure 3(b)). The wavelet power spectral density for the N-LIB2 battery, shown in Figure S2b in the supplementary information, presents a similar spectral behavior.
Comparison with other fault detection methods
The timely detection of faults in lithium-ion batteries plays a crucial role in ensuring safety and performance enhancement. Several strategies have been investigated in the literature, encompassing machine learning-driven approaches, physics-based modeling, and hybrid methodologies. Artificial intelligence models, including neural networks and support vector machines (SVMs), have exhibited high predictive accuracy by identifying complex, nonlinear patterns within operational datasets (Zhang et al., 2024). However, these techniques require large, well-labeled datasets and significant computational resources, making real-time implementation in embedded systems challenging. Furthermore, their black-box nature often limits interpretability, raising concerns in safety-critical applications (Feng et al., 2018).
Physics-based models, on the other hand, provide detailed insights into battery behavior by incorporating electrochemical and thermal characteristics into mathematical formulations (Hu et al., 2020). While these models enable precise fault diagnosis, they require extensive parameterization, making their implementation computationally expensive and difficult to generalize across different battery chemistries (Yao et al., 2015).
The method proposed in this study offers a complementary approach by leveraging time-frequency analysis through Fourier Transform and Continuous Wavelet Transform (CWT) to detect spectral patterns associated with battery degradation (Carbonó dela Rosa et al., 2023). Unlike machine learning models, it does not require large-scale labeled datasets, reducing data dependency and training complexity. Furthermore, compared to physics-based models, our approach eliminates the need for electrochemical modeling, allowing broader applicability across battery technologies. The main advantage of this method lies in its ability to highlight fault-related anomalies using only voltage signal variations, making it suitable for real-time monitoring applications with low computational overhead. However, its accuracy is inherently dependent on the spectral characteristics of the failure modes analyzed, and further validation across diverse operating conditions is necessary to confirm its robustness beyond the NASA-PCoE dataset (Wang et al., 2022).
Method for fault identification in lithium-ion battery voltage signals
A model was developed for identifying faults and irregularities in the actual battery voltage signal by reconstructing the voltage based solely on the range of periodicities identified in the Wavelet analysis that preceded a fault event. In this approach, a low-pass digital filter was designed and implemented in MATLAB® to eliminate high-frequency elements and reconstruct the average voltage profile. The cutoff frequency was chosen within the wide periodicity range preceding the fault event, while remaining near the primary signal period.
The additional parameters employed for the design of the low-pass digital filter are detailed in Table 3, whereas Figure 4 illustrates the comparison between the actual voltage signal and the reconstructed voltage over time for the N-LIB1 battery. The reconstructed voltage signal highlights faults or irregularities such as peaks or slight oval-shaped distortions around the fault event. Additionally, Figure S3 in the supplementary section presents the voltage reconstructions for the N-LIB2 battery.

Comparison between the actual voltage signal (dotted green line) and the reconstructed voltage signal (solid brown line) using the proposed filtering method for fault identification in the N-LIC1 (NASA-PCE) cell. The filtering technique effectively reduces high-frequency fluctuations, preserving the overall voltage trend and enabling the identification of anomalies such as overcharge, overdischarge, or performance degradation.
Design parameters for the low-pass filter.

Quantitative evaluation of fault detection using the filtered voltage signal.

The reconstructed signals in Figures 4 and S3 reveal distinct anomalous features that correlate with the degradation dynamics observed during the cycling tests. In the case of the N-LIB1 battery, several overdischarge events are visualized as smooth but persistent voltage dips deviating from the reconstructed baseline, particularly after 70 h. These dips align with abrupt drops below 2.5 V in the raw signal, suggesting capacity fade and potential lithium plating (Li et al., 2011, 2020). Additionally, minor oscillations and inflections during charging phases are consistent with increasing internal resistance and heterogeneous charge transfer (Waldmann et al., 2018).
In contrast, the N-LIB2 battery, tested under ambient conditions, exhibits more gradual voltage instabilities. The filtered signal shows subtle plateau deformations and prolonged transitions during both charge and discharge cycles, indicative of moderate but progressive aging (Attia et al., 2020). These patterns reinforce the notion that the reconstructed voltage profile effectively highlights early-stage degradation signatures, even when raw voltage fluctuations appear masked by operational variability.
The diagnostic process is based on the comparison between the measured voltage signal and the reconstructed signal obtained through wavelet-based filtering. In Figure S3, the measured voltage (in green) displays the complete cycling behavior of the N-LIB2 battery. Several anomalous events can be observed at different intervals. For instance, in the range 0–20 h, the abrupt and repetitive drops in voltage correspond to deep discharge cycles, potentially indicating an overdischarge condition. Between 40–60 h, the signal shows sudden irregular pulses or discontinuities that may be associated with unstable transient behavior, suggesting internal imbalance or early degradation. In both cases, the reconstructed signal (in red) remains relatively smooth under normal conditions but exhibits distinct high-frequency ripples or oscillatory modulations precisely at the locations of the anomalies. This pattern becomes especially prominent in the interval between 100–120 h, where the reconstructed signal clearly highlights a pronounced deviation that aligns with a drop in the measured voltage, potentially indicating a failure event or capacity fading. These ripple patterns arise from fault-related frequency components captured by the wavelet filter, serving as reliable markers for overcharge, overdischarge, or early fault symptoms. Moreover, this filtering strategy allows the identification of short-duration or low-amplitude transients that may be difficult to observe in the original noisy signal.
Quantitative evaluation of fault detection
To provide a quantitative assessment of the proposed filtering-based fault detection method, we evaluated its performance using standard classification metrics. Overcharge and overdischarge events were defined according to the voltage thresholds established in Table 2. For N-LIB1, overcharge was considered when the voltage exceeded 4.2 V, and overdischarge when it dropped below 2.5 V. For N-LIB2, the discharge threshold was set at 2.2 V. These events were automatically identified across the voltage time series and used as reference ground truth.
Using this reference, we subsequently assessed the effectiveness of the filtered signal in detecting these anomalies. Figure 5 presents confusion matrices corresponding to the fault detection results for the N-LIB1 and N-LIB2 batteries. Each matrix compares predicted labels (Normal/Fault) against the ground truth, based on the voltage thresholds defined in Table 2. The True Positive (TP) represents cases where the method correctly identified a segment as ‘Fault’ when an actual anomaly was present; False Positive (FP) indicates instances where the method incorrectly labeled a ‘Normal’ segment as ‘Fault’; True Negative (TN) denotes correctly identified ‘Normal’ segments; and False Negative (FN) refers to cases where a fault was present but not detected by the method. The counts for each category are provided, reflecting the method's reliability under different testing conditions.
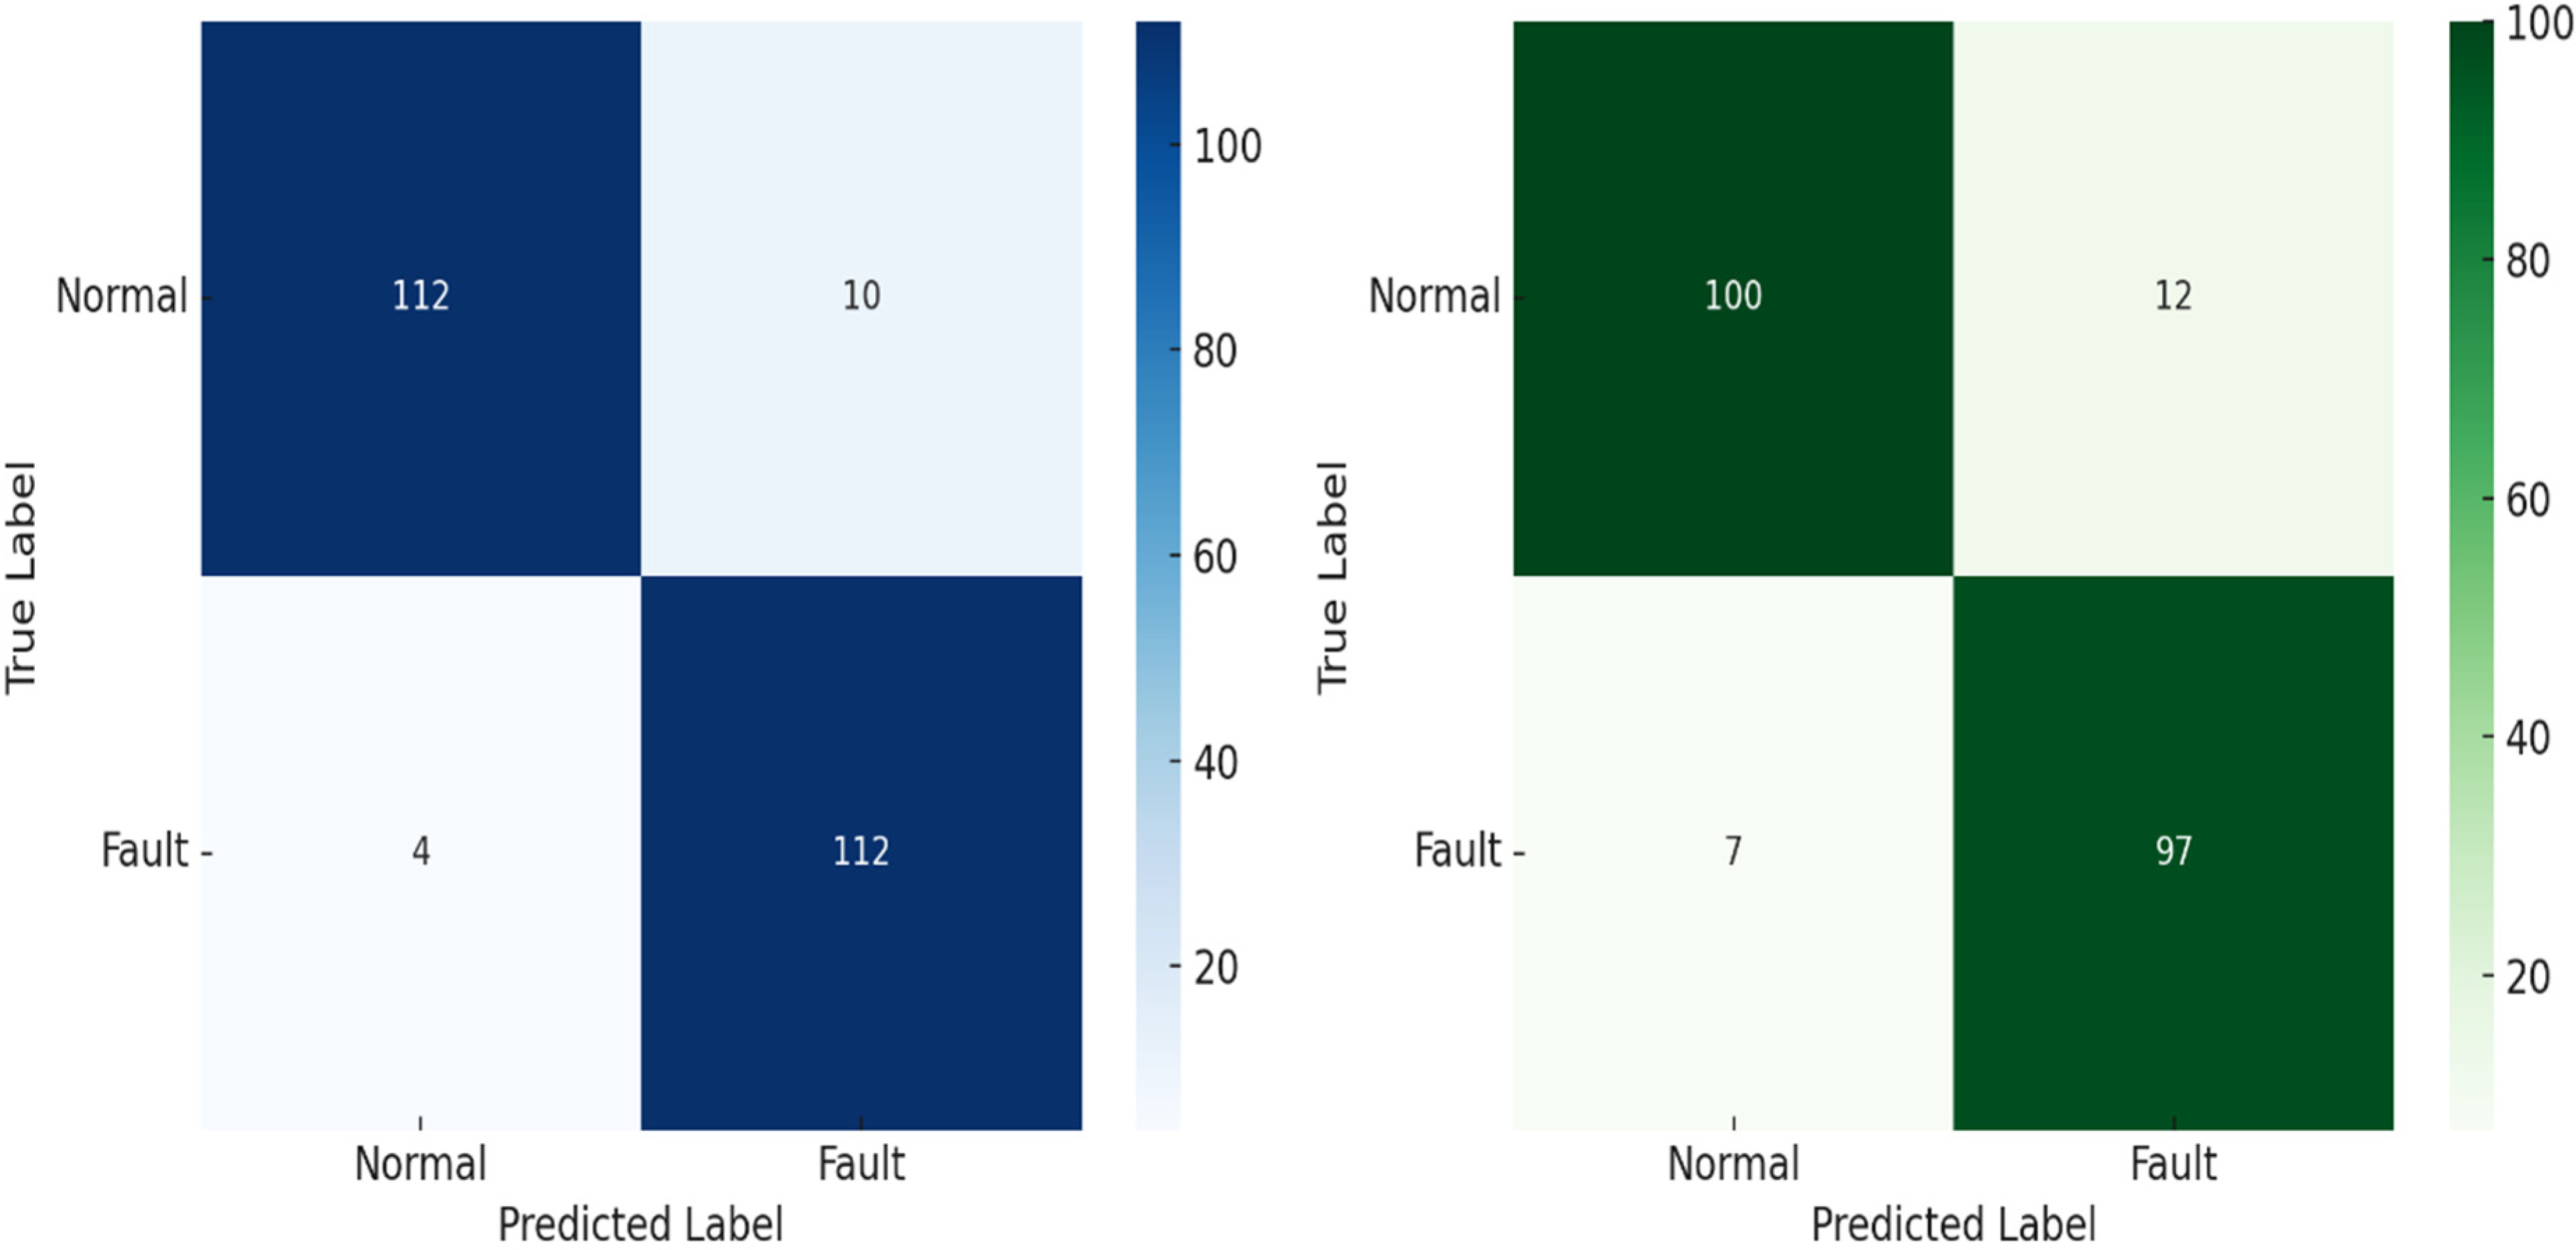
Confusion matrices correspond to fault detection outcomes for the N-LIB1 and N-LIB2 batteries.
Based on these classifications, we calculated three standard performance metrics:
Accuracy = (TP + TN) / (TP + TN + FP + FN) Sensitivity = TP / (TP + FN) Specificity = TN / (TN + FP)
The results are summarized in the following Table 4:
These results confirm that the proposed method enables reliable and early identification of fault events. The high sensitivity observed, especially in the case of N-LIB1, tested under accelerated aging demonstrates the method's ability to detect critical conditions such as deep discharges and voltage excursions that could lead to rapid degradation or failure. Moreover, the high specificity indicates a low rate of false positives, which is crucial to avoid unnecessary interventions in practical monitoring systems.
Conclusions
A time-frequency analysis was carried out on the voltage signal obtained from charge-discharge cycling tests performed on lithium-ion batteries by NASA-PCoE. The implementation of the Fourier Transform facilitated the identification of dominant frequency components and their corresponding harmonics within the voltage time-domain signal. Furthermore, a supplementary assessment using the Continuous Wavelet Transform (CWT) enabled the detection of behavioral patterns associated with the battery cycling process. The combination of these methods demonstrated that low-frequency components emerge before a fault, such as overcharge, overdischarge, or battery degradation, providing an early indicator of imminent deterioration.
The proposed method for fault identification in lithium-ion batteries represents a practical and efficient alternative for improving anomaly detection during cycling tests. This method not only enables a more precise evaluation of the voltage signal but also facilitates the real-time detection of irregular patterns, which is crucial for preventing catastrophic failures in industrial and energy storage applications. It was observed that the primary periodicity of the signal follows a decreasing trend as the battery undergoes progressive capacity loss, reinforcing the effectiveness of the proposed method for early fault detection.
In practical applications, the proposed methodology relies exclusively on the execution of the digital filter, as the spectral analyses (FFT and CWT) are only required during the offline design stage to determine optimal filtering parameters. Once configured, the low-pass filter operates in real-time to process incoming voltage signals, enabling timely detection of anomalies within the processing capabilities of typical embedded platforms. Preliminary estimations indicate that, when implemented on mid-range embedded platforms such as ARM Cortex-M4 or M7 microcontrollers, the filtering operation can be executed in a few milliseconds per sample window, with memory usage typically under 64 KB and processor load remaining below 20% at 80 MHz. These values are indicative and may vary depending on sampling rate, optimization level, and system architecture. Nevertheless, they confirm the feasibility of deploying the method on resource-constrained embedded systems, including portable diagnostic units or IoT-based battery monitoring devices.
To the best of our knowledge, this study is among the first to employ a spectral-based approach combined with digital filtering for the early detection of voltage anomalies in lithium-ion batteries. As a future development, the integration of advanced artificial intelligence techniques, such as convolutional neural networks (CNNs) and hybrid models incorporating fuzzy logic, is proposed to enhance the automated identification of irregular voltage patterns. This integration could further improve the accuracy and robustness of the method, optimizing its capability to predict and diagnose faults under varying operating conditions. Additionally, extending the validation process with a more diverse set of experimental datasets is recommended to assess the adaptability of the proposed filtering technique across different battery types and real-world applications.
Supplemental Material
sj-docx-1-ren-10.1177_27533735251348274 - Supplemental material for Digital filtering-based method for fault identification in lithium-ion batteries
Supplemental material, sj-docx-1-ren-10.1177_27533735251348274 for Digital filtering-based method for fault identification in lithium-ion batteries by Mario Eduardo Carbonó dela Rosa, José Naycir, and Cesar Tortello in Renewable Energies
Footnotes
Acknowledgments
The authors express their gratitude to the Institute of Renewable Energy at the National Autonomous University of Mexico (UNAM) for its support. The contribution of Dr. Rocío Nava is also acknowledged for her valuable support during the development of this research. Special thanks are extended to SECIHTI and MINCIENCIAS for the doctoral scholarship granted. The authors also acknowledge the National Open and Distance University (UNAD) for its academic and research support. Additionally, they recognize NASA-PCoE for providing the battery cycling datasets used in this study.
Funding
The authors received no financial support for the research, authorship, and/or publication of this article.
Declaration of conflicting interests
The authors declared no potential conflicts of interest with respect to the research, authorship, and/or publication of this article.
Supplemental material
Supplemental material for this article is available online.
Author biographies
References
Supplementary Material
Please find the following supplemental material available below.
For Open Access articles published under a Creative Commons License, all supplemental material carries the same license as the article it is associated with.
For non-Open Access articles published, all supplemental material carries a non-exclusive license, and permission requests for re-use of supplemental material or any part of supplemental material shall be sent directly to the copyright owner as specified in the copyright notice associated with the article.