
Abstract
The use of electric vehicles in the mining sector aligns with the growing demand for tools that reduce energy consumption in productive processes. This study investigates how electric mining vehicles with vehicle-to-grid (V2G) technology can be integrated into power grids to improve system stability and frequency regulation. In the context of mining operations and the provision of auxiliary services (such as primary frequency regulation) to an interconnected electrical system, a regulatory framework that enables V2G integration should be established. This issue is addressed through a case study involving DIgSILENT PowerFactory simulations. The goal is to evaluate the productive process of a mine and the contribution of V2G technology to the primary frequency regulation of the electrical system under different scooptram integration parameters and battery electric trucks. This study also explores the challenges of V2G implementation in the absence of a regulatory framework. Different configurations of electric scooptrams and shovel that can affect frequency regulation are assessed. The obtained optimal configuration involves two truck loaders and three shovel loaders; the capacity of the current electrical infrastructure can support this configuration without affecting the capacity of the mine's electrical system. The simulations verify that applying V2G technology to mining vehicles helps stabilise the frequency of electrical systems and reduces the probability of component failure.
Keywords
Introduction
The mining sector is one of the most energy-intensive businesses globally (Aramendia et al., 2023). Most mining operations rely significantly on fossil fuels, including diesel, heavy oil fuels, and coal, for on-site power generation. Nevertheless, the mining industry can adopt environmentally friendly energy solutions (Igogo et al., 2022), including energy efficiency measures (Wang et al., 2020), energy recovery technologies (Chen et al., 2022), renewable energy sources (Vergara-Zambrano et al., 2022), carbon capture techniques (Punia, 2021), and electromobility (Prause and Dietz, 2022).
Electromobility plays a crucial role in the energy transition of the productive sectors of countries (Bompard et al., 2018) (Skrúcaný et al., 2019). Electromobility is being used in the transport sector, specifically terrestrial (Pietrzak and Pietrzak, 2020), maritime (Brenna et al., 2020), and aerial (Barzkar and Ghassemi, 2020) (Schäfer et al., 2019) applications. Its impact on the different means of transport is related to the application and the recharging infrastructure. The integration of electromobility into an electricity grid allows it to provide ancillary services for energy supply (Sevdari et al., 2022); enhance power system stability by adapting power, voltage, and electrical frequency values (Mejía et al., 2021); perform valley filling, load balancing, peak shaving, and harmonic filtering (Suh et al., 2022); and increase the resilience of the electricity grid (Mauricette et al., 2023) because of the fast responsiveness and high short-term power throughput of electromobiles.
Vehicle-to-grid (V2G) technology enables other uses of electric vehicles (EVs) when a power grid requires ancillary services (Bonsu, 2020). However, researchers must investigate the challenges hindering V2G technology, such as its high initial infrastructure investment, battery lifespan degradation, the need for better incentive regulations and policies for V2G use, and means of reducing system electric losses so that the electrical power of EVs can be efficiently injected to the grid (Hossain et al., 2023).
Several factors are contributing to the fact that grid-level energy demand is going to get more variable in the future, like climate change (Hernández et al., 2012), Plug-in Hybrid Vehicles (PHEV) or Electric Vehicles (EVs) (Elkamel et al., 2020), economic factors (Kaneko et al., 2020), Increased use of air conditioning equipment, water desalination system, electric heating (He et al., 2017), industrial process (Kumar et al., 2019).Frequency stability can be compromised by severe imbalances between generation power and demand, causing frequency variations beyond the admissible limits. Frequent stability may be necessary for transient instability and tiny disturbances (Aybar-Mejía et al., 2023). Strategies used to support grid stability and frequency regulation are demand response (Domínguez-Garabitos et al., 2022), automatic primary, secondary and tertiary control (Rajan et al., 2021), regulation with battery storage (Tan and Zhang, 2017). Figure 1 presents the system frequency response and time structure plot; in the exact figure, the system experiences a disturbance due to a load change at point 1 (P1), and point 2(P2) represents the lowest frequency (nadir) in the system. The gradient of the curve between (P1) and (P2) represents the Rate of Change of Frequency (RoCoF) and it is inversely correlated with the inertia constant. The point3(P3) represents the state that is achieved as a result of the governor control operation. The crucial metrics for analyzing the frequency response after a disturbance are the frequency at which it stabilises and the initial rate of change of frequency (RoCoF).

System frequency response and time structure plot.
The electrification of vehicles used in mineral extraction and mobilisation operations, mainly underground mining activities, is becoming increasingly prevalent in sustainable mining. This trend is driven by the need to mitigate GHG emissions and protect the environment. The environmental implications of EVs versus conventional vehicles are commonly assessed via comparative analyses of their GHG emissions (Dubov et al., 2020) (Salazar Restrepo, 2020) (Ullah et al., 2012) (Ertugrul et al., 2020) (Feng et al., 2016). The effects of these cars on an electrical grid network are evaluated by analyzing the grid using power flow simulations. This involves using different software tools, such as DIgSILENT and MATLAB, to investigate grid performance (Jensanyayut et al., 2020) (Ruiz Guzmán, 2017). Previous studies have explored the use of EVs and V2G technology in urban settings, such as companies, offices, and shopping centres. They have also examined the grid integration of wind and solar plants at the utility level. However, V2G use in electric mining vehicles for frequency regulation during operations has not been studied. This paper is an analysis of V2G implementation in mining operations using electric mining vehicles, specifically the potential of such vehicles to provide primary frequency regulation services to grids.
The main contributions of this article are as follows:
The impact of using several configurations of electrically powered trucks in the mining sector is assessed to identify the most suitable option for primary frequency regulation in power systems. The objective is to analyze V2G technology implementation in mining operations, specifically the potential of loading trucks to provide auxiliary services to grids, such as frequency regulation.
Section 2 discusses the proposed evaluation method for electric mining vehicles and frequency regulation. Section 3 presents the frequency regulation service. Section 4 explains the case study. Section 5 shows the results, and conclusions and future work are presented in Section 6.
Methodology
This article presents a methodology for evaluating the use of electric mining vehicles and the impact of frequency regulation as an auxiliary service. An analysis is performed to assess the effect of electric mining vehicles on a power system's frequency.
A viable EV solution that can effectively accommodate the prevailing conditions within a mine is developed. The devised system combines various categories of heavy EVs tailored to the specific activities conducted in a mining site. This methodology guarantees uniform material extraction and enables the efficient loading of trucks. Figure 2 shows the sequence of activities required to configure the fleet of electric mining vehicles providing the frequency response service to the system. The power flow conditions of the mine were simulated to determine the number of charging stations for mining trucks and mining shovels. The simulation involved different numbers of charging stations providing the mining vehicles necessary for mine operation, which was also evaluated. Interconnecting these electrical charging stations ensures that the current capacity that the current electrical conductors can withstand is not exceeded. The capital costs and rates of return of the possible configurations of electric chargers and electric mining vehicles that can be used for mining operation and primary frequency regulation were analyzed. A possible margin of primary regulation reserve from the batteries of electric mining trucks was selected. Then, the Dominican Republic sector was analyzed to obtain commercial values related to electric energy (megawatt-hour price and incentives for frequency regulation). The internal rate of return (IRR) was calculated by applying primary frequency regulation. In this methodology, special consideration was assumed for an electric mine in the Dominican Republic. Current regulations and the contract of the studied mine with the Sistema Eléctrico Nacional Interconectado (SENI) classify it as a low unregulated user (UNR; it is not qualified to inject into the grid and can purchase energy directly via special agreements from power generators without using an energy distribution system as an intermediary). This case study assumes that the mining company can change its role and become a self-producer under permissible conditions by regulating the Dominican Republic electricity sector, thus taking advantage of primary frequency regulation through batteries.

Process to evaluate the configuration of the fleet of vehicles that provide the frequency response service.
This comprehensive methodology guarantees strategic planning, regulatory compliance, and financial optimisation while ensuring efficient primary frequency regulation through energy storage systems.
The mine's existing electrical demand curve was analyzed to determine the required capacity of the electrical substation and the mine's feeder cables. The goal was to assess the potential impact of connecting the battery chargers for the proposed electric mining vehicles intended for material transportation within the mining site.
The DIgSILENT programme was used to simulate the diverse power flows (DIgSILENT GmbH, 2023) associated with numerous proposed configurations, including integrated electric mining vehicles. These proposals aim to ensure continuous mining operation by using a set of vehicles to transport raw materials within the mine and another set of vehicles to recharge their batteries.
Bidirectional flow analysis was performed to determine how V2G implementation in mining operations impacts frequency regulation as an auxiliary service. This study also examined the present state of electric mining vehicles globally, revealing that numerous countries and companies have committed to advancing and adopting this technology. Prominent companies, such as ABB, Epiroc, Sandvik, Bildem, Caterpillar, and Sany, are actively engaged in EV development and are promoting EV use in mining companies worldwide (BNamericas, 2022; Edición Revista Energía, 2021; Sánchez and Hartlieb, 2020).
V2G for frequency regulation
New strategies for efficiently running power systems will be introduced using V2G technology, which enables bidirectional power flow between an EV and a power grid (Rao et al., 2021). The concept of V2G relates to the ability of EVs to participate actively in power system control, such as in providing ancillary services. The ancillary services that V2G can provide are frequency regulation, voltage regulation, operating reserve, demand response, and renewable energy support (Wirasanti, 2019). Figure 3 shows a schematic diagram of a V2G charging station for EVs. It includes the EV conditions and battery charge status; the interaction of the bidirectional energy flow; the signals of the electrical market; and the electrical magnitudes, such as voltage (V), frequency (Hz), and the active, reactive, and apparent electrical power (W, VA, and VAr, respectively).

Schematic diagram of V2G charging station.
These ancillary services offered by EVs can be used in power systems through the control, management, and incentives that an electricity market grid allows to be developed between power generators, transmission and distribution grid operators, and end users. However, some constraints related to battery degradation, operational limitations, driving patterns, and regulatory signals limit EV use in such services (Tchagang and Yoo, 2020). Because the usage limitations of EVs prevent the use of their storage capacity during system and market operation, this availability has to be adjusted using a usage factor for modelling purposes.
Table 1 summarises the main specifications related to V2G use for frequency regulation. This table shows documents obtained from the IEEE, MDPI, ScienceDirect, and Scopus editorials, with the references filtered to documents published from 2018 to 2023 about V2G primary frequency regulation with batteries. Initially, with the date and ancillary services being the only criteria, this process yielded 689 papers. Filtered for the keywords V2G and frequency regulation, this selection was further narrowed down to 338 and then 62 publications, respectively. These 62 references were then analyzed in the context of the case study. Table 1 shows that the use of EV batteries for primary frequency regulation is being extensively studied. However, no examples or methodologies applied to underground mining or open-pit mining are identified. Therefore, the current study can continue strengthening the application of mobile batteries that can be used for primary frequency regulation, such as those in mining vehicles.
Studies on V2G use for frequency regulation.
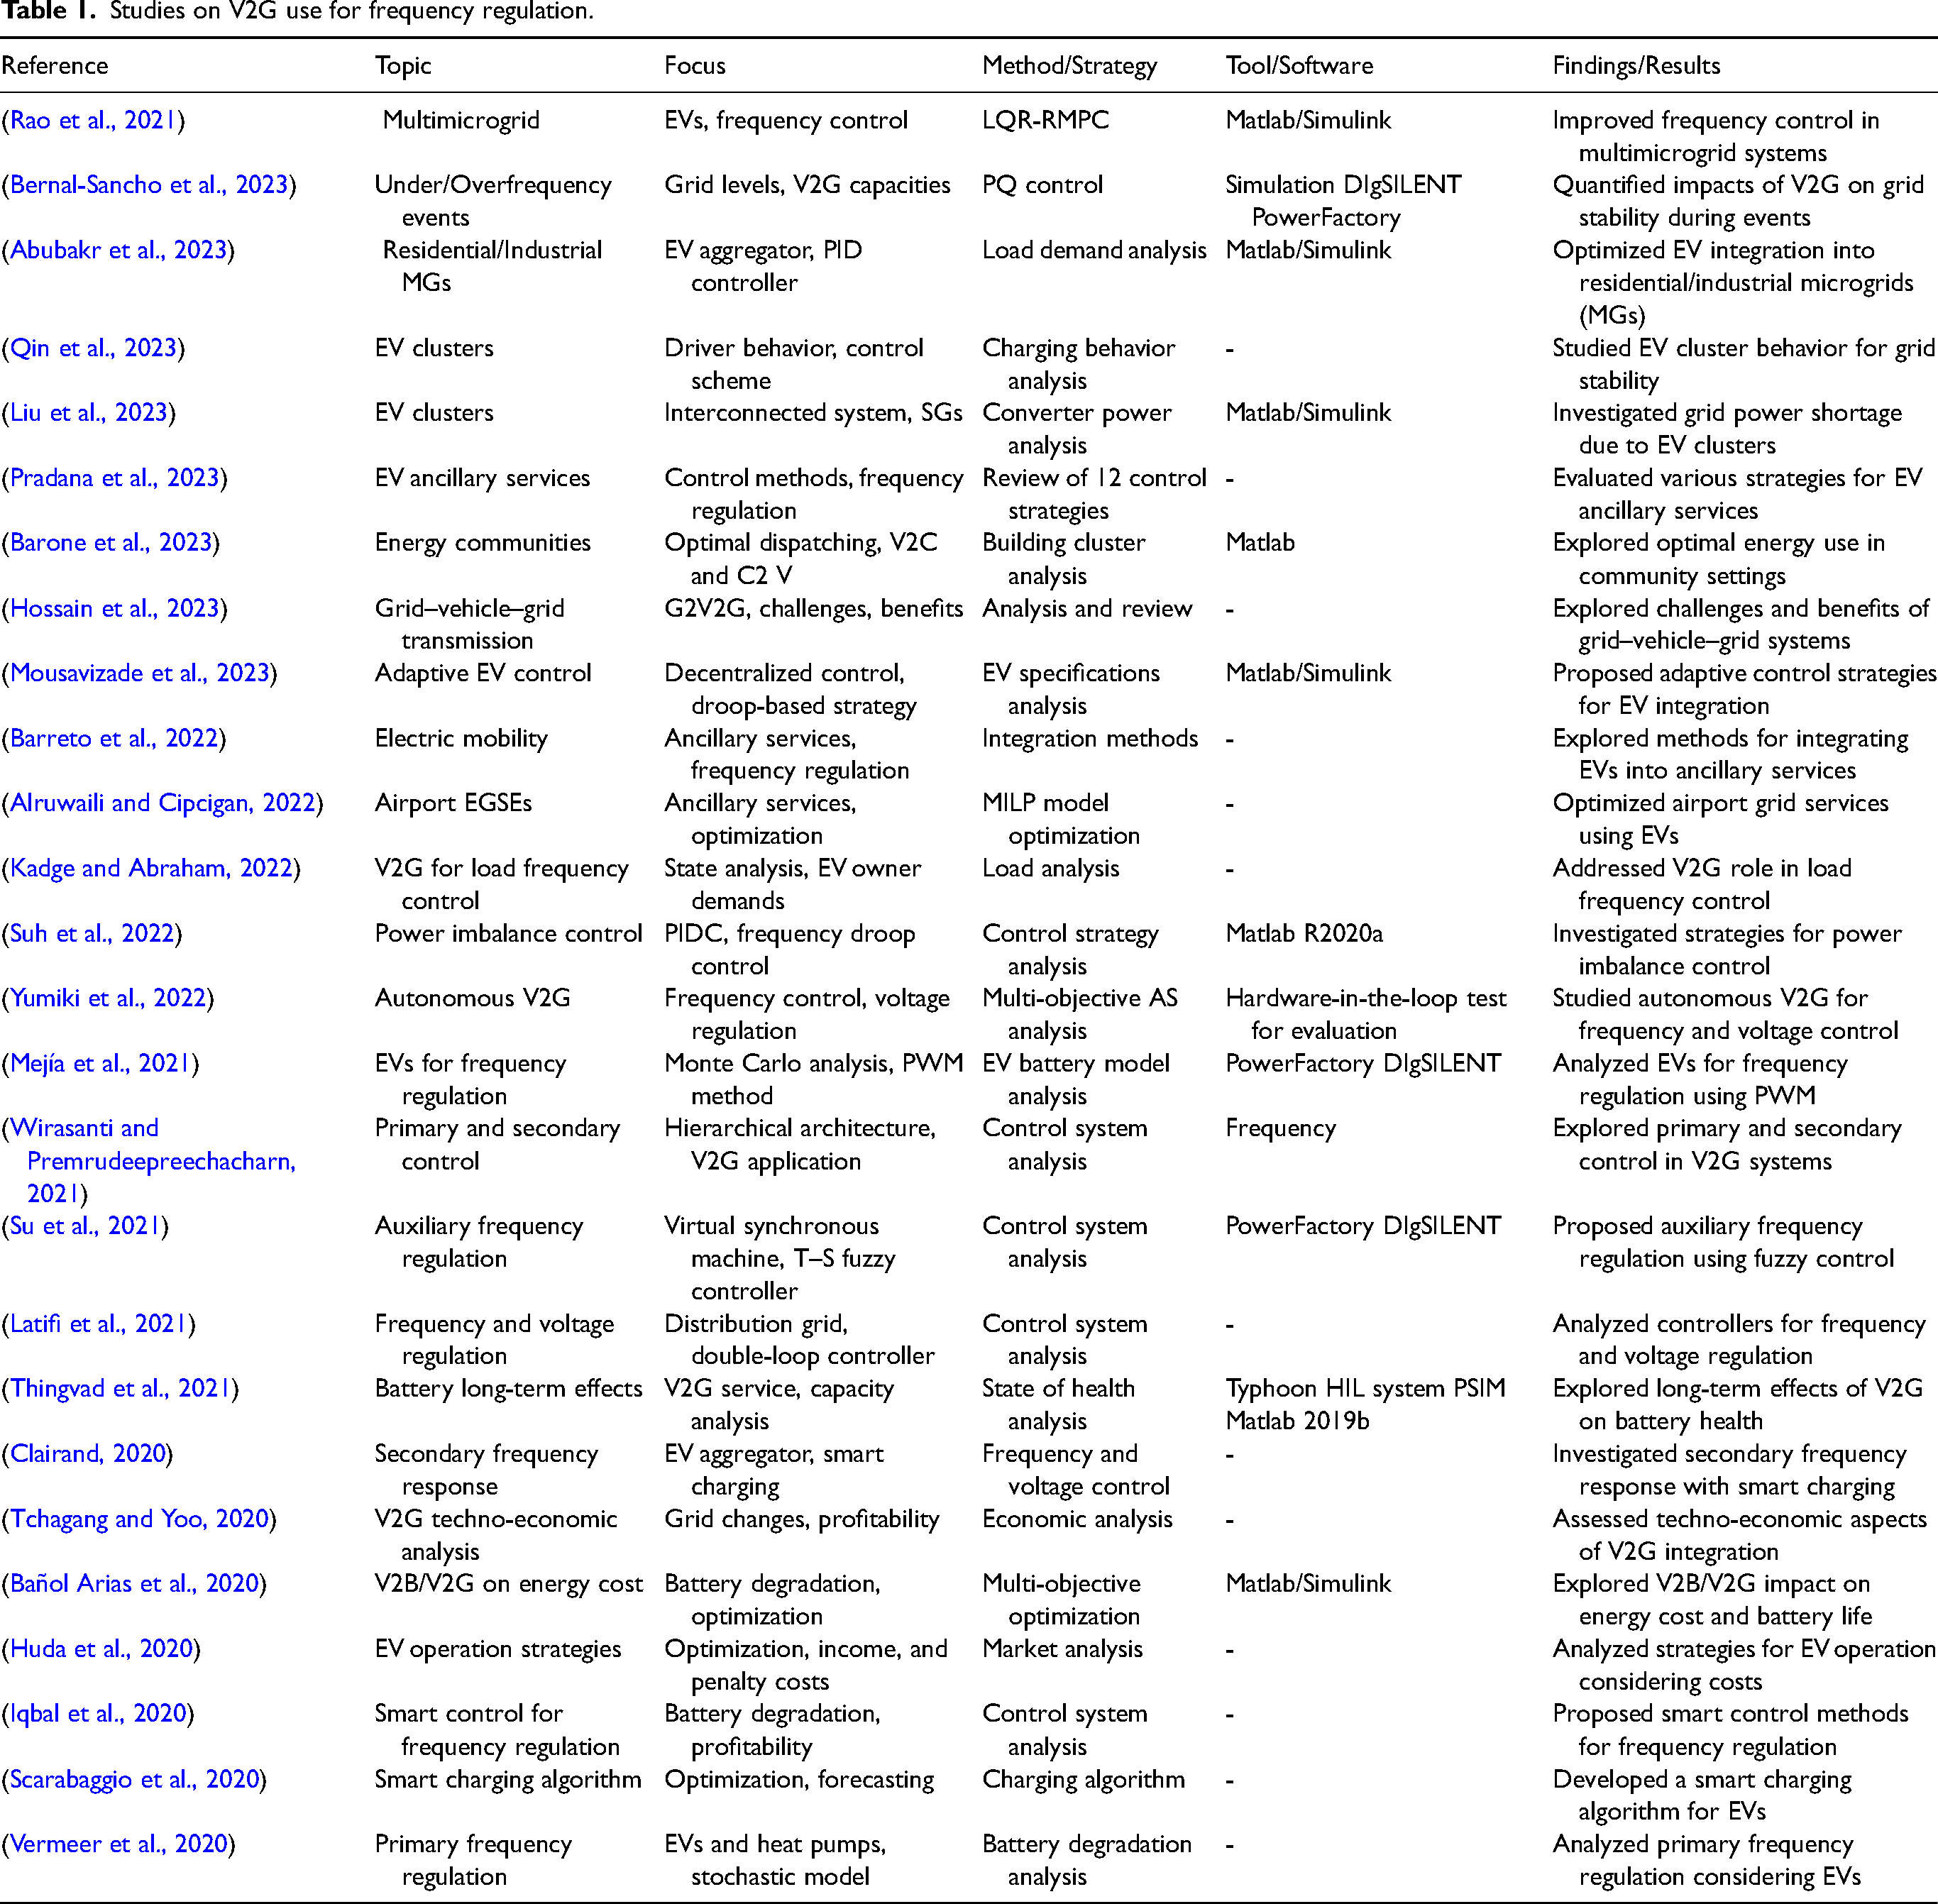
As seen in Table 1, EVs and their batteries can be a valuable resource for power grids. They can enhance stability and power management by regulating frequencies, controlling voltages, and helping provide auxiliary services.
Case study
Corporación Minera Dominicana (CORMIDOM) operates the Cerro de Maimón mine, Mining Block C1, Dominican Republic, where it extracts minerals, such as copper and zinc concentrate. CORMIDOM is a prominent mining company in the Dominican Republic. It has a concession of approximately 3400 ha and stands out for operating under the sustainability and social responsibility standards set forth in ISO 26000 (CORMIDOM, 2022). Figure 4 presents the location of the mine and its interconnection point to the electric grid.

Geographic visualisation of CORMIDOM in Cerro de Maimón in Dominican Republic.
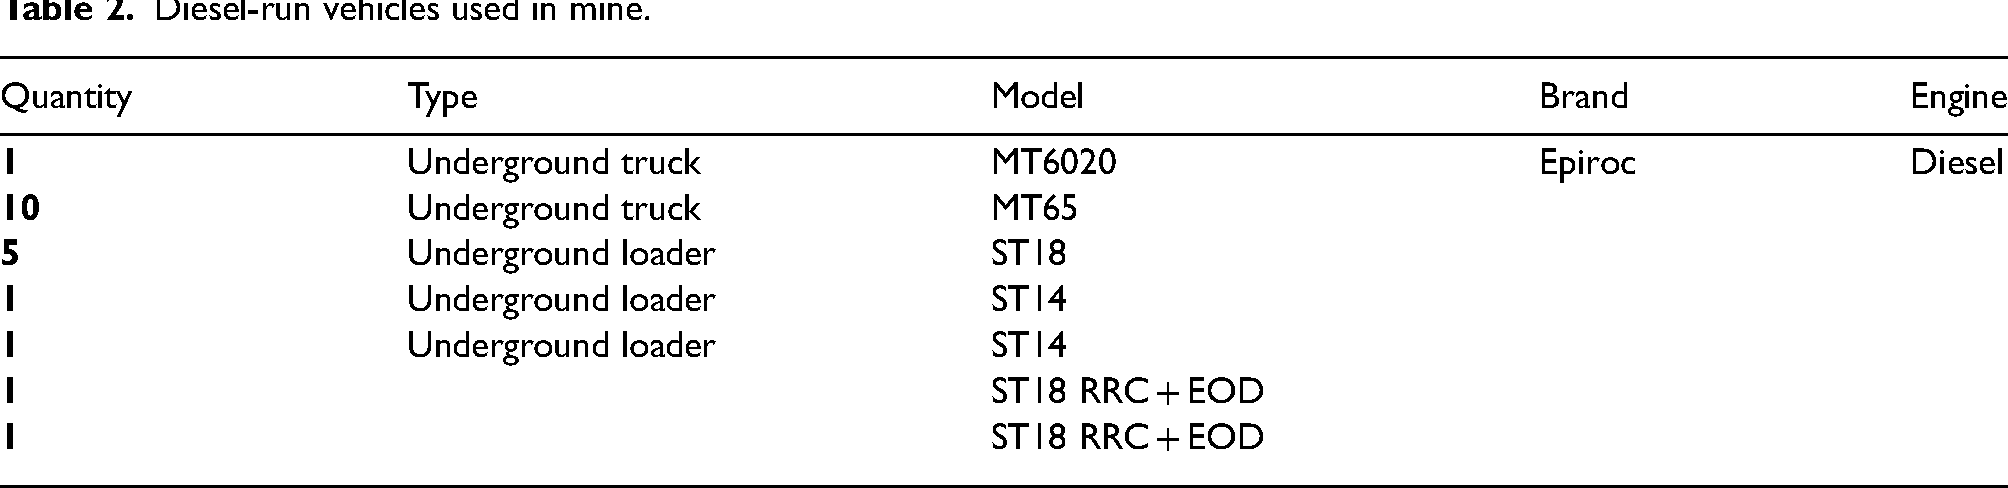
The technical specifications of each vehicle were reviewed to determine whether they were powered using diesel or batteries. The only diesel-powered vehicles were the underground trucks and underground loaders. Table 2 shows details about the vehicles used in the mine.
Diesel-run vehicles used in mine.
In general, the facility is connected to the SENI. This power grid, with a 14 MVA 69 kV/4.16 kV substation, supplies electricity to the entire country. As seen in Table 3, power flow analysis was conducted using the technical data of the mine to identify the maximum charging station capacity supported by the current mine infrastructure when different charging stations are installed for mining vehicles.
Required simulation data.

Rated voltage in kV, rated current in A, rated resistance in Ω/km, and rated power in MVA.
Power flow analysis was performed on the mine's electrical grid using DIgSILENT while adding truck and shovel loaders. For the analysis of vehicle electrical charging, the mine was considered to operate 24 h a day, 7 days a week. The charging of electric cars is limited from 6:00 to 8:30 AM and from 6:00 to 8:30 PM, during blasting. The best time to load the analyzed vehicles is when they are waiting to start work; 5 h per day was allocated to the loading of all vehicles, and the chargers for the scooptrams and trucks consumed 150 and 700 kW, respectively (Epiroc North Macedonia DOOEL, 2022) (Sandvik, 2022).
The hourly profiles of electrical demand classified by type day for each month of the mine were verified, as shown in Figure 5, to determine the number of battery chargers and the corresponding installed power. This figure shows the typical four-day behaviour of the mine. In May, the mine has a reduction in demand due to working conditions that reduce mine operation, thus affecting its demand.

Average daily electrical load curve per month.
Based on the analysis in Figure 5, this section examines a scenario where all chargers for the trucks and shovels are used simultaneously. The process involves the following steps:
Combined Power: The total power consumption of all chargers for the trucks and shovels is calculated, providing a comprehensive view of their energy usage. Isolated Charger Power: A graph (Figure 5) is used to identify the additional power contribution of the chargers. The aim is to isolate the power consumption in a typical mining scenario (without simultaneous charging), increasing the accuracy of cost estimation. Cost Calculation: The difference in power consumption is multiplied by the power price (approximately USD 14/kW) to determine the monthly increase in power cost due to simultaneous charging. This monthly increment is then multiplied by 12 to estimate the annual power charge for each configuration if all chargers were used simultaneously. Table 4 summarizes the annual power cost per configuration based on this analysis.
Annual power cost per configuration.

Current grid limitations
As mentioned in the power flow analysis, the current mine's electrical grid can only support one electric charging station for the trucks and three for the shovels. This limitation is factored into the calculation of the annual power charge (Equation 1).
Electric current of lines in proposed configurations.

Color code: Low loadability  , medium load capacity
  , high loadability
  , and very high load capacity
  .
.
The current electrical infrastructure of the mine will have to be modified to interconnect more charging stations for the electric shovels and trucks. This is why their number is restricted, but this does not limit the number of EVs that the mine can acquire for use in frequency regulation along with trucks that do not transport materials within the mine. These possible combinations were analyzed.
For the analysis of electrical demand in the mine, the operating time of the charger of the mining electric vehicles during operation was assumed and it was analyzed as the demand of the typical days (Organismo Coordinador del Sistema Eléctrico Nacional Interconectadoco, 2022a).
As for the locations of the electric charging stations, well-parked vehicles and those left inside the tunnels were considered because the other mining vehicles were assumed to be working inside the mine.
Figure 6 shows a single-line diagram of the mine with the proposed electric chargers for the shovels and trucks.

Mine electric grid configuration.
Case study: V2G for primary frequency regulation
In the Dominican Republic, according to Article 406 of the General Electricity Law 125-01 (Superintendencia de Electricidad [SIE], 2012), the compensation for primary frequency regulation is determined using Equation 2. This equation applies to conventional power generators (synchronous machines, turbomachines, internal combustion engines, and hydrogenerators, with assumptions in the variable production cost component) and batteries. Note: The role of CORMIDOM was changed from UNR to self-producer so that Equation 2 can be adapted to the case of the company. Additionally, a variable cost of production equal to zero was proposed, similar to the treatment considered for hydroelectric plants that provide this service. These considerations were necessary because thermoelectric generation provides the service exclusively in the initial regulatory conception.
Some EVs were assumed to participate in the loading and transportation operations of the mined material, and the rest were assumed available to provide the primary frequency regulation service to the electrical system. Table 6 presents the technical and economic parameters for the selected scenario: the power of each charger, the quantity of each charger type, the battery efficiency of the scooptrams and electric trucks, the power used for V2G, transformation losses, estimated daily charging hours, the investment payment, and the interest rate published by the central bank of the Dominican Republic. The simulated V2G power is equivalent to 20% of the battery capacity of the scooptrams and trucks.
Technical and economic parameters assumed for primary frequency regulation.

Economic analysis of 2 s in configuration with two truck loaders and three shovel loaders.

− indicates a projected investment loss that will be recovered in the long term.
For the calculation of the daily incentive, the reserve power that is left in the battery for V2G is multiplied by (the relationship between the power chargers, number of used loaders, and a 20% factor of the capacity of the total storage system), the time daily battery charge, the day of the month, internal rate, and the electric demand MW. The marginal cost was calculated based on values published by the coordinating agency in a long-term market study. Total income was the sum of income earned for encouraging more frequency regulation incentives. Given the total income, the IRR was calculated. This study demonstrates that investment becomes more profitable when primary frequency regulation is offered alongside a transition from conventional mining vehicles to electric mining vehicles.
Calculations for most efficient configuration This study investigates several configurations for incorporating electric mining vehicles into primary frequency regulation. Emphasis is primarily on a scenario involving two loader trucks and three loader shovels despite the presence of various other V2G implementation alternatives. The selected layout uses twice the number of trucks usually needed for mining operations. Nevertheless, this seeming surplus of capacity serves two purposes:
Including extra trucks guarantees uninterrupted operation, even during maintenance intervals. This prevents periods of inactivity and ensures operational efficiency. The enhanced capacity enables efficient primary frequency regulation within the electrical system by optimizing frequency regulation.This scenario is the basis for estimating the ideal quantity of loaders required for combined mining and frequency regulation. Analysis of Investments and Returns The case study examines the upfront investment needed to accomplish primary frequency regulation using mining trucks by 2024. The projected cost amounts to USD 2188 million (MM USD). During a 16-year operation period, the estimated revenue from frequency regulation incentives is USD 3.30 million (MM USD), leading to an IRR of 1.41%. This scenario exemplifies the possible viability of a self-producing mine that utilizes its EV batteries to stabilize the grid and generate revenue. The power system software DIgSILENT was used to evaluate the power flows and demand surges, depending on the type of electric loader considered to maintain the mine's electrical system specifications. The evaluated configurations were as follows: one truck loader and one shovel, one truck loader and two shovels, one truck loader and three shovels, one truck loader and four shovels, two truck loaders and one shovel, two truck loaders and two shovels, two truck loaders and three shovels, and two truck loaders and four shovels. The system configuration with two truck loaders and three shovels presents the best results. Once the maximum capacity of the loaders supporting the mine's power lines was selected, subscenarios were developed. These were combinations of possible quantities of trucks and electric shovels that can be used to maintain the mine's operation while enabling equipment use for primary frequency regulation, thus achieving favorable rates of return for the proposed system.
Results
Table 7 shows the economic analysis of the selected configuration (two electric truck loaders and three shovel loaders) and its subscenarios. It shows the IRR if the mine purchased trucks and shovels for mining work exclusively and the IRR if the same number of EVs were used for primary frequency regulation.
The simulations reveal that an increase in EV usage leads to a corresponding increase in the mine's primary frequency regulation activity. However, this also results in higher capital expenses for EV development and potential system changes. Table 6 presents some scenarios to verify how the lowest frequency change of the transitory period (
As shown in Table 8 and Figure 7, in all subscenarios, as the storage capacity is increased using the EVs as primary frequency regulation elements, they respond to system frequency changes. This demonstrates the correlation between the dynamic behavior that the system frequency and the action of the V2G system of mining vehicles can have as primary frequency regulatory elements.

Summary graph covering 2 s of configuration with two truck loaders and three shovel loaders using V2G.
Nadir (Hz) results for 2 s in configuration with two truck loaders and three shovel loaders.

The slope of the system frequency graph decreases as the numbers of charges and electric mining trucks increase, regardless of the simulation time or the event causing the system frequency decline. Thus, as the number of electric mining vehicles increases, the frequency decreases within the same period.
These results demonstrate the significant influence of frequency regulation on the stability of the interconnected electricity system. The system frequency levels are enhanced by increasing its resistance to major failures and prolonging its ability to withstand restrictions or events. This improves system stability and reduces the likelihood of power system component failures.
Conclusion and future works
Simulations in different settings consistently show a decrease in the time to system failure. This results in improved stability for the interconnected electricity system of the Dominican Republic. The mean lowest frequency observed across the simulations is approximately 59.70642 Hz, suggesting high stability. V2G technology with EV batteries can further enhance this stability, particularly with the integration of more renewable energy sources with variable generation.
This study reveals notable benefits of V2G technology for the electrical grid of the Dominican Republic. The simulations demonstrate that the use of V2G technology gives the system additional time (16.7486 μs) to react to disturbances, such as faults and power ramps. This enhances system robustness.
In addition to basic frequency regulation, V2G technology can provide virtual inertia. This system plays a vital role in maintaining power supply during breakdowns or fluctuations in renewable energy generation, hence reducing the impact of wind and solar variability.
A key finding of this research is the absence of a regulatory structure for incorporating V2G technology with primary frequency regulation in the Dominican Republic. This impedes the full use of V2G and the smooth incorporation of renewable energy sources. The anticipated growth of EVs across industries will further enhance the robustness of the SENI. However, the lack of a V2G framework remains a significant obstacle. Further studies are needed to assess energy policies that enable UNR with battery storage to participate in the grid and obtain incentives linked to primary frequency regulation.
Footnotes
Acknowledgements
The authors acknowledge the support provided by Organismo Coordinador de Sistema Electrico Nacional Interconectado (OC) and Empresa de Transmisión Eléctrica Dominicana (ETED) for the information about the behaviour of the National Electrical System Interconnected (SENI) in frequency and load disturbances. Also the Corporación Minera Dominicana (CORMIDOM), Empresa Generadora de Electricidad Haina S.A (EGEHAINA) suport simulation DigSilent, and finally acknowledge to thematic Network 723RT0150 “Red para la integración a gran escala de energía renovables en sistemas eléctricos (RIBIERSE-CYTED)”.
Credit author statement
Declaration of competing interests
The authors declare that they have no known competing financial interests or personal relationships that could have appeared to influence the work reported in this paper.
Declaration of conflicting interests
The authors declared no potential conflicts of interest with respect to the research, authorship, and/or publication of this article.
Ethics statements
The authors declare that they did not conduct human or animal studies. The authors declare that they did not collect social media data and did not need permission to use the primary data.
Funding
The authors received no financial support for the research, authorship, and/or publication of this article.