
Abstract
Addressed in this investigation was a comparison of Algebra I End-of-Course exam performance between Hispanic girls who were at-risk and Hispanic girls who were not at-risk in the 2016–2017, 2017–2018, and 2018–2019 school years. The dependent variables investigated in this study were Hispanic girls performance in the Approaches Grade Level standard, the Meets Grade Level standard, the Masters Grade Level standard, and raw score on the Algebra I End-of-Course exam. Inferential statistical procedures yielded statistically significant differences in all three school years for Hispanic girls who were at-risk. In all three school years, Hispanic girls who were at-risk failed to meet each of the three grade level standards at statistically significantly lower rates than Hispanic girls who were not at-risk. In raw score comparison, Hispanic girls answered more than 11 items, on average, less correctly than Hispanic girls who were not at-risk. Implications and recommendations for future research were made.
Keywords
Introduction
Background
Federal education legislation such as The Elementary and Secondary Education Act of 1965 (United States, 1965), The No Child Left Behind Act of 2001 (2002), and, most recently, the Every Student Succeeds Act of 2015 (2015) have placed a clear focus on student academic achievement and accountability for all students. Consequently, educational leaders have placed a clear emphasis on reducing academic disparities between student subgroups enrolled in public schools (Fraga & Slate, 2020). Race/ethnicity is one such subgroup of student in which evident disparities are present.
According to the National Center for Education Statistics (2022b), about 13.8 million Hispanic students were enrolled in public schools in 2020 across the United States. This figure comprising 28% of student enrollment in public schools reflects a substantial increase from the 11 million Hispanic students who were enrolled in public schools in the United States in 2009. At that time, Hispanic students were 22% of the student population (National Center for Education Statistics, 2022b).
Mathematics performance of Hispanic students
According to the National Center for Education Statistics (2022b), Hispanic students are much less likely to pass mathematics courses at age 9, 13, and 17 than are White students of the same ages. Student progression through mathematics courses in high school is viewed as an indicator for postsecondary readiness (Taube & Jasper, 2009). Students who cannot pass a lower-level course such as Algebra I often times cannot have access to more advanced mathematics coursework which leads to a disadvantage in postsecondary readiness. Many students have to repeat Algebra because they are not exposed to many algebraic thinking and problem solving skills while in elementary and middle school (Sawchuk, 2018). These skills are critical to success later on in Algebra I.
The achievement gap is prevalent for racial/ethnic subgroups and by gender. At the national level, boys have higher college readiness rates in mathematics than do girls (Combs et al., 2010). Moore et al. (2012) established that boys performed statistically significantly better on most Advanced Placement exams than girls. Numerous researchers (e.g., Combs et al., 2010; Moore et al., 2012; Texas Education Agency, Department of Research and Analysis, 2020) have documented that boys perform better than girls on such national exams such as Advanced Placement, SAT, and ACT, particularly in the area of mathematics.
Mathematics performance of Hispanic girls
The focus of this article is on Hispanic girls and their mathematics achievement levels. Hispanic girls in the United States are not closing the existing achievement gaps. The National Assessment of Educational Progress, administered every two years to students in Grades 4, 8, and 12 (National Center for Education Statistics, 2022a), reported that assessment results for 2019 for Hispanic girls have decreased since 2013. Raw scores for Hispanic girls were at the highest achievement level since the assessment began in 1990 with a raw score of 284 in 2013. This score is below the cut score of the Proficient level. Since 2013, Hispanic girls have performed the same but lower than the high point in 2013 (i.e., 282 in 2015, 282 in 2017, and 282 in 2019). The performance of Hispanic girls on this assessment has either decreased or remained the same for the last four assessments (National Center for Education Statistics, 2022a). Clearly, the achievement gap in mathematics has not narrowed for Hispanic girls.
Mathematics performance of Hispanic students in Texas
With respect to the state of interest for this article, Texas, the Texas Education Agency reported data from the 2020–2021 school year that 52.9% of the student enrollment, or 2,840,982 students, were Hispanic (Texas Education Agency, 2022). An achievement gap between White and Hispanic students in Texas is present in early grade levels. In a multiyear, Texas statewide investigation, Rojas-LeBouef (2010) identified the presence of an achievement gap in Grade 5 after an analysis of 16 years (i.e., 1993–2009) of data of Hispanic student performance on the state-mandated mathematics assessment. In the 16 years examined, Hispanic students met the state-designated cutoff score of 82.44% compared to a state-designated cutoff score of 90.2% for White students. Hispanic students underperformed White students on the Texas state-mandated mathematics exam over a 16-year period by an average of almost 8 percentage points (Rojas-LeBouef, 2010). The achievement gap for Hispanic students compared to White students is well-established before students begin secondary education courses.
In a similar Texas investigation, Craft (2011) analyzed statewide data for seven consecutive school years (i.e., 2003–2004 through 2009–2010) on Grade 8 students. Craft (2011) documented that Hispanic students performed lower that the state expectations in all seven school years. The average passing rate of Hispanic students was 66.3% compared to an average passing rate of 81.11% for White students. Hispanic students underperformed White students on the Grade 8 state-mandated mathematics exam in over seven consecutive school years by more than 15 percentage points (Craft, 2011). Since the No Child Left Behind Act of 2002, the achievement gap has increased from Grade 5 to Grade 8 between Hispanic and White students in Texas (Craft, 2011; Rojas-LeBouef, 2010).
Texas state-mandated mathematics assessments
With respect to the focus of this article, the State of Texas Academic Assessment of Readiness (STAAR) End-of-Course exams are administered in five content subjects (i.e., English I, English II, Biology, United States History, and Algebra I) (Texas Education Agency, 2018b). The End-of-Course exam of relevance to this study is the Algebra I End-of-Course exam. It is one of the five content exams all students must pass in order to complete graduation requirements. Three measures are present in this exam and in all of the End-of-Course exams: Approaches Grade Level, Meets Grade Level, and Masters Grade Level. According to the Texas Education Agency (2017), students who perform at the Approaches Grade Level standard are likely to succeed with targeted interventions; students who perform at the Meets Grade Level standard have a high probability of success in the next grade or course with some targeted interventions; and students at the Masters Grade Level standard are expected to succeed in the next grade or course with no interventions.
The Texas Education Agency (2019) reported that Hispanic students underperformed White students on the Approaches Grade Level standard, the Meets Grade Level standard, and the Masters Grade Level standard on the Algebra I End-of-Course exam. The percentage of Hispanic students who met the Approaches Grade Level standard was 83%, compared to 89% of White students who met this standard. The percentage of Hispanic students who met the Meets Grade Level standard was 46%, compared to 58% of White students who met this standard. The percentage of Hispanic students who met the Masters Grade Level standard was 34%, compared to 44% of White students who met this standard (Texas Education Agency, 2019). With respect to gender and Algebra I End-of-Course exams, the Texas Education Agency reported in the spring of 2019 that 88% of girls met the Approaches Grade Level standard; 67% of girls met the Meets Grade Level standard; and 44% of girls met the Masters Grade Level standard.
In this article, the subgroup of students of interest are students determined to be at-risk. The Texas Education Agency defines a student at-risk if that student meets one or more of the 13 categories that make that student more likely to drop out of school. The 13 categories of the at-risk label for students in Texas are listed on the Texas Education Website. Some of the categories directly related to academics are: (a) unsatisfactory performance on readiness assessments in Grades 1, 2, or 3, (b) failed credit in two or more subjects in Grades 7–12, (c) was not advanced to the next grade level for one or more school years, and (d) unsatisfactory performance in same content assessment instruments for two or more consecutive school years (Texas Education Agency, 2022).
The presence of achievement gaps and higher at-risk status for Hispanic students than other subgroups are well documented by researchers (Kent et al., 2017; Kim et al., 2015; Texas Education Agency, 2019). After an intensive search of the existing research literature, no published articles could be located in which the state-mandated Algebra I End-of-Course exam for Hispanic girls who were at-risk was addressed. Findings from this multiyear, empirical analysis will help fill the existing gap in the research literature.
Statement of the problem
Hispanic student enrollment has increased in most high schools in Texas in the past two decades (Texas Education Agency, 2022). Researchers (e.g., Anderson et al., 2007; Craft, 2011; David & Marchant, 2015; Slate, 2023) have documented the presence of achievement gaps between Hispanic students and White students. Closing achievement gaps in public education remains a priority among high schools. Addressed in this investigation was the performance of Hispanic girls by their at-risk status on the Texas state-mandated Algebra I End-of-Course exam. This state-mandated mathematics assessment is regarded as a measure of mathematics college-readiness. As such, any gaps present in mathematics achievement would be an indicator of a lack of being college-ready in mathematics.
Purpose of the study
The purpose of this article was to determine the extent to which the at-risk status of Hispanic girls was related to their performance on the Texas state-mandated Algebra I End-of-Course exam. Specifically examined was the degree to which the at-risk status of Hispanic girls is related to their performance on three grade level standards (i.e., Approaches Grade Level, Meets Grade Level, and Masters Grade Level) and raw score. Algebra I End-of-Course exam results were analyzed for the 2016–2017, 2017–2018, and 2018–2019 school years. These school years were selected because they are the three school years prior to the Covid-19 pandemic. As such, our findings can serve as a baseline and comparisons for researchers who analyze data after the pandemic. Following analyses of data from each school year, the extent to which trends were present across these three school years was addressed.
Significance of the study
This study was conducted to add to the existing research literature available on the Algebra I End-of-Course exam Grade Level performance between Hispanic girls who were labeled at-risk and Hispanic students who were not labeled at-risk. Findings from this multiyear analysis provide a potential baseline of Hispanic girls Algebra I End-of-Course exam performance before the 2020 COVID-19 Pandemic. Few researchers have examined the degree to which Hispanic girls who were labeled at-risk differ in their performance on the Texas state-mandated Algebra I End-of-Course exam. Information from this multiyear analysis could be used to generate instructional programs to reduce the achievement gaps present for Hispanic girls determined to be at-risk. Moreover, results from this investigation can serve as a baseline for the mathematics college-readiness of Hispanic girls.
Research questions
The following overarching research question was addressed in this study: What is the effect of the at-risk status of Hispanic girls on their Algebra I End-of-Course exam performance? Sub-questions under this overarching research question were: (a) What is the effect of the at-risk status of Hispanic girls on their Algebra I End-of-Course Approaches Grade Level performance? (b) What is the effect of the at-risk status of Hispanic girls on their Algebra I End-of-Course Meets Grade Level performance? (c) What is the effect of the at-risk status of Hispanic girls on their Algebra I End -of-Course Masters Grade Level performance? (d) What is the effect of the at-risk status of Hispanic girls on their Algebra I End-of-Course exam raw score? (e) What trend is present in the performance of Hispanic girls on the Algebra I End-of-Course grade level standards over a three year period? The first four questions were addressed separately for three school years (i.e., 2016–2017, 2017–2018, and 2018–2019) and the fifth research question involved data from all three school years.
Method
Research design
A causal-comparative research design (Johnson & Christensen, 2020) was present in this multiyear analysis. In this study, the independent variable was the at-risk status of Hispanic high school girls in the State of Texas. Dependent variables were student performance on the Algebra I End-of-Course exam: (a) Approaches Grade Level standard, (b) Meets Grade Level standard, (c) Masters Grade Level standard, and (d) raw score for the 2016–2017, 2017–2018, and 2018–2019 school years. In a causal-comparative research design, pre-existing data are analyzed. These data were obtained from the Texas Education Agency Public Education Information Management System (Texas Education Agency, 2018a).
Participants and instrumentation
Participants in this study were Hispanic high school girls in Texas who took the Algebra I End-of-Course exam in the 2016–2017, 2017–2018, and 2018–2019 school years. The data that were analyzed herein were previously obtained from the Texas Education Agency Public Education Information Management System database for the Algebra I End-of-Course exam that was administered during the 2016–2017, 2017–2018, and 2018–2019 school years. A Public Information Request was previously submitted to and was fulfilled by the Texas Education Agency to obtain the data. Datasets requested and obtained were for: (a) gender, (b) ethnicity/race, (c) Grade Level, (d) Algebra I End-of-Course Grade Level standards, (e) raw score, and (f) at-risk indicator. Upon receipt, the data were then imported into the Statistical Package for Social Sciences software program (SPSS) for analysis (Field, 2009).
The sample sizes of Hispanic girls who were determined to be at-risk were 41,570 in the 2016–2017 school year; 46,514 in the 2017–2018 school year; and 42,279 in the 2018–2019 school year. With respect to the sample sizes of Hispanic girls who were not identified as being at-risk, 27,772 were present in the 2016–2017 school year; 27,687 in the 2017–2018 school year; and 25,127 in the 2018–2019 school year. Readers should note that the numbers of Hispanic girls who were identified as meeting the criteria for being at-risk were substantially larger than the numbers of Hispanic girls who did not meet the at-risk criteria.
Performance on the STAAR Phase-in standards was examined by at-risk status. The Texas Education Agency (2022) defines at-risk status as any student that meets one or more criteria in 13 categories that are predictive of students dropping out of high school. The 13 categories are: (a) unsatisfactory performance on readiness assessments in Grades 1, 2, or 3, (b) failed credit in two or more subjects in Grades 7–12, (c) was not advanced to the next grade level for one or more school years, (d) unsatisfactory performance in same content assessment instruments for two or more consecutive school years, (e) is pregnant or is a parent, (f) has been placed in an alternative education program, (g) has been expelled, (h) is currently on parole, probation, or conditional release, (i) was previously labeled as dropped out of school via the Public Education Information Management System, (j) is a student of limited English proficiency, (k) is in the custody or care of the Department of Protective Services, (l) is homeless, or (m) is or has been in the previous school year residing in a residential placement facility, detention facility, or substance abuse facility (Texas Education Agency, 2022).
Assessed by the Algebra I End-of-Course exam are three categories for performance. In the Approaches Grade Level Category: Performance in this category indicates that students are likely to succeed in the next grade or course (Texas Education Agency, 2022). Performance at the Meets Grade Level Category indicates students have a high probability of academic success in the next grade or course (Texas Education Agency, 2022). Students may still need some type of short-term and targeted academic intervention. In the Masters Grade Level Category: Performance in this category indicates that students are expected to succeed in the next grade or course. Students who perform within this category need very little to no academic intervention (Texas Education Agency, 2022). Students in this category demonstrate the ability to think critically and apply the assessed knowledge and skills in varied contexts, both familiar and unfamiliar (Texas Education Agency, 2022). According to the Texas Education Agency (2022), raw score performance on the End-of-Course exams demonstrate the number of items answered correctly.
Data analysis
To ascertain whether differences were present in the Algebra I End-of-Course exam performance (i.e., Did Not Meet, Met) at the Approaches Grade Level standard, Meets Grade Level standard, and Masters Grade Level standard between Hispanic girls who were not labeled at-risk and Hispanic girls who were labeled at-risk, Pearson chi-square analyses were conducted. Pearson chi-square procedures are the most appropriate statistical procedure to use when the independent variable and dependent variables are dichotomous. Accordingly, chi-squares are the statistical procedure of choice when both variables are categorical (Slate, 2023). Prior to calculating Pearson chi-square procedures, its underlying assumptions were checked. Given the large sample size and data independence, these assumptions were met. For all chi-squares that are statistically significant, their effect sizes will be reported. Cramer's V, the effect size metric for this procedure, reflects the percent of variance in the dependent variable that is explained by the independent variable (Slate, 2023).
A different inferential statistical procedure was used for research questions dealing with raw score comparisons. These measures reflected the number of test items answered correctly. Accordingly, these values were interval/ratio in nature and merited a different procedure than the Pearson chi-square. For all raw score comparisons, independent samples t-tests were conducted. This inferential statistical procedure is appropriate when two groups are present for the independent variable (i.e., at-risk, not at-risk) and the dependent variable is at the interval/ratio level. Prior to calculating this procedure, its underlying assumptions were checked and were determined to have been met (Slate, 2023). For all t-tests that are statistically significant, their effect sizes will be reported. Cohen's d, the effect size metric for this procedure, reflects the difference between the means of the two groups of students (Slate, 2023). The larger the d value, the further apart the two groups are on their average performance on the measure.
Results
Results will be presented for the three grade level standards first for all three school years. Then the raw score comparisons will be discussed.
Approaches Grade Level results
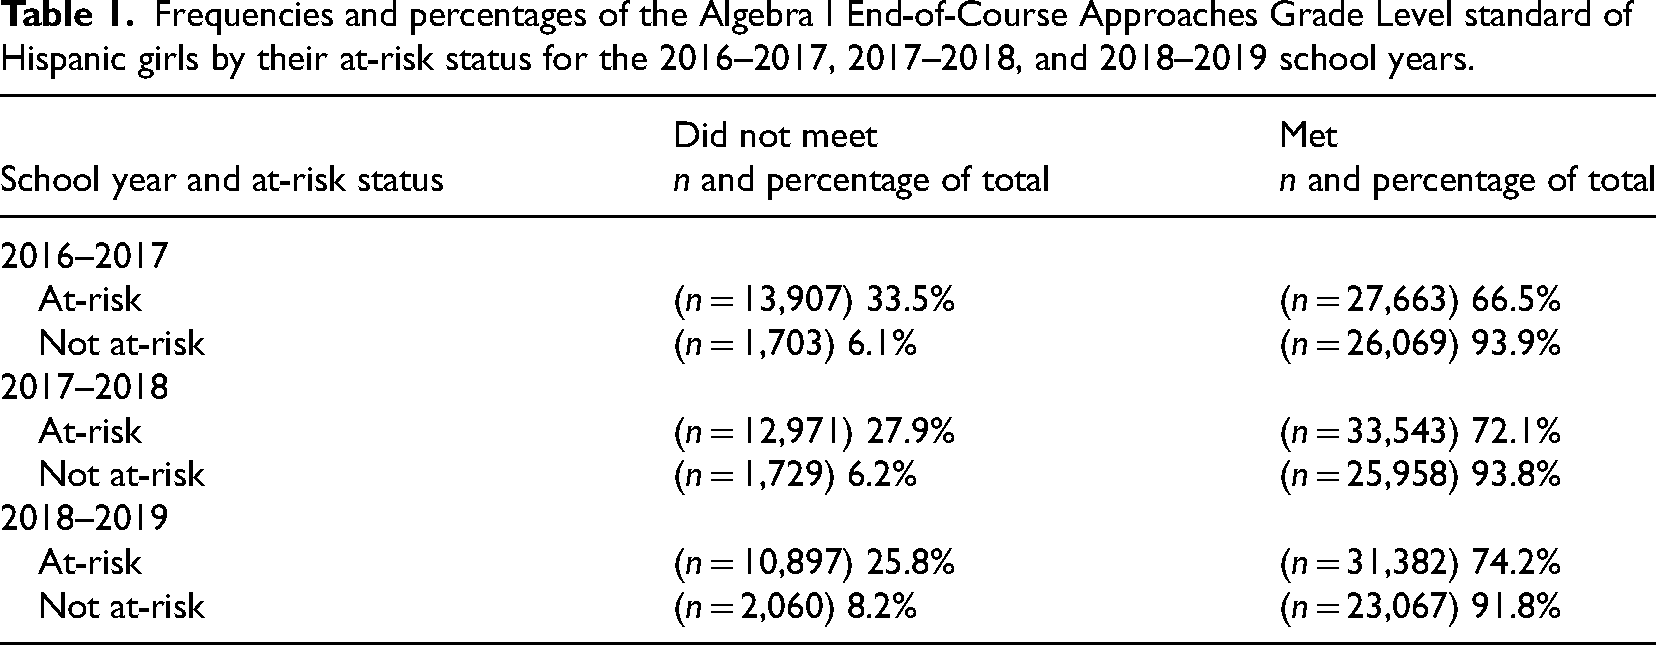
With respect to the first research question about the Algebra I End-of-Course Approaches Grade Level standard for the 2016–2017 school year, the result was statistically significant, χ 2 (1) = 7,124.98, p < .001. The effect size for this finding, Cramer's V, was moderate, 0.32 (Cohen, 1988). As revealed in Table 1, a statistically significantly higher percentage of Hispanic girls who were at-risk failed to meet the Approaches Grade Level standard than Hispanic girls who were not at-risk. Almost five and one half times the percentage of Hispanic girls who were at-risk did not meet this grade level standard than Hispanic girls who were not at-risk.
Frequencies and percentages of the Algebra I End-of-Course Approaches Grade Level standard of Hispanic girls by their at-risk status for the 2016–2017, 2017–2018, and 2018–2019 school years.
Frequencies and percentages of the Algebra I End-of-Course Approaches Grade Level standard of Hispanic girls by their at-risk status for the 2016–2017, 2017–2018, and 2018–2019 school years.
Regarding the Approaches Grade Level standard for the 2017–2018 school year, a statistically significant difference was yielded, χ 2 (1) = 5,116.81, p < .001. The effect size for this finding, Cramer's V, was small, 0.26 (Cohen, 1988). A statistically significantly higher percentage of Hispanic girls who were at-risk failed to meet the Approaches Grade Level standard than Hispanic girls who were not at-risk. Similar to the previous school year, the percentage of Hispanic girls who were at-risk and who did not meet the grade level standard was almost four and one half times more than the percentage of Hispanic girls who were not at-risk and who did not meet this grade level standard. Table 1 contains the descriptive statistics for this analysis.
Concerning the Approaches Grade Level standard for the 2018–2019 school year, a statistically significant difference was revealed, χ 2 (1) = 3,135.40, p < .001 Cramer's V of 0.22, a small effect size (Cohen, 1988). A statistically significantly higher percentage of Hispanic girls who were at-risk failed to meet the Approaches Grade Level standard than Hispanic girls who were not at-risk. The percentage of Hispanic girls who were at-risk and who did not meet this grade level standard was more than three times the percentage of Hispanic girls who were not at-risk and who did not meet this standard. Delineated in Table 1 are the descriptive statistics for this school year.
With respect to the second research question about the Algebra I End-of-Course Meets Grade Level standard for the 2016–2017 school year, the result was statistically significant, χ 2 (1) = 12,977.95, p < .001. The effect size for this finding, Cramer's V, was moderate, 0.43 (Cohen, 1988). As delineated in Table 2, a statistically significantly higher percentage of Hispanic girls who were at-risk, over 44 percentage points higher, failed to meet this grade level standard. The percentage of Hispanic girls who were at-risk and who did not meet this grade level standard was almost three times the percentage of Hispanic girls who were not at-risk and who did not meet this standard.
Frequencies and percentages of the Algebra I End-of-Course Meets Grade Level standard of Hispanic girls by their at-risk status for the 2016–2017, 2017–2018, and 2018–2019 school years.

Frequencies and percentages of the Algebra I End-of-Course Meets Grade Level standard of Hispanic girls by their at-risk status for the 2016–2017, 2017–2018, and 2018–2019 school years.
Regarding the Meets Grade Level standard for the 2017–2018 school year, a statistically significant difference was yielded, χ 2 (1) = 11,971.50, p < .001. The effect size for this finding, Cramer's V, was moderate, 0.40 (Cohen, 1988). A statistically significantly higher percentage of Hispanic girls who were at-risk failed to meet the Meets Grade Level standard than Hispanic girls who were not at-risk. The percentage of Hispanic girls who were at-risk and who did not meet this grade level standard was almost three times the percentage of Hispanic girls who were not at-risk and who did not meet this standard. Table 2 contains the descriptive statistics for this analysis.
Concerning the Meets Grade Level standard for the 2018–2019 school year, a statistically significant difference was revealed, χ 2 (1) = 8,168.38, p < .001 Cramer's V of 0.35, a moderate effect size (Cohen, 1988). A statistically significantly higher percentage of Hispanic girls who were at-risk failed to meet the Meets Grade Level standard than Hispanic girls who were not at-risk. The percentage of Hispanic girls who were at-risk and who did not meet this grade level standard was almost three times the percentage of Hispanic girls who were not at-risk and who did not meet this standard. Revealed in Table 2 are the descriptive statistics for this school year.
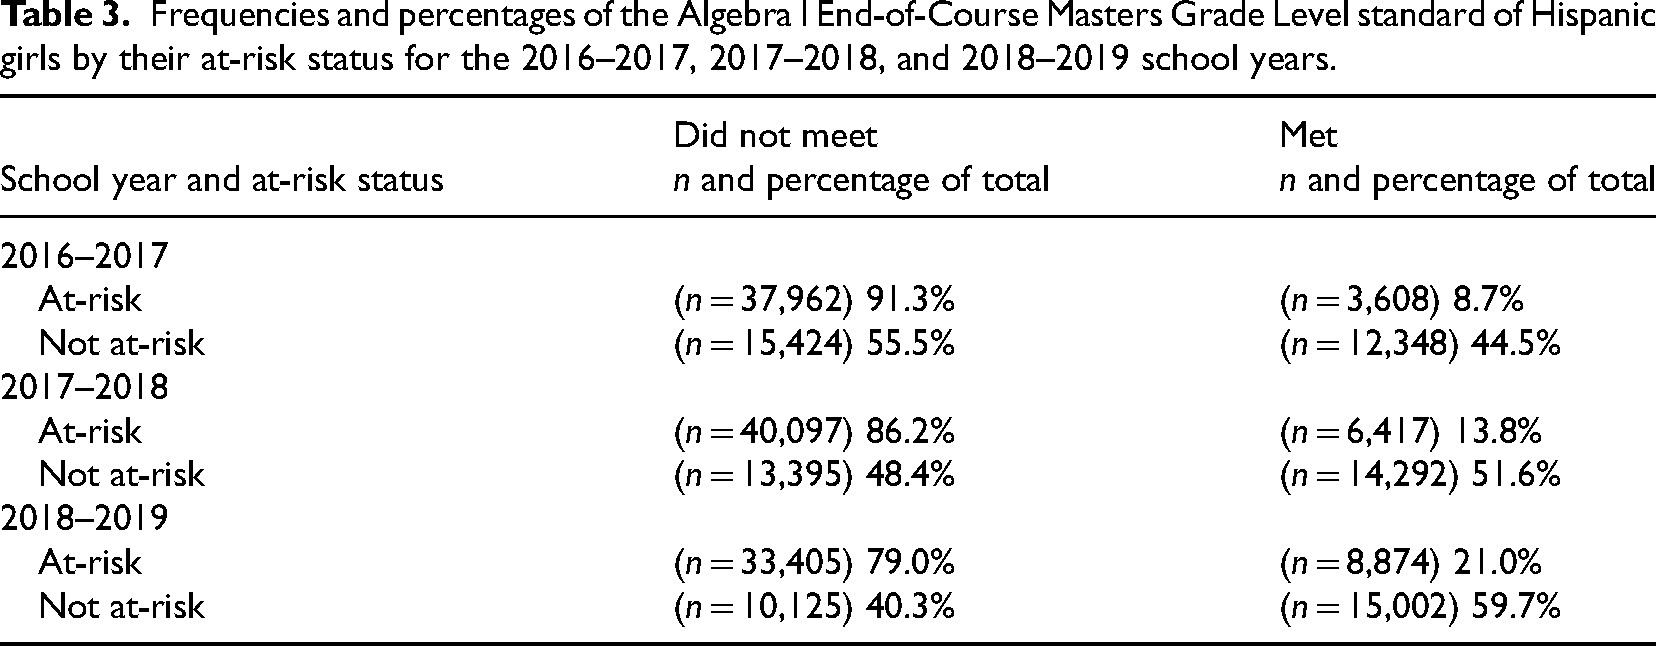
With respect to the third research question about the Algebra I End-of-Course Masters Grade Level standard for the 2016–2017 school year, the result was statistically significant, χ 2 (1) = 12,033.13, p < .001. The effect size for this finding, Cramer's V, was moderate, 0.42 (Cohen, 1988). As revealed in Table 3, a statistically significantly higher percentage of Hispanic girls who were at-risk, over 35 percentage points higher, failed to meet this grade level standard than Hispanics girls who were not at-risk. The percentage of Hispanic girls who were at-risk and who did not meet this grade level standard was more than one and one half times the percentage of Hispanic girls who were not at-risk and who did not meet this standard.
Frequencies and percentages of the Algebra I End-of-Course Masters Grade Level standard of Hispanic girls by their at-risk status for the 2016–2017, 2017–2018, and 2018–2019 school years.
Frequencies and percentages of the Algebra I End-of-Course Masters Grade Level standard of Hispanic girls by their at-risk status for the 2016–2017, 2017–2018, and 2018–2019 school years.
Regarding the Masters Grade Level standard for the 2017–2018 school year, a statistically significant difference was yielded, χ 2 (1) = 12.,341.20, p < .001. The effect size for this finding, Cramer's V, was moderate, 0.41 (Cohen, 1988). As revealed in Table 3, a statistically significantly higher percentage of Hispanic girls who were at-risk failed to meet the Masters Grade Level standard than Hispanic girls who were not at-risk. The percentage of Hispanic girls who were at-risk and who did not meet this grade level standard was almost twice the percentage of Hispanic girls who were not at-risk and who did not meet this standard.
Concerning the Masters Grade Level standard for the 2018–2019 school year, a statistically significant difference was revealed, χ 2 (1) = 10,327.25, p < .001 Cramer's V of 0.39, a moderate effect size (Cohen, 1988). A statistically significantly higher percentage of Hispanic girls who were at-risk failed to meet the Masters Grade Level standard than Hispanic girls who were not at-risk. The percentage of Hispanic girls who were at-risk and who did not meet this grade level standard was almost twice the percentage of Hispanic girls who were not at-risk and who did not meet this standard. Delineated in Table 3 are the descriptive statistics for this school year.
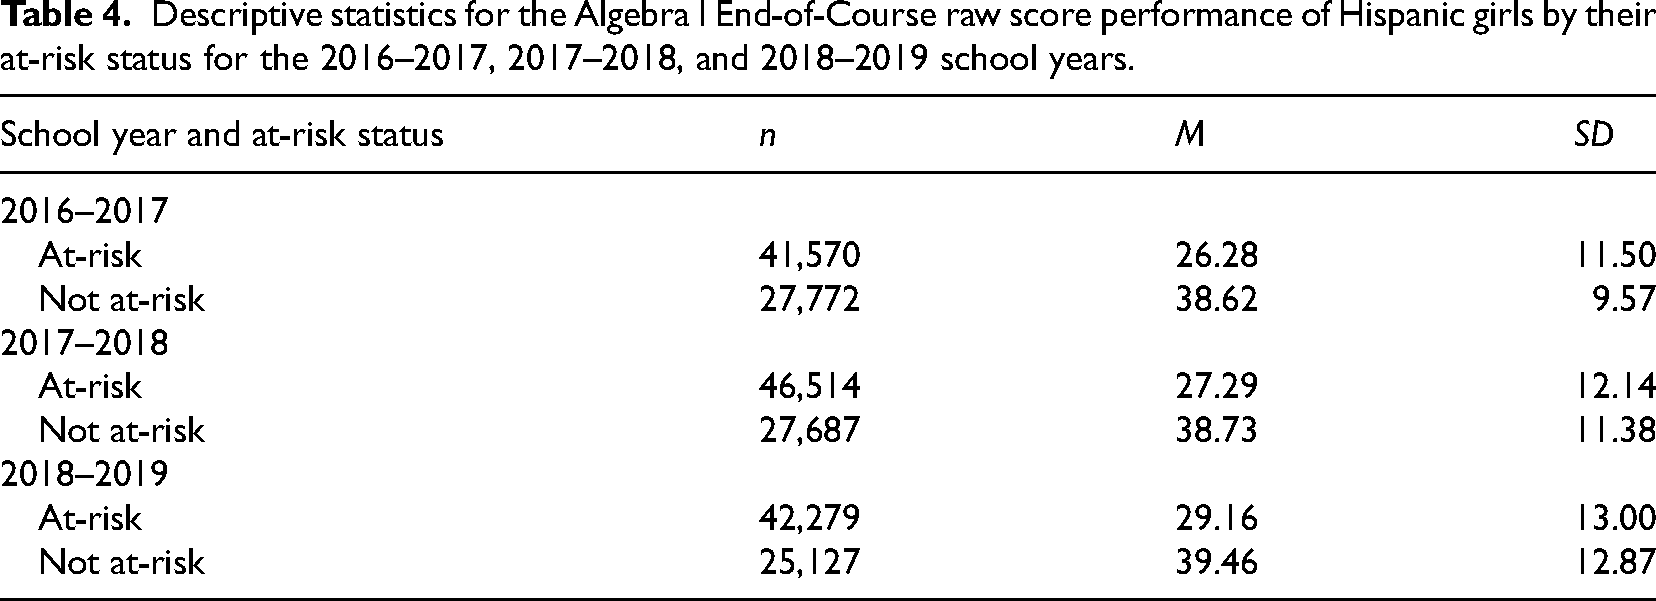
For the fourth research question regarding raw score performance on the Algebra I End-of-Course exam for the 2016–2017 school year, the parametric independent samples t-test revealed a statistically significant difference, t(69,340) = 147.83, p < .001. This difference represented a large effect size (Cohen's d) of 1.16 (Cohen, 1988). Hispanic girls who were at-risk answered 12 items less correctly, on average, than were answered correctly by Hispanic girls who were not at-risk. Descriptive statistics for this analysis are delineated in Table 4.
Descriptive statistics for the Algebra I End-of-Course raw score performance of Hispanic girls by their at-risk status for the 2016–2017, 2017–2018, and 2018–2019 school years.
Descriptive statistics for the Algebra I End-of-Course raw score performance of Hispanic girls by their at-risk status for the 2016–2017, 2017–2018, and 2018–2019 school years.
Regarding raw score performance on the Algebra I End-of-Course exam for the 2017–2018 school year, the parametric independent samples t-test was conducted and yielded a statistically significant difference, t(74,199) = 127.17, p < .001. This difference represented a large effect size (Cohen's d) of 0.98 (Cohen, 1988). Hispanic girls who were at-risk answered almost 12 items less, on average, than Hispanic girls who were not at-risk. Table 4 contains the descriptive statistics for this analysis.
Concerning the raw score performance of Hispanic girls on the Algebra I End-of-Course exam for the 2018–2019 school year, the parametric independent samples t-test revealed a statistically significant difference, t(67,404) = 99.87, p < .001. This difference represented a large effect size (Cohen's d) of 0.81 (Cohen, 1988). Hispanic girls who were at-risk answered 10 items less correctly, on average, than Hispanic girls who were not at-risk. Delineated in Table 4 are the descriptive statistics for this school year.
In this multiyear investigation, data on the Algebra I End-of-Course exam performance were compared between Hispanic girls who were at-risk and Hispanic girls who were not at-risk. End-of-Course exam performance was comprised of three grade level standards (i.e., Approaches Grade Level, Meets Grade Level, and Masters Grade Level) and one raw score. Data were obtained for the three school years prior to the COVID-19 pandemic. Inferential statistical procedures yielded statistically significant differences in all three school years for Hispanic girls who were at-risk. In all three school years, Hispanic girls who were at-risk failed to meet all three grade level standards at statistically significantly lower rates that Hispanic girls who were not at-risk. In the Masters Grade Level standard for all three school years, the failure rate for Hispanic girls who were at-risk increased in comparison to the failure rate for Hispanic girls who were not at-risk. This increased the achievement gap for Hispanic girls who were at-risk.
Approaches Grade Level findings
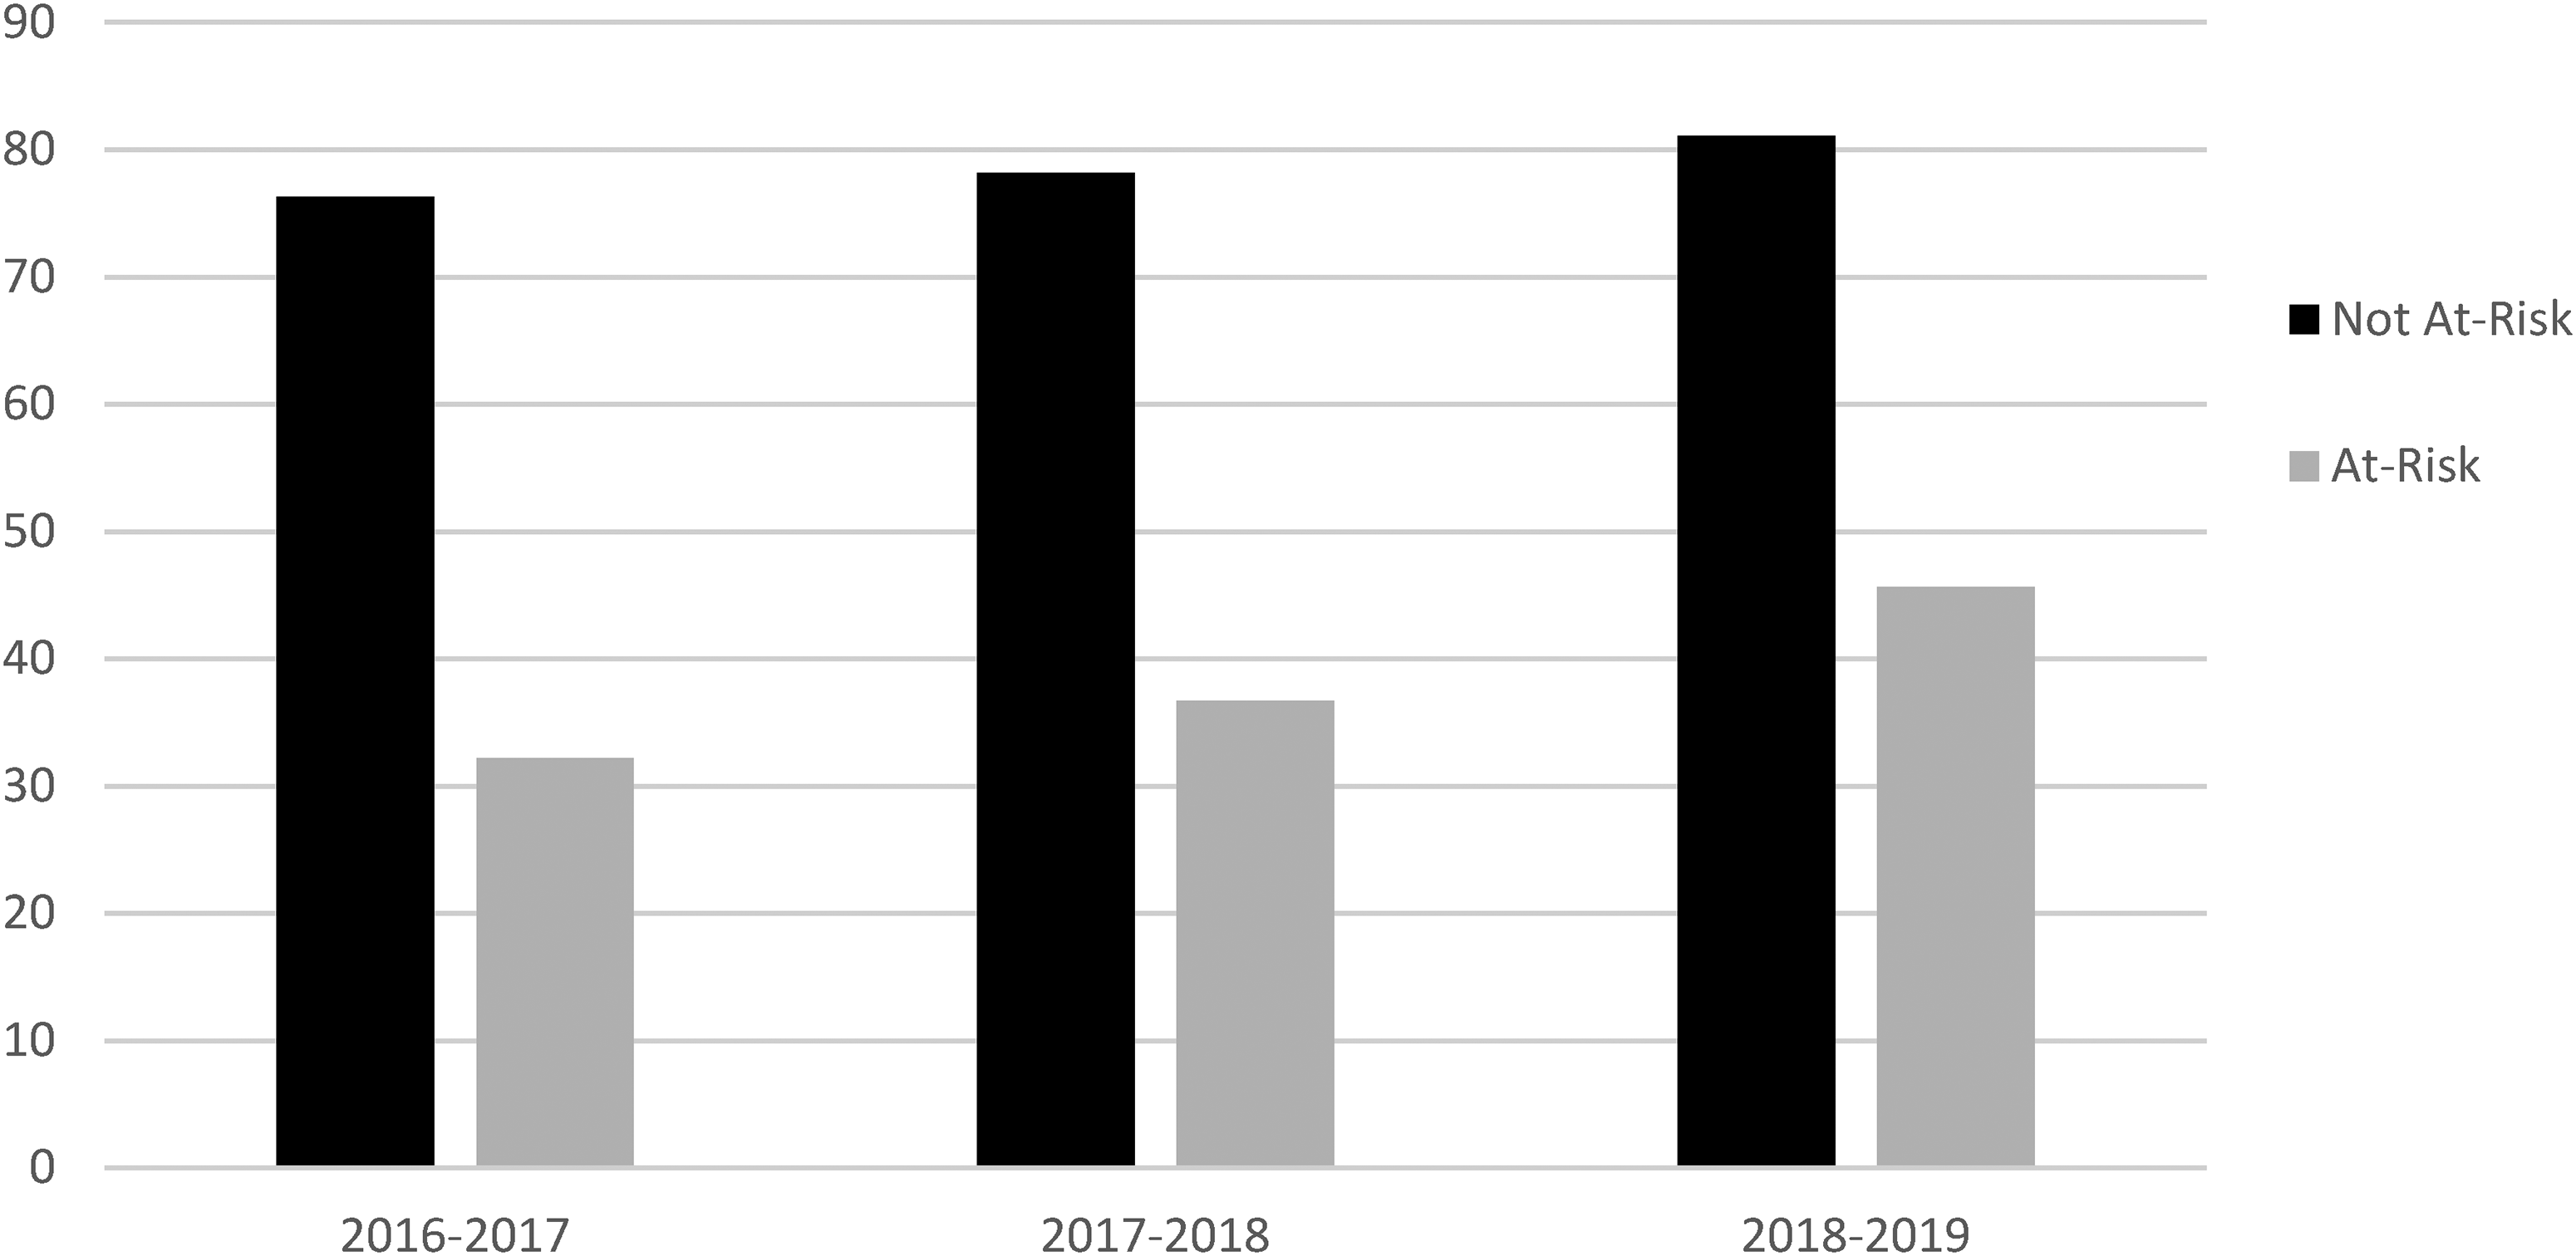
Higher percentages of Hispanic girls who were at-risk failed to meet all three grade level standards in all three school years. Percentages of failure for all Hispanic girls decreased from the 2016–2017 school year through the 2018–2019 school year, however, the failure rate for Hispanic girls who were at-risk remained much higher than Hispanic girls who were not at-risk. For performance on the Approaches Grade Level standard in the 2016–2017 school year, 33% of Hispanic girls who were at risk failed to meet the standard compared to more than 6% of Hispanic girls who were not at-risk and who failed to meet the standard. In the 2017–2018 school year, almost 30% of Hispanic girls who were at-risk failed to meet the Approaches Grade Level standard compared to 6% for Hispanic girls who were not at-risk. For the 2018–2019 school year, almost 26% of Hispanic girls who were at-risk failed to meet the standard compared to 8% of Hispanic girls who were not at-risk. The percentages of Hispanic girls who met this standard increased in each of the three years of data that were analyzed and the percentages of Hispanic girls who were not at-risk met standard rate decreased. For the three school years of data that were analyzed, the achievement gap in Algebra I narrowed for the Approaches Grade Level standard. Depicted in Figure 1 are the average percentages for the Approaches Grade Level standard for all three school years.
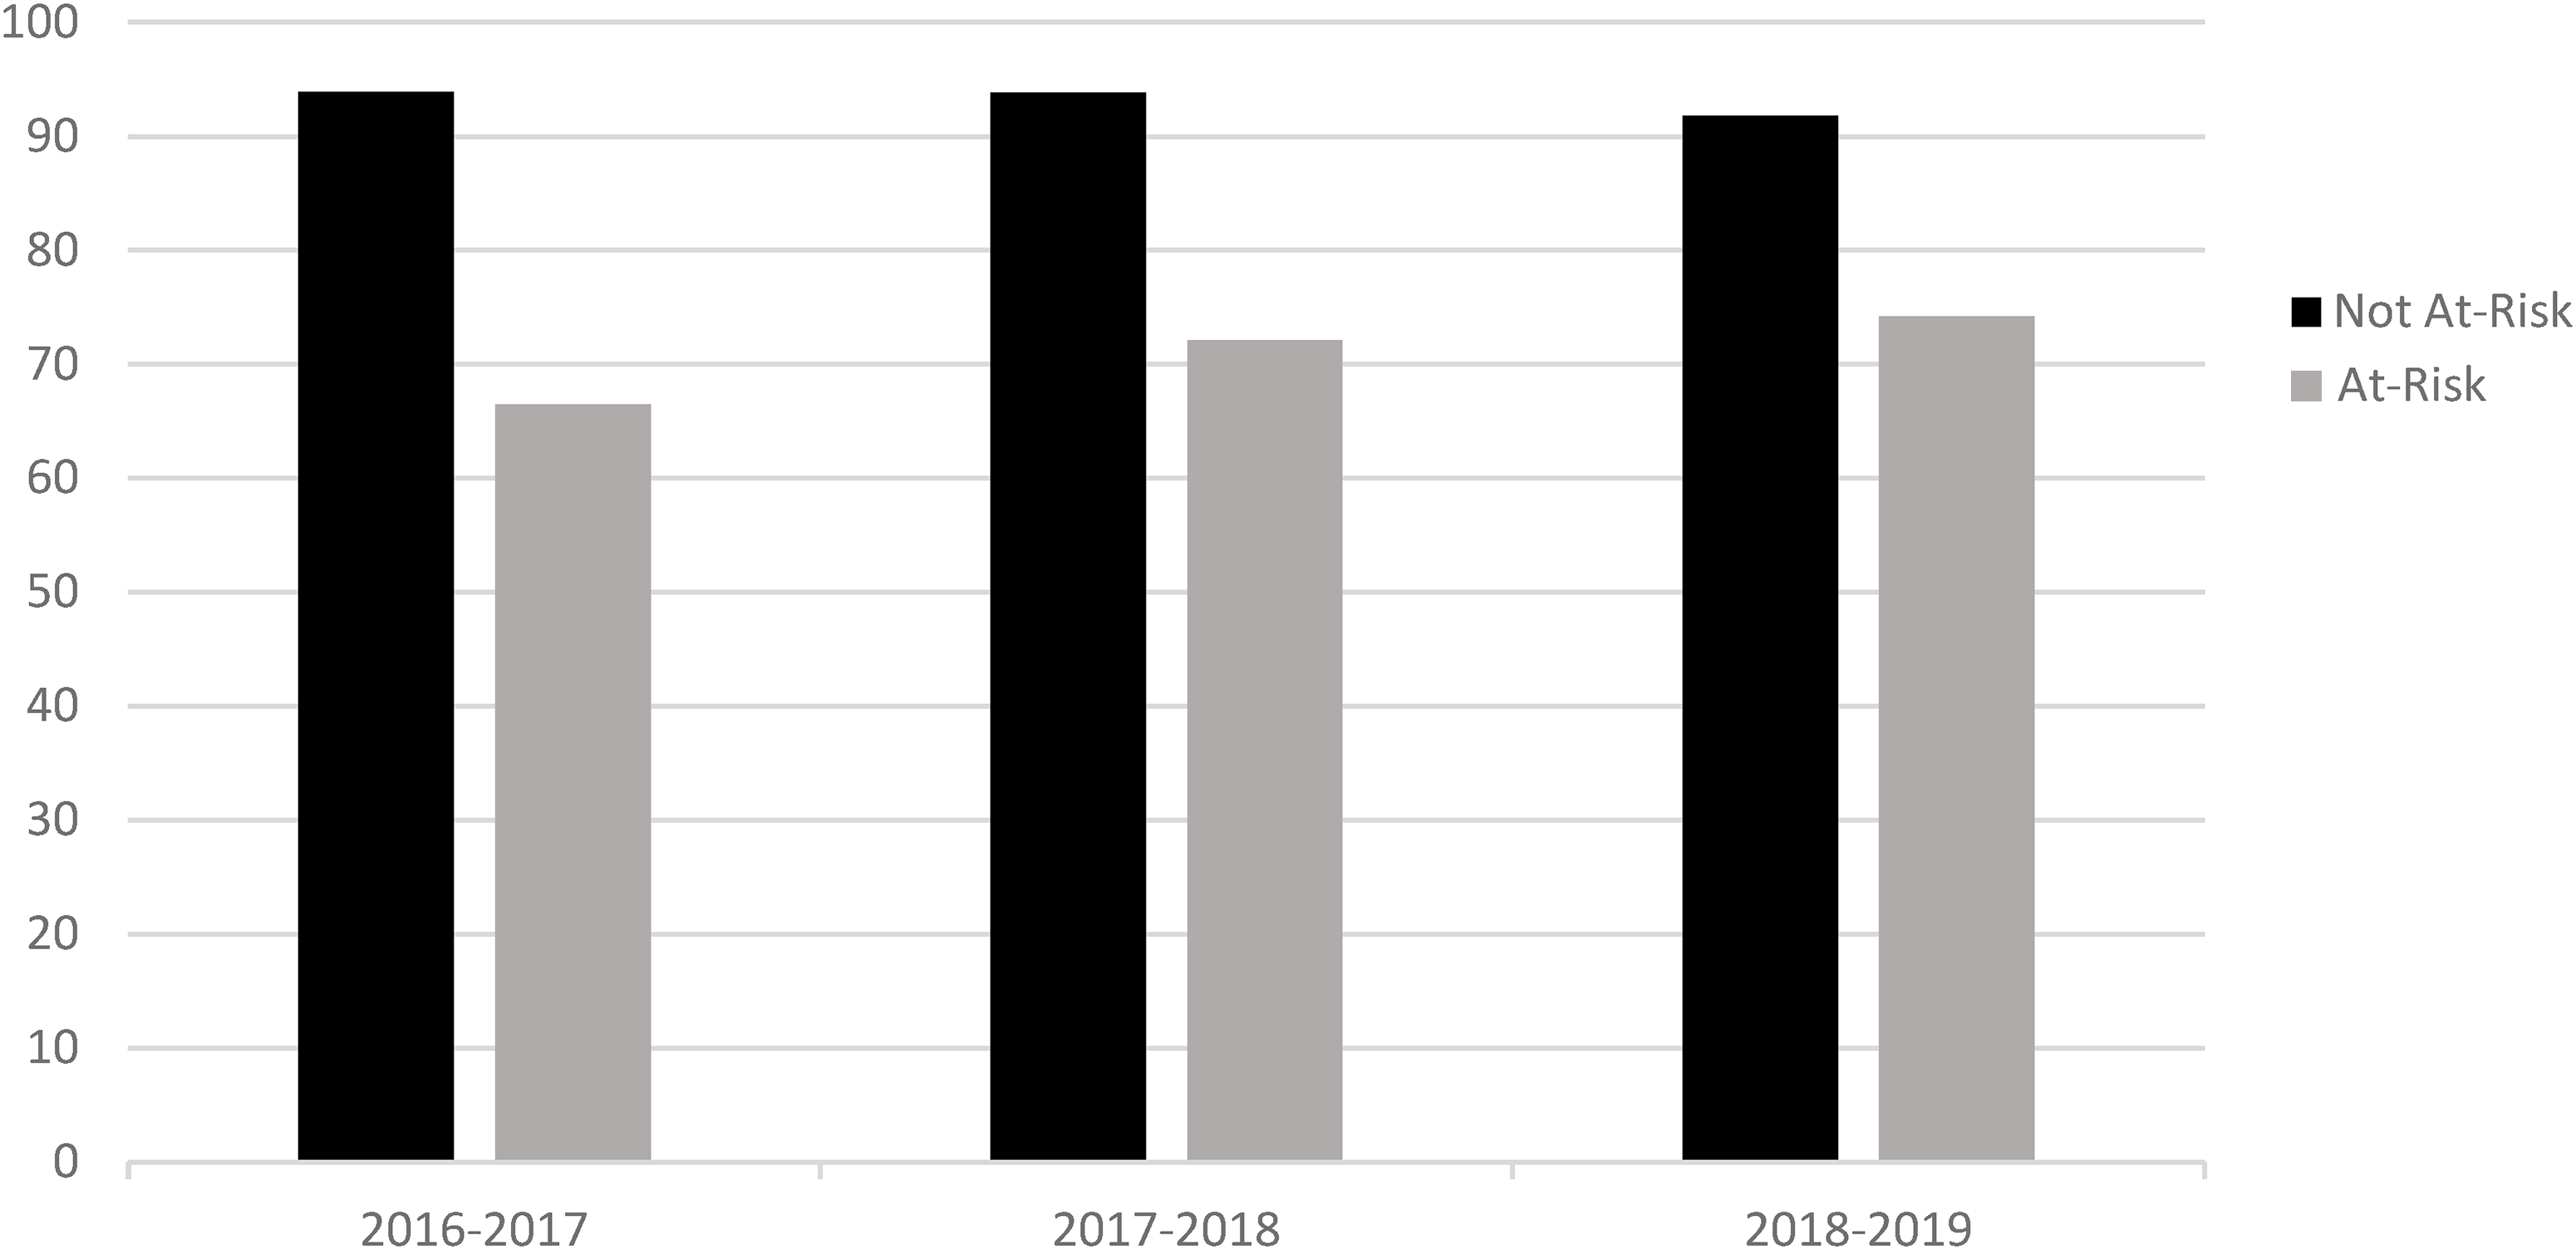
Average percentages of Hispanic girls who met the Approaches Grade Level standard by their at-risk status for the 2016–2017, 2017–2018, and 2018–2019 school years.
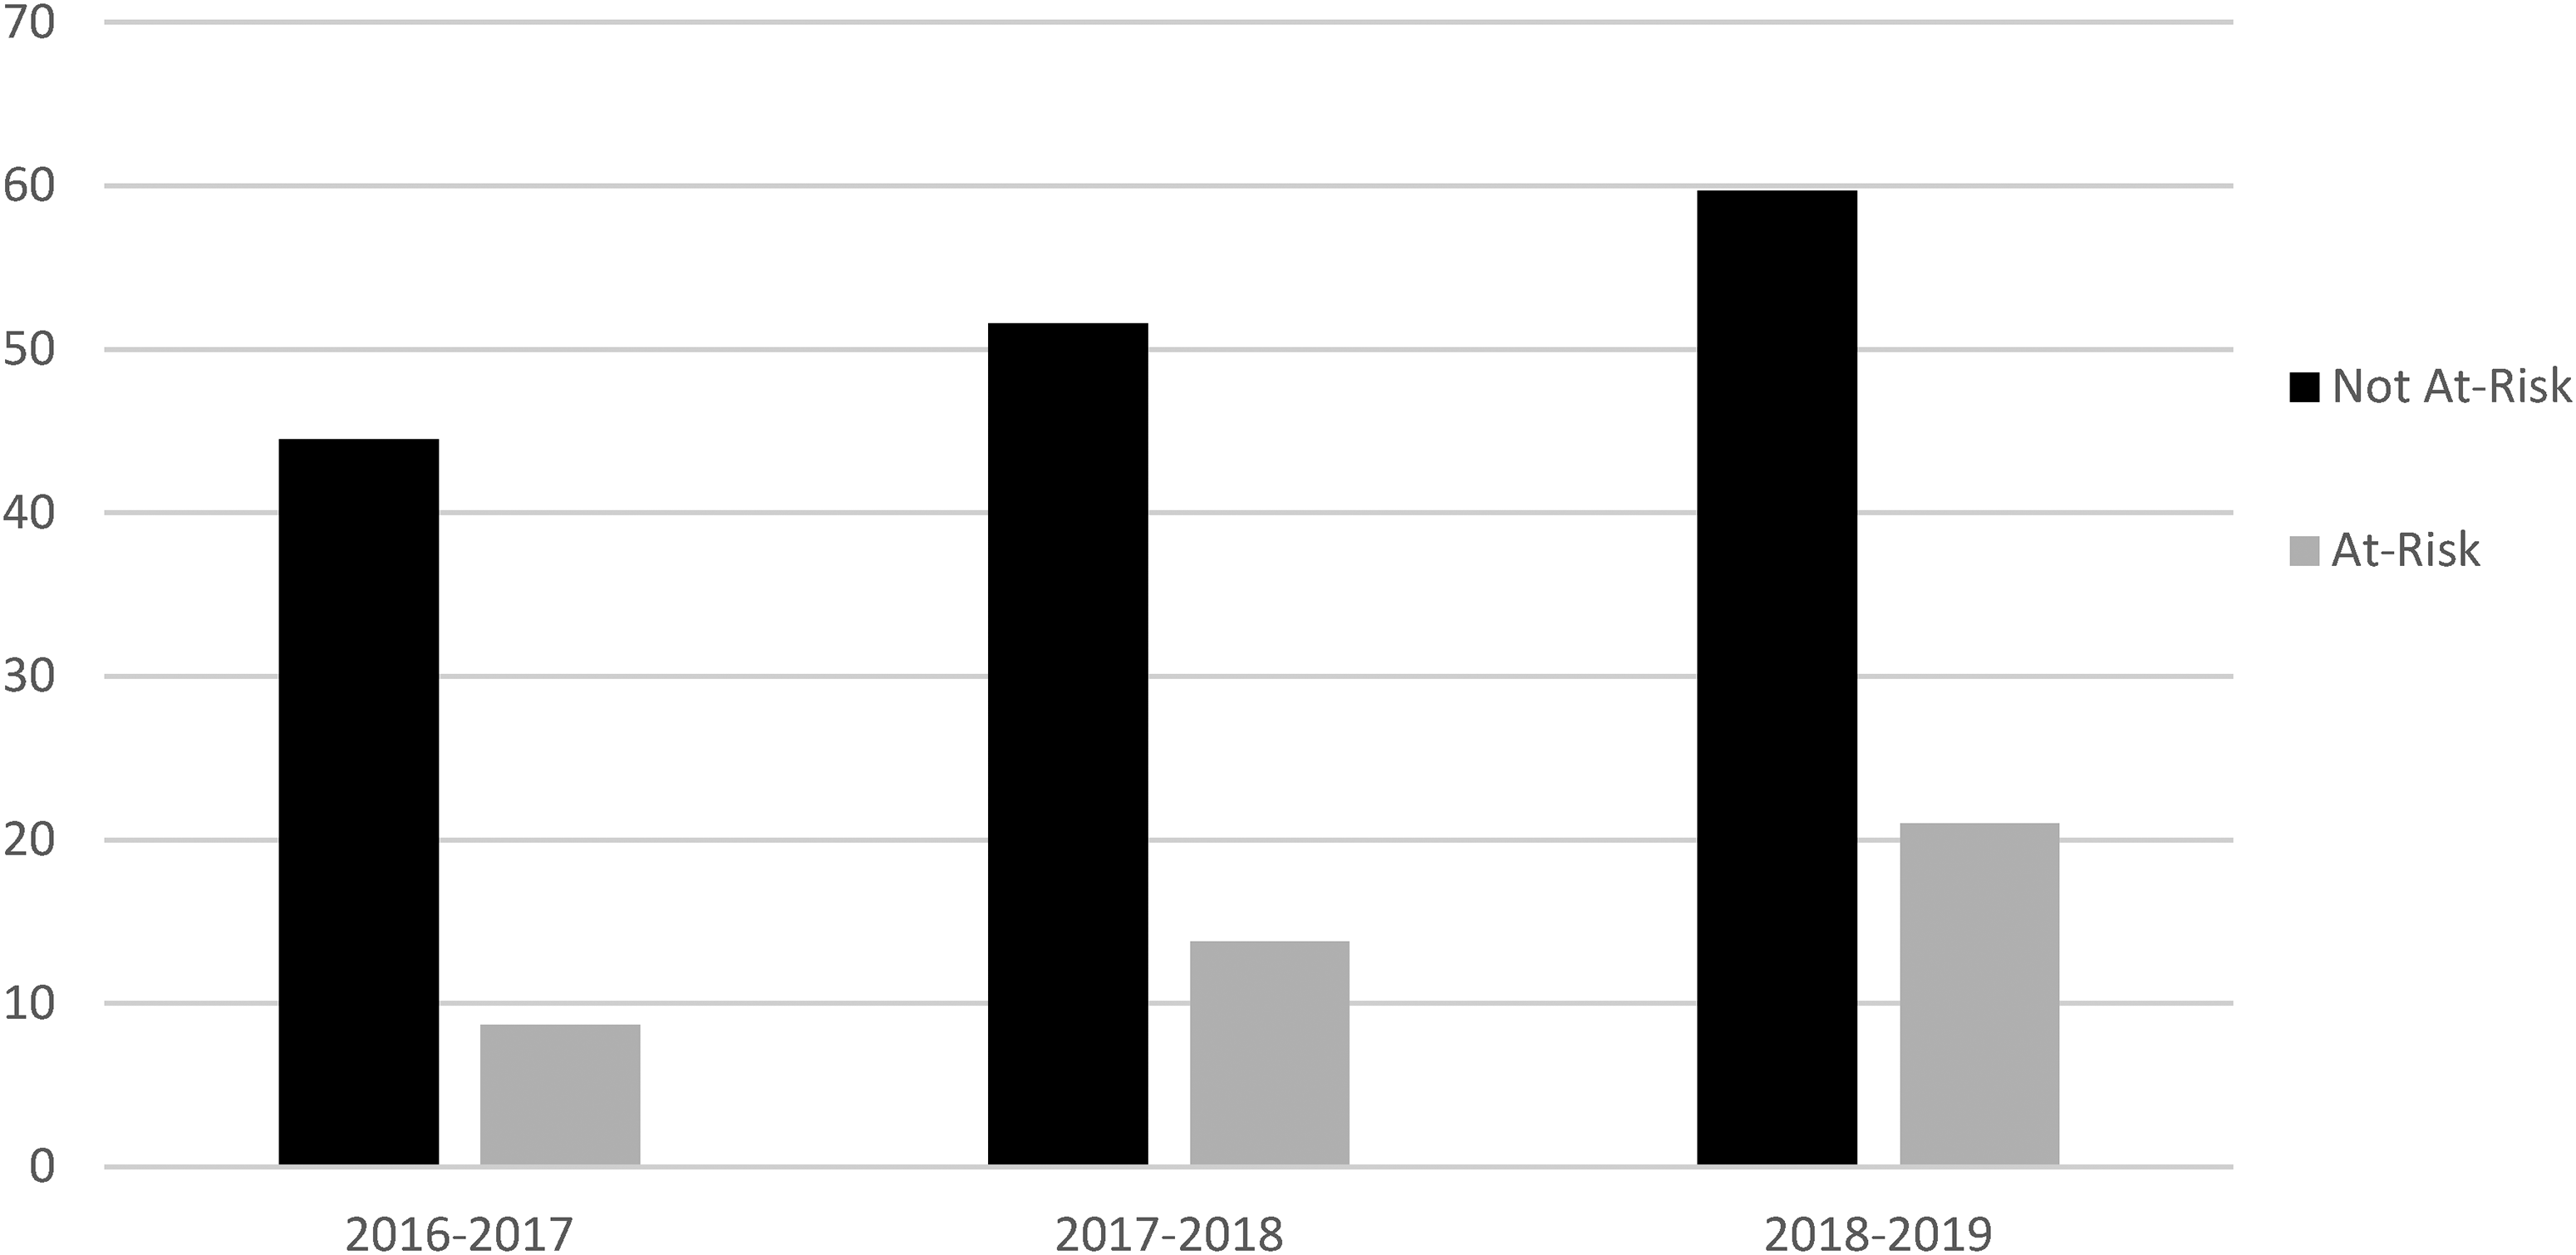
Results for the Meets Grade Level standard on the Algebra I exam for all three school years were larger differences than were the results of the Approaches Grade Level standard. In all three school years, Hispanic girls who were at-risk failed the Meets Grade Level standard at much higher percentages than Hispanic girls who were not at-risk. In the 2016–2017 school year, almost 68% of Hispanic girls who were at-risk failed to meet the Meets Grade Level standard compared about 24% for Hispanic girls who were not at-risk. Over 63% of Hispanic girls who were at-risk failed to meet the Meets Grade Level standard compared to almost 22% for Hispanic girls who were not at-risk in the 2017–2018 school year. In the 2018–2019 school year, over 54% of Hispanic girls who were at-risk failed to meet the standard in Meets Grade Level standard compared to almost 19% for Hispanic girls who were not at-risk. For these three years, the percentages of Hispanic girls who were at-risk and did not meet this standard decreased. The incremental decrease was more for Hispanic girls who were at-risk narrowing the Algebra I achievement gap between Hispanic girls who were at-risk and Hispanic girls who were not at-risk during this time frame. Depicted in Figure 2 are these average percentages for the three school years.
Average percentages of Hispanic girls who met the Meets Grade Level standard by their at-risk status for the 2016–2017, 2017–2018, and 2018–2019 school years.
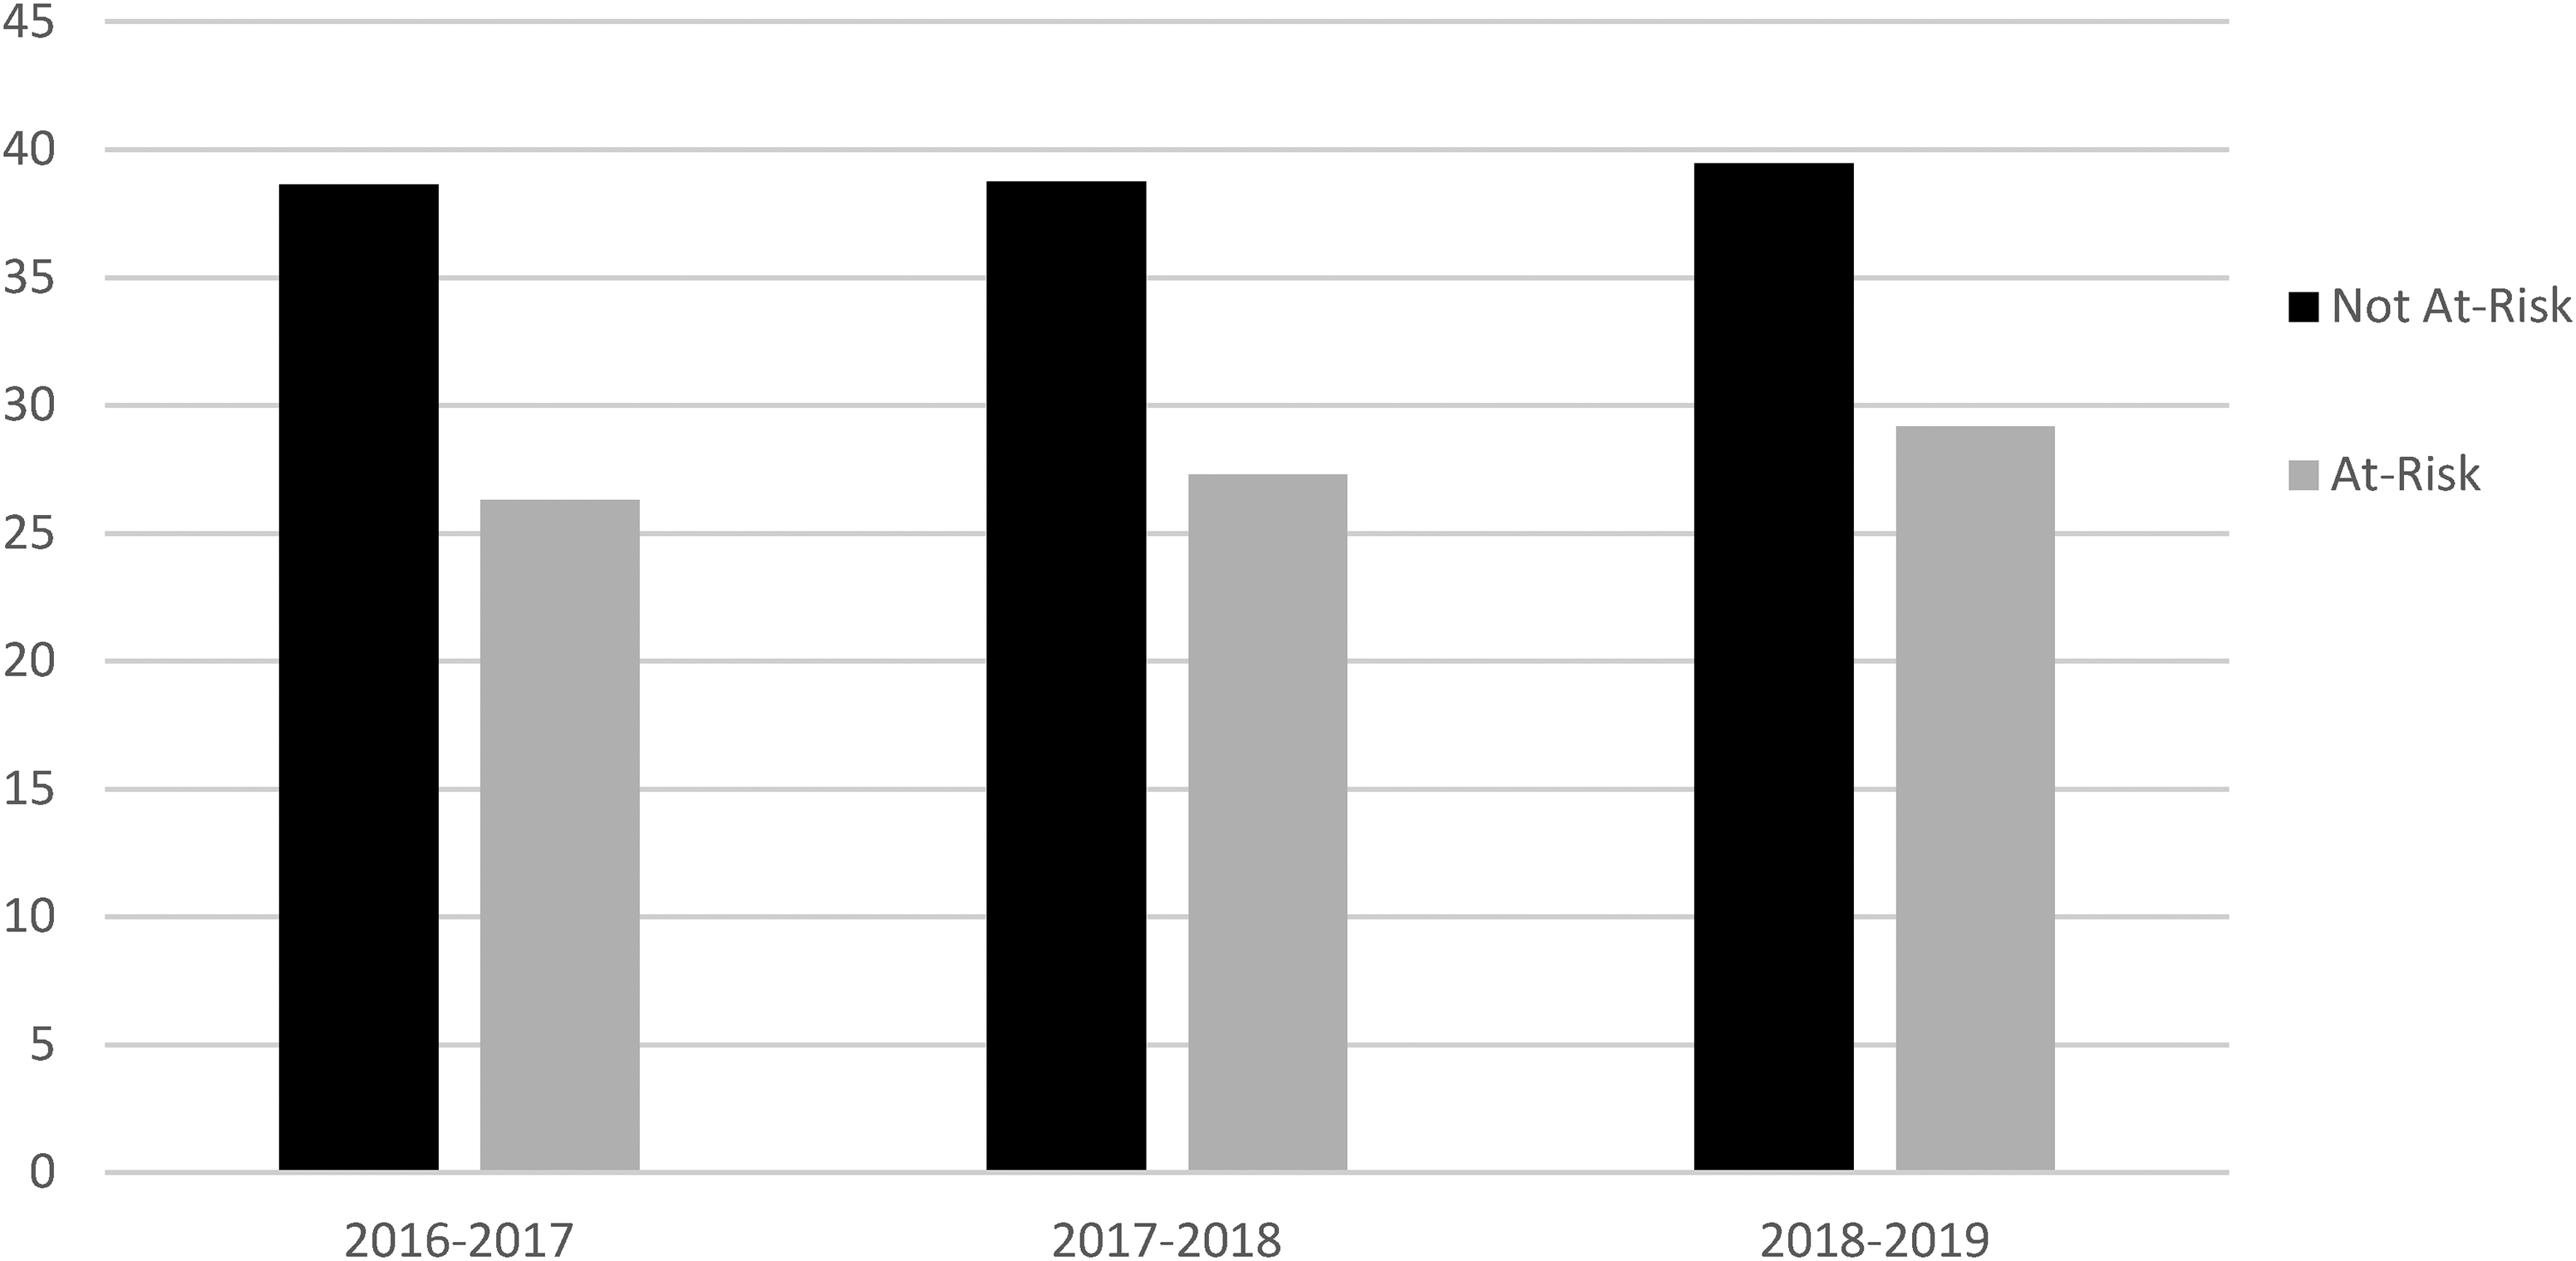
In regard to the Masters Grade Level standard performance on the Algebra I End-of-Course exam in all three years, the rate of failure to meet the standard decreased for all Hispanic girls. Hispanic girls who were at-risk failed to meet the Masters Grade Level standard at a much higher rate than Hispanic girls who were not at-risk in all three school years. In the 2016–2017 school year, over 91% of Hispanic girls who were at-risk failed to meet the Masters Grade Level standard compared to almost 56% for Hispanic girls who were not at-risk. In the following year, over 86% of Hispanic girls who were at-risk failed to meet the standard and over 48% of Hispanic girls who were not at-risk failed to meet the standard. In the 2018–2019 school year, 79% Hispanic girls who were at-risk failed to meet the Masters Grade Level standard compared to over 40% for Hispanic girls who were not at-risk. The incremental decrease in the rate of failure to meet the Masters Grade Level standard was less for Hispanic girls who were at-risk. From the 2016–2017 to the 2018–2019 school years, the achievement gap between Hispanic girls who were at-risk and Hispanic girls who were not at-risk increased. Depicted in Figure 3 are the average percentages for Hispanic girls for all three years on the Masters Grade Level standard.
Average percentages of Hispanic Girls who met the Masters Grade Level standard by their at-risk status for the 2016–2017, 2017–2018, and 2018–2019 school years.
In raw score comparisons on the Algebra I End-of-Course exam for all three school years examined, Hispanic girls who were at-risk answered, on average, about 11 items less correctly than Hispanic girls who were not at-risk. In the 2016–2017 school year, Hispanic girls who were at-risk answered an average of more than 12 items less correctly than Hispanic girls who were not at-risk. Hispanic girls who were at-risk answered over 11 items less correctly, on average, than Hispanic girls who were not at-risk in the 2017–2018 school year. In the 2018–2019 school year, Hispanic girls who were at-risk answered over 10 items less correctly, on average, than Hispanic girls who were not at-risk. The average number of items answered correctly for Hispanic girls who were at-risk increased incrementally each year. The average raw score comparisons for all three school years are shown in Figure 4.
Average Algebra I End-of-Course exam raw scores of Hispanic girls by their at-risk status for the 2016–2017, 2017–2018, and 2018–2019 school years.
In this multiyear, statewide investigation, the Algebra I End-of-Course exam performance of Hispanic girls was compared by their at-risk status. Higher percentages of Hispanic girls who were at-risk failed to meet all three grade level standards than Hispanic girls who were not at-risk for all three school years. These findings are congruent with existing literature at the national and state level. From 2017 to 2019, the National Center for Education Statistics (2022a) established a widened achievement gap in mathematics at the national level. In Texas, Rojas-Lebouef (2010) documented the existence of achievement gaps in Grade 5 mathematics for 16 consecutive years (i.e., 1993–2009) for Hispanic students. In addition, Craft (2011) determined the presence of an achievement gap in Grade 8 mathematics on state-mandated exams for Hispanic students. Hispanic students performed lower than state expectations for seven consecutive school years (i.e., 2003–2004 through 2009–2010) (Craft, 2011).
Implications for policy and for practice
Implications for policy and practice can be supported from the findings in this investigation. Policymakers in Texas and other states can use the data in this study to make necessary changes to mathematics instruction for high schools. High schools around the country are being held accountable for student performance in mathematics. Leaders can design and implement policies that support school districts so that their infrastructure best supports the closure of achievement gaps. Algebra I is the foundation of high school mathematics and a good starting point to identify achievement gaps. This study should be used to help school leaders identify those gaps to create strong mathematics foundations for high school students.
The achievement gap in Algebra I for Hispanic girls who were at-risk in the three years analyzed in this study is a concern for all high school leaders. School leaders can use data in this study to identify gaps and trends on their own campus to refine instruction to make positive changes for students. The instructional level is where change must occur to close mathematics achievement gaps. Algebra I teachers can use the findings from this study with support from campus leaders to design lessons that allow appropriate differentiation for students based on gender or at-risk status. Closing the mathematics achievement gap for girls and students who are at-risk benefit the students and the campus’ accountability rating.
Recommendations for future research
The achievement gap and related trends established in this investigation are concerns for Texas school administrators. Further research is necessary to identify potential widening of the achievement gap and to establish existence of additional gaps. First, future researchers should analyze data in full school years after the COVID-19 Pandemic. Analyzed in this study were data from the last three full school years before significant instructional changes were made by school districts around the country due to the COVID-19 Pandemic. Second, researchers are encouraged to examine state-mandated exam performance data of one or more of the other four End-of-Course subjects. Data from English I, English II, Biology, and United States History should be analyzed to demonstrate the presence or absence of achievement gaps for Texas high school students in those subjects. Third, examined in this study were performance data from Texas high schools. Researchers are encouraged to examine student performance data from other states to identify achievement gaps in other states or at the national level. Finally, future researchers are encouraged to analyze performance data from other student subgroups. Focused upon in this investigation were data on Hispanic girls and Hispanic girls who were at-risk. Further analyses on Algebra I End-of-Course data are needed for White, Black, and Asian students by gender. In addition, future researchers should consider examining performance data from students who are in poverty, Emergent Bilingual students, and students who are in special education programs.
Conclusion
In this multiyear investigation, the Algebra I End-of-Course exam performance was compared for Hispanic girls by their at-risk status. Specifically examined were the percentages of girls who met the Approaches Grade Level standard, Meets Grade Level standard, Masters Grade Level standard, and raw score performance in three consecutive school years (i.e., 2016–2017, 2017–2018, and 2018–2019). Across all three school years, higher percentages of Hispanic girls who were at-risk failed to meet any of the three grade level standards and answered an average of over 11 items less correct than Hispanic girls who were not at-risk. The failure rate for Hispanic girls who were at-risk decreased incrementally in each grade level standard in all three school years. The achievement gap for Hispanic girls who were at-risk compared to Hispanic girls who were not at-risk narrowed in the Approaches Grade Level standard and the Meets Grade Level standard for the three school years. The failure rate for Hispanic girls who were at-risk decreased less than the failure rate for Hispanic girls who were not at-risk for the Masters Grade Level standard for the three years resulting in a widened achievement gap in this grade level standard.
Footnotes
Contributorship
Daniel Craft conducted the research and wrote the initial draft of this manuscript. John Slate obtained the data, assisted in the writing of the results and in generating tables and figures. As such, both authors contributed to the writing of this final manuscript.
Declaration of conflicting interests
The authors declared no potential conflicts of interest with respect to the research, authorship, and/or publication of this article.
Funding
The authors received no financial support for the research, authorship, and/or publication of this article.
Informed consent
The Institutional Review Board at Sam Houston State University approved this research study as part of Dr. Craft's journal-ready dissertation.