
Abstract
Ratio, rate, and proportion are arguably the most important topics in the middle grades mathematics curriculum before algebra. The study reported here describes how Japanese mathematics curriculum materials treat these topics. The analyses were conducted on the official curriculum documents published by the Japanese Ministry of Education and one of the most widely used textbook series for Elementary and Lower Secondary School Mathematics. The results of the analyses show that the Japanese curriculum introduces and develops these topics across multiple grade levels as expected for such complex topics. However, the initial definition of a proportional relationship appears before students formally study ratios. Moreover, the Japanese materials emphasize solving missing-value proportion problems by using the definition of proportional relationships, rather than setting up a proportion equation with a missing value in the equation of the form
Introduction
Ratio, rate, and proportion are arguably the most important topics in the middle grades mathematics curriculum before algebra. Lesh et al. (1988) note that proportional reasoning “is the capstone of children's elementary school arithmetic; on the other hand, it is the cornerstone of all that is to follow” (p. 94). The National Council of Teachers of Mathematics (NCTM) in the United States notes that proportionality is “of such great importance that it merits whatever time and effort must be expended to assure its careful development” (NCTM, 1989, p. 82). Lamon (2007) notes that these topics are “one of the most compelling research sites” (p. 629), as demonstrated by the many research reports on the teaching and learning of these topics.
Nevertheless, both teachers and students still find these topics to be challenging, as articles on how to better support students’ learning of these topics continue to be published (e.g., Hilton et al., 2016; Jitendra et al., 2021). While these topics are emphasized in standards and syllabi of most, if not all, education systems, the discrepancies between the intended curriculum envisioned in such documents and the implemented curriculum of what actually happens in classrooms—and what students eventually learn—have long been recognized (e.g., Schmidt et al., 1999). Kilpatrick et al. (2001) points out, “what is actually taught in classrooms is strongly influenced by the available textbooks” (p. 36). Other scholars (e.g., Silver, 2017) also acknowledge the central role textbooks play in teachers’ instructional decisions and students’ opportunities to learn. Thus, textbooks play an important bridge between the intended curriculum and the implemented curriculum. Therefore, some scholars refer to textbooks as the potentially implemented curriculum (e.g., Valverde et al., 2002).
Japanese students have consistently performed near the top of the world in many international studies such as TIMSS and PISA (e.g., U. S. Department of Education. Institute of Education Sciences, National Center for Education Statistics, n.d.-a, n.d.-b). Thus, it is natural to wonder how Japanese students are taught these topics. However, few articles on the treatment of these topics in the Japanese curriculum and textbooks have been published, except for a few reports in Japanese (e.g., Tabata, 2010). Thus, the present study attempts to fill the void in the field by providing a detailed analysis of the treatment of these topics in the Japanese curriculum materials. It is hoped that the findings from this study will offer a new lens through which mathematics educators outside of Japan can examine the treatment of these important topics in their own systems.
Ratio, rate, and proportion
In Japanese, the term hi (比) corresponds to the English term ratio, and hirei(比例)and hirei no kankei(比例の関係)correspond to proportion and proportional relationship, respectively. However, no Japanese word directly corresponds to the term rate. The Japanese word, wariai (割合), can be translated into ratio or rate. For example, wariai of a mixture of oil and vinegar to make salad dressing or wariai of the crowdedness of rabbit hutches. In everyday use, wariai may even imply proportion. According to Tabata (2010), wariai was an everyday Japanese term that was adopted into school mathematics after World War II, in part to refer to related yet distinct ideas about ratio. However, the ambiguity of the term wariai may also correspond to the ambiguity of the terms ratio and rate in English. Rate and ratio appear to have different interpretations. Some consider a ratio as a multiplicative comparison of two quantities from the same measure space while a rate compares two quantities from distinct measure spaces (e.g., Lesh et al., 1988). Thus, ratio and rate are mutually exclusive. However, others believe a ratio may be a comparison of quantities from the same dimension or quantities from different dimensions. Ohlsson (1988) refers to the former as internal ratio and the latter external ratio. Ohlsson (1988) considers a rate as a ratio of a quantity to a unit time. The progression document on ratios and proportional relationships that accompanies the Common Core State Standards in Mathematics (National Governors Association Center for Best Practices and Council of Chief State School Officers, 2010) in the United States defines a proportion to be an equation showing two equivalent ratios while a proportional relationship is a “collection of pairs of numbers that are in equivalent ratios” (The Common Core Standards Writing Team, 2011, p. 14). Still others consider a ratio to be a comparison of two non-varying quantities while a rate represents a proportional relationship between co-varying quantities (e.g., Thompson, 1994). For the purpose of this research, we considered the union of these different interpretations of ratio and rate as the Japanese curriculum materials were analyzed.
Most typical missing-value proportion problems involve two pairs of numbers including one unknown number. However, there are other types of problems in which students may employ proportional reasoning (Lesh et al., 1988). Proportional reasoning is a complex reasoning process someone might employ to deal with situations involving two co-varying quantities, and it has attracted mathematics education researchers’ interests for a long time (e.g., Kaput & West, 1994; Karplus et al., 1983; Lesh et al., 1988). Many of these studies have examined the various strategies students employ (e.g., Kaput & West, 1994; Lo & Watanabe, 1996). Although proportional reasoning is without question an important goal of middle grade mathematics education, the current study focuses explicitly on proportional relationships and proportions. This is done primarily to make the boundary of the textbook analysis clear, since it is possible that some students might employ proportional reasoning on problems involving a variety of mathematical topics.
Curriculum and textbook analysis
Curriculum and textbook analysis, cross-national analysis in particular, is a relatively new field of inquiry. Large-scale international studies conducted as a part of TIMSS in the 1990s examined both curricula, that is, official documents prescribing what students were expected to learn in different educational systems, and the textbooks used in those systems (e.g., Schmidt, McKnight et al., 1997; Schmidt, Raizen et al., 1997). Those analyses investigated overall structures of school mathematics curricula, often focusing on what mathematics was taught at what grade level. Others examined the treatment of a particular mathematical topic (e.g., Cai et al., 2002; Son & Senk, 2010; Takeuchi & Shinno, 2020; Wang et al., 2017; Watanabe et al., 2017) or mathematical process (e.g., Cai & Jiang, 2017; Doley & Even, 2015; Fan & Zhu, 2007; Mayer et al., 1995) in textbooks. Charalambous et al. (2010) refer to the former type of analysis as horizontal analysis and the latter type as vertical analysis. Li et al. (2009) called the former type “macro analysis” and the latter “micro analysis.” Although cross-national horizontal, or macro, analyses give us the general sense of what topics are discussed in what grade level and how much emphasis is placed on different topics across different educational systems, they do not reveal much about the actual learning opportunities offered in their mathematics classrooms. To understand how a particular topic is being taught, we need vertical, or micro, analyses. Official curriculum documents such as standards and syllabi do not typically specify how a topic is to be taught and are not always utilized by classroom teachers to make instructional decisions. Thus, textbooks as potentially implemented curriculum must also be analyzed. Such analyses of curriculum materials, that is, both official curriculum documents and textbooks, can reveal different approaches taken by various systems to teach a particular topic. However, such an analysis may not reveal the influence other topics might have on the treatment of a particular topic. Furthermore, because mathematics consists of many interrelated “topics,” identification of the boundaries of a single topic may be difficult. For example, if we were to examine the treatment of a division algorithm, would we need to examine how division is introduced? What about the treatment of a multiplication algorithm, or algorithms? Thus, some researchers have chosen to examine curriculum materials by integrating aspects of both the horizontal (or macro) and the vertical (or micro) analysis (e.g., Charalambous et al., 2010; Li et al., 2009).
The selection of textbooks to be included in a cross-national study is also an important consideration. Some studies select textbooks based on the characteristics of the education systems in which the textbooks are used. For example, both Boonlerts and Inprasitha (2013) and Charalambous et al. (2010) selected their textbooks from countries with centralized education systems and national curriculum standards. Other studies consider the achievements of the students in mind, either explicitly or implicitly. Those studies often include textbooks from high-achieving Asian countries and other countries of interest to the researchers. For example, Li et al. (2009) examined the textbooks from China, Japan, and the United States, and Boonlerts and Inprasitha (2013) examined textbooks from Japan, Singapore, and Thailand. In many cases, researchers’ familiarity with the languages appears to play a role in the selection of textbooks. Although it is common to analyze textbooks from multiple countries, some studies have examined textbooks from one specific country (e.g., Chou, 2021; Doley & Even, 2015). Contrasting across different systems can shed some insights into the characteristics of the textbooks in each system; however, a detailed analysis of a single system may also be useful for researchers from other systems to use as a lens for analyzing textbooks in their own systems. Moreover, many systems may have more than one textbook series available, so comparing across different series in a single system could also be informative. Thus, the rationale for choosing a particular textbook series should be made explicit.
Research questions
Although there are a few existing studies that examine the treatment of ratio, rate, and proportional relationships in textbooks internationally, (e.g., Bayazit, 2013; Son et al., 2022), no analysis of the Japanese curriculum materials appears to have been published outside of Japan. Therefore, a study examining how ratio, rate, and proportional relationships are treated in the Japanese curriculum materials was conducted. The goal of the study was to provide a detailed account of the treatment of these topics in the Japanese materials so that others might use it as a lens to analyze their own systems’ treatments. Thus, it was decided to not conduct a cross-national study but to focus instead only on the analyses of Japanese materials. Specifically, this study examines the following two research questions.
Methodology
Curriculum materials
There were two different data sources for the current study. One data source consists of documents published by the Japanese Ministry of Education, Culture, Sports, Science and Technology (MEXT). The MEXT publishes Gakushuu Shidou Youryou, commonly translated as the National Course of Study (COS), which specifies what topics are to be taught in which grade levels for each subject area. The MEXT also publishes a second document Gakushuu Shidou Youryou Kaisetsusho, often called Teaching Guide, which explains and elaborates on the specific standards in the COS of each subject area. Japanese publishers carefully follow the COS and Teaching Guide to develop their textbooks because all textbooks must be approved by the MEXT for their adherence to the COS. Thus, the COS for elementary school (Grades 1 through 6, ages 6 through 12) and lower secondary school (Grades 7 through 9, ages 13 through 15) and Teaching Guides for mathematics for elementary and lower secondary school (MEXT, 2008a, 2008b, 2008c, 2008d) are examined in this study. Although both the 2008 COS and the accompanying Teaching Guide have been translated into English by the MEXT, the analysis was conducted using the original Japanese versions because Japanese is the first language of the researcher.
The other data source was the textbook series published by Tokyo Shoseki (Fujii & Iitaka, 2011; Fujii & Matano, 2011), one of the most widely used series in the elementary and lower secondary schools. While there are six publishers of elementary school mathematics textbooks and seven that publish lower secondary mathematics textbooks, the Tokyo Shoseki series was by far the most widely used at elementary schools (46.5% as opposed to 29.3% for the second most widely used series) and one of the two most widely used lower secondary series (33.0% along with the most widely used series at 38.5%), according to Kyokasho Report (Japan Federation of Publishing Workers' Unions, 2015; Japan Federation of Publishing Workers' Unions, 2016). 1 As was the case with the COS, the analyses were conducted on the original Japanese version instead of the English translation, Mathematics International (Fujii & Iitaka, 2012; Fujii & Matano, 2012). However, the translated versions are used in this report when examples from the textbooks are included.
Data Analysis
This study employs both vertical and horizontal analysis (Charalambous et al., 2010) to analyze the content of the curriculum materials. Horizontal analysis, also referred to as macro analysis by others (e.g., Li et al., 2009), examines curriculum materials broadly to identify what mathematics is taught at what grade levels, among other things. Thus, it was the primary method to answer the first research question. In contrast, vertical analysis, also referred to as micro analysis by others (e.g., Li et al., 2009), focuses the analysis on a particular mathematics topic and how it is treated in the curriculum materials. In other words, vertical analysis may identify the progression of ideas through curriculum materials, which is the focus of the second research question.
The analysis was conducted in two stages. First, the COS and accompanying Teaching Guide were analyzed to identify how topics related to ratio, rate, and proportion are discussed and in which grades. This was done first by searching for the specific Japanese words mentioned above in the COS to identify the specific COS standards. Then, the sections of Teaching Guide that elaborate on those COS standards were analyzed. Because the topics in the COS are organized in four different domains—Numbers and Operations, Quantities and Measurements, Geometric Figures, and Quantitative Relations—the domains in which the identified COS standards are positioned were noted and general discussions of those domains in Teaching Guide were also analyzed. For the second stage, the specific topics and grade levels identified in these documents were examined within the textbook series to determine how those topics were introduced, treated, and developed.
Results
Research Question 1: What are the topics, and how are they sequenced?
Table 1 summarizes the topics related to ratio, rate, and proportion discussed in the Japanese COS and their grade level placements. Those topics in bold face represent the topics that are directly related to ratio, rate, and proportion. The other topics—for example, probability—have an intrinsic relationship with ratio, rate, and proportion, but these topics have their own mathematical importance. In the elementary grades (Grades 1 through 6), ideas directly related to ratio, rate, and proportion are found primarily in two domains, Measurement and Quantitative Relationships. The Quantitative Relationships domain includes three sub-domains—ideas related to functions, expressions and equations, and data handling. The topics of two co-varying quantities, ratio, and proportional relationships are found in the Function sub-domain. Per-unit quantity and speed are found in the Measurement domain. In the lower secondary grades (Grades 7 through 9), direct and inverse proportional relationships are discussed in the domain of Quantitative Relationships, which is comprised of two sub-domains, functions and probability.
Ratio, rate, and proportional relationships in COS.
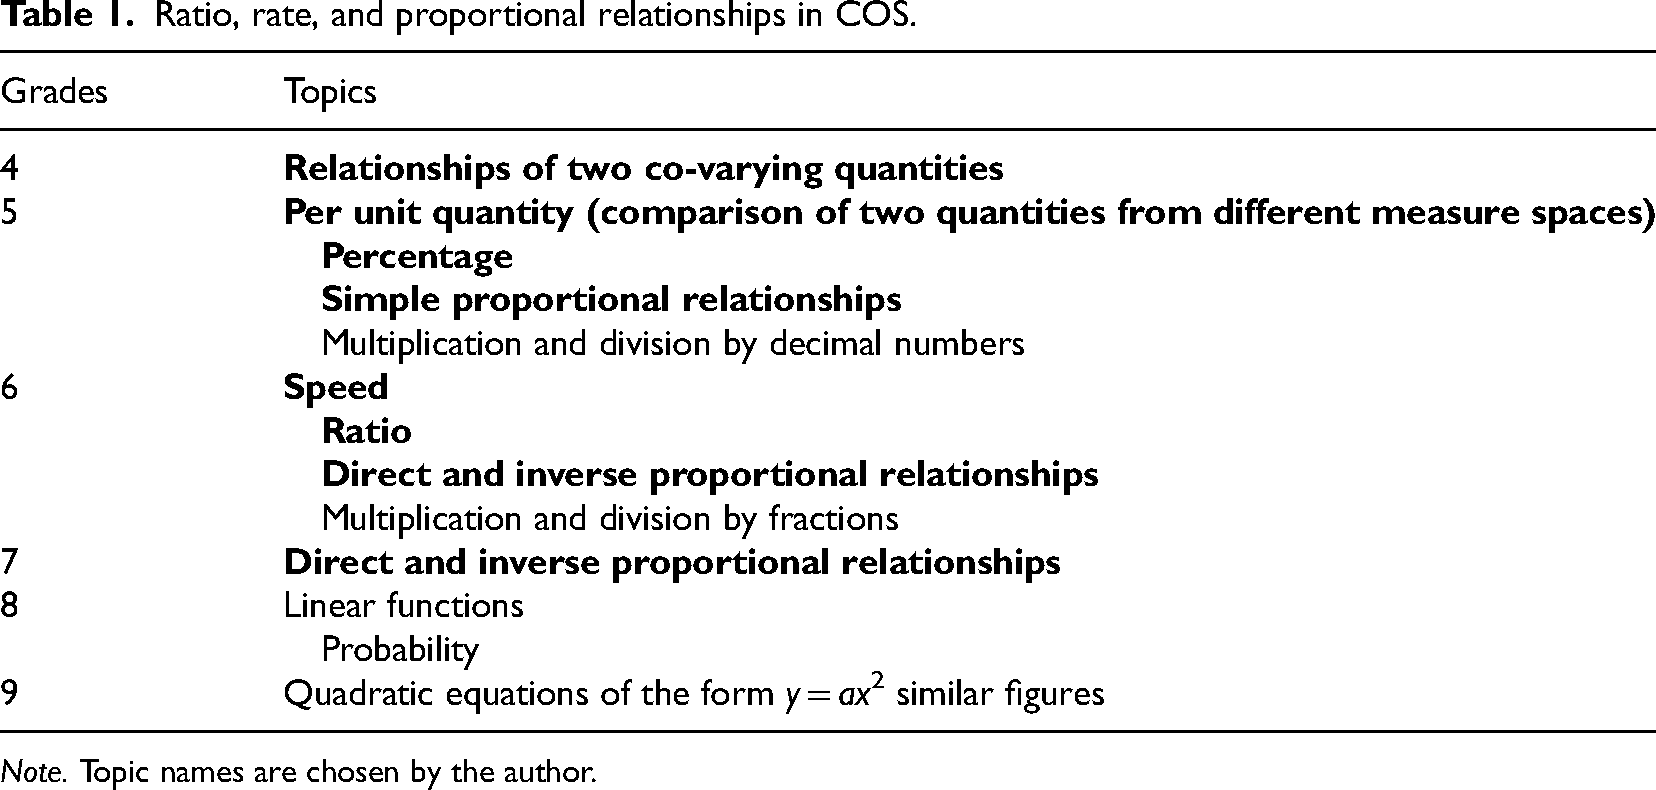
Ratio, rate, and proportional relationships in COS.
Note. Topic names are chosen by the author.
Although the COS specifies what topics are to be discussed in which grade levels, it does not specify the sequence of topics within a grade. Each textbook publisher determines how it will sequence topics within a grade level. Table 2 lists the units in the Tokyo Shoseki textbook series (Fujii & Iitaka, 2011; Fujii & Matano, 2011) and the mathematical contents directly related to the ideas of ratio, rate, and proportion that are shown in bold face in Table 1. Within a grade level, the titles are listed in order as they appear in the textbook. Mathematical content contains the specific mathematical ideas that were identified as focal points in the unit. In the Grade 4 unit, students explore a variety of co-varying quantities, including proportional relationships. However, no explicit mention of proportional relationships occurs in the unit. In other words, proportional relationships are not singled out. The COS specifies that simple proportional relationships are to be defined in Grade 5, but no unit in this textbook series concentrates on proportional relationships. Rather, the idea of proportional relationships is introduced in the unit on volume through the following problem: As shown on the right (accompanying figure is omitted), we are going to change the height of a cuboid from 1 cm to 2 cm, 3 cm, … without changing its length or width. Investigate how the volume changes. (Fujii & Iitaka, 2012, Grade 5, Book A, p. 20)
Unit titles and mathematical content in textbooks.
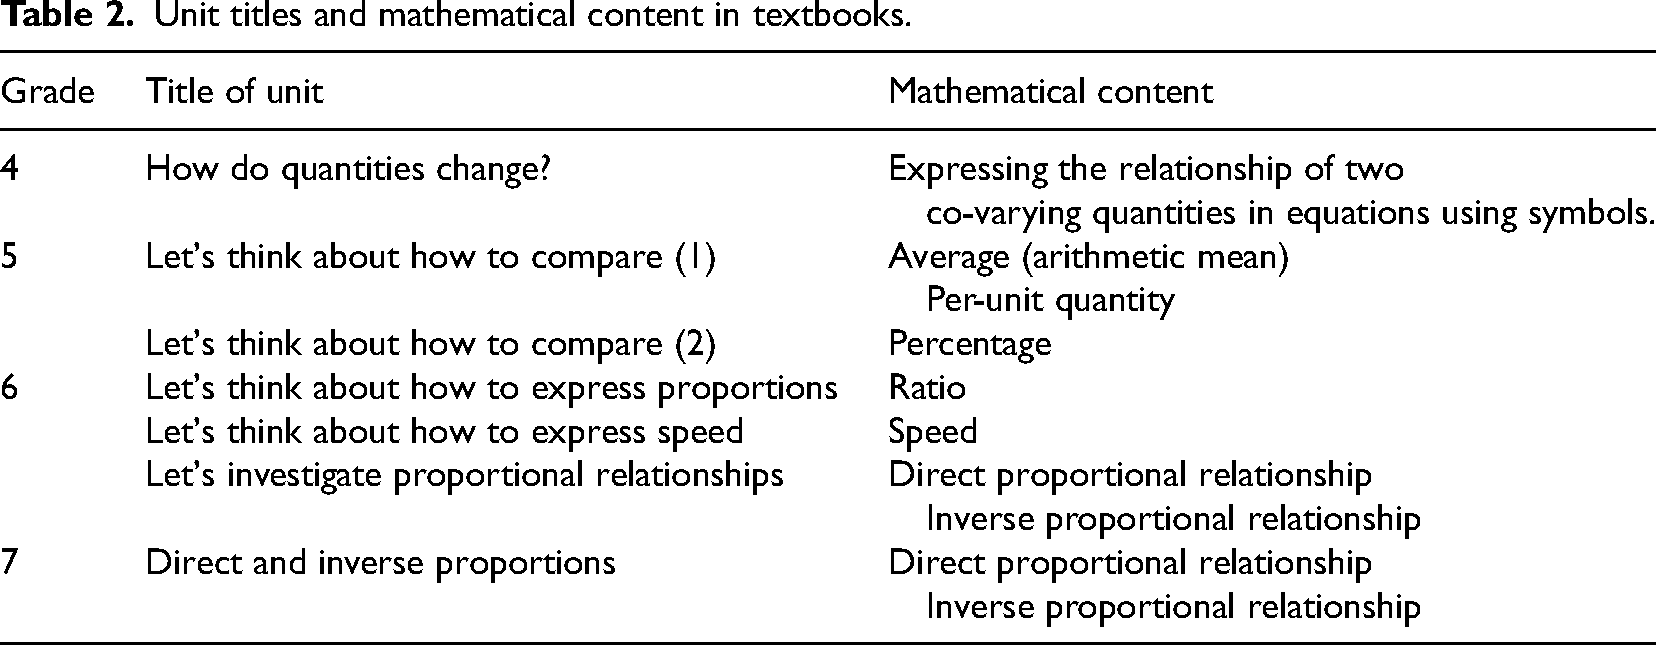
Students are expected to organize the results in a table showing various heights and corresponding volumes. Upon conclusion of this investigation, the textbook provides the definition of a proportional relationship as follows: Suppose there are two quantities, □ and ○. If ○ becomes 2, 3, … times as much while □ becomes 2, 3, … times as much, we say that “○ is proportional to □.” (Fujii & Iitaka, 2012, Grade 5, Book A, p. 20, emphasis original)
This one-page investigation is the only discussion of proportional relationships in Grade 5. However, this is consistent with how Teaching Guide defines a “simple” proportional relationship. Teaching Guide specifically states that “a simple case means students become aware that sometimes when one quantity becomes 2, 3, 4, … times as much, the other quantity will also become 2, 3, 4, … times as much” (MEXT, 2008c, p. 187, translation by Author).
In Grade 5, much attention is paid on two cases of ratio/rate involving two quantities. In the first unit, Let's think about how to compare (1), the series investigates ratio/rate of two quantities with unlike units, such as crowdedness (comparing the number of rabbits and the area of their hutches), population density, and crop yield from different sized fields. The textbook introduces the label, per-unit quantity, to describe this type of measurement. In the second unit, Let's think about how to compare (2), students investigate comparisons of two quantities with like units, such as the number of shot attempts and the number of successful shots in basketball games. The textbook introduces the term wariai which is a single number that describes the ratio of the two quantities. In both cases, students are first asked to compare two situations where one of the two quantities were the same, for example, two rabbit hutches both have an area of 6 m2, but one has nine rabbits while the other has eight, or two games in which a player made four successful baskets but in one game she attempted eight shots while in the other game she attempted ten shots. Through these explorations, students come to realize that these comparisons would be simple if one of the quantities is the same in two situations. From there, they develop the idea of making one of the quantities into a unit amount and comparing the other amount per unit of the first quantity. In the unit where two like quantities are compared, the idea is further developed into the idea of percentage, by considering the base of comparison to be 100 instead of 1.
In both units, the information being compared are initially shown in tables similar to the one shown in Figure 1, which is from the introductory problem on per-unit quantity.
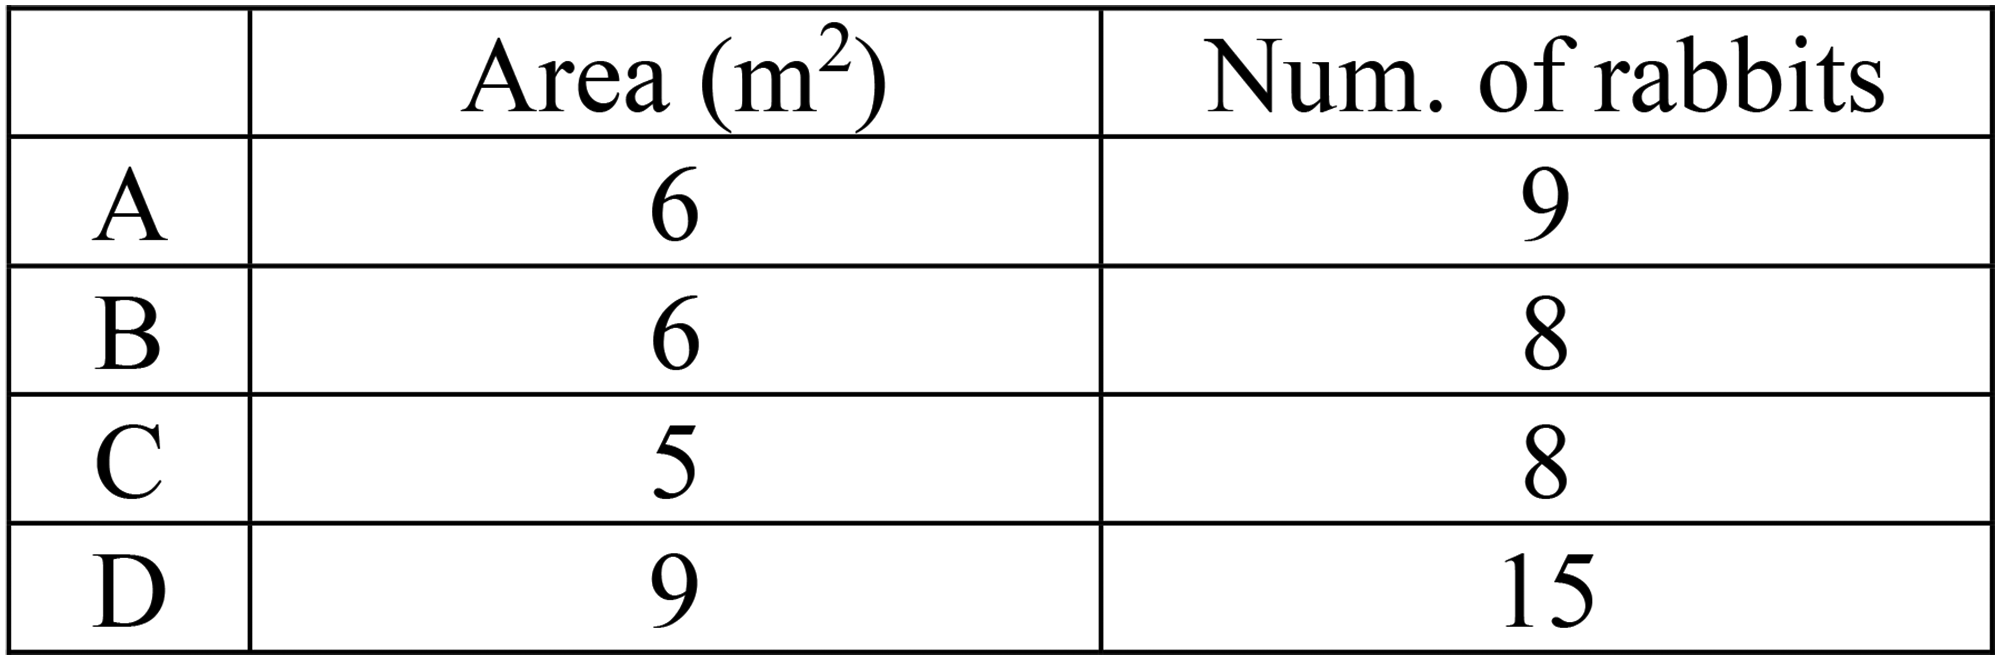
Data for rabbit hutch problem.
In the per-unit quantity unit, the textbook series utilizes double number line models along with division equations to illustrate that a per-unit quantity is the quotient of an amount of one quantity divided by the amount of the second quantity, which results in the amount of the first quantity per one unit of the second quantity as shown in Figure 2. Note that this division, since it is determining the amount per one, is partitive division.
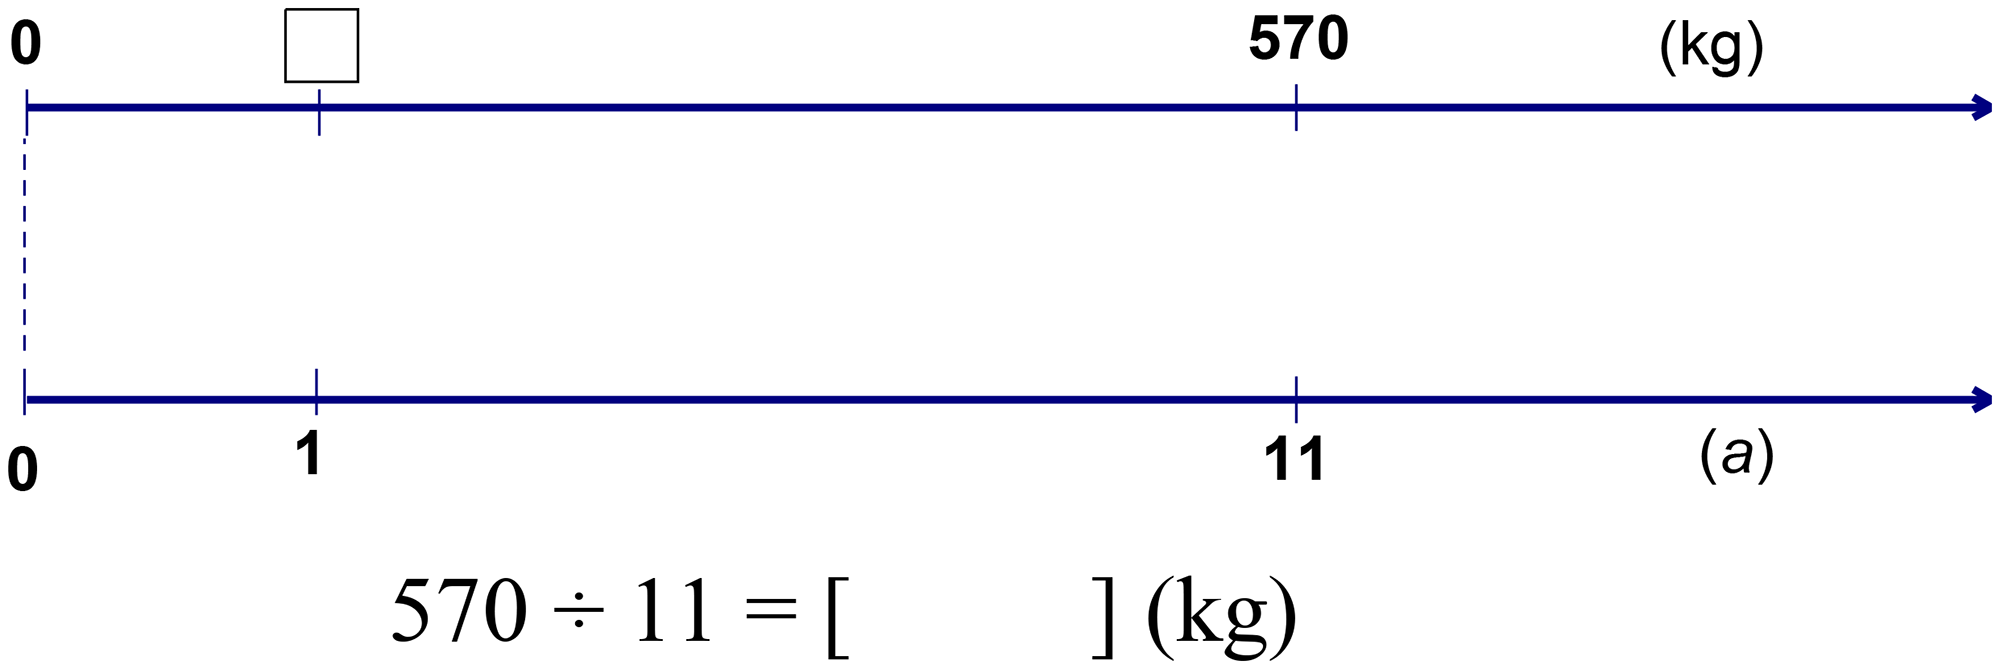
A double number line model comparing two quantities with unlike units and related division equation.
While double number line models only appear toward the end of the per-unit quantity chapter, in the unit comparing two quantities with like units, double number line models are used from the beginning to illustrate the idea of wariai, how many times as much a quantity is compared to the base quantity. While wariai is also determined by division, a double number line model visually illustrates that the division to determine wariai is quotative (see Figure 3) while, as noted before, the division to determine the per-unit quantity is partitive. In both units, double number line models are utilized on application problems.
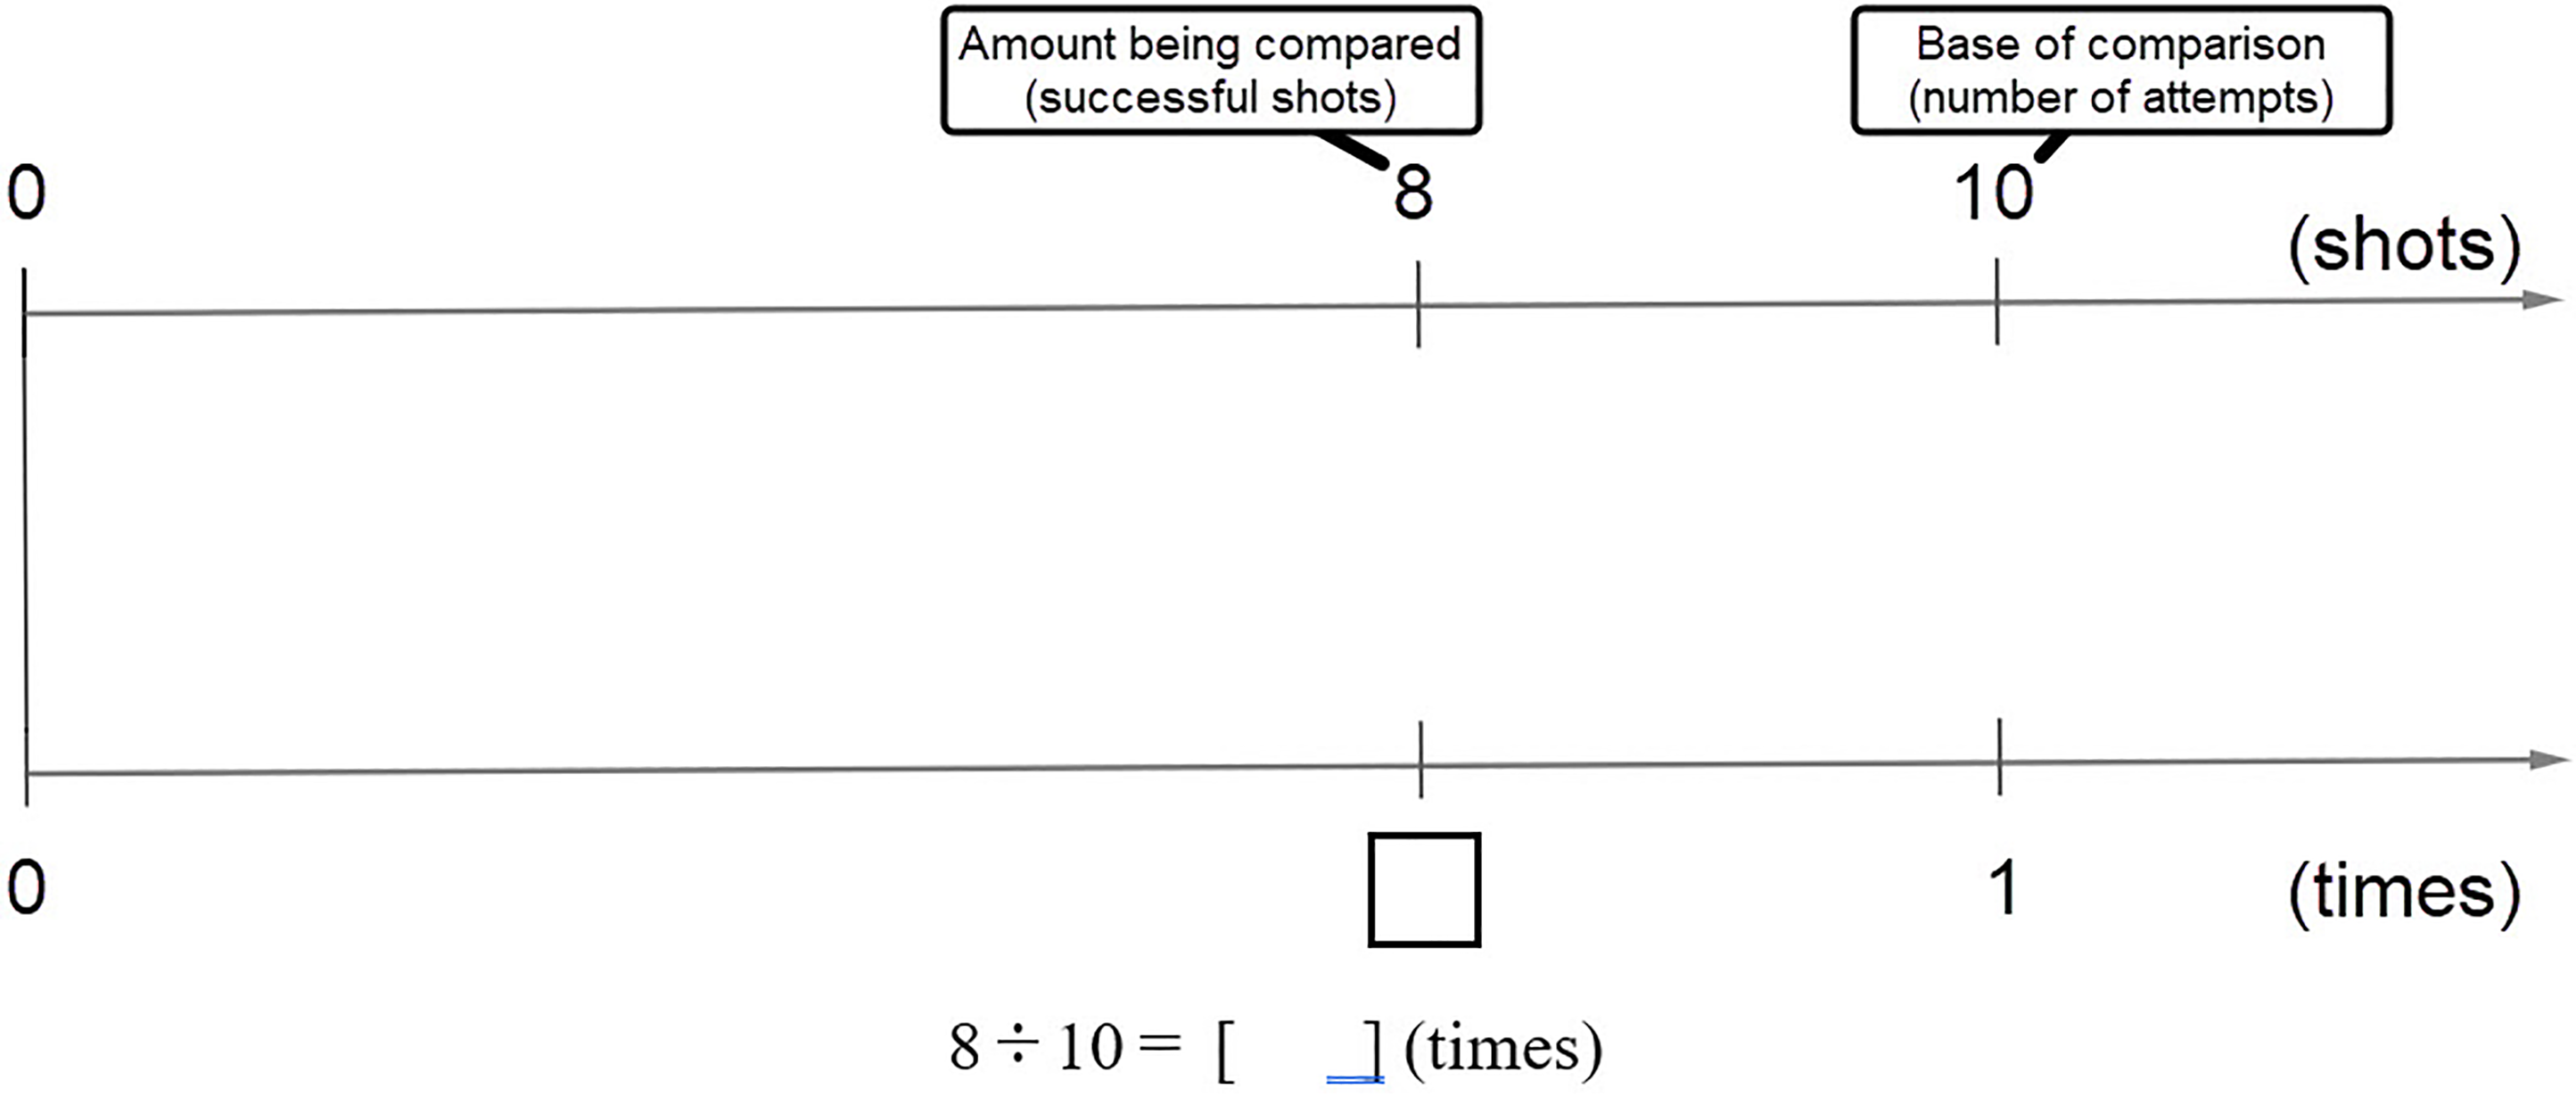
Double number line model comparing two quantities with like units and related division equation.
As noted above, proportional relationships are introduced and defined in Grade 5, but more in-depth discussions of proportional relationships occur in Grades 6 and 7. When the idea of proportionality is introduced in Grade 5 of this series, students investigate the relationship between the height and the volume of rectangular prisms with congruent bases. Specifically, students are asked how the volume changes when the height becomes 2, 3, … times as much. This question then leads to the definition of a proportional relationship, as discussed above. While investigating two co-varying quantities in Grade 4, the textbook asks several times how one quantity changes as the other quantity increases by 1 unit. Thus, investigating how a quantity changes when the other quantity becomes so many times as much, that is, to view changes in quantities multiplicatively, is a new perspective introduced in Grade 5.
In Grade 6, students are given a table showing the number of minutes and the depth of water as water is being poured into a fish tank from a faucet. The textbook explicitly states that the depth of water is proportional to the number of minutes. Students are then asked to find the quotients when the depth of water is divided by the amount of time so they discover that the quotients of corresponding quantities are constant. Students then conclude that if y is proportional to x, their relationship can be expressed in an equation, y = (fixed number) × x. Later in the unit, this relationship is contrasted with inversely proportional relationships where the products of the two corresponding quantities are constant and their relationship can be expressed in an equation, y = (fixed number) ÷ x.
In Grade 5, students only consider what happens to the corresponding quantities when the other quantities become 2, 3, 4, … times as much; that is, only whole number multiples. In Grade 6, students discover that the same relationship holds even if the scale factors are positive decimal numbers or fractions. Students also graph proportional relationships and are expected to discover that graphs of proportional relationships will be straight lines that start on the bottom left corner of the graph paper, or the origin. It should be noted that since students have not yet studied negative numbers, the x–y coordinate consists only of the first quadrant.
In Grade 7, there seems to be two foci in the units of direct and inverse proportional relationships. The first emphasis is understanding the idea of functions, which is the topic of the first sub-unit. Students examine proportional relationships as a type of functional relationship. In other words, students use familiar proportional relationships to make sense of functional relationships. As students learn about functions, they are introduced to the idea of domain and range. The second emphasis in Grade 7 is to extend the domain and the value of the constant of proportionality—formal terminology introduced in Grade 7—to span the entire set of rational numbers. They learn that two quantities x and y are in a direct proportional relationship if they can be represented as
In Grade 6, when students are asked to solve problems using proportional relationships, they are often given a table showing two pairs of values of the quantities involved in the problem situation similar to the one shown in Figure 4.
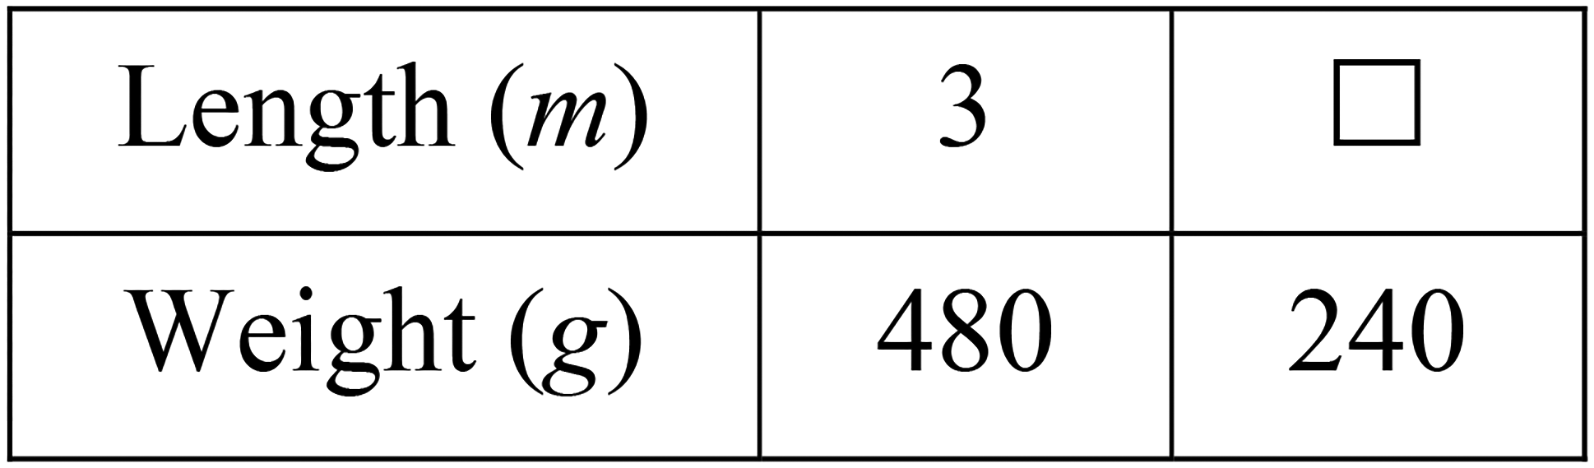
Table of data in a grade 6 problem.
The emphasis seems to be for students to identify the multiplicative relationship between two values of a quantity—weight, as shown in Figure 4—and use that relationship to find the missing quantity. In Grade 7, no visual representations accompany the application problems. The emphasis appears to be on establishing the equations showing the relationship between the two quantities in the form of
Treatment of ratio/rate/proportion in the Japanese series clearly exemplifies Lamon's (2007) claim that these topics require “the most protracted in terms of development” (p. 629). Given the general belief that the Japanese curriculum includes minimal amount of repetition, it was a little surprising initially to see that proportional relationships were discussed across three grade levels in the Japanese curriculum. However, the analyses in this study clearly show that even though the idea of proportional relationships is developed across three grade levels, there is an obvious expansion of ideas across grades. For example, in Grade 5, a proportional relationship is defined only with whole number multiplicative relationships. In Grade 6, this is expanded to involve all positive rational numbers. In Grade 7, the definition of a proportional relationship is further expanded so that the constant of proportionality includes both positive and negative rational numbers. Moreover, there is a gradual development of representations of proportional relationships using mathematical expressions. In Grade 5, the relationship is primarily described in words, while in Grade 6, students realize that direct proportional relationships involve two quantities whose quotients of the corresponding values are constant and inversely proportional relationships involve two quantities whose products of corresponding values are constant. In Grade 7, students expressed those relationships in equations, either
It is also a little surprising that proportional relationships are defined, in Grade 5, before students formally study ratios, in Grade 6. However, it may only be surprising if we consider the definition of proportions to be the equality of two equivalent ratios. In fact, Leen Streefland (1985) suggests that learning a pair of quantities are in a proportional relationship should precede the formal study of concept of ratio. The way the Japanese textbook defines a proportional relationship in Grade 5, when two quantities co-vary in such a way that when one quantity becomes 2, 3, … times as much, the corresponding quantity also becomes 2, 3, … times as much, is readily accessible to students who have studied whole number multiplication and division. In fact, all multiplication and division situations indeed involve proportional quantities, and the Japanese approach seems to allow students to re-examine familiar multiplication and division situations using the proportional relationship as a new and unifying lens.
Another interesting observation is that the Japanese textbooks, at least in this particular series of textbooks, does not have students set up a proportion, an equation showing the equivalence of two ratios with one unknown, as a method to deal with solving what typically referred as missing-value proportion problems. Thus, there is no discussion of a solution procedure such as “cross-multiply.” As stated above, proportion equations are discussed in the unit of linear equations in Grade 7. However, none of the problems presented in that unit have the relationships described as proportional relationships. In fact, although some of the problems in the section may be missing-value proportion problems, others are not, as two examples in Figure 5 show.
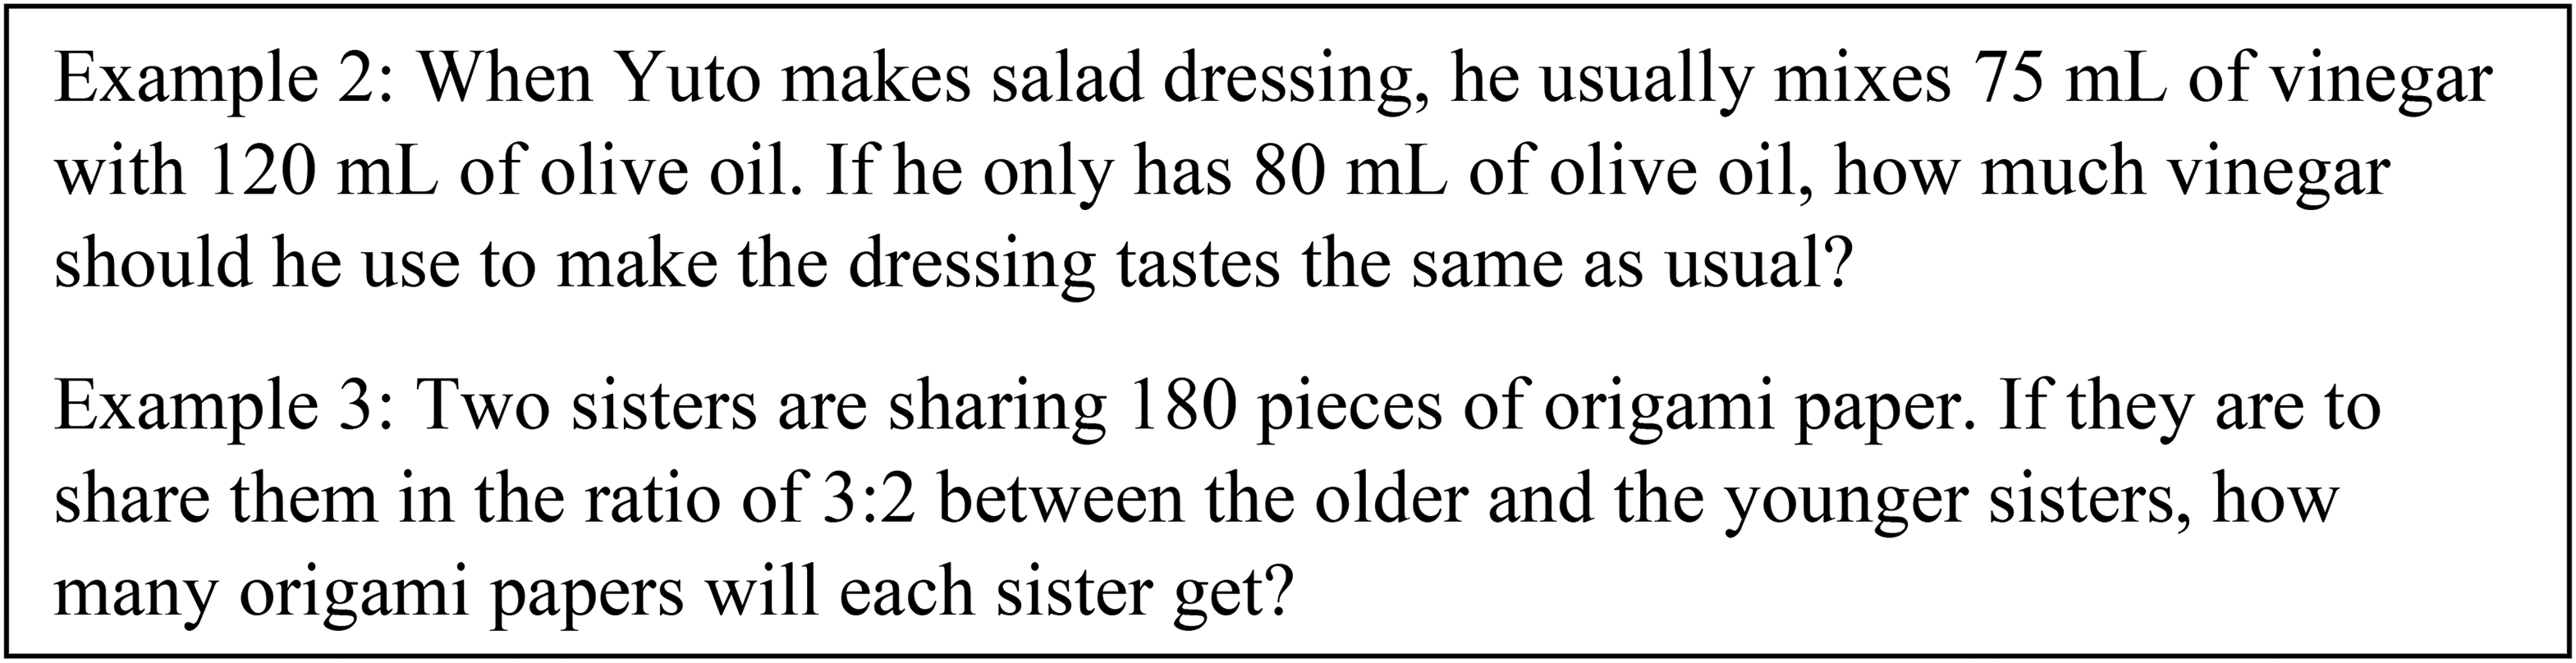
Examples from Grade 7 textbook (Fujii & Matano, 2012, pp. 100–101).
Although the Japanese textbook series examined in this study does not ask students to set up a proportion to solve missing-value proportion problems, they do indeed ask many such questions, often without necessarily making an explicit reference to proportional relationships. For example, there are problems in the unit of per-unit quantity (in Grade 5) that may be considered missing-value proportion problems even though one of the given quantities is 1. The problem shown in Figure 6 comes from a Grade 4 unit on whole number division in which students investigate times-as-much relationships.

A missing-value problem from Grade 4 textbook (Fujii & Iitaka, 2012, Grade 4, Book A p. 47).
According to Pepin and Haggarty (2001) “… textbooks should be analysed both in terms of their content and structure, as well as in terms of the process component, i.e., their use in classrooms by pupils and teachers” (p. 160). However, in this study, our focus was limited to the analysis of the content and structure of one particular textbook series. Thus, a follow-up study that examines the actual use of textbooks by pupils and teachers in their classrooms is warranted.
Although the grade placement of topics is determined by the Japanese National Course of Study, therefore common across different textbook series, how each topic is treated as well as the sequence of topics within a grade may vary among different textbook series. Therefore, even though this study analyzed the series that is most widely used in Japanese schools, it may be profitable to examine other textbook series.
Footnotes
Declaration of conflicting interests
The author declared no potential conflicts of interest with respect to the research, authorship, and/or publication of this article.
Funding
The author received no financial support for the research, authorship, and/or publication of this article.