
Abstract
In the large body of literature that is available about the role of motivation in mathematics education, the focus is mostly on students’ attitudes and feelings toward mathematics in general. In the current small-scale explorative study, we zoomed in on what students think about the tasks they can come across in mathematics education. To investigate students’ appraisement of mathematics tasks, that is, their judgment of how much they like mathematics tasks, we used a mixed method approach with an online questionnaire including closed and open questions. We asked 67 Norwegian eight graders to give an appraisal score for 24 tasks and to express in their own words their reasons for liking/disliking them. In addition, the students also had to indicate for each task whether they think they can solve the tasks. The analysis of the data indicated that the students may prefer bare number problems over context problems. Similarly, students inclined to like puzzle-like tasks more than estimation or straightforward tasks. The reasons for liking/disliking a task most often refer to the difficulty or easiness of the task. The data about the perceived solvability revealed that the more the students believed that they can solve the task, the more they liked the task. Given the different appraisals that the students granted to the different task types and the comments they came with, there is much reason to afford students a stronger voice in mathematics education research, particularly when it is about the tasks used in mathematics education.
Introduction
It has been revealed in several studies (e.g., Forsblom et al., 2022; Schukajlow, 2015) that students’ feelings about mathematics, their emotions, and motivational orientations such as enjoyment, boredom, and interest are of influence on their learning of mathematics and are related to the achievement level they acquire in mathematics. For example, in the recently carried out longitudinal large-scale survey by Forsblom et al. (2022) in which the mathematics-related emotions of 10–17-year-old students were investigated, it was found that enjoyment of mathematics positively predicted students’ achievements, while anger and boredom negatively predicted their learning results.
However, we noticed that when investigating students’ motivation for mathematics, students’ liking/disliking of tasks is scarcely researched. The work of Schukajlow (2015) is an exception to this. He scrutinized the relation between boredom and performance and particularly examined this for three types of problems. In his experimental study with ninth and tenth graders, he found significant differences in how a relation between boredom and performance worked out for different types of problems. The correlations tended to be lower for intramathematical problems, which do not have a connection to reality and can be solved by using only mathematical procedures than for word problems or modeling problems.
This finding makes it clear that when investigating students’ liking or disliking of mathematics, the nature of the tasks is a factor that should be taken into account. Inspired by the research of Schukajlow (2015) our study continued on this line of inquiry.
Theoretical perspective and research questions
The theoretical perspectives that guided our study were the crucial role of motivation in learning mathematics and the specific role of tasks to promote interest and engagement in students. Together with the findings from earlier research on students’ appraisal of tasks, these perspectives formed the basis of our research questions.
Crucial role of motivation
Motivation is considered to be the driving force in the learning of mathematics (e.g., Gojak, 2013). It makes sure that students are actively involved in learning. Their positive feelings may impact their willingness to be involved and increase their motivation. On the other hand, negative feelings may result in a decrease in their motivation. Therefore, a great deal of research has been carried out aimed at getting a better understanding of students’ motivation.
Concerning motivation in the context of learning mathematics an important basis for this research is led by McLeod (1992) who conceptualizes affect as consisting of emotions, attitudes, and beliefs. Following this approach, Hannula (2006, p. 166) sees motivation as “a potential to direct behaviour that is built into the system that controls emotion.” When it is about the motivation to solve a mathematics task, Hannula (2006) conceives that students’ motivation to problem-solving as manifested in their beliefs about their cognition, behavior, and emotion.
Middleton et al. (2017, p. 668) see “affect, cognition, motivation, and social interactions as intertwined, mutually interacting, and highly situational influences on engagement.” Here engagement means that somebody takes part in an activity that requires some cognitive or affective investment. Middleton et al. (2017) refer to this as in-the-moment engagement which can be connected to a very specific object such as a mathematics task. According to Mitchell (1993), this interest in the moment needs to be caught by some key facets of the task. This may mean that students’ interest in a task is not only an issue of their levels of personal interest in mathematics. Since, regardless of students’ general feelings about the subject the interest they show in any particular task can vary widely (Middleton et al., 2017).
The approach of taking into account the situational influences can also be found in the work of Schukajlow et al. (2023), who recognized that there is recently increased attention on the situational nature of affective constructs. Therefore, they decided to include in their survey paper, “situational specificity” as a key characteristic of emotions and motivation which can be embedded in social environments and sociocultural contexts as well as in tasks. For example, researchers found that adapting the contexts of tasks to students’ interest areas improved the students’ situational interest in the task (Bernacki & Walkington, 2018) and that prompting students to find multiple solutions to modeling problems had a positive influence on students’ interest in mathematics (Schukajlow & Krug, 2014).
Such a task-specific approach is scarcely found in motivation studies. The focus is mostly on mathematics in general or on what students think of parts of mathematics. Specifically, in TIMSS the general question of liking/disliking mathematics is one of the standing components in the student questionnaire. The 2019 cycle of this study covering 64 countries figured out that only 20% of the eighth-grade students liked learning mathematics very much, 39% liked it somewhat, and 41% did not like it (Mullis et al., 2020).
Given the consequences of this negative attitude toward mathematics, the question immediately arises as to what the ground is for students not liking mathematics. When the focus is on mathematics in general then the provided reasons for liking/disliking will also be general. For example, when Aguilar (2021) asked high school students about this he found that one of the main reasons for student's reluctancy toward mathematics is their perceived lack of understanding and their self-perception of low content knowledge. Comparable reasons were found in a study in Tanzania carried out by Mazana et al. (2019), in which a large group of primary, secondary, and college students participated. The students mentioned that they do not like mathematics because the subject is difficult, they are not good at mathematics, and it is not necessary for their future careers. Students who liked mathematics indicated that they like it because they see its value in everyday life, and because they find mathematics interesting and enjoyable.
Studies like those previously mentioned provide information about how students think about mathematics in general, but they do not offer concrete indications for how education can be adapted to facilitate students’ engagement.
Specific role of tasks
To find ways for improving students’ engagement requires a deeper look into where the mathematical activity starts and where the motivation is triggered. According to Middleton (2013, p. 78), it is the task where the motivation is induced, “because much of students’ motivation in mathematics is due to the way we design mathematical tasks.” Similarly, Roche et al. (2021) also identified the nature of a task and whether it is intrinsically interesting for students as relevant for increasing the likelihood of their engagement. Tasks that students like can act as facilitators to make them more motivated to work with them and can create advantageous conditions to make the learning process successful.
This pivotal role of the tasks that are used in mathematics education has also been emphasized by several other scholars. Among other things, they came to the conclusions that mathematical tasks largely determine what students learn (Hiebert & Wearne, 1993), that tasks have the greatest influence on what students learn compared to other features in the classroom (Smith & Stein, 1998), that tasks can shape students’ mathematical learning opportunities (Watson & Mason, 2007) and that the chosen tasks have a major part in determining the quality and nature of their learning (Clarke & Roche, 2018).
Earlier research on students’ appraisal of tasks
Despite the relevance that is attributed to tasks, research on how students think about different tasks is scarce. The study of Sullivan et al. (2013) is an exception. They chose to focus their data collection on finding insights into students’ reactions to different types of tasks since task characteristics seemed to be the main determinant of students’ decisions on engagement. In the survey, in which 922 students from Grades 5 to 8 were asked to rank three types of tasks, it was found that 54% chose the number calculation as their first preference. For the word problem, this was 35%, and for the open-ended task, this was only 12%. For preferring number calculation and word problems, the most often-given reason was finding them to be easy. For putting open-ended tasks in the first place the most frequently mentioned reasons referred to the challenging character of the task: “I like it because I want something challenging and hard.”
In a further analysis, Sullivan et al. (2013) found that the group of students who preferred number calculation contained more students who felt confident in mathematics than students with low confidence. Maybe the students with the highest confidence might prefer the number calculation task because then their success is under their own control. For the word problem, the reverse was the case. Then there were more students in the lowest confidence than in the highest confidence category. For the open-ended task, there was almost no difference between the numbers of students in the one and the other category of confidence.
These findings, and particularly the finding that students who had the highest confidence put the number calculation on the first place because of the easiness of the task, make clear that the students’ confidence with respect to whether they think they can solve the task, that is, the perceived solvability, is a relevant factor when investigating the students liking of the tasks. This is in line with Bandura's (1997) theory about self-efficacy which refers to the judgments individuals have about their perceived capability to perform future tasks and of which the perceived level of task difficulty is an integral part (Street et al., 2022). According to Bandura (1993, p. 119), “positive attitudes toward mathematics were better predicted by perceived self-efficacy than by actual ability.” This means that mathematics self-efficacy influences students’ motivational orientation. Students who report higher self-efficacy also report greater intrinsic motivation.
Support for this is furthermore provided by Stevens et al. (2004). They found in ninth- and 10th-grade students that self-efficacy predicted their motivational orientation and subsequently their mathematics performance. Also, in several other studies indications can be found about the relation between mathematics self-efficacy and the attitude toward mathematics (Öztürk et al., 2020) and the finding that one of the main reasons for student's reluctancy toward mathematics is their perceived lack of understanding and their self-perception of low content knowledge (Aguilar, 2021), and that “student motivation – both interest and motivated behaviour – is strongly predicted by self-efficacy” (Skaalvik et al., 2015, p. 135).
The basis for our study was what these earlier studies have shown about the possible influence of the task type, the reasons for liking/disliking tasks and the role of self-efficacy, especially understood as how students think about whether they can solve the tasks. Therefore, we formulated the following research questions:
What types of mathematics tasks do students tend to like or dislike? Why do students like or dislike these tasks? What is the relation between students’ appraisal of tasks and the perceived solvability of the tasks?
Method
Set up of the study
To answer the three research questions, a survey was carried out among eighth-grade students in Norway aimed at collecting data about the students’ appraisal of different kinds of mathematics tasks and about their reasons for liking or not liking the tasks. To know whether the students’ appraisal of the tasks was related to their perceived solvability of the tasks it was also investigated whether the students thought they could solve the tasks in question.
Participants
For recruiting students to take part in the study, an email was sent to the principals of about 20 schools in Northern Norway with information about the project and an invitation to participate in the study with their eighth-grade mathematics classes. The contacted schools were both large and small size, covering either Grades 1–10 or Grades 8–10. In the end, two large and two small schools in the Nordland region accepted to participate which resulted in a sample of 67 eighth-grade students. The large schools had multiple classes per grade, but less than 500 students in total. The small schools had around 100 students or less and only one class per grade.
Instrument
The instrument used for this study is an anonymous online questionnaire which was implemented in nettskjema.no. The questionnaire consisted of 24 mathematics tasks mainly in the domain of numbers for which each three questions were asked. First, the students had to indicate for each task on an ordinal Likert scale whether they like or dislike the task. There were five options for answering, ranging from liking the task a lot to strongly disliking it. Second, they were asked to explain in their own words why they like or dislike the task. The third question to be answered was whether they think they can solve the task. It was made clear to the students that for answering this question it was not necessary to solve the task. For this third question also an ordinal Likert scale with five options available was used which now ranged from being very certain they can solve the task to being very certain they cannot solve it. Before putting the final version of the questionnaire online, a try-out was carried out to check whether the tasks and the questions were clearly formulated, and whether the number of tasks was feasible for the students.
Each task was visible on the screen together with the three questions (Figure 1), which made that the students could see the task when they were answering the questions. At the start of the questionnaire, information was included to explain the questionnaires to the students and at the end, there was a message with a “thank you” for answering the questionnaire.
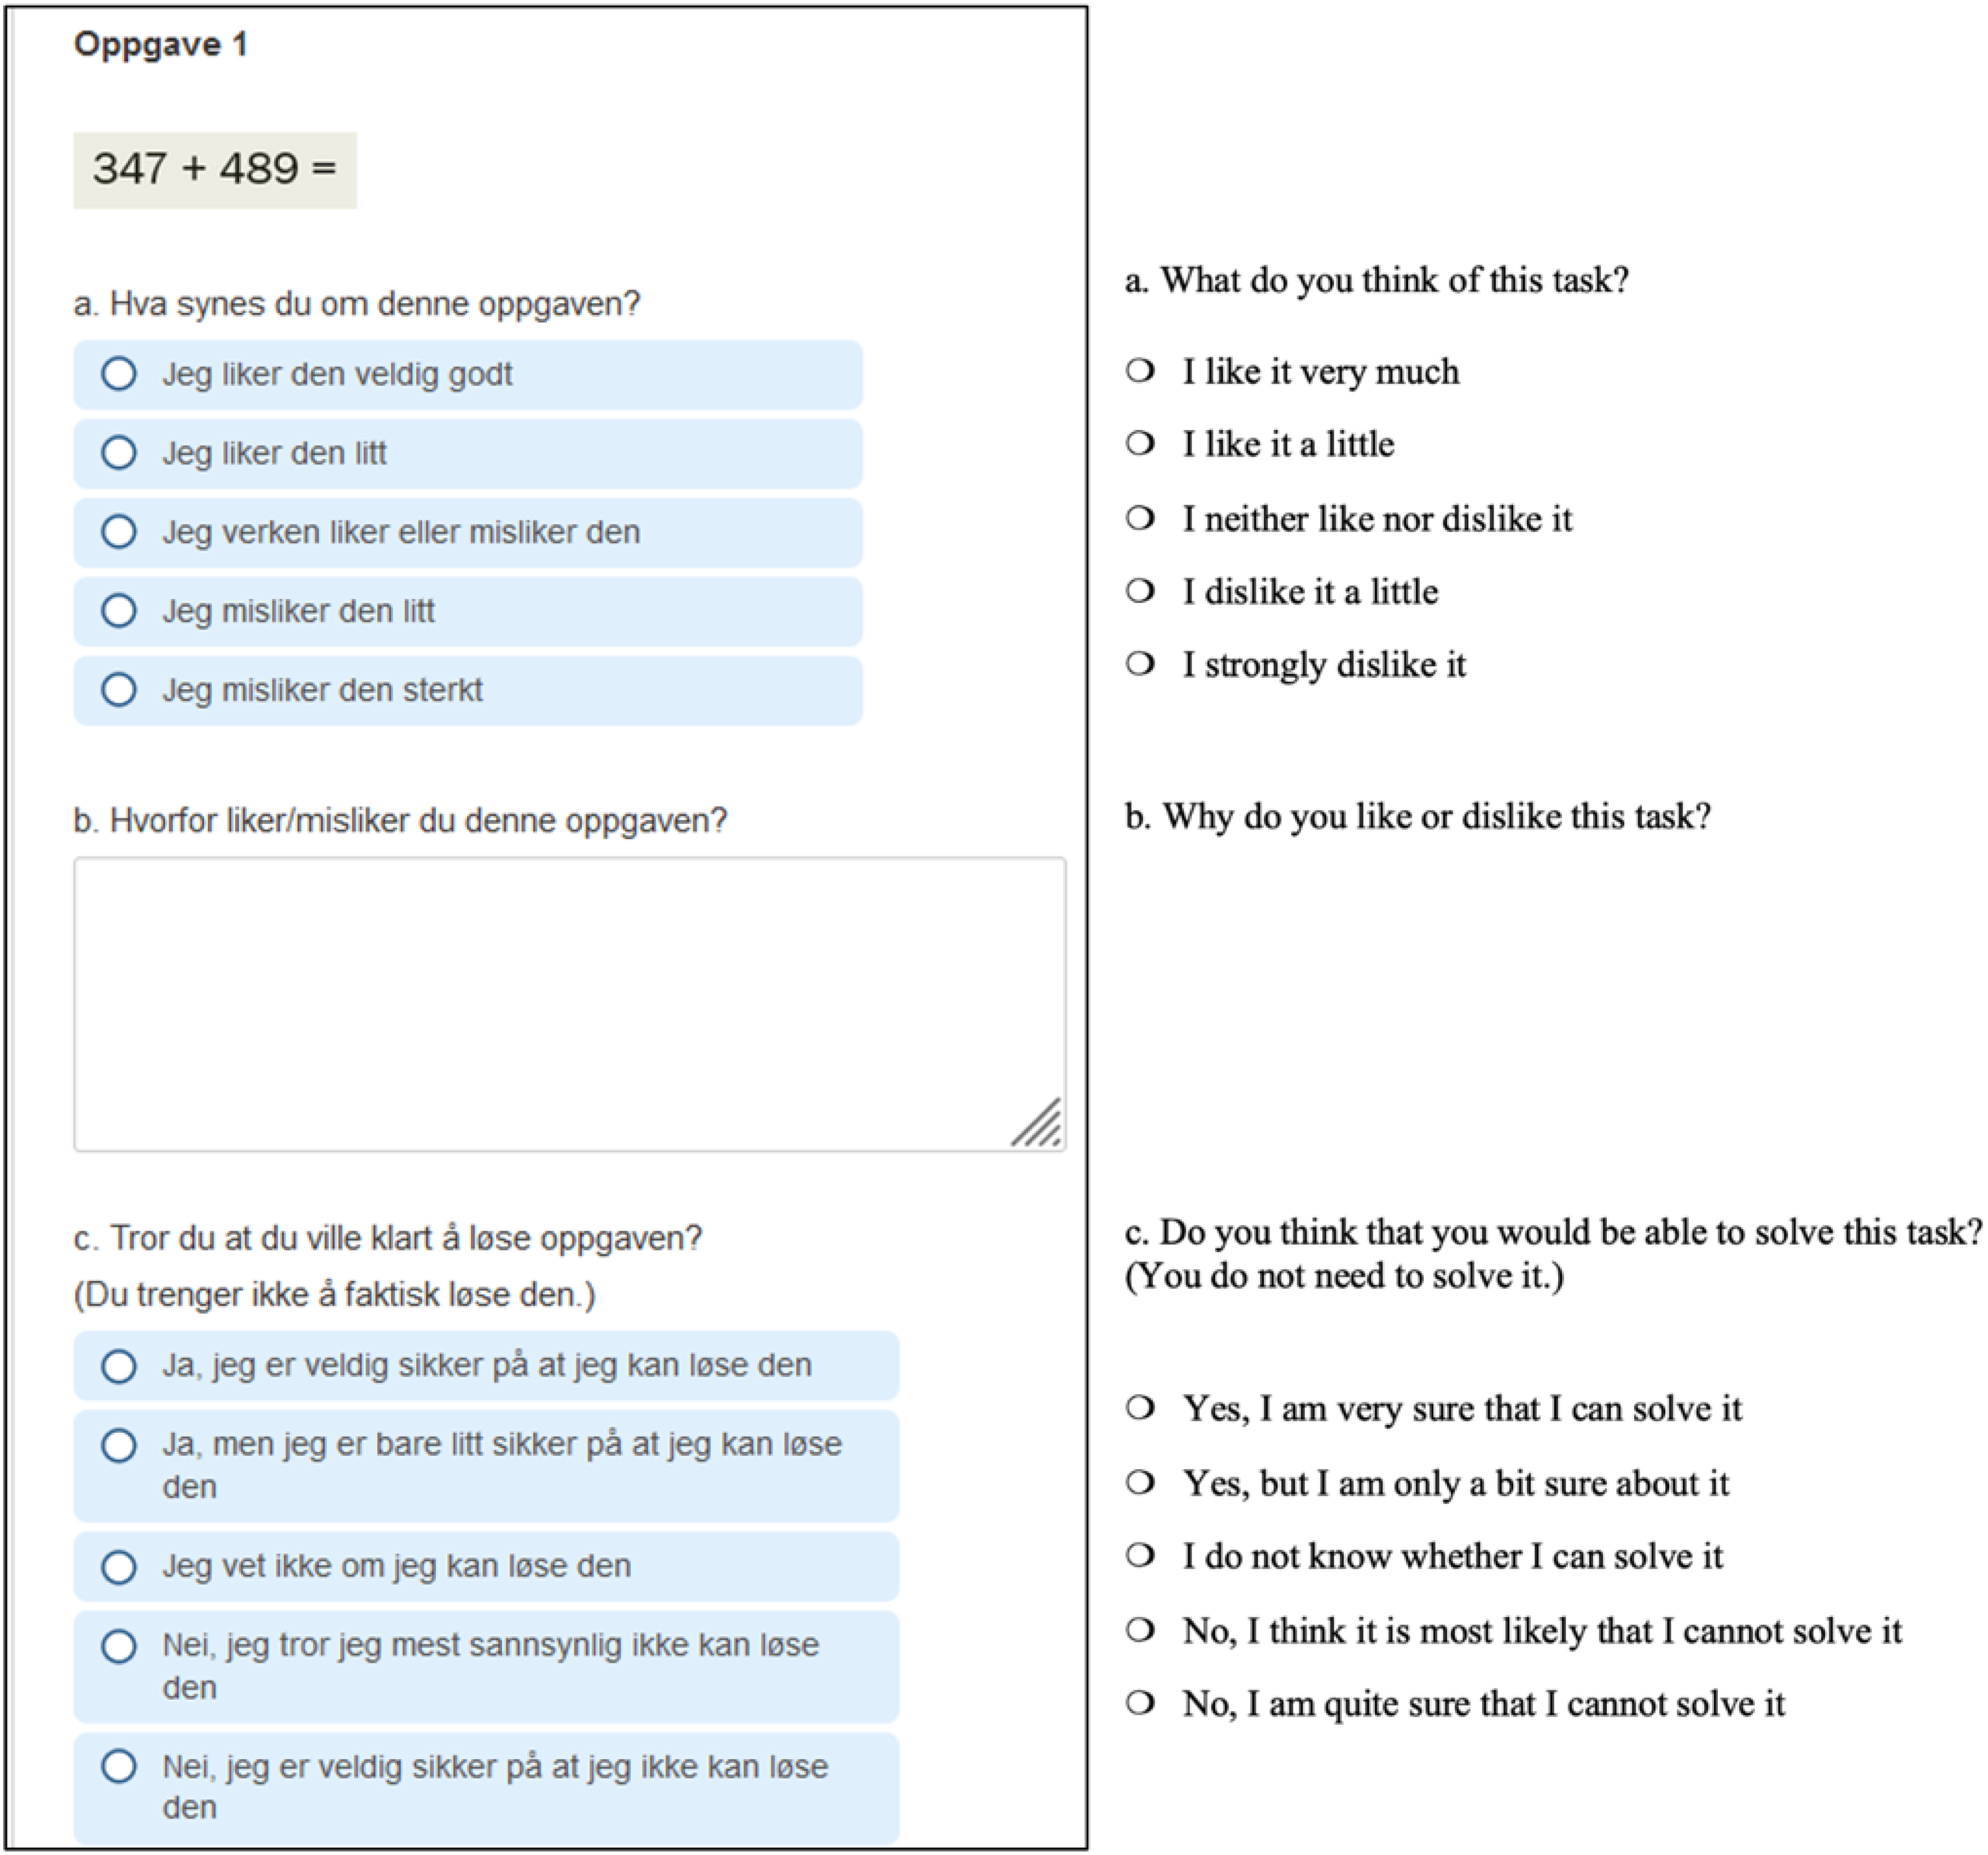
Screen view from the questionnaire and the English translation.
The students received the link to the questionnaire from their teacher. No further requirements were necessary for logging in, and no personal information had to be put in. The questionnaire was completely anonymous. From November 25, 2021 to January 15, 2022 the questionnaire was open for answering. The students all responded in early January 2022.
The tasks included in the questionnaire were initially taken from two mathematics textbooks for Grade eight. Moreover, to get a somewhat larger variety of tasks a few of them were altered or replaced by some self-made tasks. The used textbooks were published recently, and are following the new curriculum for mathematics education in Norway (Kunnskapsdepartementet, 2020). In order to limit the effect that the difficulty level of the tasks could have on the students’ appraisal, tasks were chosen which were marked in the textbooks as being of medium difficulty. Furthermore, the tasks were mostly taken from the first chapters of the textbooks so that it would be likely that the students would have already learned about them. In this way, unfamiliarity with the topics addressed in the questionnaire would have less influence on the answers of the students.
Table 1 gives an overview of the task types included in the questionnaire. The tasks were classified on how the problem is presented (as a bare number problem or as a context problem), the nature of the problem requiring a particular way of mathematical processing (straightforward calculating, puzzling, or estimating), the operation involved (+, –, ×, ÷) and the number types involved in the task (whole numbers, fractions, decimals, percentages). For every subcategory of task type, Table 1 shows how many of these were in the questionnaire.
Type and number of tasks included in the questionnaire.
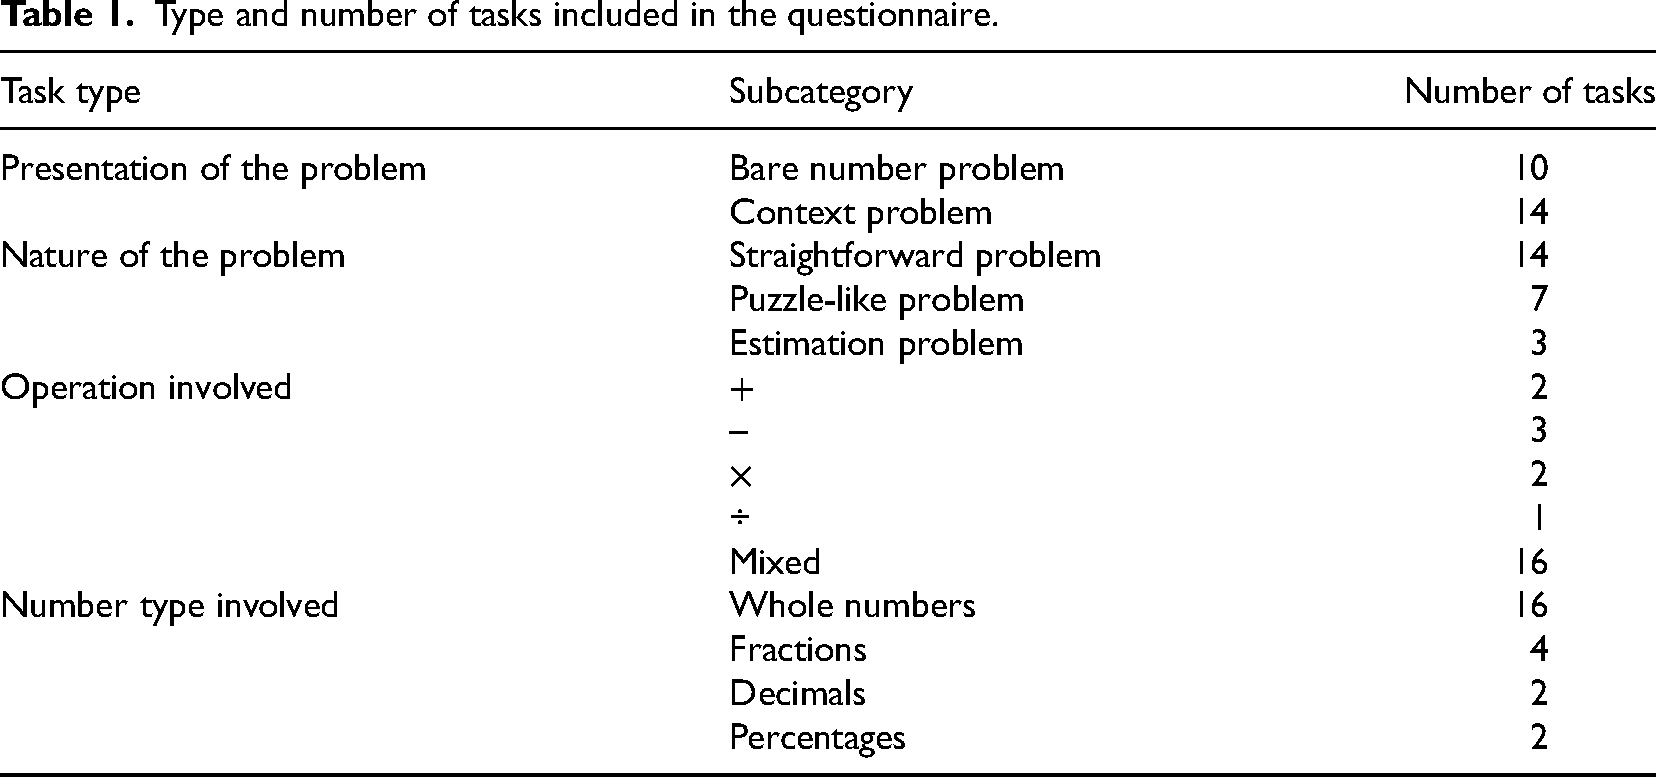
As can be seen in Table 1, the number of tasks is not the same for every subcategory. When choosing the number of tasks, it was attempted to follow the proportion that students can come across these categories regularly in textbooks. The only exception made was for context problems. In textbooks, the proportion of context problems is normally lower than that of bare number problems. The reason for including more context problems was to make it possible to investigate whether the appraisal of context problems and bare number problems differ. When calculating the Cronbach's alpha of the data collected for the 24 tasks, we found sufficient reliability for both the appraisal of tasks (α = .957) and the solvability of the tasks (α = .965).
The tasks were ordered in the questionnaire in such a way that there were not too many of a certain type after each other. This was done so that the order in which the students would see the tasks would have less of an effect on how they would answer the questions. The first few tasks were among the easier ones. This was done in order not to make the students lose their motivation in the beginning.
To investigate what tasks students like (Research Question 1) and whether students’ perception about being able to solve a task was related to liking or not liking a task (Research Question 3) a quantitative analysis was carried out. The analysis of the reasons for liking or disliking a task (Research Question 2) was mainly done more qualitatively by identifying categories of reasons and structuring them.
The responses the students gave to the first and third questions in the questionnaire (appraisal score and solvability score, respectively) were analyzed by means of IBM SPSS Statistics version 27. To carry out this analysis, the scores on the two rating scales were transposed to the numbers 1 to 5 where 1 was the lowest appraisal and perceived solvability, and 5 was the highest. First, the mean appraisal score and the standard deviation of each individual task were calculated. Since we measured the appraisal and solvability score at an ordinal level, we also calculated the medians of the scores. Thereafter the same calculations were carried out for each type of task. This was followed by testing whether there were differences between the different types. To find out whether there was a relation between the perceived solvability of the tasks and the appraisal score, Pearson's correlation coefficient was calculated on the basis of all the cases in which a score for solvability and appraisal was given to a task.
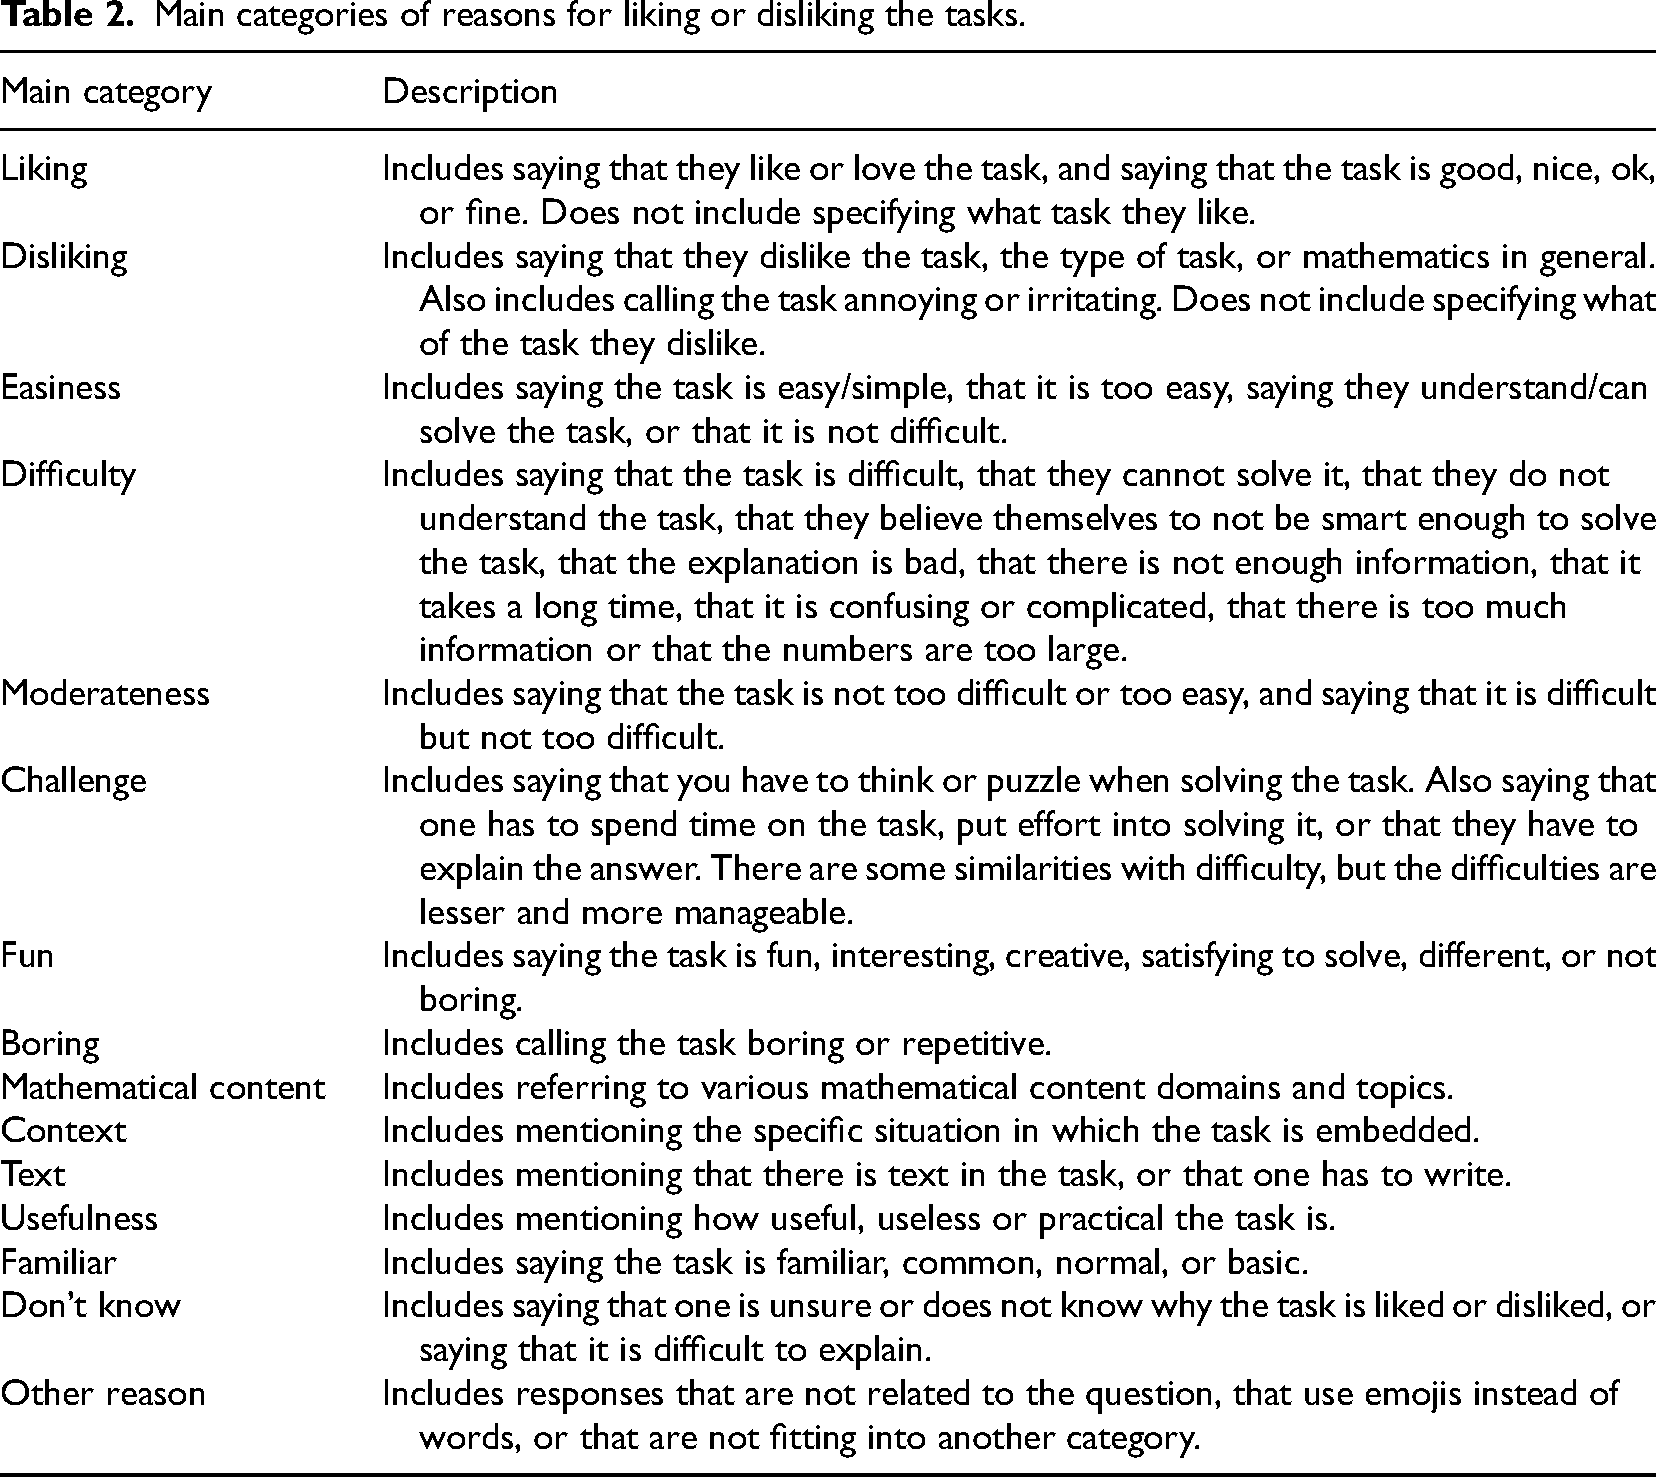
The reasons given for liking or disliking a task were analyzed by first importing all the written responses into an Excel file in which for each task and for each appraisal score the responses were sorted. In the second step, the given reasons were clustered in a number of main categories (Table 2). This clustering was first done by the first author, which was followed by a check by the second author and a joint discussion to reach an agreement. Some of the categories we found are similar to the ones that appeared in previous literature such as Mazana et al. (2019). After establishing the categories of reason, the frequency of each was calculated per appraisal score for each task and overall the tasks together.
Main categories of reasons for liking or disliking the tasks.
Main categories of reasons for liking or disliking the tasks.
Students’ appraisal of mathematics tasks
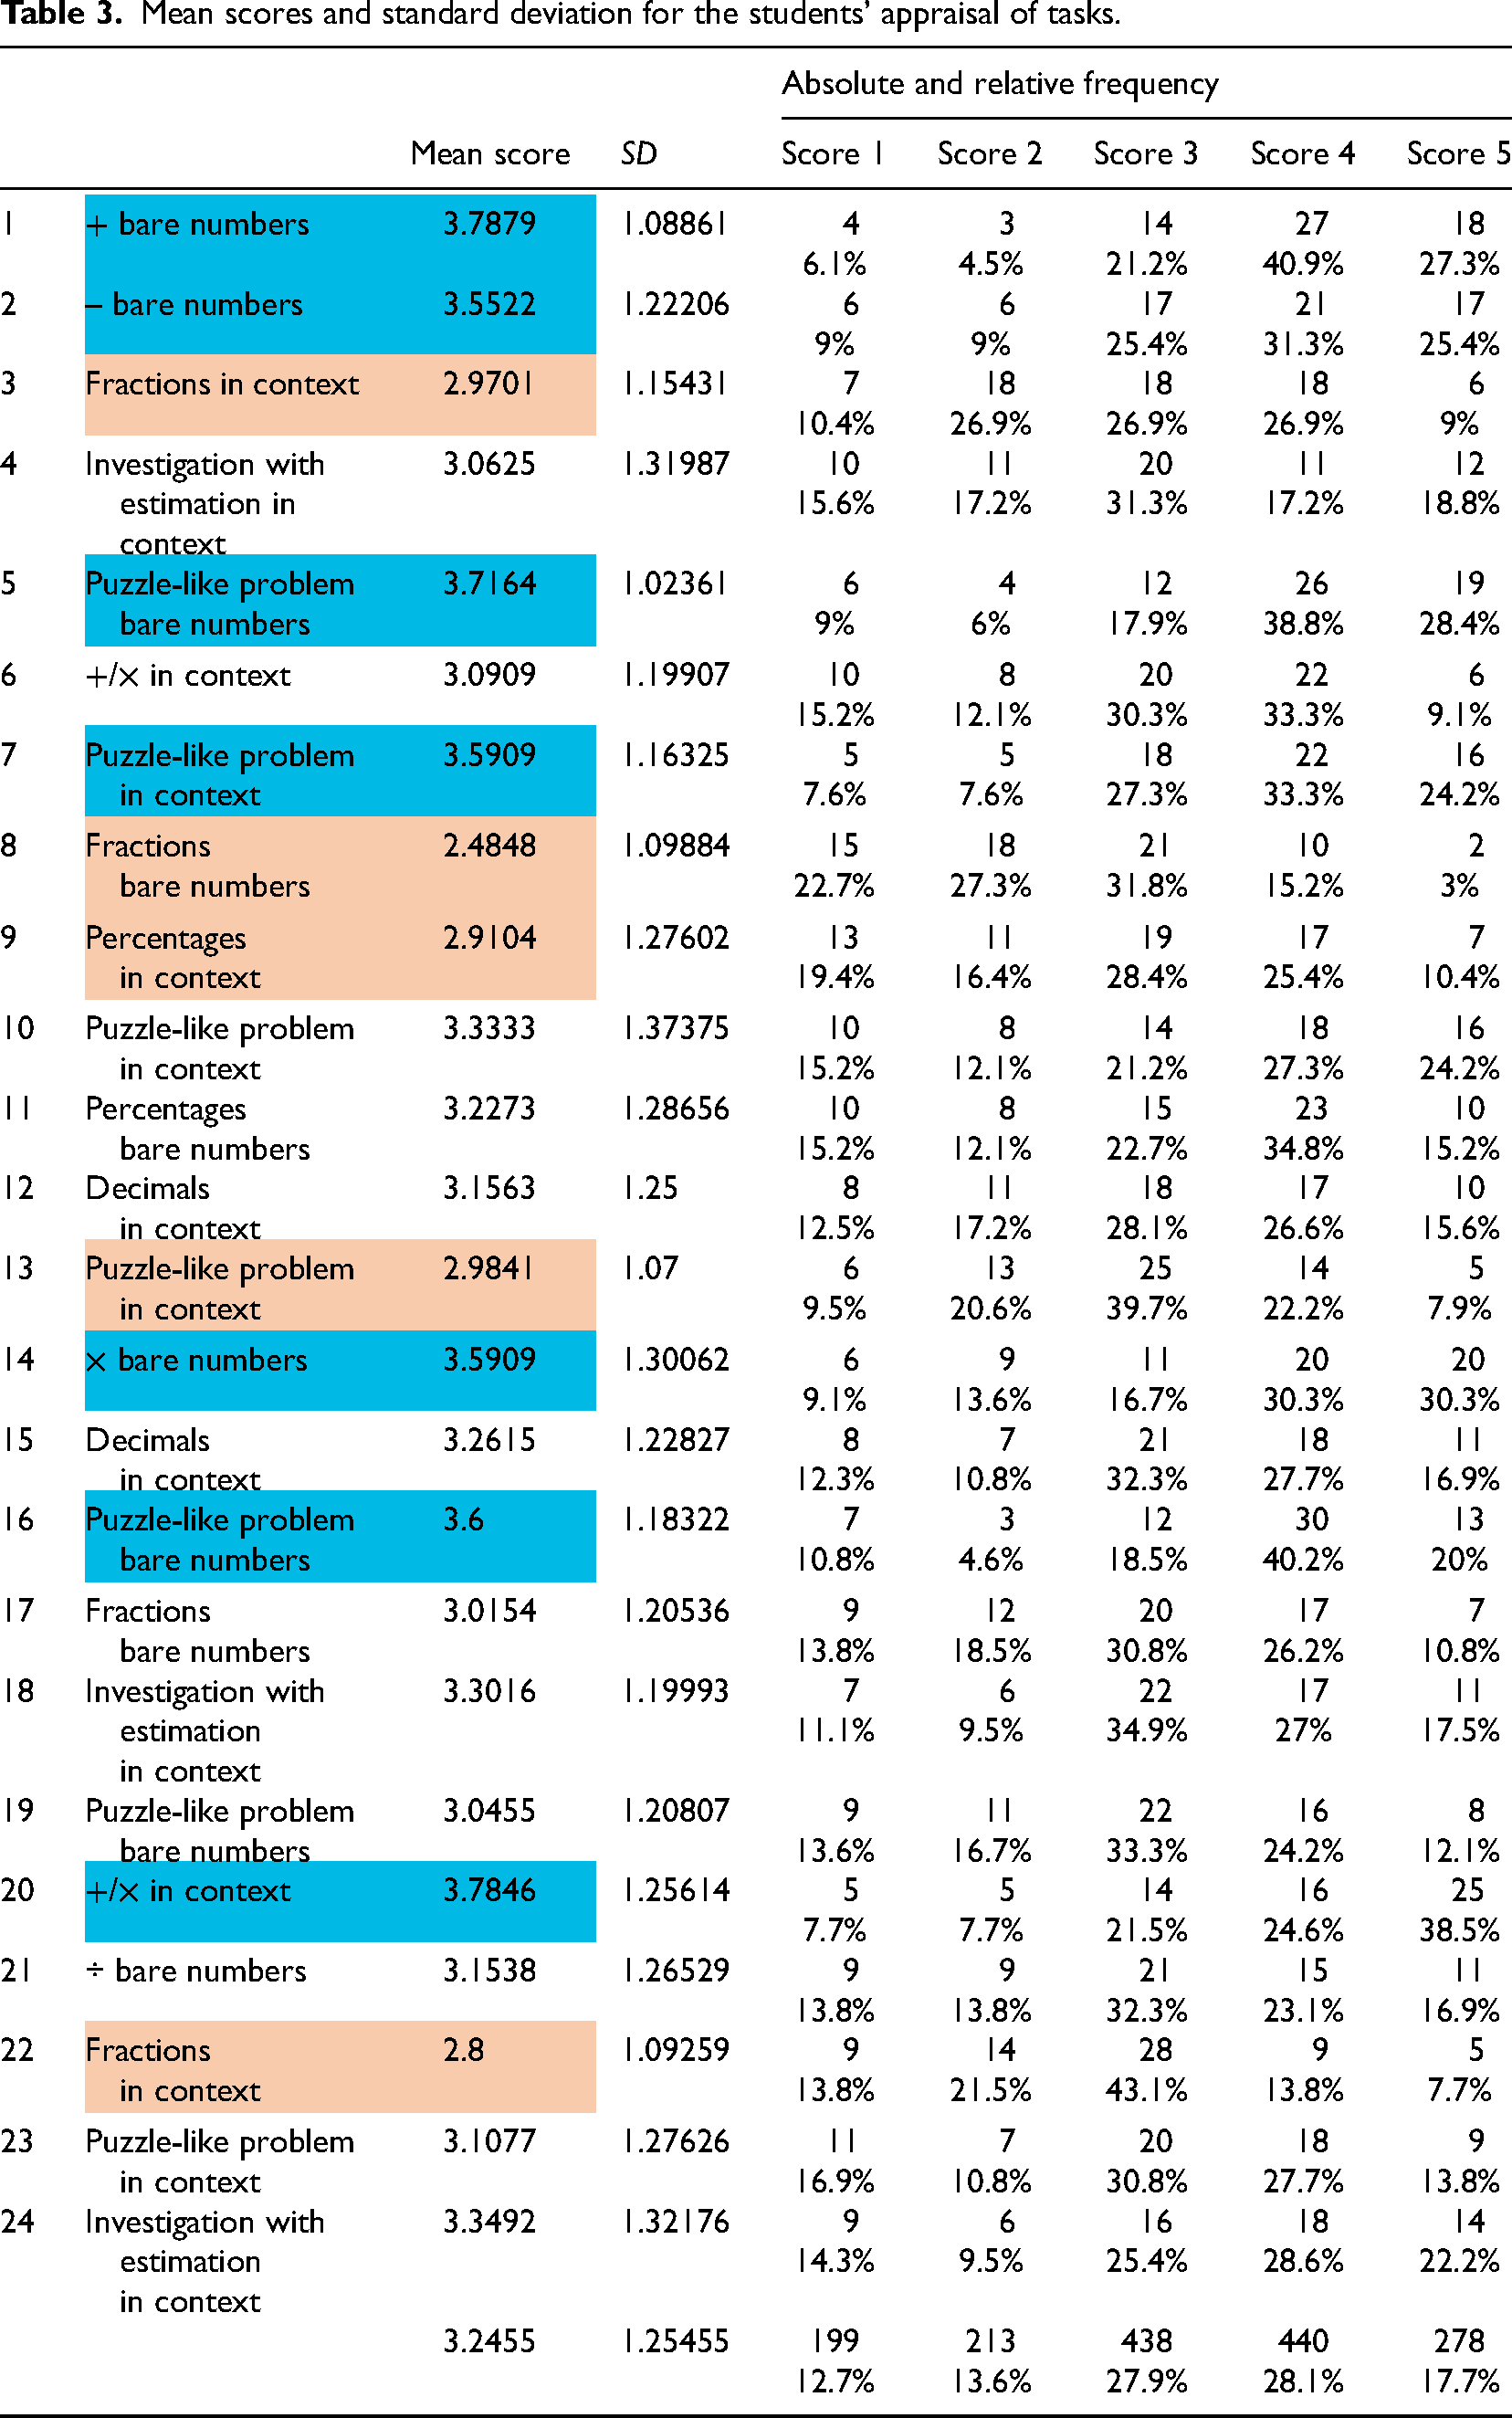
Out of the 1,608 possible ratings that the students could provide, 40 were left blank. This means that for the 24 tasks 1,568 ratings from 1 to 5 were given in total by 67 students. The analysis of the data indicated that in general the students neither liked the tasks very much nor disliked them very much (M = 3.25; Mdn = 3; SD = 1.255). Table 3 contains the mean scores and standard deviations of the students’ appraisal for each task. The tasks which were liked the most are colored blue and those which were disliked the most are colored orange. The specific tasks used in this study are in Table 3b in the Appendix.
Mean scores and standard deviation for the students’ appraisal of tasks.
Mean scores and standard deviation for the students’ appraisal of tasks.
The tasks that the students liked the most were three tasks with straightforward bare number problems (Tasks 1, 2, 14), two tasks with a puzzle-like bare number problem (Tasks 5 and 16), one task with a straightforward problem in context (Task 20), and one task with a puzzle-like problem in context (Task 7). All these tasks got a score of 5 from 20% to almost 40% of the students.
The less liked tasks were two tasks about fractions in context (Tasks 3 and 22), one about fractions with bare numbers (Task 8), one about percentages in context (Task 9), and one with a puzzle-like problem in context (Task 13). All these tasks had a mean appraisal score lower than 3.0. Of the complete set of tasks, an appraisal score of 1 was given most often to Tasks 8 and 9. This was done by 22.7% and 19.4% of the students, respectively. Task 9 is a context task about percentages and Task 8 is a bare number problem about fractions. This task also had the lowest average appraisal score.
In the appraisal scores for the subcategories of TaskType1 (tasks with bare number problems or tasks with context problems), the highest appraisal scores were found for the tasks including bare number problems. The highly appraised tasks with a bare number problem were three straightforward calculation problems and two puzzle-like problems. Of the 10 bare number problems, five had an average score higher than 3.5, and of the 14 tasks with a context problem, there were only two with an average score higher than 3.5. These two tasks are both related to playing football. Four of the tasks with a context problem had a mean score of less than 3.0, while this was only the case for one task with a bare number problem.
Altogether the tasks with a bare number problem had a higher mean, median, and standard deviation than the tasks with a context problem (bare number problems: M = 3.32; Mdn = 4; SD = 1.260; context problems: M = 3.19; Mdn = 3; SD = 1.248). As shown in Figure 2, for the tasks with a bare number problem the most often appraisal score given was 4, and the score given second most often was 3. The reverse was the case for the tasks with the context problems, for which the score 3 was given the most often and the score 4 the second most often. Furthermore, the bar graphs also show that the tasks with bare number problems have a slightly lower percentage of disliking the tasks and a slightly higher percentage of liking the tasks than the tasks with context problems.
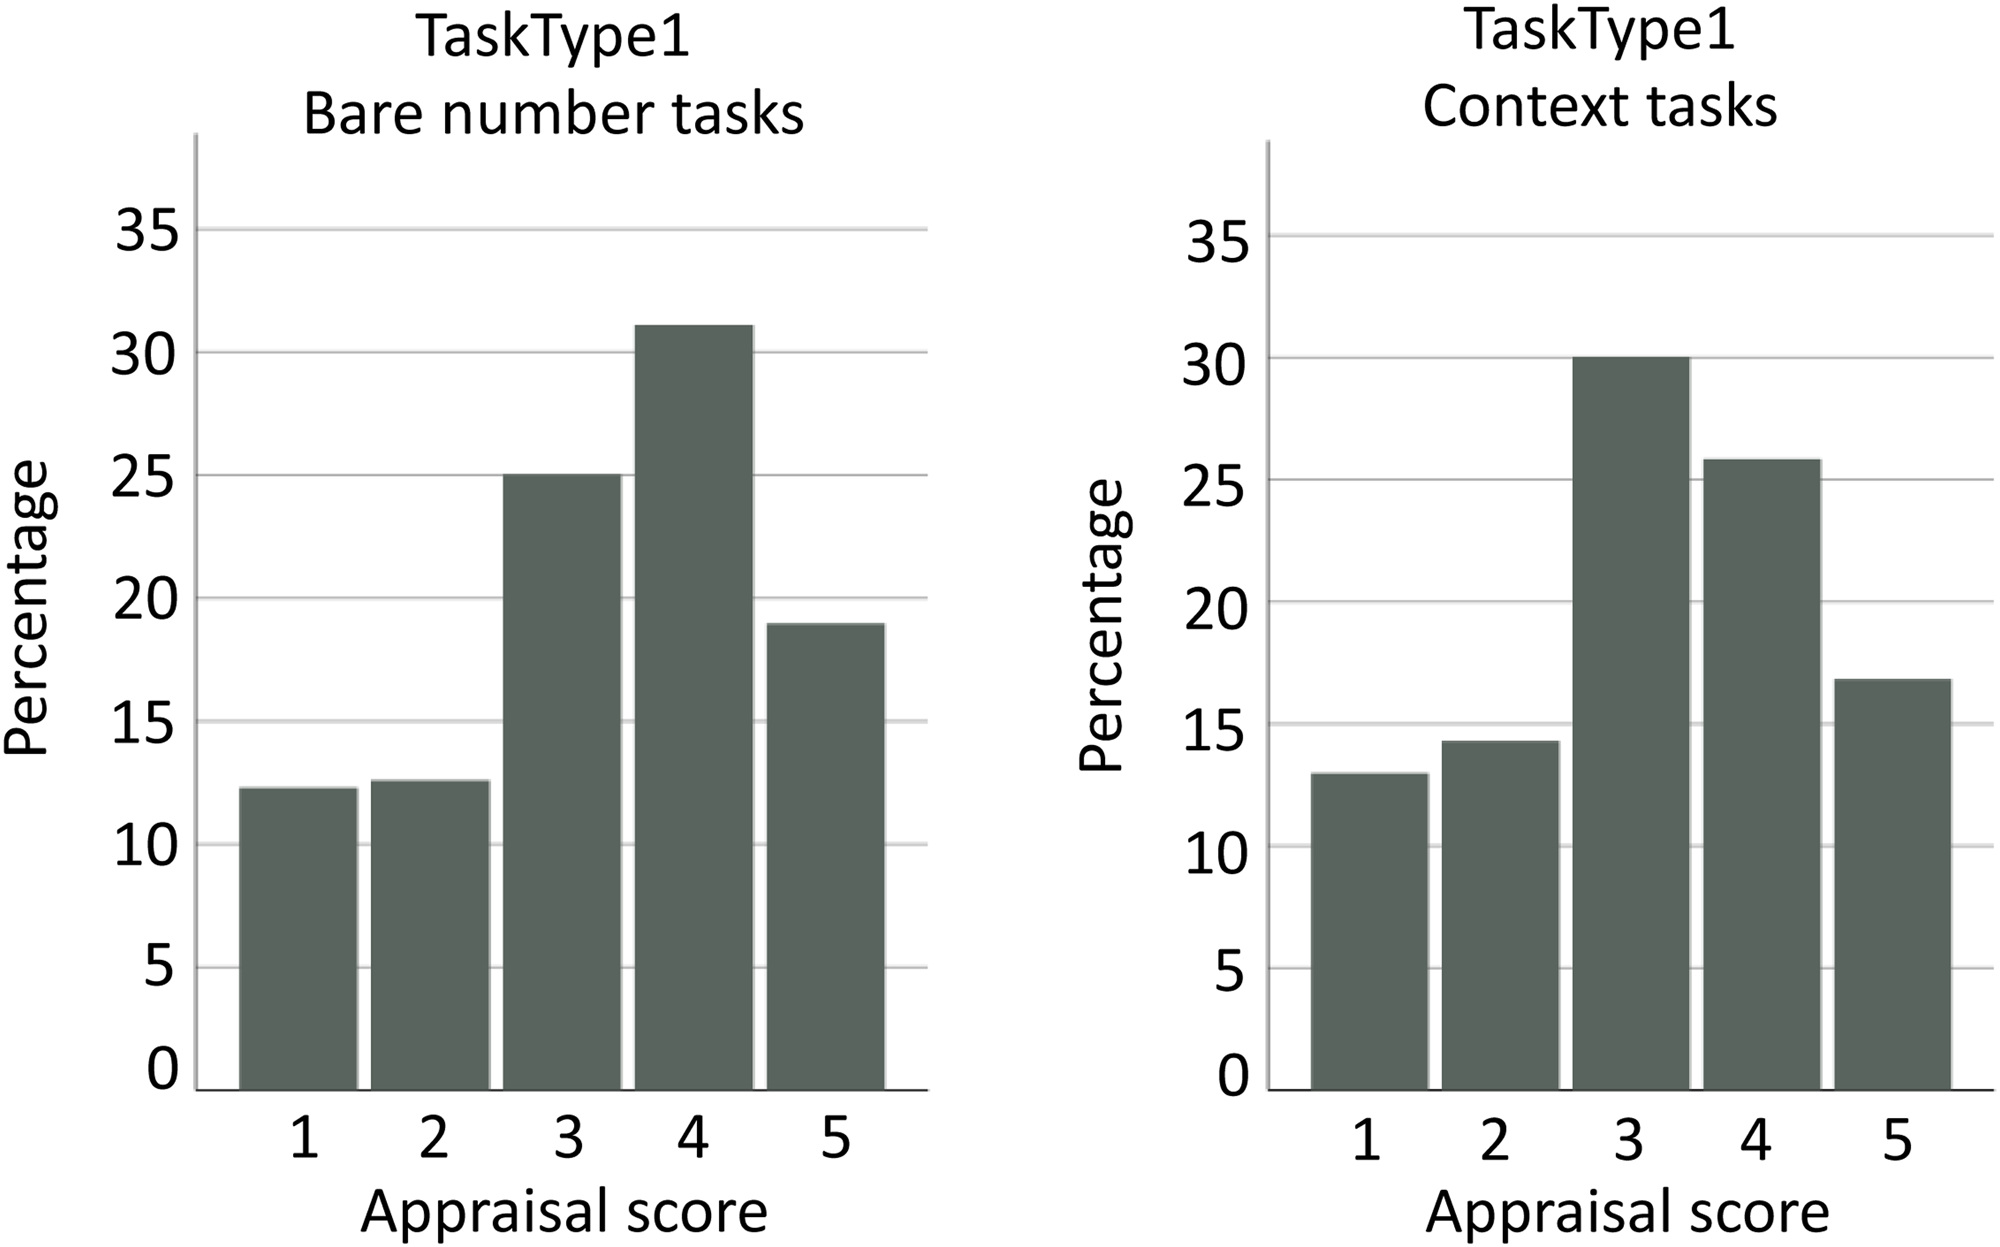
Relative frequency distributions in percentages of the given appraisal scores for tasks with a bare number problem (n = 659) and tasks with a context problem (n = 909).
The above findings tend to indicate that the bare number tasks were liked more than the context tasks. However, by using a Wilcoxon matched-pair signed rank test and computing for the two categories the averages of each student's appraisal scores yielded no significant results (n = 67, T = 766, p = .067).
Finding no significant difference between the two categories corresponds with our finding that the tasks that were liked most were not always bare number tasks. Of the seven tasks with the highest appraisal score, five were bare number tasks and two were context tasks. In addition, the task that was disliked the most was not a context problem but a bare number task about fractions. This shows that there are more task characteristics that may influence students’ appraisal of a mathematics task.
Students’ appraisal scores for the three subcategories of TaskType2 (tasks with straightforward problems, tasks with puzzle-like problems, and tasks with estimation problems) were largely in accordance with each other. The descriptive statistics of the tasks with straightforward problems and the tasks with estimation problems were about the same (straightforward problems: M = 3.20; Mdn = 3; SD = 1.255; estimation problems: M = 3.24; Mdn = 3; SD = 1.281). The mean and median of the tasks with puzzle-like problems were a bit higher (M = 3.34; Mdn = 4; SD = 1.239). The standard deviation was the highest for the estimation problems and the lowest for puzzle-like problems.
As is shown in Figure 3, some differences could be found in the frequency distribution of the given appraisal scores. Tasks with puzzle-like problems got a slightly lower percentage of students who gave an appraisal score of 1 and 2 than tasks with straightforward and estimation problems. Furthermore, tasks with estimation problems obtained a slightly higher percentage of students who gave an appraisal score of 5. In sum, among the different natures of the tasks within TaskType2 there was not one type of task that was clearly preferred in all ways, but it seems that the tasks with puzzle-like problems were the closest to this state. Computing the averages of each student's appraisal scores for the three categories of tasks yielded no significant results by using Friedman's two-way ANOVA (n = 67, Q = 4.635, p = .099). However, when comparing the straightforward tasks with the puzzle-like tasks, a Wilcoxon matched-pair signed rank test showed a significant difference in appraisal of the advantage of the puzzle-like tasks (n = 67, T = 1355, p = .017).
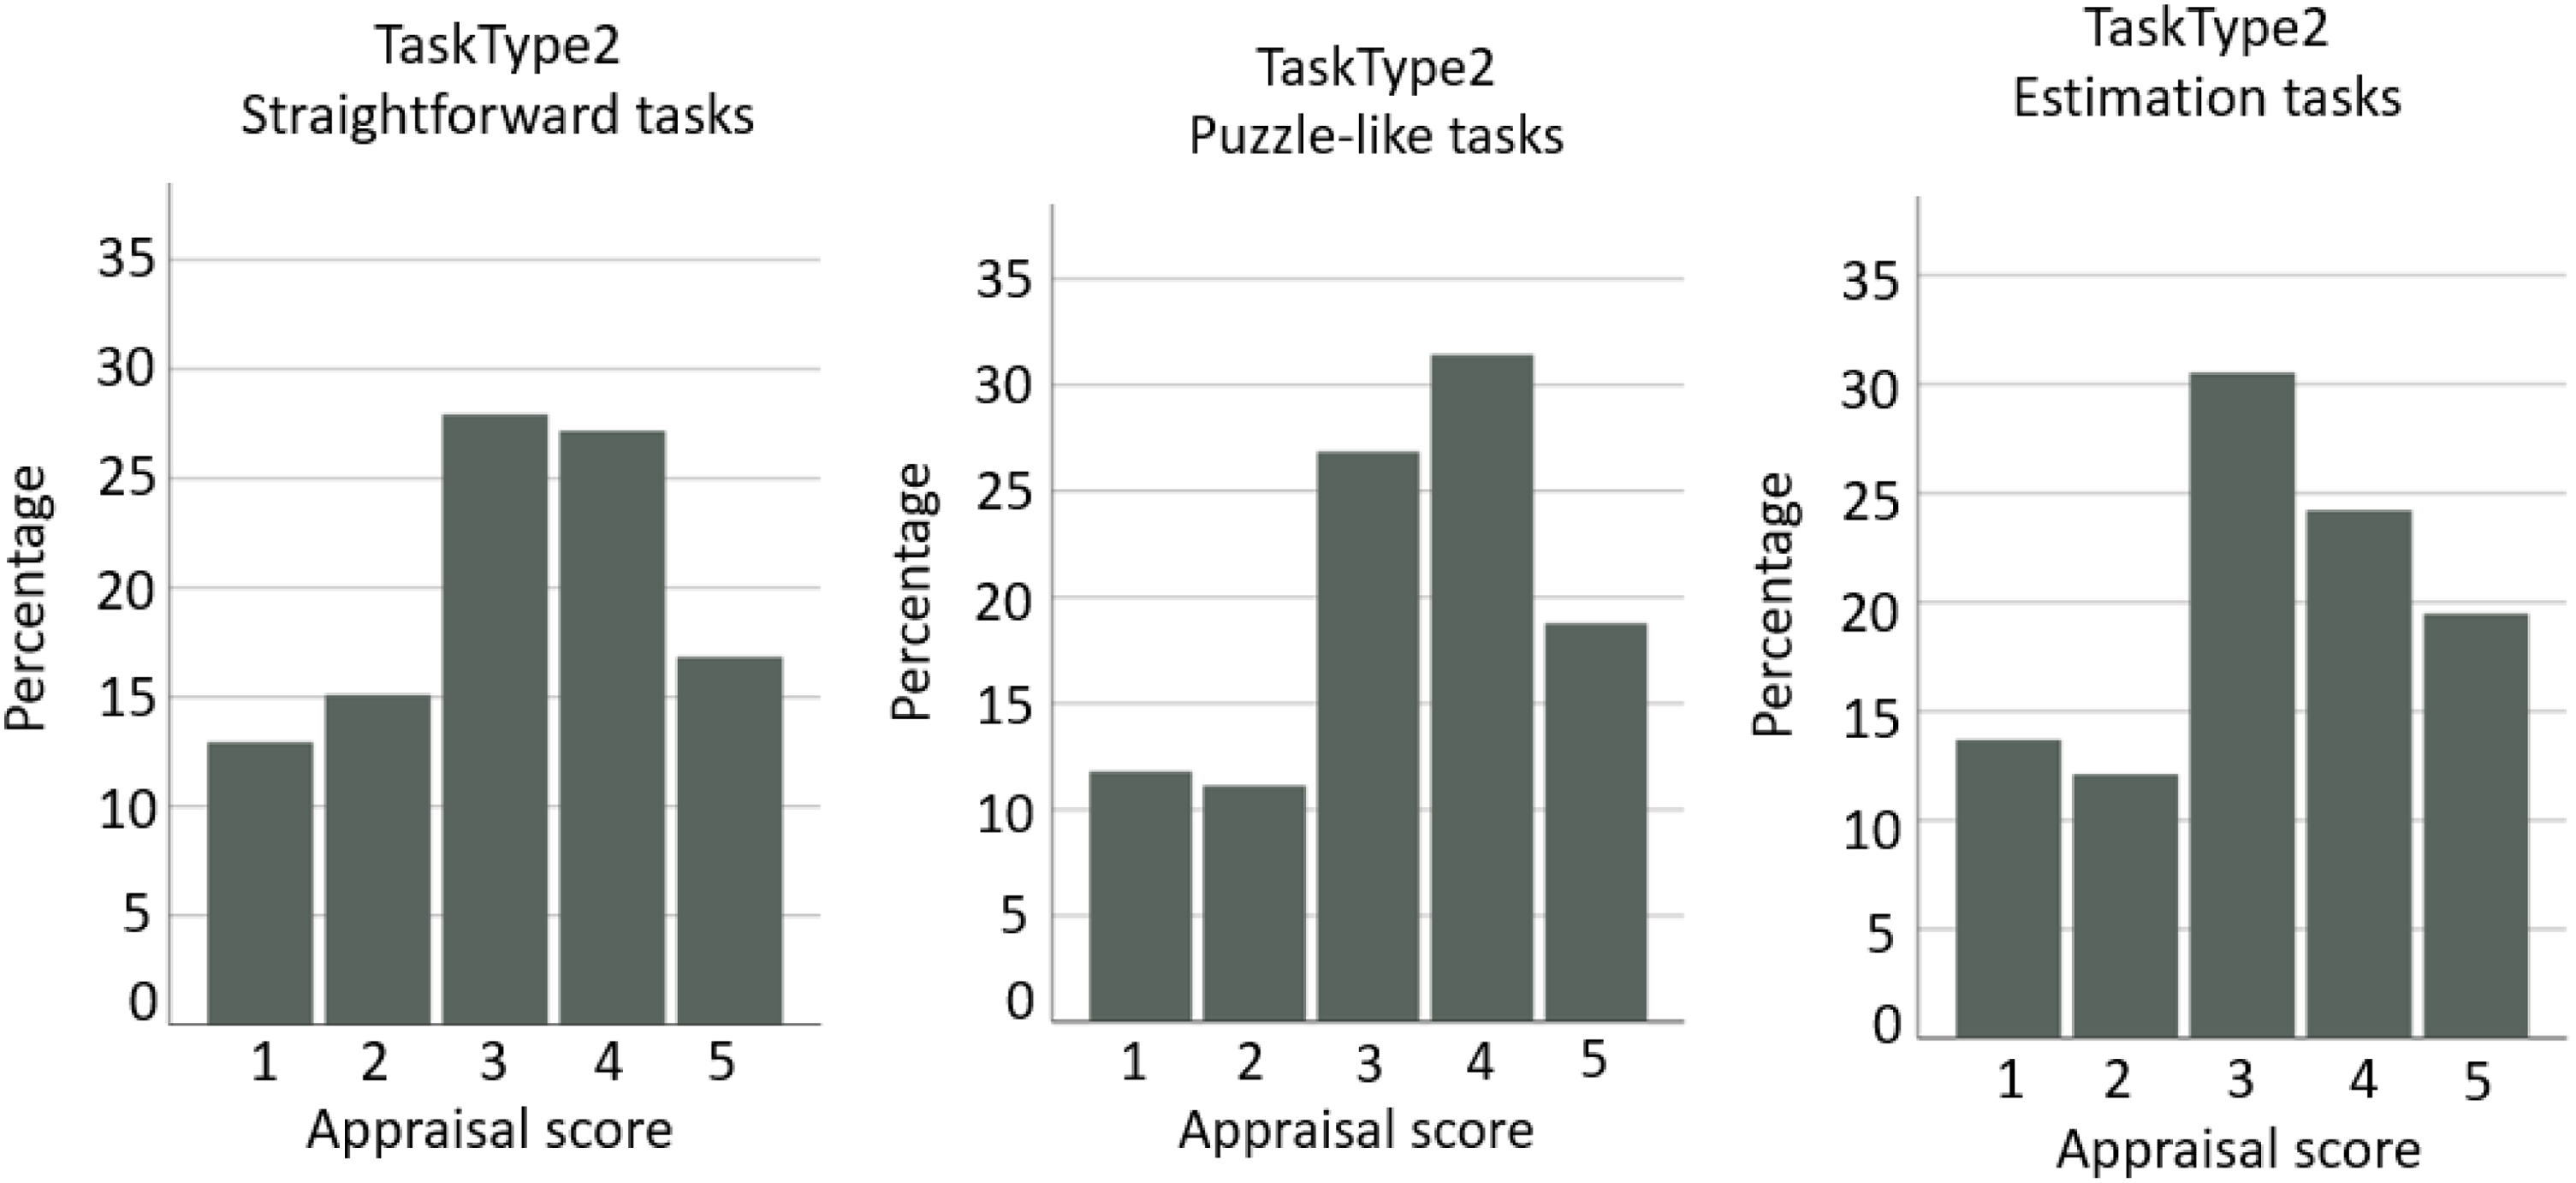
Relative frequency distributions in percentages of the given appraisal scores for tasks with a straightforward problem (n = 920), tasks with a puzzle-like problem (n = 458), and tasks with an estimation problem (n = 190).
To investigate whether the presentation type of a task (bare number and context) and the nature type of a task (straightforward and puzzle-like) matters for whether the students like/dislike a task, we took a closer look at how the appraisal scores between the subcategories of TaskType1 and TaskType2 were related. Estimation problems were left out in this analysis because we only had estimation problems in a context format and not in a bare number format.
Although comparing bare number tasks and context tasks did not make a significant difference as shown earlier, this might change when we bring in the nature of the problem. For tasks with a straightforward problem, a Wilcoxon matched-pair signed rank test revealed that there was still not a significant difference between bare number tasks and context tasks (n = 67, T = 603.5, p = .076). However, for the puzzle-like tasks, this was different. The appraisals for the puzzle-like bare number tasks were significantly higher than for the puzzle-like context tasks (n = 67, T = 577.5, p = .020). Furthermore, we found a significantly higher appraisal for the bare number tasks with a puzzle-like problem than for the bare number tasks with a straightforward problem (n = 67, T = 1361, p = .016).
Students’ reasons for liking or disliking mathematics tasks
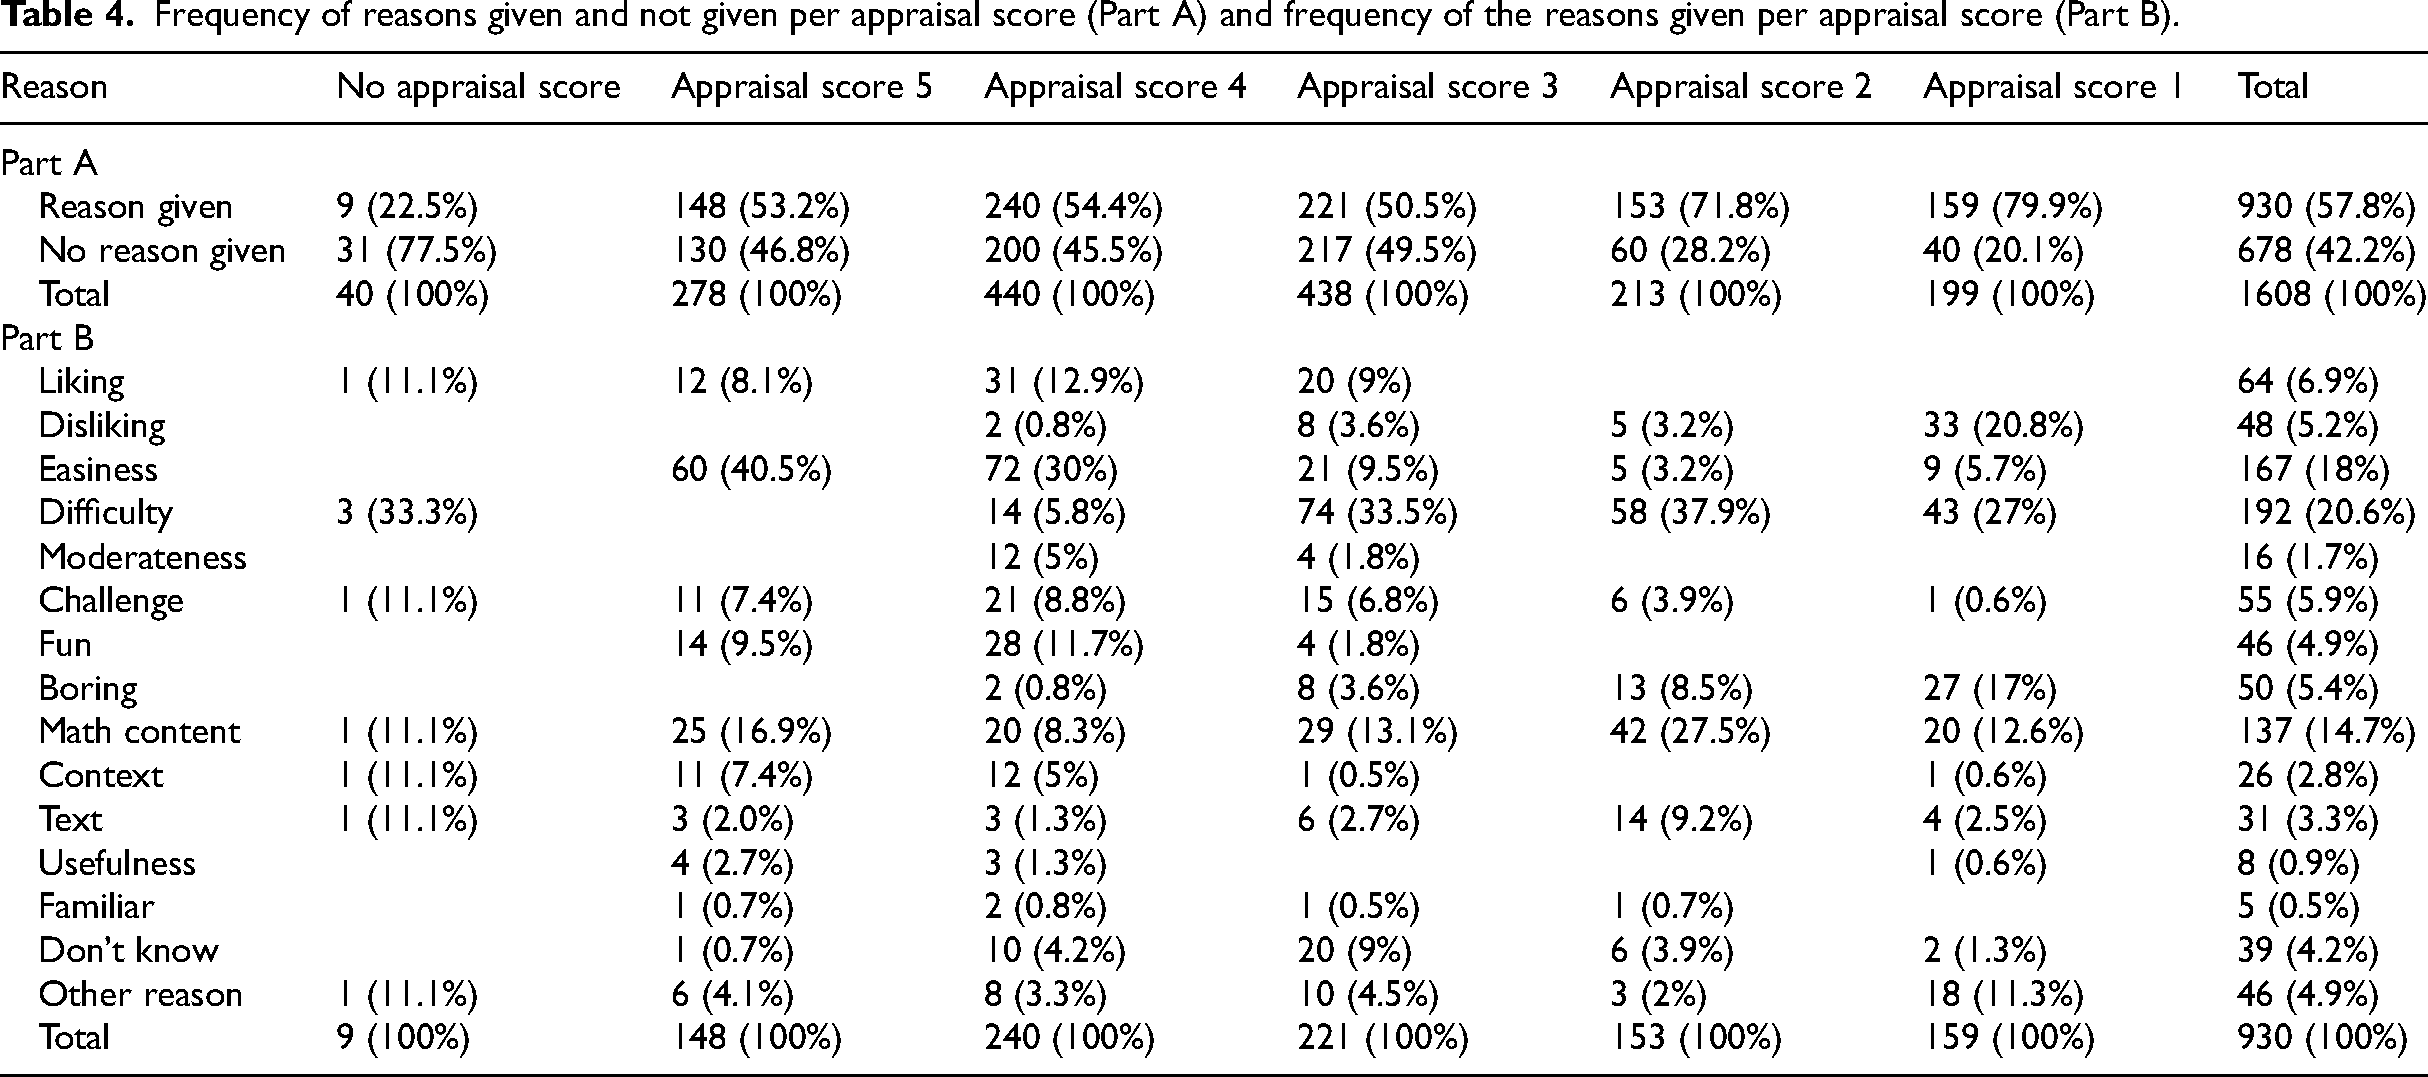
As is shown in Table 4 (Part A), in 930 (58%) of the 1,608 cases (67 students each with 24 tasks) in which the students could give their opinion about the tasks, a reason was provided for liking or disliking the task.
Frequency of reasons given and not given per appraisal score (Part A) and frequency of the reasons given per appraisal score (Part B).
Frequency of reasons given and not given per appraisal score (Part A) and frequency of the reasons given per appraisal score (Part B).
Part of the 678 cases in which the reason was missing was because in Task 14, the question about the reason was unintendedly left out. There were also nine cases in which the students gave a reason but no appraisal score, and in 31 cases, both were not provided. Table 4 (Part B) gives each appraisal score the absolute and relative frequency of the main categories of reasons that were mentioned for liking or disliking the tasks.
Reasons related to the difficulty or easiness of the task
The reasons that were mentioned most often for liking or disliking tasks were those in which something was said about the difficulty or easiness of the task. Difficulty was mentioned in 20.6% of the cases and for easiness, this was 18%. A task being difficult was the most often given reason for an appraisal score of 1 and 2 and a task being easy was the most often given reason for an appraisal score of 4 and 5.
In seven cases for which a score of 1 or 2 was given, the students said that they did not know how to solve the task. Then their reaction was for example, “don’t know how to do it” and “I don't know where I would start to solve it.” In 16 cases, students referred to their own perceived lack of skill or intelligence, like in the cases where they said, “I’m bad at this” and “because my head is not smart at all.” In addition, in 29 of the answers, it was explicitly indicated that the task was difficult, complicated, or confusing. The students expressed this by saying “I don’t like it because it is a bit too difficult,” “have never liked this sort of task[; ]very confusing,” and “it is complicated.” For the appraisal score of 3, the replies were similar to the appraisal scores of 1 and 2, but here the students did not mention lack of skill or intelligence as the reason for their score. Answers were given such as “this is a good task but a little difficult,” and “seems a bit advanced.” There were also students who gave an appraisal score of 4 and nevertheless said that a task was difficult. Some of these answers were: “I’m not good at these sorts of tasks,” “don’t quite understand the task,” and “Because it is a little complicated.”
Saying that a task is easy was most often a reason to like a task. However, the opposite did also happen. In 14 of the cases, it was the easiness of the task that obviously made the students give a low appraisal score. One student expressed this as follows: “Because it is way too easy.” Other students often reacted in these cases with only the words “easy” or “simple.” Easiness was also mentioned in 21 of the cases where students gave an appraisal score of 3. Some answers were short by just saying “easy,” and others were a bit longer, such as “way too easy,” “These are not difficult,” and “It is very easy to do this one. You just have to do minus 1.5 on both sides.”
The reasons that refer to easiness when giving an appraisal score of 4 and 5 indicated that the students were able to solve or understand the task. Then responses came up such as “because it is easy,” “because it is easy to find the answer to it,” “I think I can solve this task,” and “not that difficult.”
Reasons related to the mathematical content of the tasks
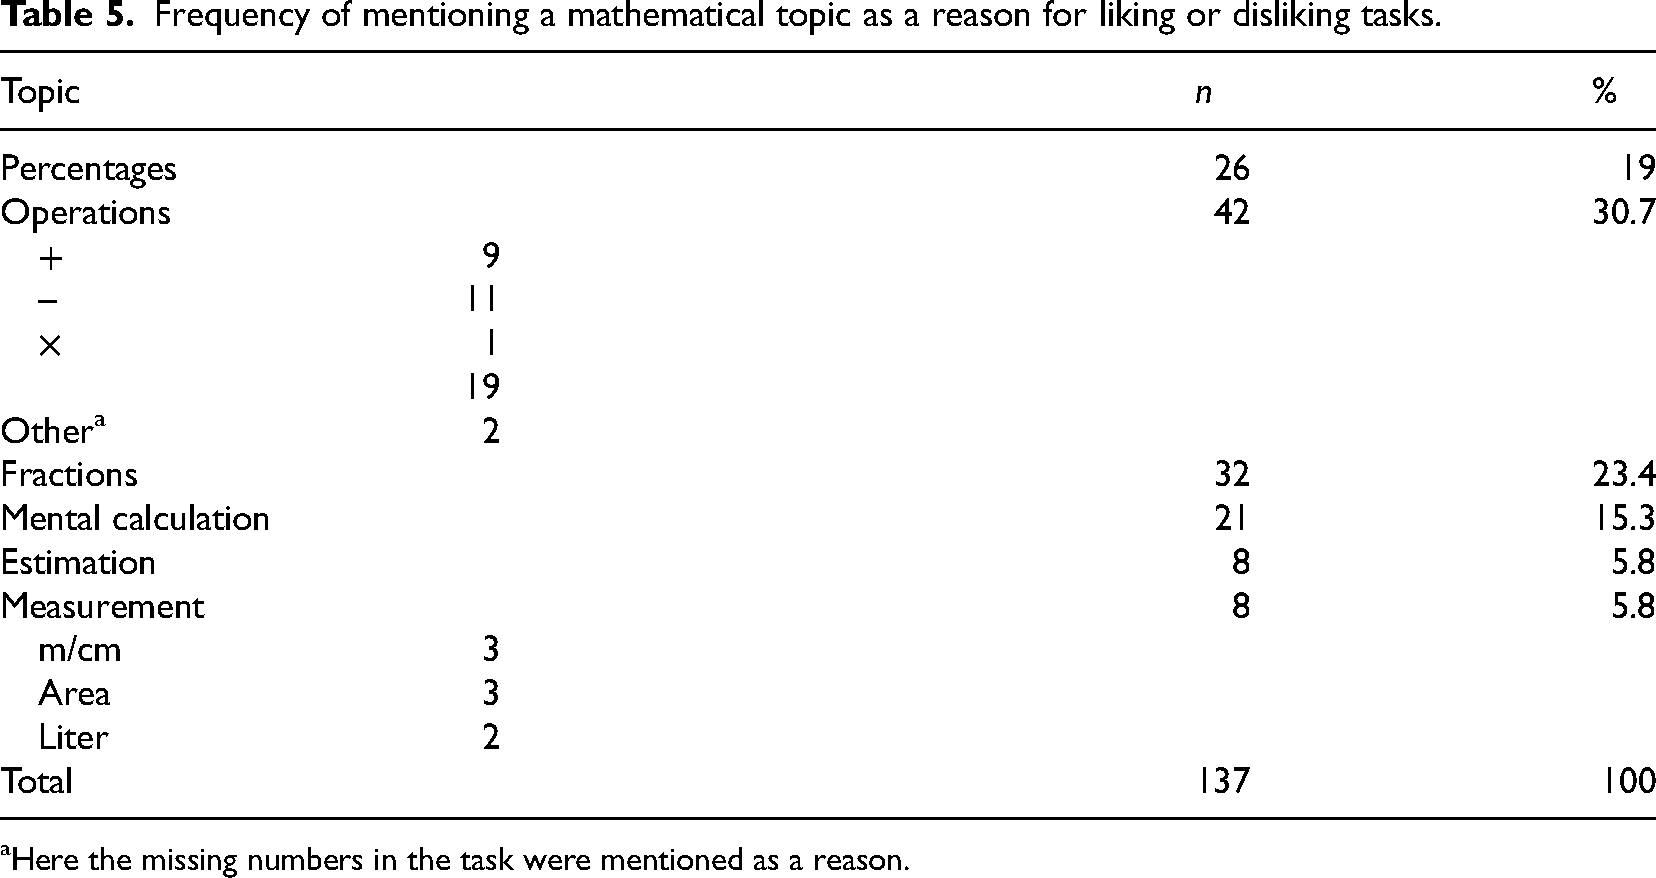
In 137 cases, the students referred to specific mathematical content as a reason for liking or not liking the tasks. This involved 15% of all the cases in which a reason was given. As shown in Table 5, the mathematical topics mentioned most often were operations with whole numbers and fractions. Topics also brought up were percentages and mental calculations. In a few cases, estimation and measurement were referred to.
Frequency of mentioning a mathematical topic as a reason for liking or disliking tasks.
Frequency of mentioning a mathematical topic as a reason for liking or disliking tasks.
Here the missing numbers in the task were mentioned as a reason.
Although these content-related reasons were found for all five appraisal scores, most often the mathematical content was the reason for giving a low score. In 62 cases, the task was given an appraisal score of 1 or 2. These scores were mostly found when the reason referred to the topic of fractions, percentages, division, or subtraction. Many, but not all, responses were short and did not go into much detail. For example, students wrote “I think fractions are a little difficult” and “don’t like division.” An example of a longer response is “calculating with percent is probably nice to know but I don’t understand it and then it is difficult to like it.” One student showed ambivalence and was not entirely negative and called a task useful despite giving an appraisal score of 2 and reacted with “don’t remember anything about calculating percent but it is a useful task.” When students gave a low appraisal score because of the mathematical content, their reason was related to not liking the content, not understanding it, or both.
For the appraisal score of 3, there were 29 cases in which the reason had a reference to the content. The most common reasons for giving this score were again the topics of fractions, division, percentages, and subtraction. Only a few times were estimation, area, addition, and mental calculation mentioned. A typical reason that was mentioned together with an appraisal score of 3 was “don’t like minus, but it would go well enough.” There were a few other responses that also had both a positive and a negative connotation, like “as I said, I don’t like calculating with fractions, but I can do it if I try” and “I’m not that good at multiplying with fractions but I think it is fun to try.” Other responses were more neutral, like “I think the task is completely ok because it is minus.” Some of the responses indicated that the appraisal score of 3 was mainly considered negative. Here reasons were given such as “Don’t like calculating with litres that much” and “I am a little bit bad at percent.”
The content-related reasons that were mentioned in the 20 cases where an appraisal score of 4 was given, were mental calculation, the addition operation, the division operation, and percentage. Topics mentioned less often were the subtraction operation, fractions, meter/centimeter, multiplication, and estimation. Students gave responses like “I like the task a little because I am ok at division,” and “I like fractions a little.” Also, even a more positive response like “calculating with percent is fun” was given. Some students gave reasons such as “I am not good with minus” and “Division is a little confusing,” even though they gave it a score of 4.
In 25 of the cases in which an appraisal score of 5 was given, reasons were mentioned that referred to mental calculation, the addition operation, and percentages (3 times). Also, fractions and estimation were brought up one time each. Many of the responses were short and said that the students liked the task because they liked the mathematical content, or that the content was easy. Students came with responses such as “I like calculating percent” and “easy it is just plus.” A response that went into more detail was: “I like tasks where you have to estimate how much you do something like for example, how much electricity do you use, how many calories do you eat, and those kinds of things.”
Overall, it can be concluded that the results about the mathematical content of the tasks did not play a dominant role in liking/disliking a task. Only in a small proportion of the cases, a reason was given in which there was a reference to the mathematical content. Reasons for not liking a task brought up the well-known stumbling points of mathematics education: fractions, percentages, division, and subtraction. Yet, contrary to what might be expected, we did not really find a division between content that either was liked or was disliked. For example, these four mathematical content domains were also mentioned as a reason for rather liking a task.
In total, the questionnaire included 14 tasks with a context, all of which were presented in the text. In 26 cases, the reasons for liking or disliking the task were related to the context of the task. Most often this meant that the students liked the task because of the context. The written responses about the context tended to be short. Students wrote for example, “Burger,” “I like football,” and “because I like football.” Some more negative responses were “Mehh not a big fan of football” and “no football.”
The 14 context tasks involved contexts such as football, buying burgers, selling buns, and traffic jams. For Tasks 7 and 20, which are about football, the context of football was mentioned 10 times as a reason for liking the task, which is more often than it was the case for tasks with other contexts. The context of Task 4, which is about buying burgers, was mentioned second most often. It was brought up 4 times. The attractiveness of the football context was also shown in another way. Task 20 was given an appraisal score of 5 by 38.5% of the students which is the highest percentage of all the tasks in the study. For comparison, the average percentage for appraisal score 5 was 17.7%.
Although the specific context was overall a reason for liking the task, the text in which the task was presented was mostly a reason for disliking the task. Reactions were given such as “don't like text tasks,” “too much text,” and “long text task.” Sometimes, but not often, text was described more positively. One student said, “I like the task because it is a text task.” Another student said, “a lot of text” while giving an appraisal score of 4. Sometimes it was clearly indicated that students liked some context tasks but did not like other context tasks because of the text. For example, one student made clear to like four tasks because they were about football, burgers, and discounts, but for four other context tasks, the student claimed to dislike them because of disliking text tasks.
Reasons for liking or disliking different task types
When comparing the reasons given for liking or disliking context tasks versus bare number tasks it was found that easiness was mentioned in 24.3% of the responses for bare number tasks and only in 13.7% of responses for context tasks. For the bare number tasks, this reason went together with a high appraisal score, and for the context tasks, the scores were a bit lower. A challenge as a reason was mentioned 3.7% for bare number tasks and 7.4% for context tasks. Mathematical content was mentioned 19.7% for the bare number tasks and 11.4% for the context tasks.
Differences were also found between the reasons for liking or disliking straightforward, puzzle-like, and estimation tasks. In the straightforward tasks, fun was only mentioned in 1.7% of the answers, while in the puzzle-like tasks and the estimation tasks this was 10.2% and 7.5% respectively. The reason given the most often for liking or not liking straightforward tasks was mathematical content. This was referred to in 21.7% of the responses. For the estimation tasks, the most common reason was challenge. This reason was mentioned in 15% of the tasks.
The estimation task elicited quite a number of reactions. In total, 13 students came up with a comment indicating that they were not familiar with estimation tasks. Five of them outrightly said that they did not know what estimation meant. These responses were mostly short, such as “I don’t know what estimate means.” Yet, one of these students came with a serious point of critique, saying, “there was a word that not everyone knows, it would have been easier to use other words like calculate instead of estimating it could be a bit difficult to figure out what that means for some people. And it also does not say how much a burger costs.” The remaining eight students seemed to indicate that they do not know what estimation means without outright stating this. In their responses, they pointed out that there was not enough information to solve the task by saying, “There was not enough information in the text, for example, how much a burger costs,” “I don’t have all the numbers.” One student made this lacking information very clear and commented, “How long is a car, the task could have given an average length of a car. All the information you need should be in the task in my opinion! I don’t know how long a car is … 3m? 4m? 2m?.” This critique was also heard in the comment “All the information should be in the task, but maybe you’ll say that I know how much I sleep. No, maybe some nights 10 h. Other 8 h. And other nights 5 h. Then it will be difficult since I don’t write down how much I sleep each night to find the average. If you assume that you sleep 9 h each night, it is an ok task.”
For two students, this lacking information was not an issue. They were more positive about estimation tasks and seemed to know what estimation means. One student who gave an appraisal score of 5 said, “You can spend some time on it, and it is just you that can get to an answer that is correct for you.” Another student responded, “I like tasks where you have to estimate how much you do something like for example, how much electricity do you use, how many calories do you eat, and those kinds of things.” These two students seemed to enjoy exploration in mathematics and did not need there to be exact numbers in order to solve an estimation task.
Students’ perceived solvability of mathematics tasks
How difficult the students thought the tasks were, was measured by asking for each task whether they thought they would be able to solve the task. The perceived solvability scores ran from 1 to 5, where a score of 5 means that the student is very sure of being able to solve the task, and a score of 1 means that the student is very sure of not being able to solve the task.
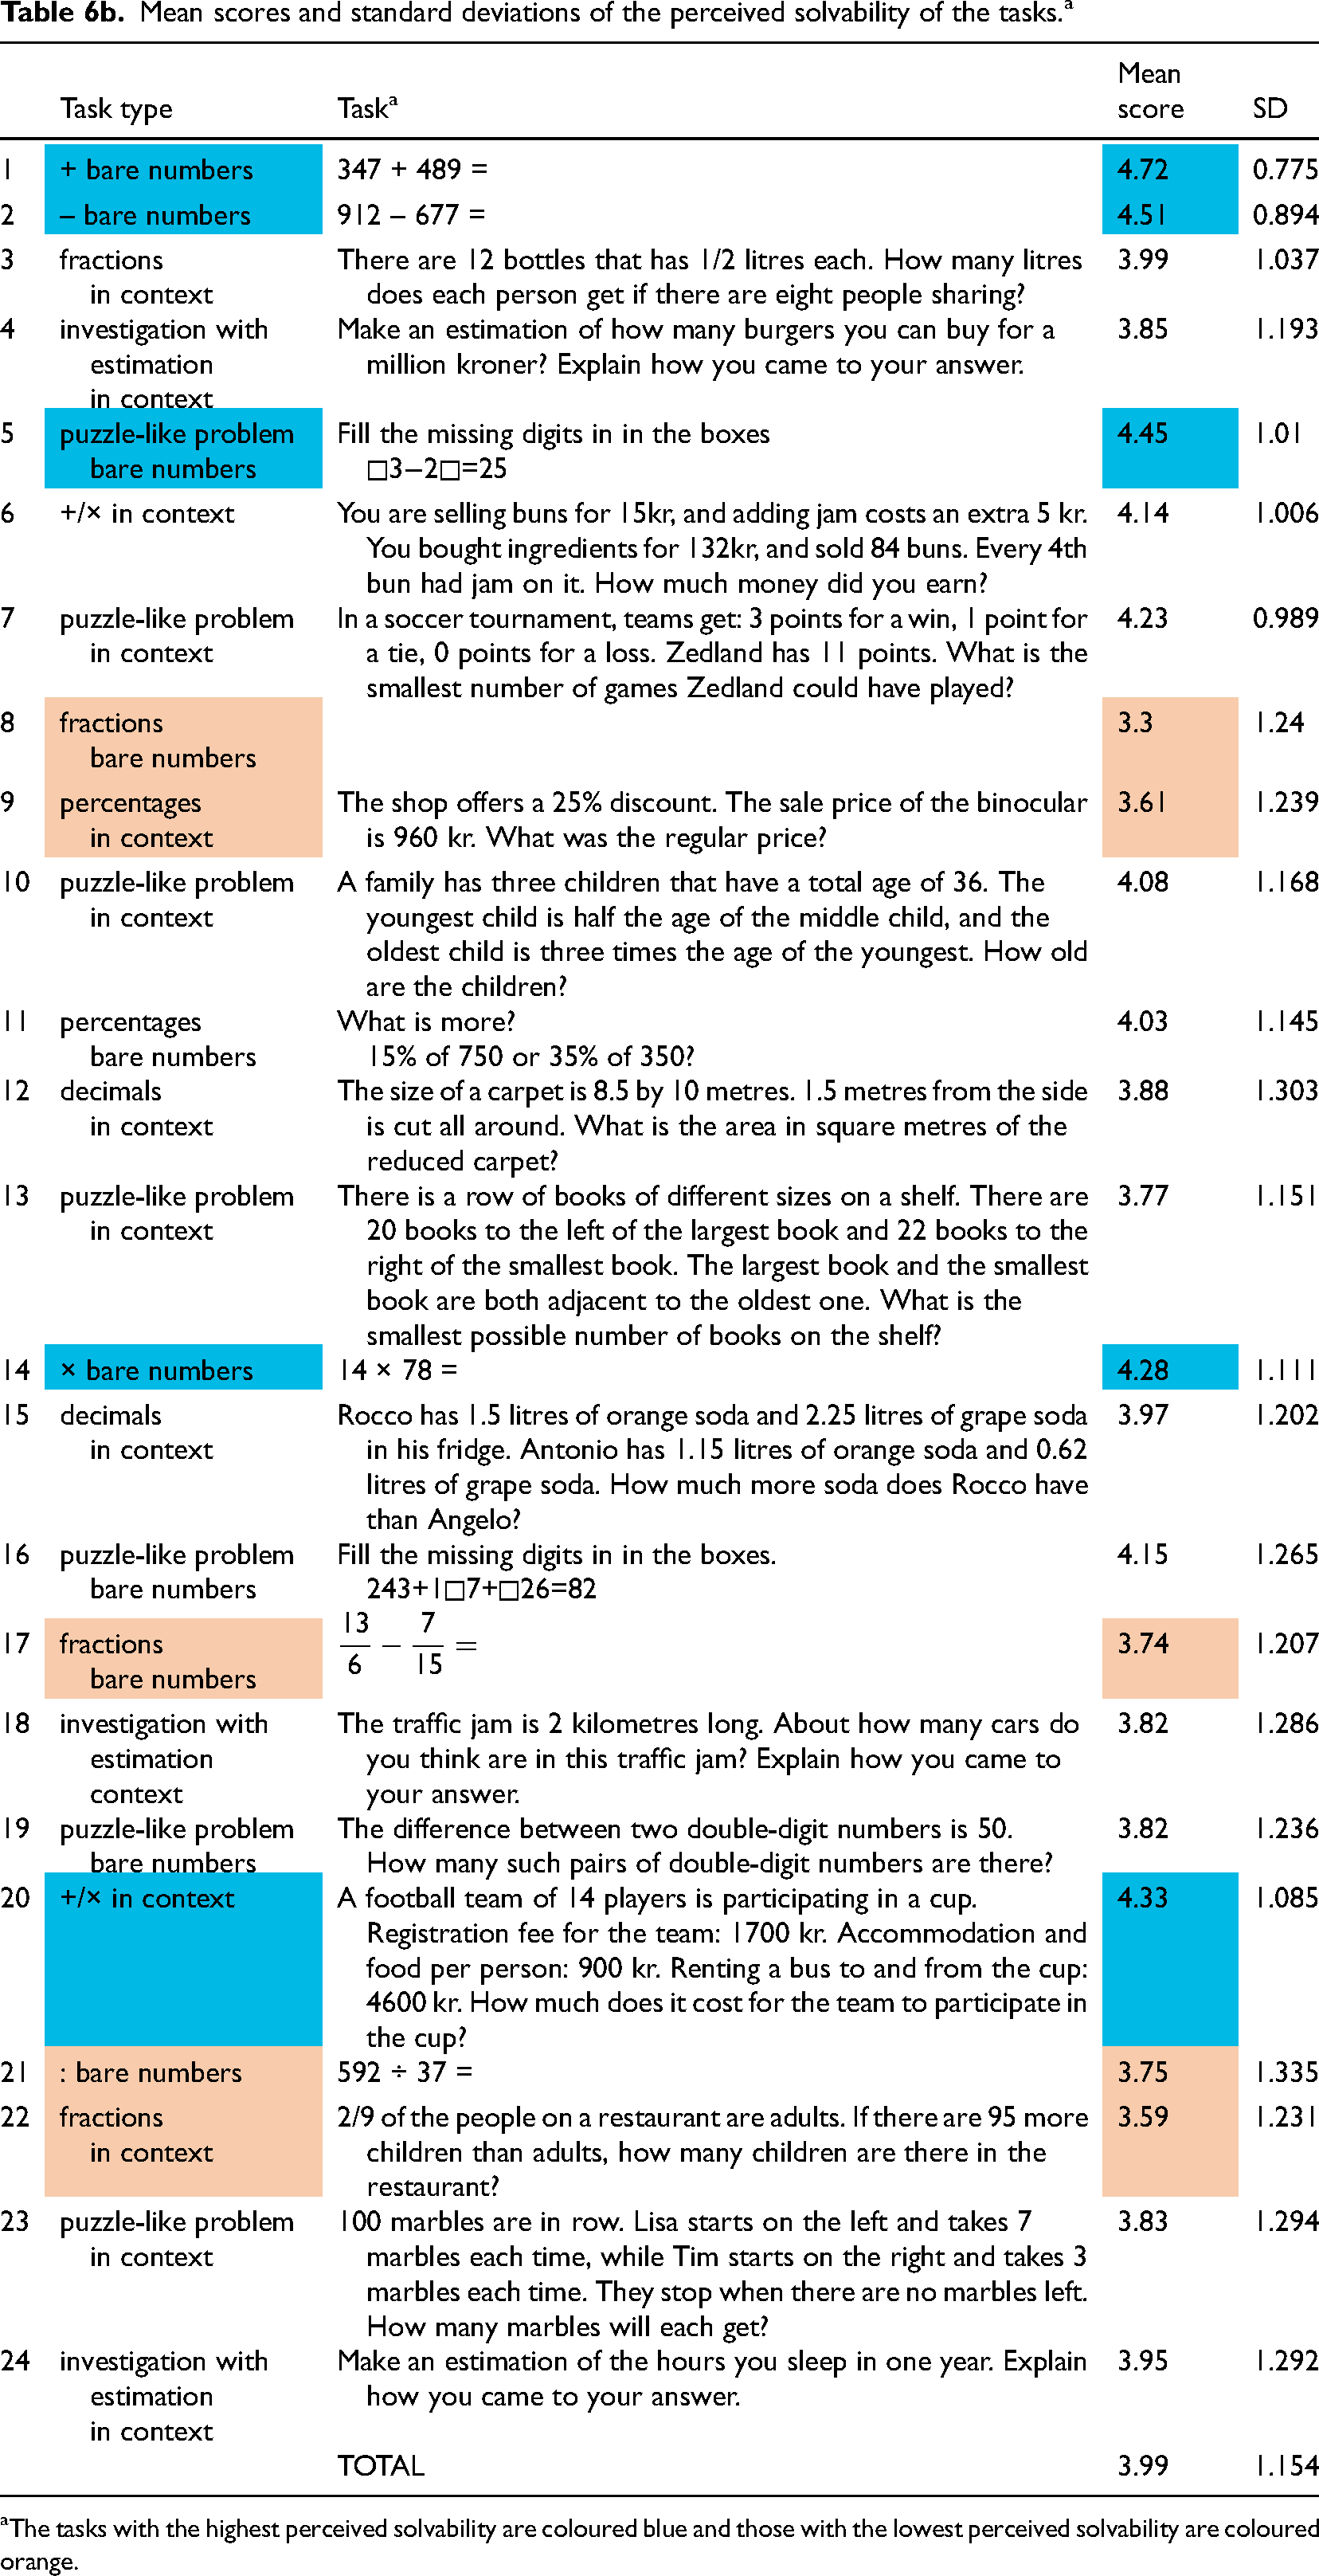
As Table 6 shows the total mean score was close to 4, indicating that taking all cases together the students were rather sure that they were able to solve the tasks. However, the data also revealed that only in 45.1% of the cases, a score of 5 was given. For the scores of 4, 3, 2, and 1 this was 28.1%, 14.7%, 5.3%, and 6.9% respectively. The specific tasks used in this study are listed in Table 6b in the Appendix.
Mean scores and standard deviations of the perceived solvability of the tasks.
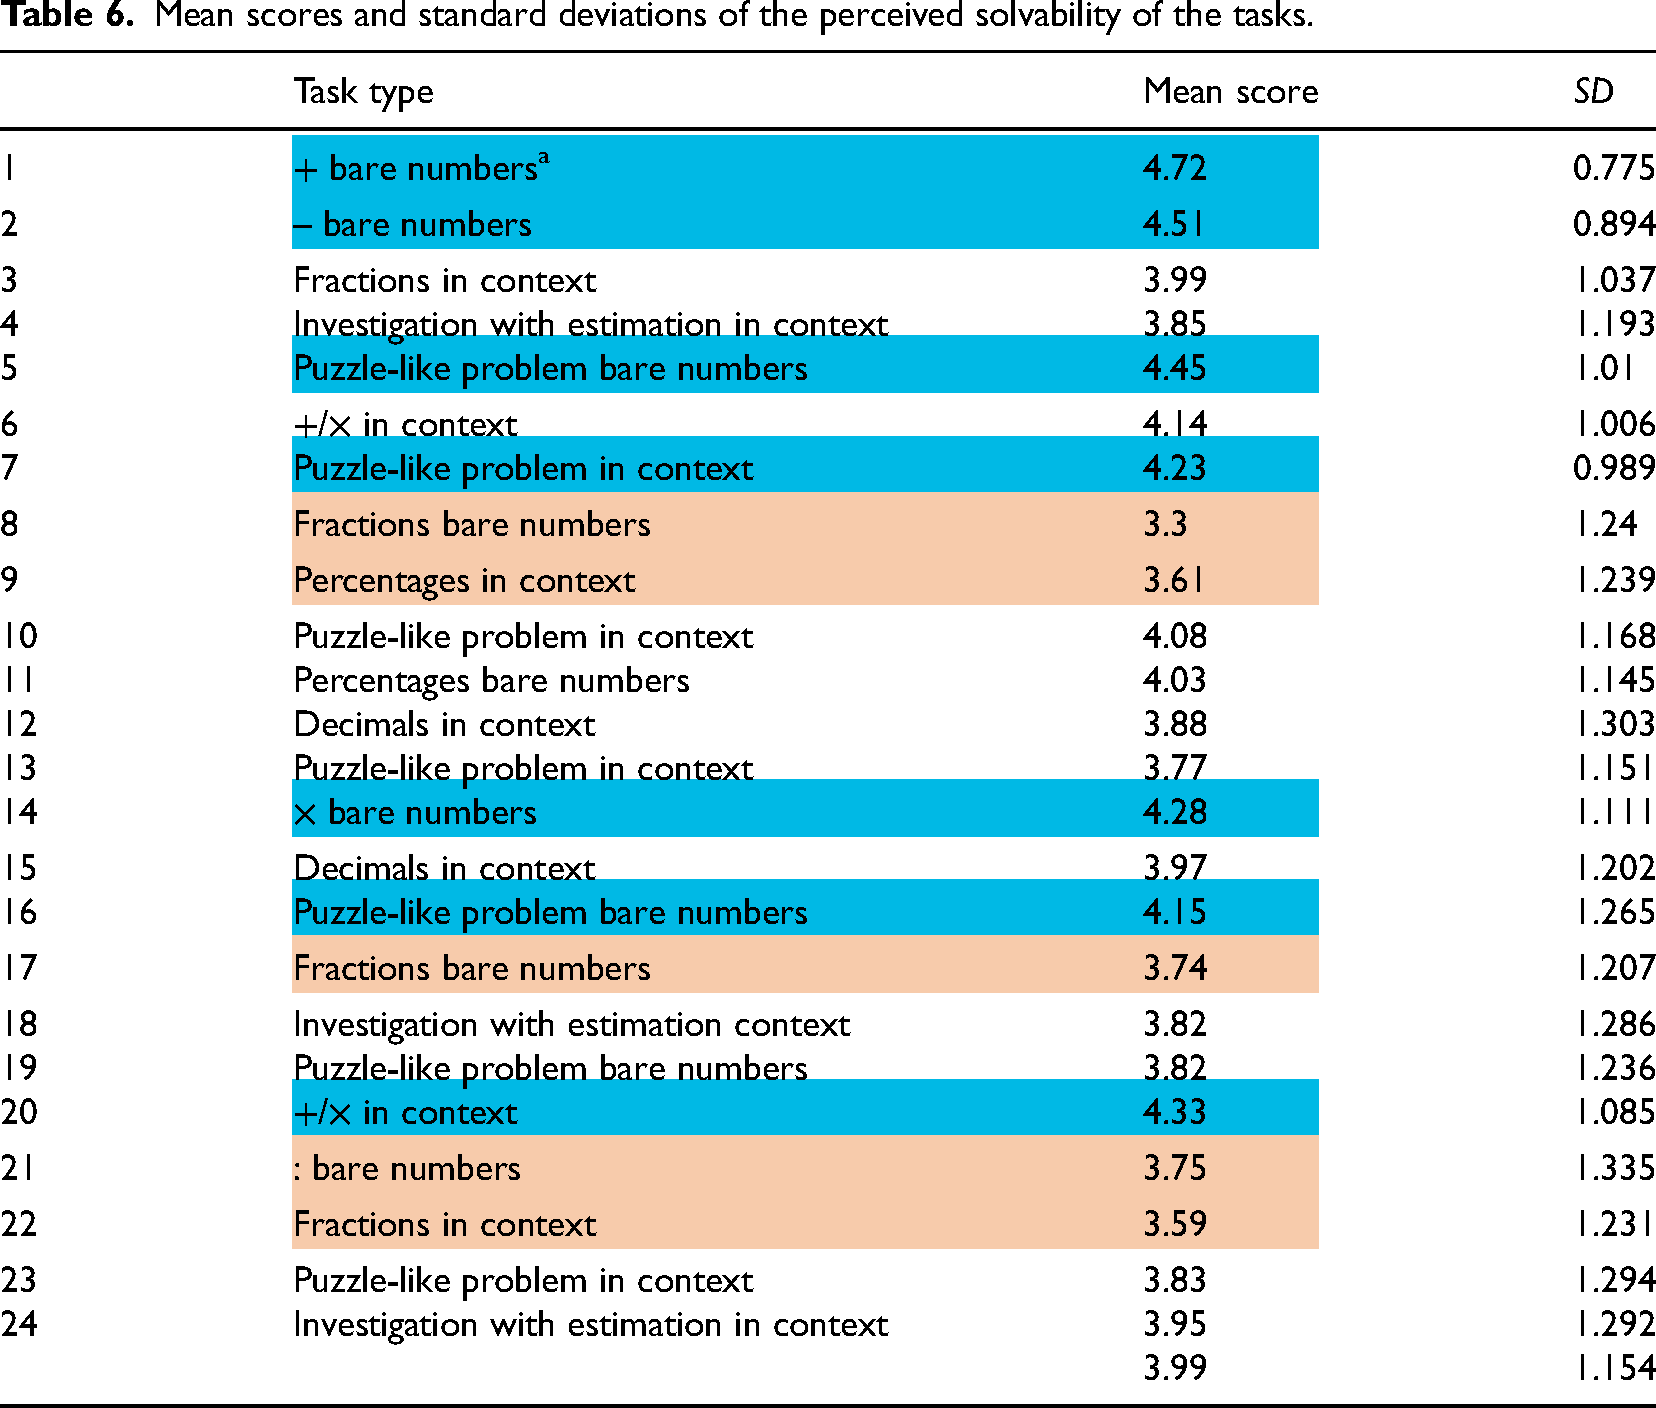
Mean scores and standard deviations of the perceived solvability of the tasks.
The bare number addition task 347 + 489 (Task 1) got the highest perceived solvability score and the bare number fraction task the lowest. In general, both bare number tasks and context tasks were found in the tasks with a low perceived solvability score and in those with a high perceived solvability. Though with respect to the mathematical content, there was a division. Tasks about addition and multiplication were found rather solvable by the students, while tasks about fractions, percentages, and division were considered less or not solvable.
In line with the earlier finding that the most common reason for liking or disliking a task was related to the easiness or difficulty of the task, it was no surprise that all the tasks that had the highest perceived solvability scores were also among the tasks with the highest appraisal scores (see Tables 3 and 6). Similarly, three of the five tasks with the lowest perceived solvability scores were also among the tasks that had the lowest appraisal scores.
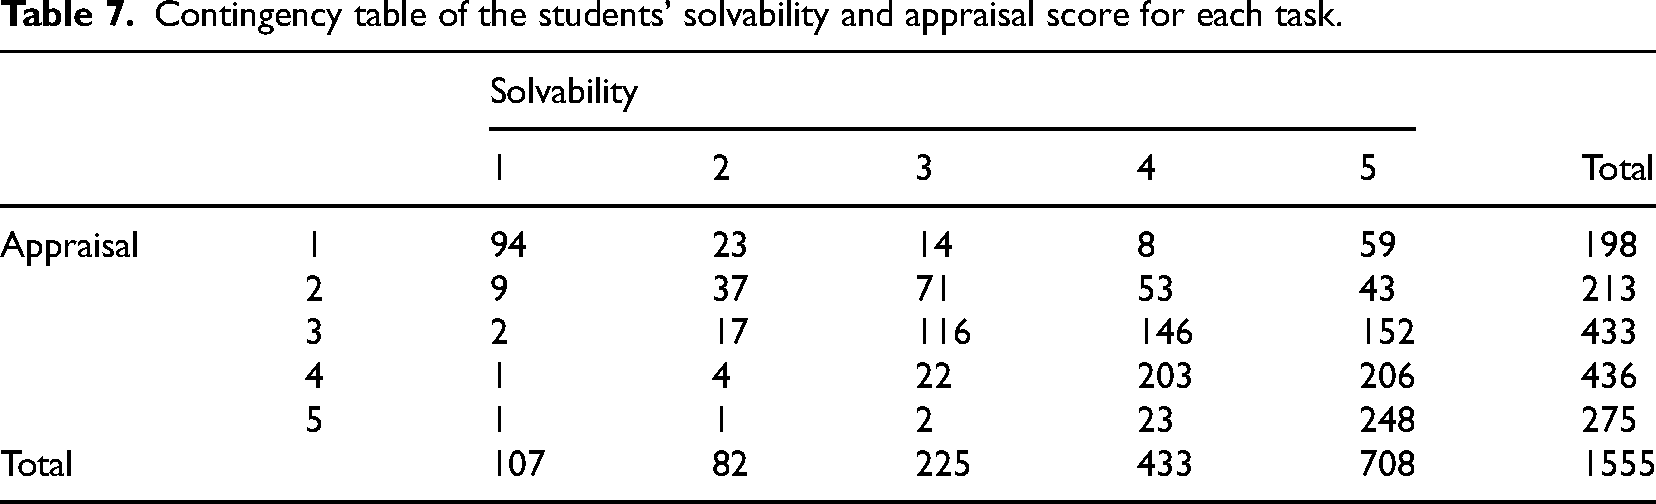
Further analysis of the data revealed that the student's appraisal score and the perceived solvability score were moderately correlated (ρ = 0.579, p < .01), which is also shown in the contingency table (Table 7) and the scatter plot (Figure 4), which are based on all cases in which an appraisal score and a solvability score was given. The higher the students considered the solvability of the task the more they liked the task.
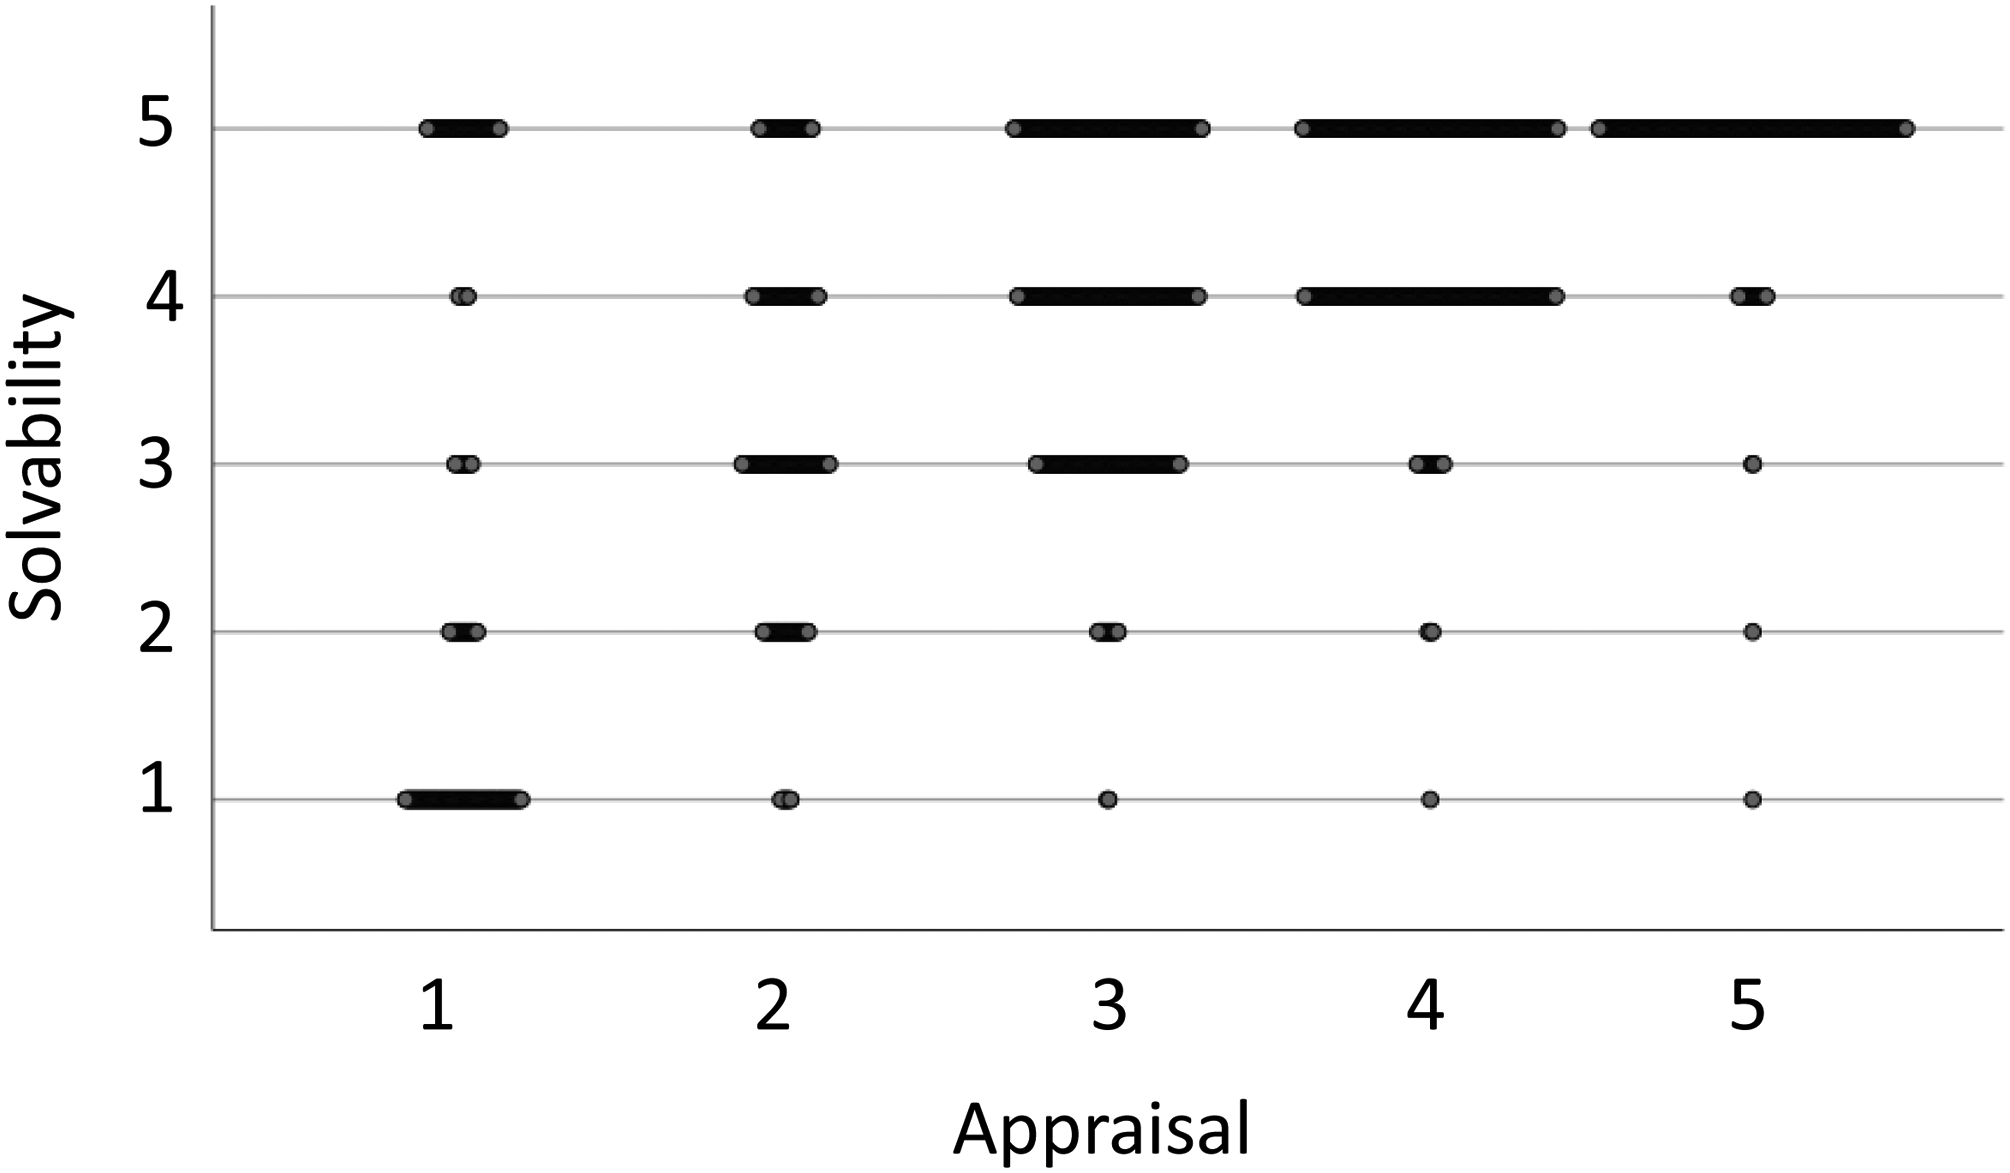
Scatter plot of students’ solvability score and appraisal score for each task.
Contingency table of the students’ solvability and appraisal score for each task.
This was also confirmed in another analysis in which the differences between these two scores were calculated. Figure 5 shows the frequencies of the differences between an appraisal score and a solvability score for all the cases in which the students gave both of these scores to a task. On the upper left side of the diagram (Figure 4), the solvability score is higher than the appraisal score and on the lower right side, the appraisal score is higher than the solvability score. The latter happened less frequently. In almost half of the cases, the score the students gave for liking/disliking the task had the same value as the score they gave for solvability.
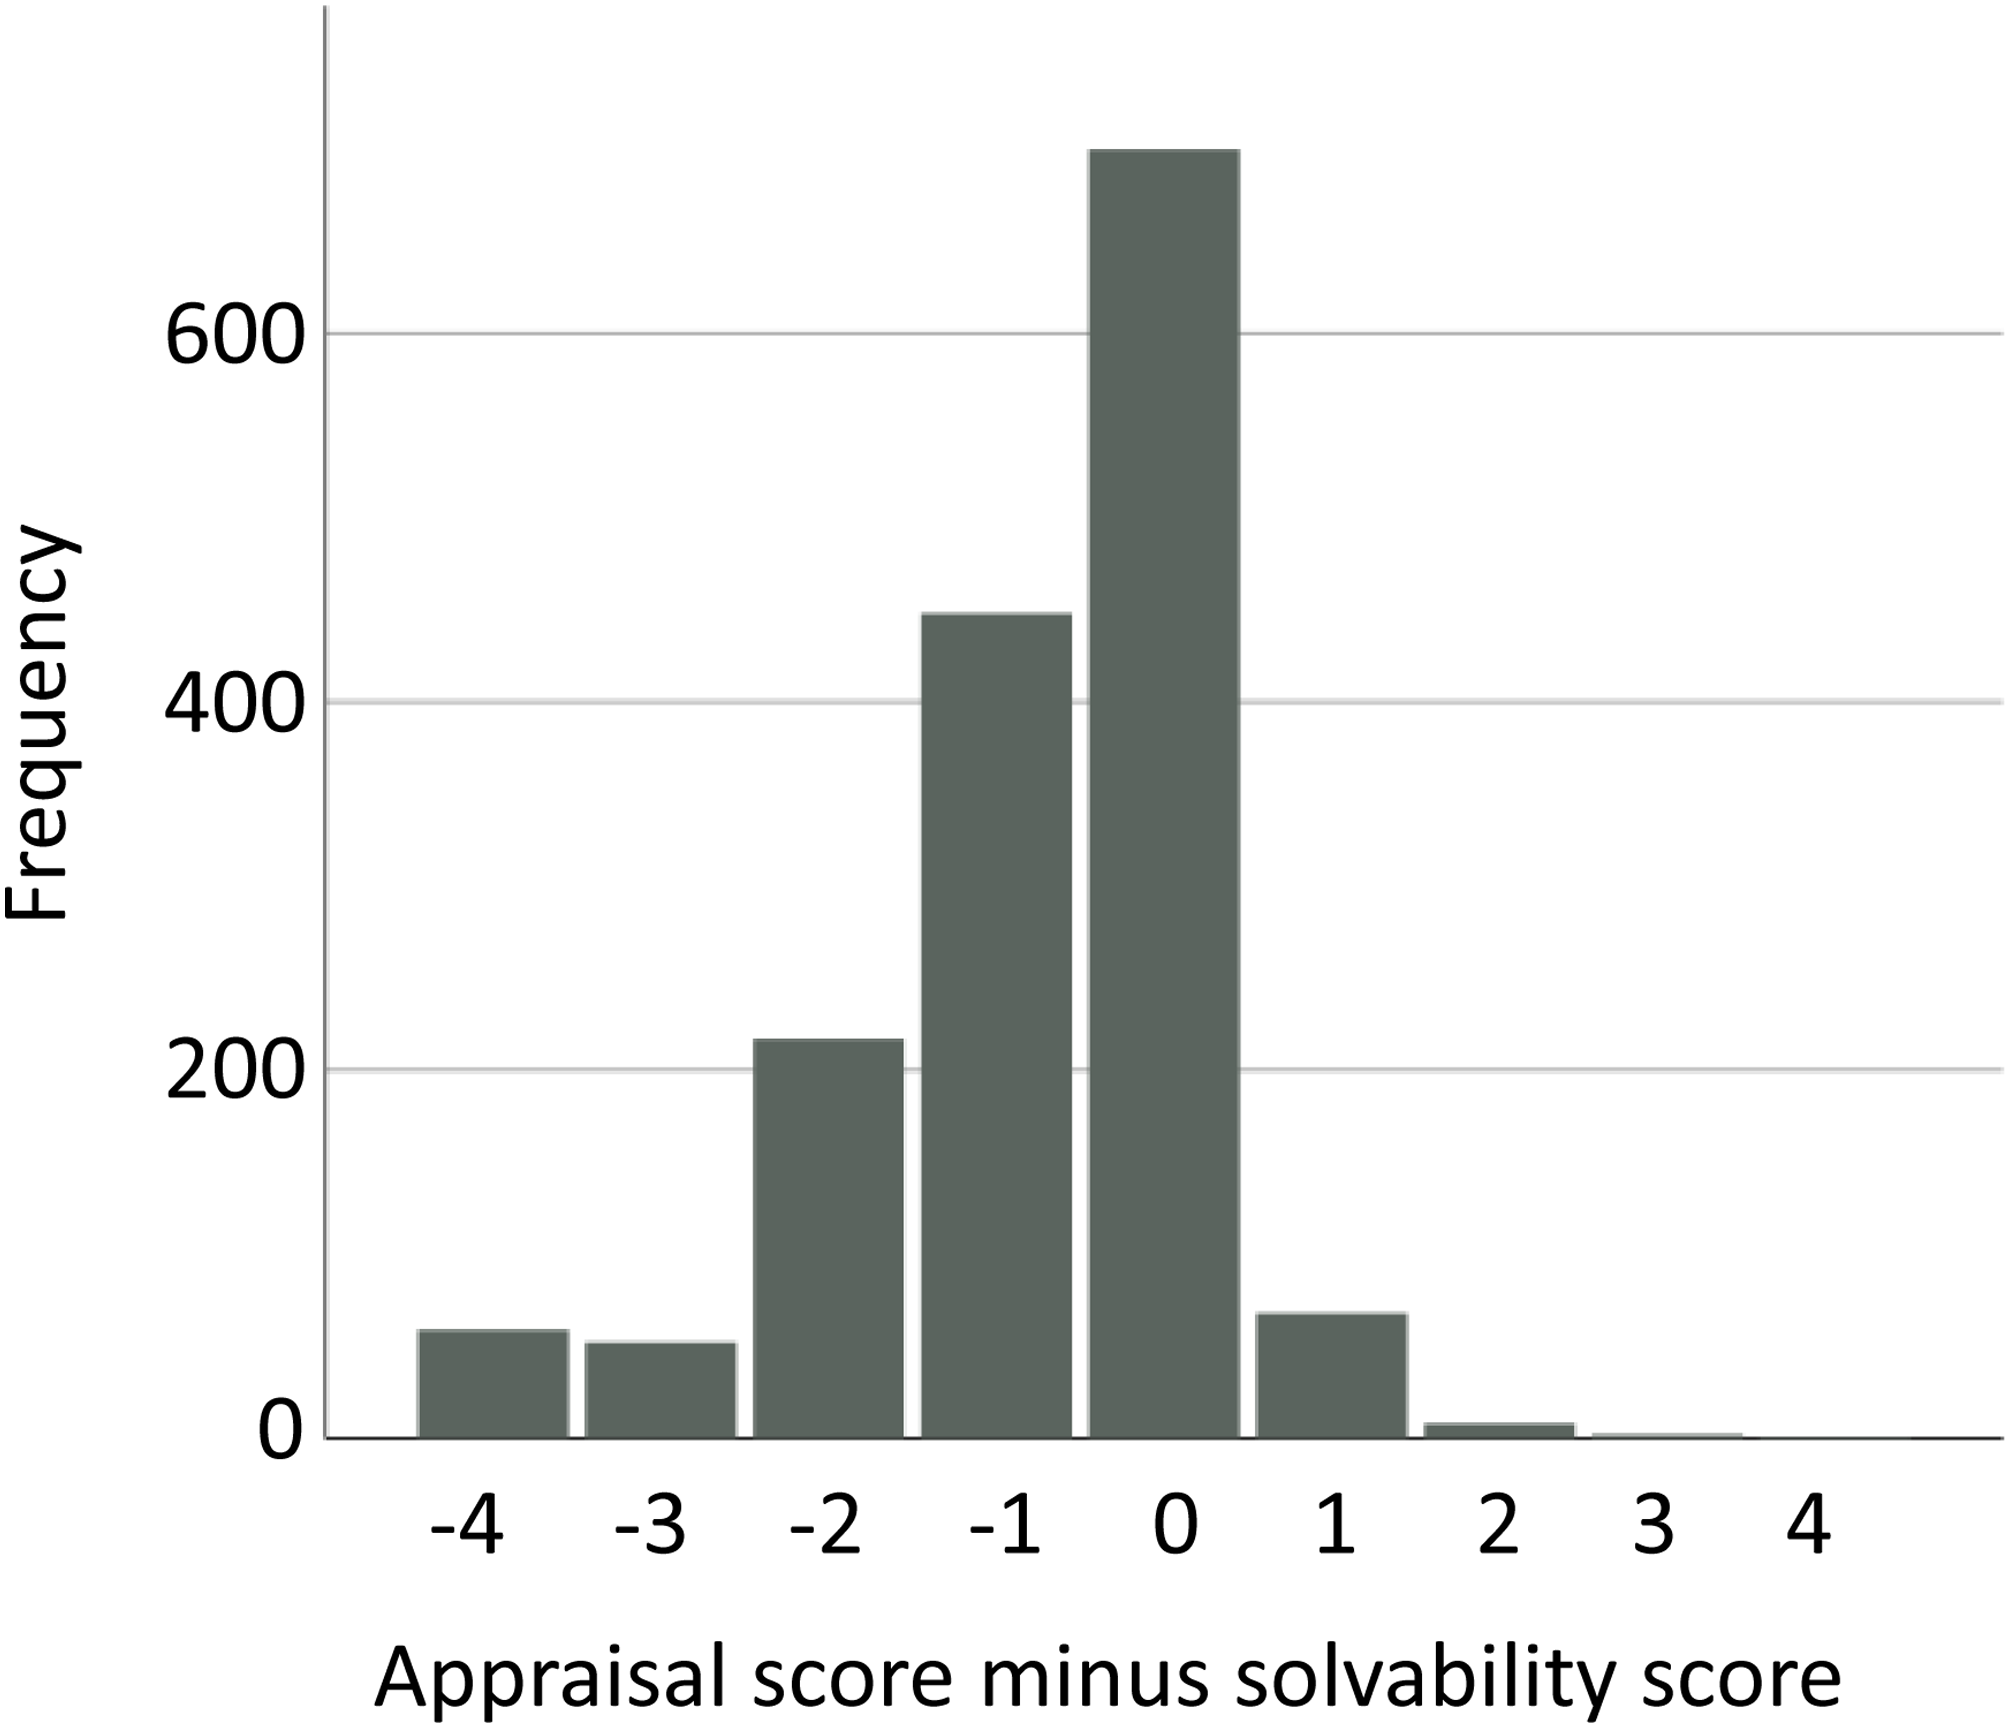
Frequency of the difference between the appraisal score and the solvability score.
When the solvability score was 1, the appraisal score was 1 in 87.9% of the cases, while in the case the solvability score was 5, the appraisal score was 5 in 35.0% of the cases. In the cases where the tasks were given an appraisal score of 1, the solvability score of 1 was given in 47.5% of those cases, while when the appraisal score was 5, the solvability score was 5 in 90.2% of the cases.
Finally, in order to know more about the tasks used in the questionnaire, we also investigated how the mean appraisal and solvability scores were related at task level. The results presented in the scatterplot of Figure 6 reveal that there was considerable variety in how the tasks were valued and that tasks which received about the same mean scores could be quite different in type and content.
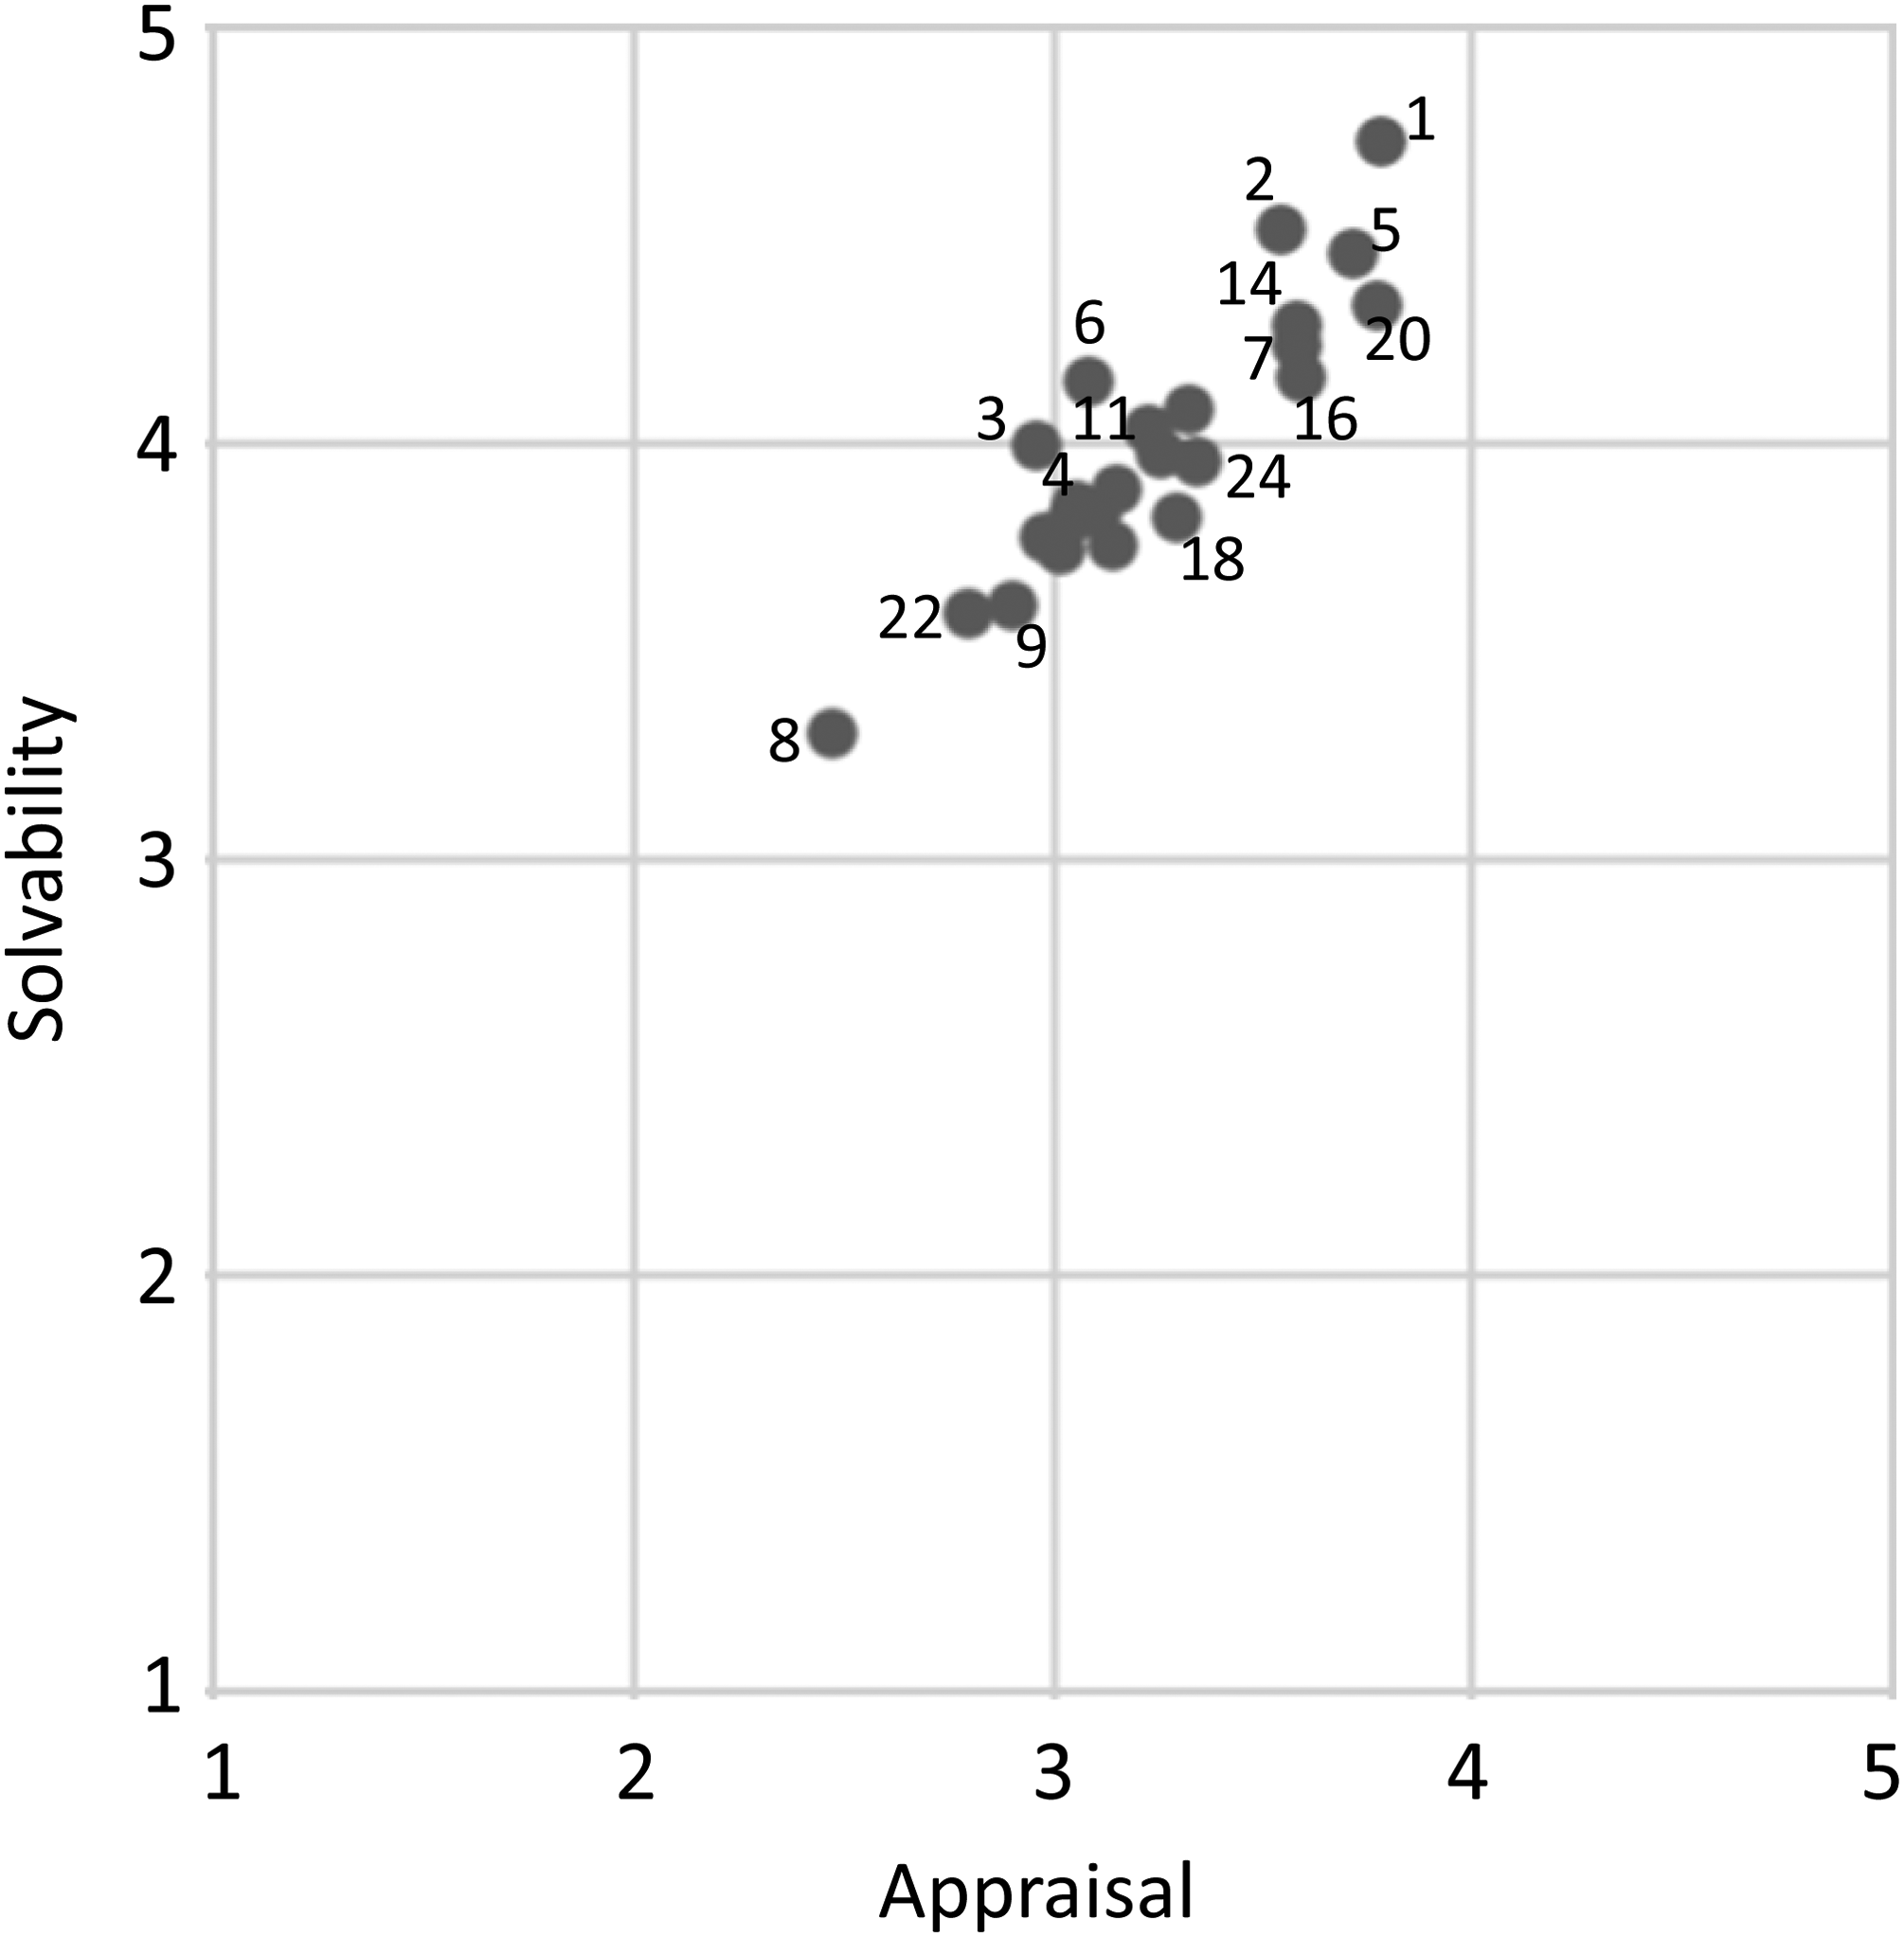
Scatterplot of the mean appraisal and solvability score of each task.
For example, the group of seven tasks (Tasks 1, 2, 5, 20, 14, 7, and 16) with the highest mean appraisal and solvability score included three bare-number tasks but also three puzzle-like tasks. Three of these seven tasks were context tasks and four were bare number tasks. The tasks with the lowest mean appraisal and solvability score were two tasks about fractions (Tasks 8 and 22) and one about percentages (Task 9). Another noteworthy finding was that some apparently comparable tasks were differently judged. The mean solvability scores of two fractions in context tasks (Tasks 3 and 22) differed quite substantially due to the fractions (1/2 and 2/9 respectively) involved in these tasks. A large difference was also found between the context (Task 9) and bare number task about percentages (Task 11) in the advantage of the bare number task. Furthermore, there were differences between the two context tasks (Tasks 20 and 6) about addition and multiplication and between the tree estimation tasks (Tasks 4, 18, and 24).
Summary and reflection
In this study, we investigated students’ opinions about mathematics tasks. The research questions focused specifically on what kinds of tasks students like or dislike, why they like or dislike the tasks, and whether this liking or not liking is related to whether students think they can solve the tasks. Answers to these questions were collected by means of an online questionnaire which was completed by 67 eighth-grade Norwegian students. The questionnaire consisted of 24 mathematics tasks varying in presentation, nature, and the operations and number types involved.
Taking together all the students’ responses, then the overall picture the students had about the tasks was not that negative. The total mean appraisal score of the tasks came close to the score of 3, which means that the students on average did not really like the tasks very much, but they also did not dislike them very much. In addition to the tasks with an intermediate score, there were also tasks closer to the endpoints of the range. However, based on these tasks with a more outstanding appraisal, it was not possible to say which kinds of tasks were liked and which were not liked, because high appraisal scores were found for various sorts of tasks. These tasks included both bare number tasks with a straightforward problem as well as bare number tasks with a puzzle-like problem. Also, context tasks belonged to the highly appraised tasks. At the other end of the range, the results were clearer. The tasks that were rated lowest were particularly those about fractions and percentages. Considering the difficulties that many students have with fractions due to the whole-number bias (González-Forte et al., 2019; Reinhold et al., 2020; Sidney et al., 2021), it is not surprising that most of the tasks with the lowest appraisal scores had either fractions or percentages as a topic while all the highest appraised tasks were about whole numbers.
When comparing the appraisal scores for bare number tasks and context tasks we found that the students seemed to like the bare number task more, yet the difference was not statistically significant. An exception to this was when we compared the two presentation formats for the puzzle-like tasks. With respect to the reason for liking or disliking a task, easiness was more often mentioned for the bare number tasks than for the context tasks, while challenge as a reason was more frequently connected to context tasks.
Apart from this finding, students’ opinions about context tasks revealed that the context can play a special role in whether students like or dislike a task. Often when the students said something about the context this was done in a positive way. A context for which this particularly was true was football, which is a very popular sport in Norway. In some towns with low populations, football is the only organized sport that children can participate in in their free time. Therefore, this is the sport that many students are the most familiar with, and many of them like it and play it after school. More in general, as it is emphasized by Clarke and Roche (2018), when contexts are about something the students are familiar with and in which they can use their own previous knowledge and experience, the students will be more engaged. The latter can contribute to students valuing the tasks as favorable, but it can also work in the opposite direction and can have a negative influence on students’ performance (Almuna Salgado, 2017). It can also happen that students even indicate that they do not like the context of a task and that the teacher therefore needs to choose a different context. For example, such a situation was observed by Mack (1993). In her study, a student commented on a fraction problem that she does not like pizza and therefore never eats pizza, but instead likes ice cream. So, the teacher was asked to change the problem into an ice cream problem then it would be easier for the student. Also, several other authors have shown that the suitability of using context in mathematics education is a complex issue, that if not used carefully, has the potential to restrict the mathematical development of some students (Sullivan et al., 2003). In line with this, Almuna Salgado (2017) even stated that the conflicting research outcomes about the use of context make clear that this issue is still not fully understood. An additional point that the students in our study raised in connection to the context was the use of text. Some students made it clear that the text was often a reason for disliking the task even when they liked the context.
When comparing the appraisal scores for the straightforward, the puzzle-like, and the estimation tasks we did not find a statistically significant difference, though the puzzle-like problems appeared to be more highly appraised by the students. Specifically, for the bare number tasks we found a significantly higher appraisal for the tasks with a puzzle-like problem than for the straightforward tasks. This preference for puzzle-like problems is in line with other studies that have shown that students were liking to be involved in challenging problem-solving tasks (Russo & Minas, 2020; Sullivan & Mornane, 2014) and that students were preferring open-ended context tasks to straightforward calculation tasks (Sullivan et al., 2013). Also, the reasons the students in our study gave for their appraisal scores suggested a positive attitude toward problem-solving tasks. For example, fun as a reason for liking a task was mostly mentioned in the case of the puzzle-like tasks, and for the estimation tasks the students often mentioned challenges. Another finding was that although in general, the reasons that were mainly mentioned for liking tasks were finding them to be easy and for disliking finding them to be difficult, the opposite was also the case. In some cases, the students made it clear that finding a task easy was the reason for not liking it that much. Likewise, it sometimes occurred that tasks that were found difficult or challenging were given a rather high appraisal score.
When it comes to the reasons given by the students for liking or not liking tasks, especially the estimation tasks elicited quite a number of comments varying from making clear that they did not know what estimation is, to criticizing how the tasks were formulated. According to the students who criticized the tasks, the necessary information for solving the tasks was lacking. In fact, these reactions revealed that the students were not familiar with estimation tasks. This however is not a surprise when we bring into mind what Sunde et al. (2022) found about this topic. As reported by them, Scandinavian schools, and particularly Norwegian schools, do not have much in the curriculum that is alluding to the topic of estimation. Since the students in our study were in the eighth grade when answering the questionnaire, it seems they have been through many years of schooling without having learned much about estimation. Therefore, the confusion that arose among the students around these tasks can aptly be regarded as a wake-up call for reconsidering what education has to offer students.
The last issue addressed in our study was whether the students thought they can solve the tasks and whether this was related to liking or disliking the tasks. The found mean score of 4 for solvability indicates that in general, the students were rather positive about whether they could solve the tasks. Yet, this score also means that the students were not very convinced of it. Only in about half of the cases, the students answered that they were very sure about being able to solve the tasks. As such, this finding could be considered a reasonable result, were it not that the students at the time of collecting the data were already in the eighth grade and that the tasks presented to them were mostly requiring only basic mathematical skills. This finding could again be a matter of what has been taught to the students, but there could also be other reasons for their reaction. It is very plausible that the students were quite able to solve the tasks but yet did not answer this because of low self-efficacy. As noted by Nilsen et al. (2022) the analysis of the TIMSS results has shown that the Norwegian students’ self-concept in mathematics has declined from 2015 to 2019, which means that they feel less confident in this subject. This was also reflected in some utterances of the students where they called themselves “stupid” or otherwise seemed to feel helpless when doing mathematics.
When investigating whether the perceived solvability is related to the liking or disliking of tasks, it turned out that whether the students think they can solve a task might be a relevant factor in students’ opinions about mathematics tasks. In our analyses, we found that students’ perceived solvability of tasks and the appraisal scores given to the tasks were moderately positively correlated. The more the students expected that they could solve a task the more they liked the task. There seems to be a clear relationship, but at the same time, a further analysis carried out from the perspective of the tasks showed that there was considerable variety in how tasks were valued. Tasks with a particular appraisal and solvability score included quite different types of tasks, and similar types of tasks had different appraisal and solvability scores.
Limitations
Notwithstanding our research has led to interesting and inspiring, but challenging findings, the study certainly has some limitations. Therefore, the results should be viewed with caution. A limitation is that the students were only from four schools in the Nordland region of Norway and that only eighth-grade students were involved. Students in other schools and other grades may have different opinions about these tasks. From other studies, it is known that in lower grades students tend to report higher enjoyment and motivation in mathematics than in higher grades (Mazana et al., 2019; Russo & Minas, 2020).
Another issue that may have influenced our results is the used instrument. Although the online questionnaire was very feasible to reach the students and get the responses directly available for analyzing them, the use of this instrument also had its constraints, especially to get deeper knowledge about why students like or dislike tasks. The online answers were often very short and prompted the need for further questioning. Moreover, in about 40% of the cases, the students did not give a reason for their appraisal score. In this respect, interviewing the students would have been more appropriate in order to know more about how they think about the tasks. For example, learning more about why students think they can or cannot solve a task. Knowing this could provide more insight into how students approach specific tasks and what they consider as difficult and as easy in a task.
Also, the relation between the appraisal of the tasks and the perceived solvability of them needs more investigation. The responses of the students showed that these are not straightforwardly linked. For example, some students made it clear that they liked it when a task was difficult, but still answered that they thought they could solve it. Apparently, finding that a task is difficult does not automatically mean that the task cannot be solved. In connection with this, it would also be interesting to know more about the relation between the students’ perceived solvability and the achieved solvability by also asking them to solve the tasks.
Further research
In accordance with the findings of Schukajlow (2015) and Sullivan et al. (2013), our study gives support to the view that investigations of various aspects of students’ motivational orientation toward mathematics should not be limited to students’ attitudes to mathematics in general. Besides knowing whether students like or dislike mathematics, there is another level of knowledge that is essential for making educational decisions for teaching, assessing, and designing mathematics education. Therefore, we think it is very important to include “mathematics tasks” as a factor in the theoretical models when investigating students’ appraisal of mathematics. Moreover, besides working on more sensitive theoretical models to get a deeper understanding of the role of motivation in the learning of mathematics, knowledge about how students think about tasks is also of practical relevance. Like Middleton (2013), we think that it is the task where the motivation is triggered. Yet, how many teachers, textbook authors, and assessment designers ever ask students which tasks they like? We do not know this, but our literature search showed that publications about students’ opinions about mathematics tasks they come across in lessons, examinations, and textbooks, are very sparse. Following the current movement toward giving students a voice in mathematics education research (e.g., Hill & Seah, 2023; Röj-Lindberg & Hemmi, 2019; Roos, 2023; Zorn et al., 2022), we think this gap in literature needs to be filled by studies in which the perspective of students is taken. Earlier, Clarke et al. (2014, p. 119) made already a strong point for that by stating “research into the design and use of mathematical tasks in instructional settings must accommodate student intentions, actions and interpretations to at least the same extent as those of the teacher.” In line with this statement, Johnson et al. (2017) even suggested adding a fifth area to Jones and Pepin's (2016) four areas which researchers should include in task design, namely students’ experiences of tasks. This means that to enrich and deepen our understanding of teaching and learning mathematics we should give the students a voice in mathematics education research, particularly when this research is about the tasks that are used in mathematics education. Our article was meant to contribute to this.
Relevant in this respect is also that including students’ feelings and thoughts about mathematics should go beyond whether they like/dislike mathematics in general. The latest TIMSS results (Mullis et al., 2020) have shown that half of the eighth graders in Norway do not like mathematics. However, for making instructional decisions it is important to know what this means at the task level. The TIMSS results also revealed that, apart from Singapore, the students in all Asian countries that participated in TIMSS disliked mathematics more than the international average. We therefore think that a study like we did would also be helpful to know more about Asian students’ dislike of mathematics and to find leverage points for improvement.
Footnotes
Acknowledgements
The authors thank the four teachers and their students involved in this study for their cooperation and contributions.
Contributorship
Conceptualization: Ylva Høgset and Marja Van den Heuvel-Panhuizen; methodology: Ylva Høgset, Marja Van den Heuvel-Panhuizen, and Knut Berg; data collection: Ylva Høgset; resources: Ylva Høgset and Marja Van den Heuvel-Panhuizen; software: Ylva Høgset and Knut Berg; data curation: Ylva Høgset and Marja Van den Heuvel-Panhuizen; analysis: Ylva Høgset, Marja Van den Heuvel-Panhuizen, and Knut Berg; writing—original draft: Ylva Høgset; writing—review and editing: Marja Van den Heuvel-Panhuizen, Ylva Høgset, and Knut Berg; visualization: Marja Van den Heuvel-Panhuizen and Ylva Høgset; supervision: Marja Van den Heuvel-Panhuizen; project administration: Marja Van den Heuvel-Panhuizen and Ylva Høgset; funding acquisition: Ylva Høgset and Marja Van den Heuvel-Panhuizen.
Declaration of conflicting interests
The authors declared no potential conflicts of interest with respect to the research, authorship, and/or publication of this article.
Funding
The authors disclosed receipt of the following financial support for the research, authorship, and/or publication of this article: This work was supported by the Nord Universitet (Grant No. 300027-153 for 2022).
Author biographies
Appendix
Mean scores and standard deviations of the perceived solvability of the tasks. a
| Task type | Taska | Mean score | SD | |
|---|---|---|---|---|
| 1 | + bare numbers | 347 + 489 = | 4.72 | 0.775 |
| 2 | – bare numbers | 912 – 677 = | 4.51 | 0.894 |
| 3 | fractions in context |
There are 12 bottles that has 1/2 litres each. How many litres does each person get if there are eight people sharing? | 3.99 | 1.037 |
| 4 | investigation with estimation in context |
Make an estimation of how many burgers you can buy for a million kroner? Explain how you came to your answer. | 3.85 | 1.193 |
| 5 | puzzle-like problem bare numbers |
Fill the missing digits in in the boxes ◻3−2◻=25 |
4.45 | 1.01 |
| 6 | +/× in context | You are selling buns for 15kr, and adding jam costs an extra 5 kr. You bought ingredients for 132kr, and sold 84 buns. Every 4th bun had jam on it. How much money did you earn? | 4.14 | 1.006 |
| 7 | puzzle-like problem in context |
In a soccer tournament, teams get: 3 points for a win, 1 point for a tie, 0 points for a loss. Zedland has 11 points. What is the smallest number of games Zedland could have played? | 4.23 | 0.989 |
| 8 | fractions bare numbers |
|
3.3 | 1.24 |
| 9 | percentages in context |
The shop offers a 25% discount. The sale price of the binocular is 960 kr. What was the regular price? | 3.61 | 1.239 |
| 10 | puzzle-like problem in context |
A family has three children that have a total age of 36. The youngest child is half the age of the middle child, and the oldest child is three times the age of the youngest. How old are the children? | 4.08 | 1.168 |
| 11 | percentages bare numbers |
What is more? 15% of 750 or 35% of 350? |
4.03 | 1.145 |
| 12 | decimals in context |
The size of a carpet is 8.5 by 10 metres. 1.5 metres from the side is cut all around. What is the area in square metres of the reduced carpet? | 3.88 | 1.303 |
| 13 | puzzle-like problem in context |
There is a row of books of different sizes on a shelf. There are 20 books to the left of the largest book and 22 books to the right of the smallest book. The largest book and the smallest book are both adjacent to the oldest one. What is the smallest possible number of books on the shelf? | 3.77 | 1.151 |
| 14 | × bare numbers | 14 × 78 = | 4.28 | 1.111 |
| 15 | decimals in context |
Rocco has 1.5 litres of orange soda and 2.25 litres of grape soda in his fridge. Antonio has 1.15 litres of orange soda and 0.62 litres of grape soda. How much more soda does Rocco have than Angelo? | 3.97 | 1.202 |
| 16 | puzzle-like problem bare numbers |
Fill the missing digits in in the boxes. 243+1◻7+◻26=82 |
4.15 | 1.265 |
| 17 | fractions bare numbers |
3.74 | 1.207 | |
| 18 | investigation with estimation context |
The traffic jam is 2 kilometres long. About how many cars do you think are in this traffic jam? Explain how you came to your answer. | 3.82 | 1.286 |
| 19 | puzzle-like problem bare numbers |
The difference between two double-digit numbers is 50. How many such pairs of double-digit numbers are there? |
3.82 | 1.236 |
| 20 | +/× in context | A football team of 14 players is participating in a cup. Registration fee for the team: 1700 kr. Accommodation and food per person: 900 kr. Renting a bus to and from the cup: 4600 kr. How much does it cost for the team to participate in the cup? | 4.33 | 1.085 |
| 21 | : bare numbers | 592 ÷ 37 = | 3.75 | 1.335 |
| 22 | fractions in context |
2/9 of the people on a restaurant are adults. If there are 95 more children than adults, how many children are there in the restaurant? | 3.59 | 1.231 |
| 23 | puzzle-like problem in context |
100 marbles are in row. Lisa starts on the left and takes 7 marbles each time, while Tim starts on the right and takes 3 marbles each time. They stop when there are no marbles left. How many marbles will each get? | 3.83 | 1.294 |
| 24 | investigation with estimation in context |
Make an estimation of the hours you sleep in one year. Explain how you came to your answer. | 3.95 | 1.292 |
| TOTAL | 3.99 | 1.154 |
The tasks with the highest perceived solvability are coloured blue and those with the lowest perceived solvability are coloured orange.