
Abstract
Personalized assessment is an essential component in education. Although many cognitive diagnosis models (CDMs) have been developed for this purpose, few studies have applied them in secondary mathematical contexts. Using a sample of 391 Grade 11 students from a secondary school in China, the findings indicated that the higher-order generalized deterministic inputs, noisy, “and” gate (higher-order GDINA) model with one-parameter logistic (1PL) best fit the data, and the Q matrix validation process achieved acceptable results. At the grade level, most of the participants mastered attributes B1 (i.e., basic concept development of derivatives: simple equations, zero or extreme points, and function range problems), B2 (complex inductive contextualization of derivatives: induction from the known to solve the unknown problems), and B3 (basic routine problem solving of derivatives: graphs that pass through a fixed point or quantitative inequalities). However, less than half of the students mastered attribute B4 (complex transformative contextualization of derivatives: transformation by the combination of numbers and graphs). At the individual level, we selected four representative students with high, medium, and low levels of achievement to examine their individual skill profiles and provide personalized remedial and enhanced feedback. Implications for personalized assessments are discussed.
Introduction
Personalized assessment is an essential aspect of personalized education (Sadovaya et al., 2016; Tetzlaff et al., 2021; Waldeck, 2006; West, 2011). In educational contexts, assessments are used to observe and ascertain learners’ performance and to provide feedback. The feedback, also called diagnostic information, should consider both strengths and weaknesses at the individual (micro) and grade (macro) levels (Leighton & Gierl, 2007; Maghsudi et al., 2021; Waldeck, 2006). Different psychological measurements have been developed to address this issue of providing personalized diagnostic information. Classic test theory (CTT) has been used to measure the reliability and validity of tests (Miller & Lovler, 2018). Baker and Kim (2017) argued that CTT can be used to assess whole tests but does not obtain sufficient data on the unobserved latent traits of students’ abilities. This observation stimulated the emergence of item response theory (IRT, see Embretson & Reise, 2000). However, overall test scores or sub-scores have generally been used to rank individual students, which does not satisfy the increasing need for personalized assessments. Rather than assessing students’ abilities on a continuous scale, cognitive diagnosis models (CDMs) have been designed to extract students’ current learning status and cognitive structures from their test responses (Ravand, 2016; Rupp & Templin, 2008), which can not only provide the feedback at multiple levels but also efficiently contribute to learning and instructional design.
Literature review
Cognitive diagnosis models
In the past few years, a number of CDMs have been developed (de la Torre, 2009, 2011; Ravand & Robitzsch, 2018; Templin & Henson, 2006) and applied in a variety of contexts (Marszalek et al., 2019; Wu et al., 2020). For example, Marszalek et al. (2019) used the log-linear cognitive diagnostic model to assess the validity of the Social Issues Advocacy Scale (Nilsson et al., 2011). This section provides an overview of the basic notations and terminologies used in CDMs.
Assume that K attributes of I students are being assessed using a test with J items. Accordingly, there are
The response data of student i to item j is dichotomous, where “1” indicates a correct response and “0” indicates an incorrect response. Thus, the response matrix X of dimension
These X and Q matrices are two key input elements of CDMs. However, the correlations among attributes are likely to overlap, which affects the structure of the Q matrix. A clear understanding of the relationships among attributes is necessary for the selection of appropriate models for empirical studies.
Application of CDMs in secondary mathematics
Studies have shown that complicated inter-attribute relationships are common in secondary mathematics contexts. A handful of studies have applied CDMs to mathematical education (Li et al., 2020; Wu, 2019; Yamaguchi & Okada, 2018). For instance, Li et al. (2020) recruited 747 kindergarteners to assess their mathematics problem-solving skills of 11 cognitive attributes. They underscored that CDMs not only provided more accurate information like the mastery patterns of attributes, but also indicated a practical approach to evaluating the test quality (Li et al., 2020). Similarly, using data from 84 fourth grade elementary school students, Wu (2019) implemented CDMs to evaluate students’ mastery of fraction operations. The results showed that remedial instructions based on CDMs were more effective than traditional group courses, and the study also highlighted diagnostic information was effective for all levels of achievement groups, particularly for those with medium and low achievements (Wu, 2019). Likewise, in junior mathematics, Yamaguchi and Okada (2018) analyzed seven countries or regions representing high-, average-, and low-ranked mathematical performances in the Trends in International Mathematics and Science Study 2007 (TIMSS 2007). They illustrated that CDMs performed better than IRT approaches in assessing fourth graders’ mathematical literacy (Yamaguchi & Okada, 2018). They also argued that the diagnostic information provided by CDMs could reveal actual students’ response behavior and hence the cognitive situations (Yamaguchi & Okada, 2018).
However, the aforementioned literature only addressed the CDMs applied in lower grades and examined relatively simple testing attributes. Higher-grade mathematical contexts have not received sufficient attention. Thus, this study addressed this gap by conducting a detailed investigation of CDMs in secondary mathematical contexts.
Higher-order generalized deterministic, inputs, noisy, “and” gate model
Many CDMs have been developed based on different assumptions. de la Torre (2011) argued that even if the mathematical expressions of diverse CDMs seem similar, it is necessary to carefully select the best models for specific empirical studies. Ravand and Robitzsch (2018) found that when the relationships among attributes are unknown, the generalized deterministic, inputs, noisy, “and” gate (GDINA) model (de la Torre, 2011) is suitable for initial estimates, due to its saturated form with great flexibility. Ma and de la Torre (2020b) also verified that one of the most direct methods of addressing the complex attribute relationship issue was to implement independent models like the GDINA model.
In the GDINA model, as not all attributes are needed for item j, the number of latent classes collapses from

where
The unclear relationships among attributes make it difficult to determine the structure of the joint attribute distribution (Ma & de la Torre, 2020b). de la Torre and Douglas (2004) explored the capability of higher-order GDINA models to address this problem. In higher-order models, the relationships among attributes are defined within the item response theory framework, which includes models such as the Rasch model (Rasch, 1993), the one-parameter logistic (1PL) model (Thissen, 1982), and the two-parameter logistic (2PL) model (Drasgow, 1989). Under the item response function of the GDINA model, higher-order GDINA models can be derived for different joint attribute distributions using item response theory models as follows.
Under the two-parameter logistic (2PL) model,

where
The one-parameter logistic (1PL) model is inferred by setting all

The Rasch model is described by setting all

In short, many studies have attempted to establish a theoretical framework for higher-order GDINA models. However, there have been few empirical studies in complex mathematical contexts such as secondary schools.
Using the empirical data collected from a secondary school in China, the present study aimed to investigate the application of the higher-order GDINA models considering the intricacy of interrelationships among attributes in secondary mathematics. Drawing upon the Q matrix validation procedure, this study further examined the diagnostic information from both grade and individual levels. In particular, this study addressed two research questions:
Method
Participants and instruments
The sample in this study consisted of 391 Grade 11 students in a high-performing level secondary school in Luoyang, Henan Province, China. They were from eight different classes and were selected following the school's fixed classes arrangement system. Students had firstly received about five 40-min lecture instructions on the “univariate function and its derivative” module in one week of the spring semester in 2019. The contents of this module were new to all students, but they already had preliminary knowledge in algebra and geometry such as Cartesian coordinates and trigonometric functions. Learning materials were the same and all students completed the instructions. Then a weekly test was designed for the purpose of formative assessment. All students took the test at the same time after accomplishing the instructions, and the test duration was 30 min. Informed consent was obtained from the participants involved in the study.
The test consisted of 13 items (See Appendix). All the items were multiple choice questions, and the students were required to choose one of the four options coded as A, B, C, or D. A correct answer received one point and an incorrect answer received zero points.
The test was centered on functions and derivatives, which was in alignment with the Chinese mathematical curriculum standards for secondary schools (Ministry of Education, 2018). These basic but essential topics are linked with calculus, which is regarded as the beginning of higher mathematical thinking (Zulnaidi & Zamri, 2017). Vinner (1992) demonstrated that function acts as the core concept in calculus and Selden and Selden (1992) also asserted that functional concept is interconnected with other varieties of sub-topics in mathematics. Secondary school students are therefore supposed to master concrete knowledge about functions (Zulnaidi & Zamri, 2017).
Attribute coding taxonomy
CDMs have been applied in many international assessments (Chen & Chen, 2016; Evran, 2019; Wu et al., 2020; Yamaguchi & Okada, 2018). The global measurement of mathematical literacy has a long history, from the Pilot Twelve-Country Study (Foshay et al., 1962), through the First International Mathematics Study (FIMS64, see Husén, 1967), to more comprehensive international large-scale assessments (see Rutkowski et al., 2014). For example, the Program of International Student Assessment (PISA) is a triennial cyclical international assessment implemented by the Organisation for Economic Co-operation and Development (OECD), and it aims at measuring 15-year-old adolescents’ capability to use their reading, mathematics, and science knowledge and skills to deal with life obstacles (OECD, 2004, 2013). The 15-year-old age range in PISA is similar to the secondary school students in China, so it is reasonable to include the PISA assessment framework for comparison.
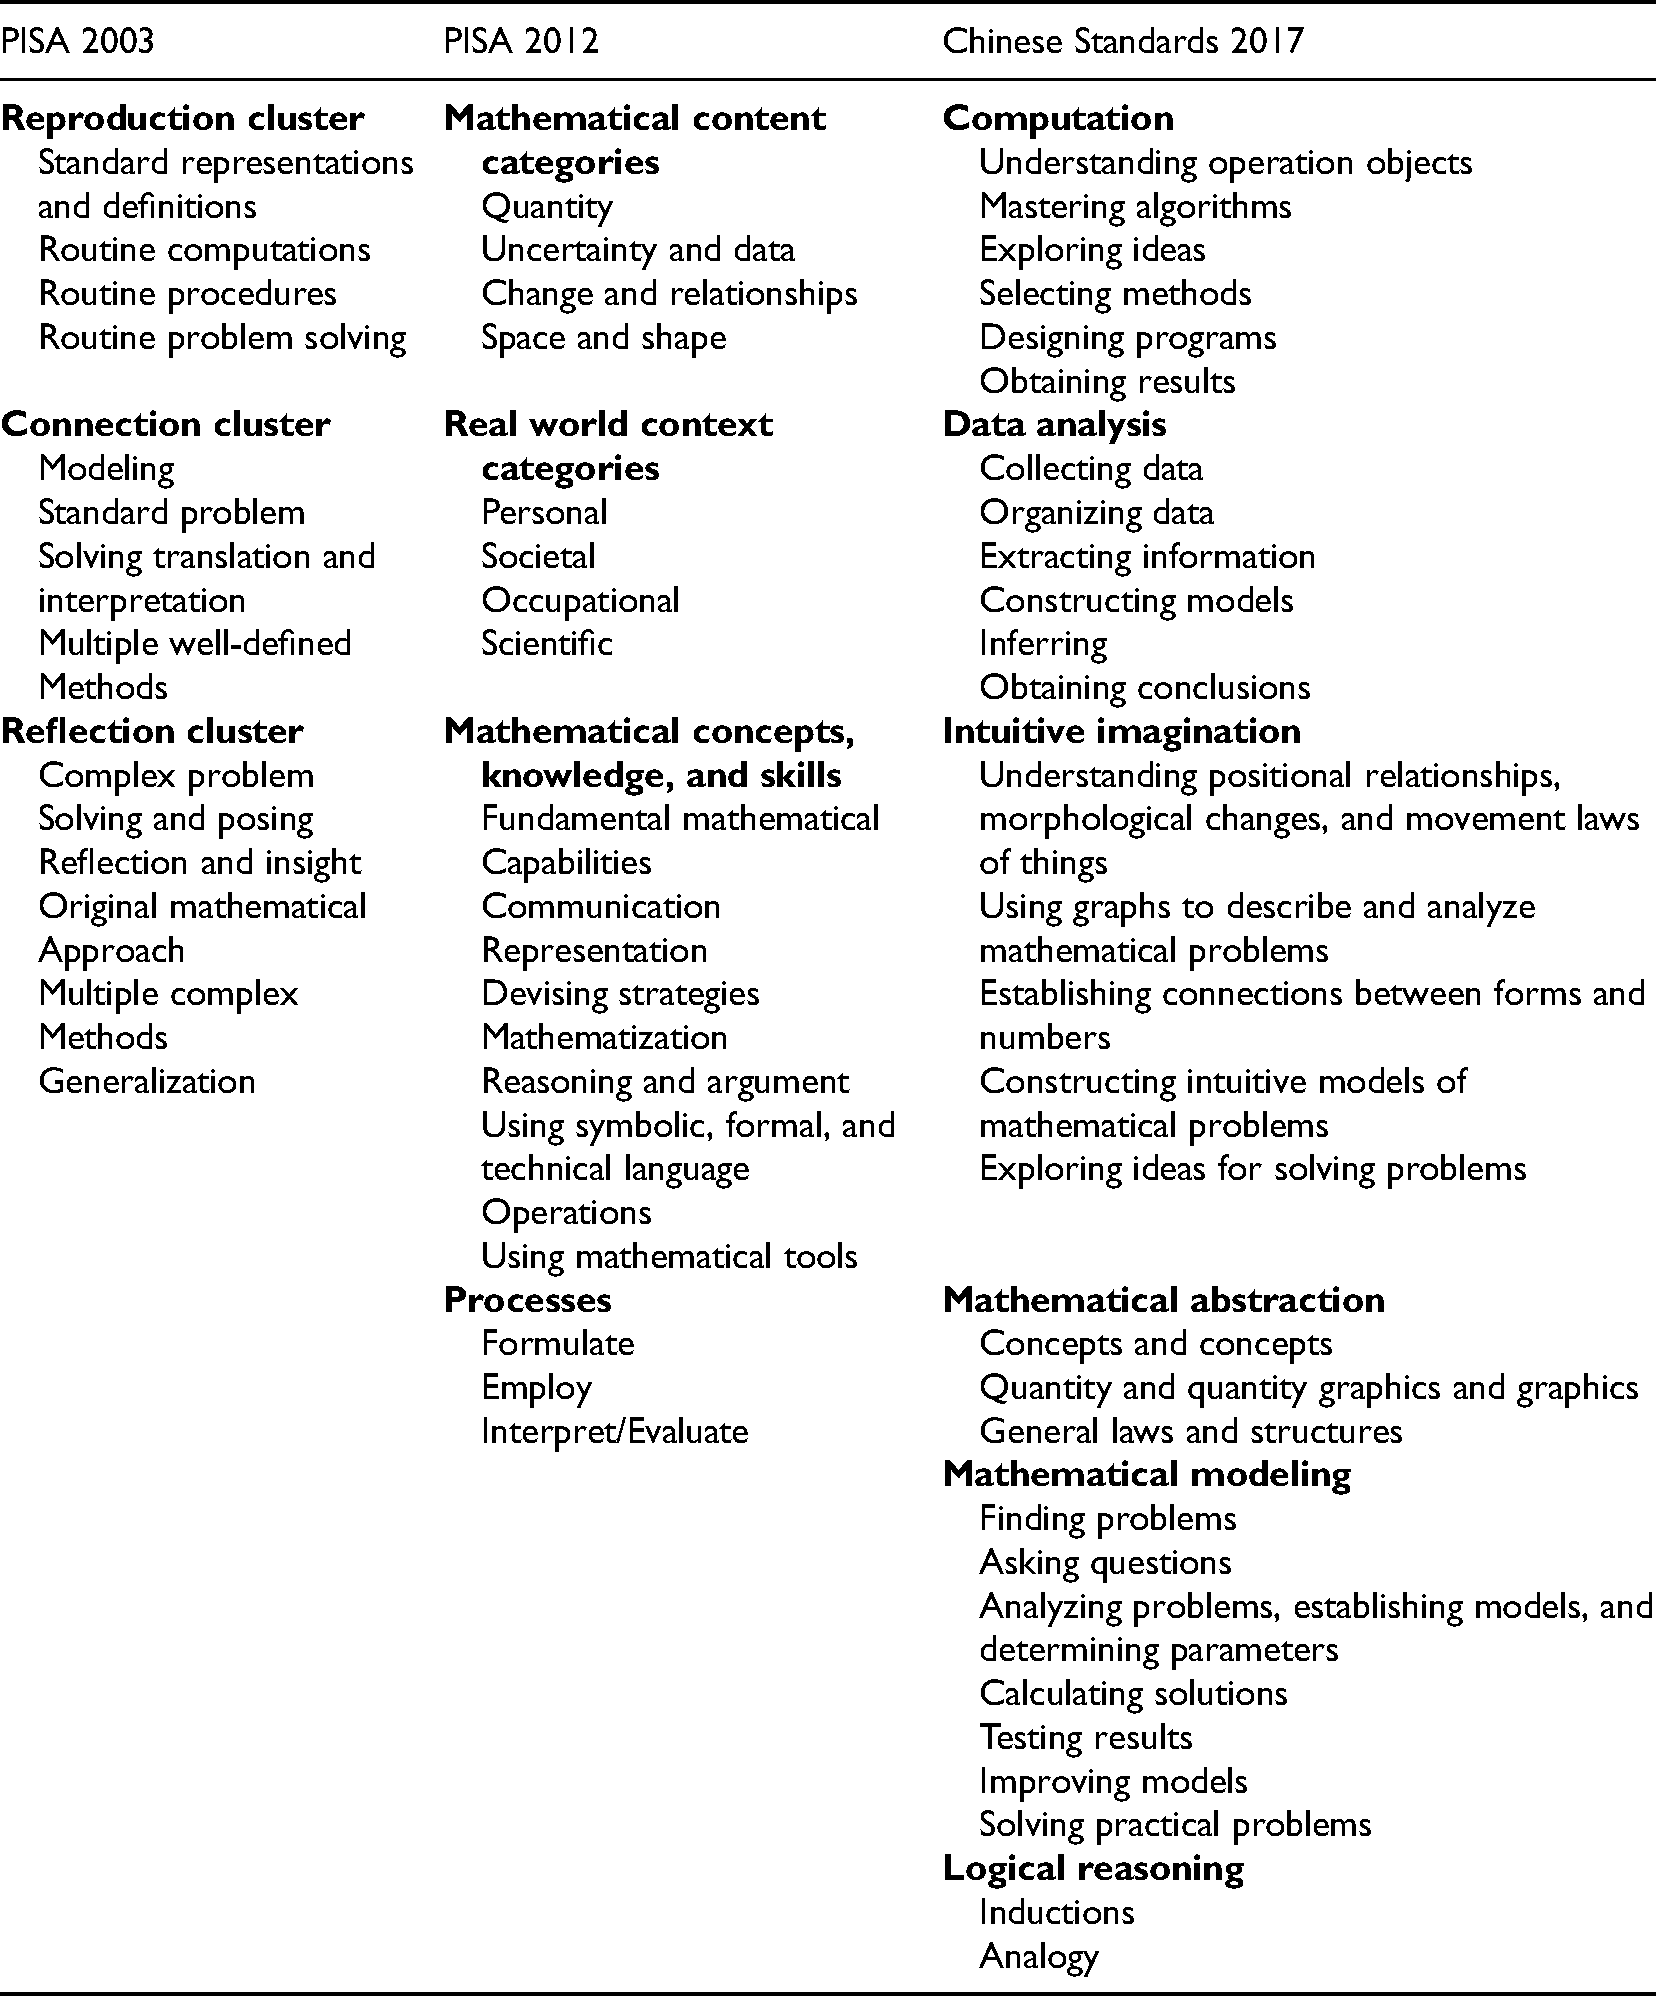
The PISA test carried out by OECD in 2003, denoted PISA 2003, used an assessment framework with three clusters, the reproduction cluster (RepC), the connection cluster (ConC), and the reflection cluster (RefC). Several sub-domains were incorporated into each cluster (OECD, 2004). The revised framework used to assess mathematical literacy in PISA 2012 had four domains, mathematical content categories (MC), real-world context categories (RWC), mathematical concepts, knowledge, and skills (MCKK), and processes (Pro), with corresponding sub-domains (OECD, 2013). These two cycles of PISA tests were examined in this study as mathematical literacy is one of the three major domains in PISA (OECD, 2004, 2013). For comparison, this study also considered the Chinese mathematical curriculum standards published in 2017 (Ministry of Education, 2018), denoted as Chinese Standards 2017. The Chinese Standards 2017 identified seven areas of core mathematical literacy: computation (Com), data analysis (DA), intuitive imagination (II), mathematical abstraction (MA), mathematical modeling (MM), and logical reasoning (LR). The descriptions of the seven areas and the sub-domains are given in Table 1. Table 1 provides the definitions of mathematical literacy used in PISA 2003, PISA 2012, and the Chinese Standards 2017.
Mathematical literacy in PISA 2003, PISA 2012, and Chinese standards 2017.
Mathematical literacy in PISA 2003, PISA 2012, and Chinese standards 2017.
To construct the Q Matrix, seven domain content experts, including four professors conducting research in mathematical education and education assessments and three research postgraduate students, participated in this process.
First, the domain content experts assinged attribute codes to the 13 items in the test given to the Grade 11 students based on the PISA 2003, PISA 2012, and Chinese Standards 2017 frameworks. Four attributes were identified, defined, and coded as follows.
The domain experts unanimously agreed that the four defined attributes, all drawn from the “univariate function and its derivative” module, were highly consistent with the taxonomies of PISA 2003, PISA 2012, and Chinese Standards 2017 (See Table 2). For instance, B1 covered all three clusters in PISA 2003, i.e., RepC, ConC, and RefC; three clusters in PISA 2012, i.e., MC, MCKK, and Pro; and five areas in the Chinese Standards 2017, i.e., MA, LR, Com, MM, and II.
Attribute consistency under PISA 2003, PISA 2012, and Chinese standards 2017.
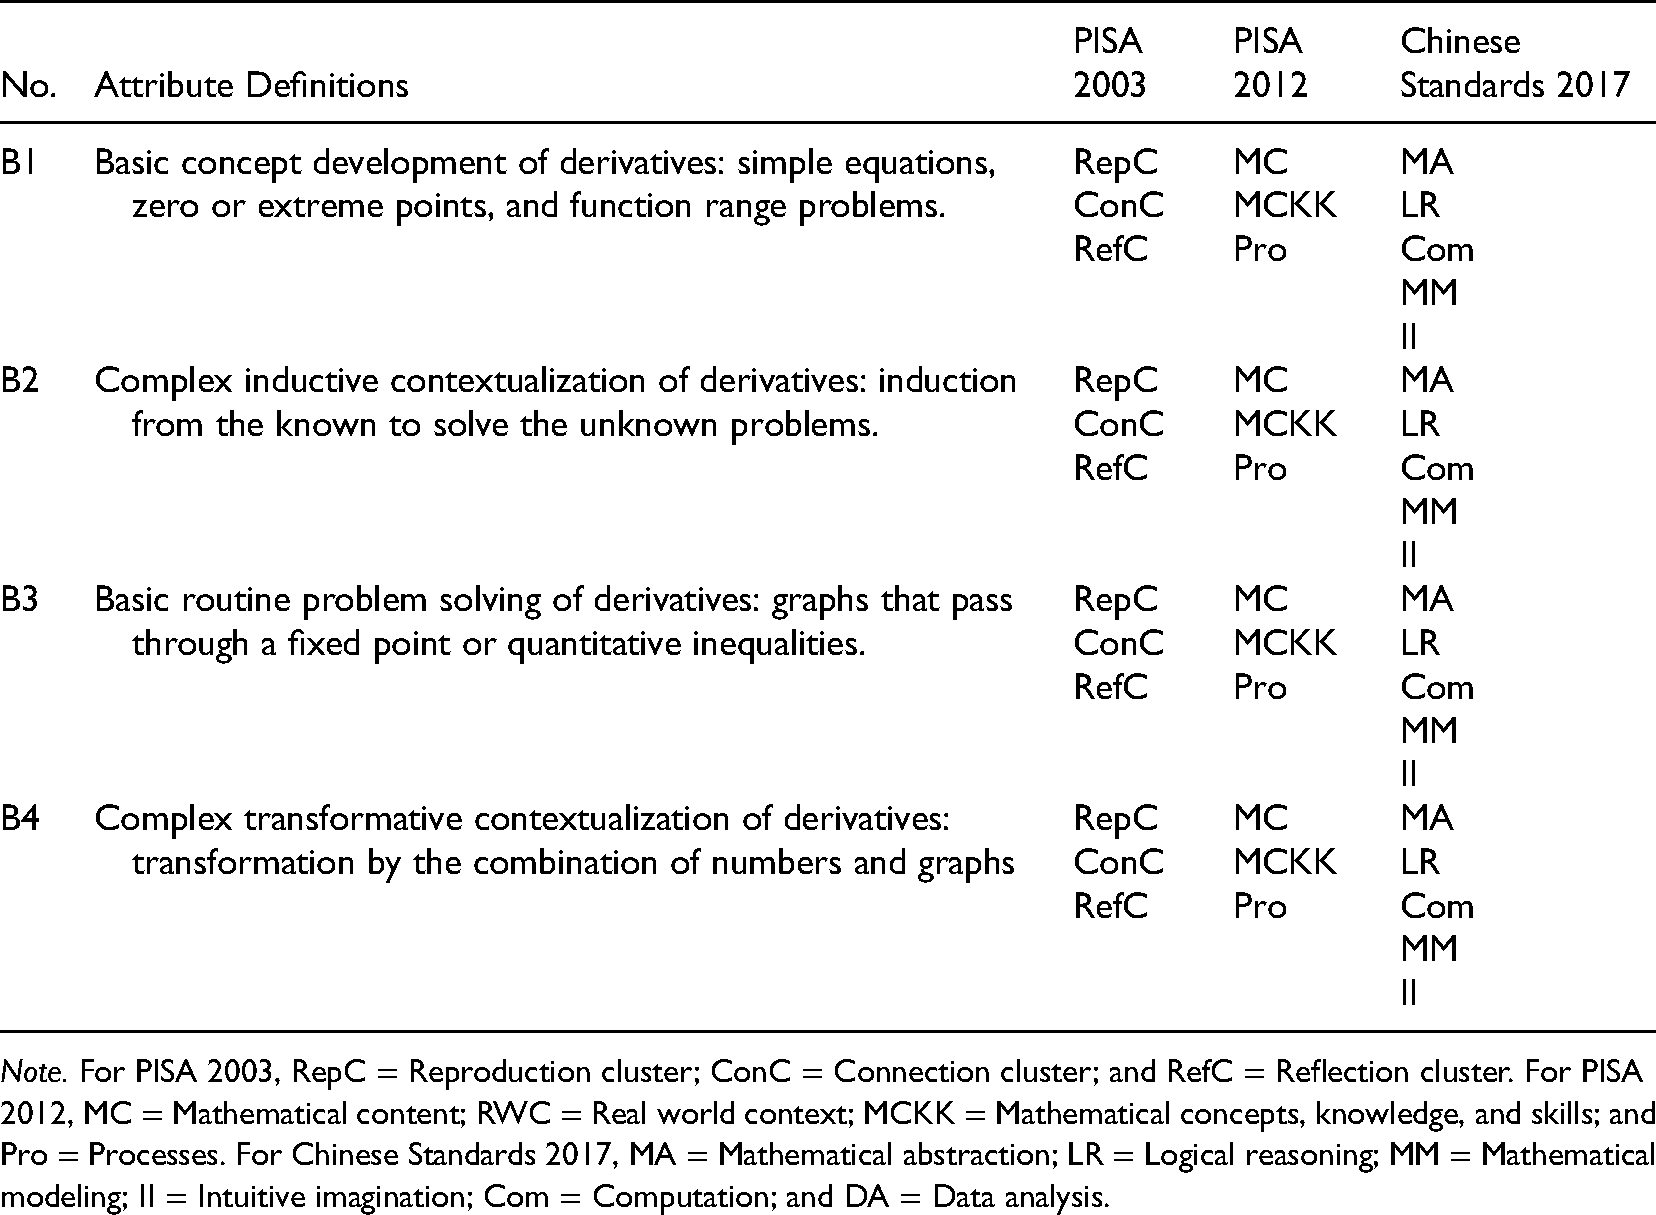
Attribute consistency under PISA 2003, PISA 2012, and Chinese standards 2017.
Note. For PISA 2003, RepC = Reproduction cluster; ConC = Connection cluster; and RefC = Reflection cluster. For PISA 2012, MC = Mathematical content; RWC = Real world context; MCKK = Mathematical concepts, knowledge, and skills; and Pro = Processes. For Chinese Standards 2017, MA = Mathematical abstraction; LR = Logical reasoning; MM = Mathematical modeling; II = Intuitive imagination; Com = Computation; and DA = Data analysis.
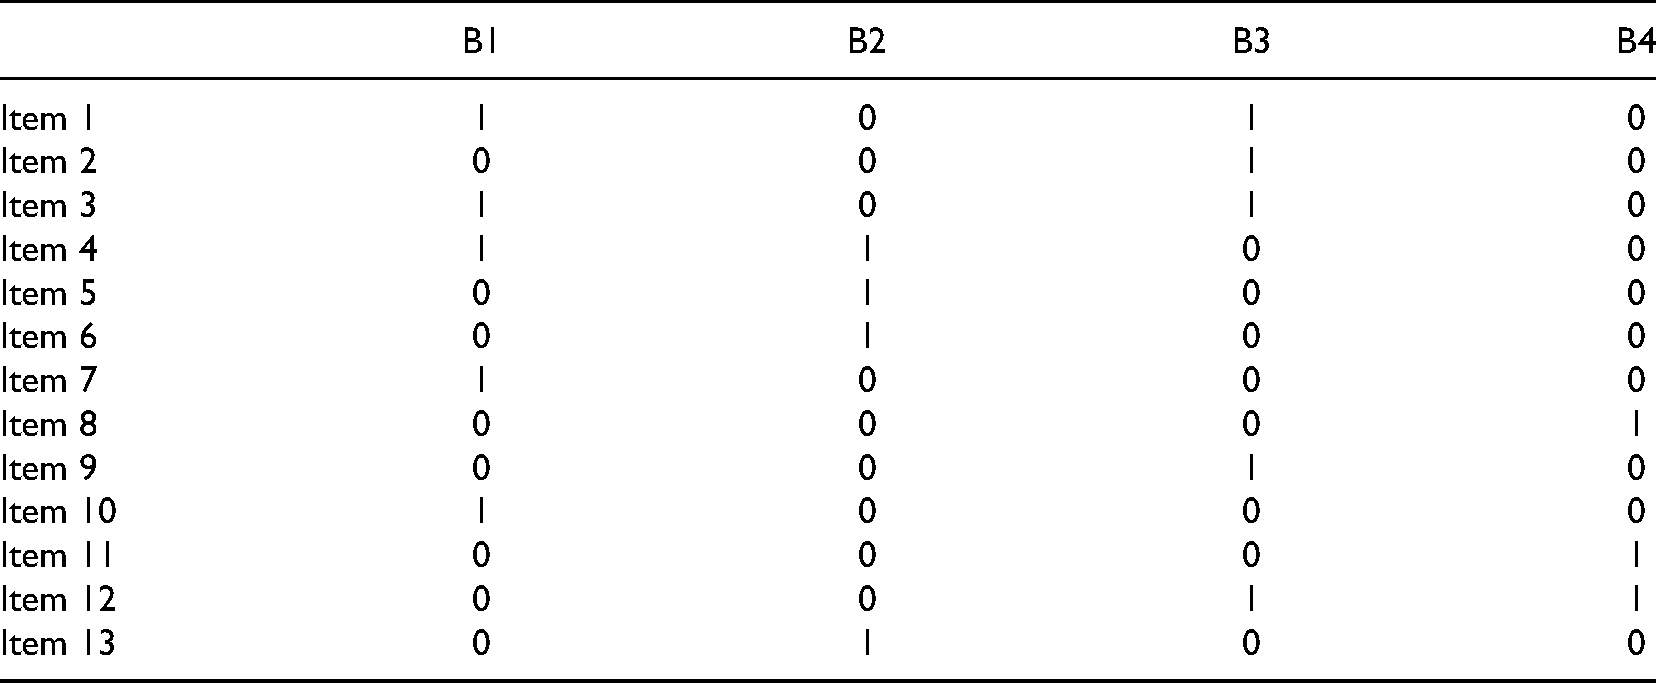
After verifying the consistency of the items with these three standards, the domain experts collaboratively constructed an initial Q matrix that matched specific items with attributes (See Table 3).
Initial Q matrix.
Here we illustrate the process of constructing the initial Q matrix using Item 4.
A. −1 B.
The domain experts confirmed that Item 4 tested students’ understanding of attributes B1 and B2. Therefore, in the initial Q matrix, both attributes were assigned a value of 1 in the Item 4 row, and B3 and B4 were assigned a value of 0, as this item did not test students’ mastery of those attributes.
After construction of initial Q matrix, model selection was applied to choose the appropriate model for the empirical data in this study. Then a two-step Q matrix validation process was implemented. In the first step, we used the selected model to get the modification elements of initial Q matrix based on the stepwise approach (Ma & de la Torre, 2020a). In the second step, the domain experts made the decisions on acceptance or rejection of these elements to acquire the final Q matrix. After that, we conducted the diagnostic information analysis from four aspects: attribute prevalence, latent class and posterior probability percentage, item parameter estimates, and individual skill profiles, using the selected model and the final Q matrix.
We conducted all model selection, Q matrix validation and diagnostic information analysis using R software with the GDINA package version 2.8.8 (Ma et al., 2022). For between-model comparisons, we used six relative fit indices to evaluate the goodness-of-fit of the models and they were: loglikelihood, deviance, Akaike Information Criterion (AIC), Bayesian Information Criterion (BIC), Consistent Akaike Information Criterion (CAIC), and Sample Size-adjusted Bayesian Information Criterion (SABIC). General criteria for the indices indicate that the smaller values of them, the better the goodness-of-fit of the models.
For within-model comparisons, we chose three absolute fit indices and they were: M2, Root Mean Square Error of Approximation (RMSEA), and Standardized Root Mean Square Residual (SRMSR). Specifically, the M2 statistic was used to assess the overall model fit for dichotomous responses and the acceptable models should include a nonsignificant value of M2 (Chen et al., 2018; Maydeu-Olivares & Joe, 2006). We also adopted the cut-off RMSEA values of 0.01, 0.05, and 0.08 for excellent, good, and mediocre fit respectively (MacCallum et al., 1996) together with SRMSR smaller than or equal to 0.05 (Erdle et al., 2010).
Results
Model selection (RQ1)
To address RQ1, this study investigated which higher-order GDINA models fit the empirical data and how the Q matrix validation process can be used to modify the expert judgment-based initial Q matrix. As discussed in the literature review part about the higher-order GDINA models, the interactions among attributes may affect the joint attribute distribution and thus the structure of the matrix (Ma & de la Torre, 2020b). Research has verified that higher-order GDINA models with Rasch, 1PL, and 2PL joint attribute distributions can be used to select appropriate models for empirical studies (de la Torre, 2011; de la Torre & Douglas, 2004; Ma & de la Torre, 2020b). This study also included the saturated GDINA form for comparison (Table 4).
Relative and absolute fit indices for the four models.
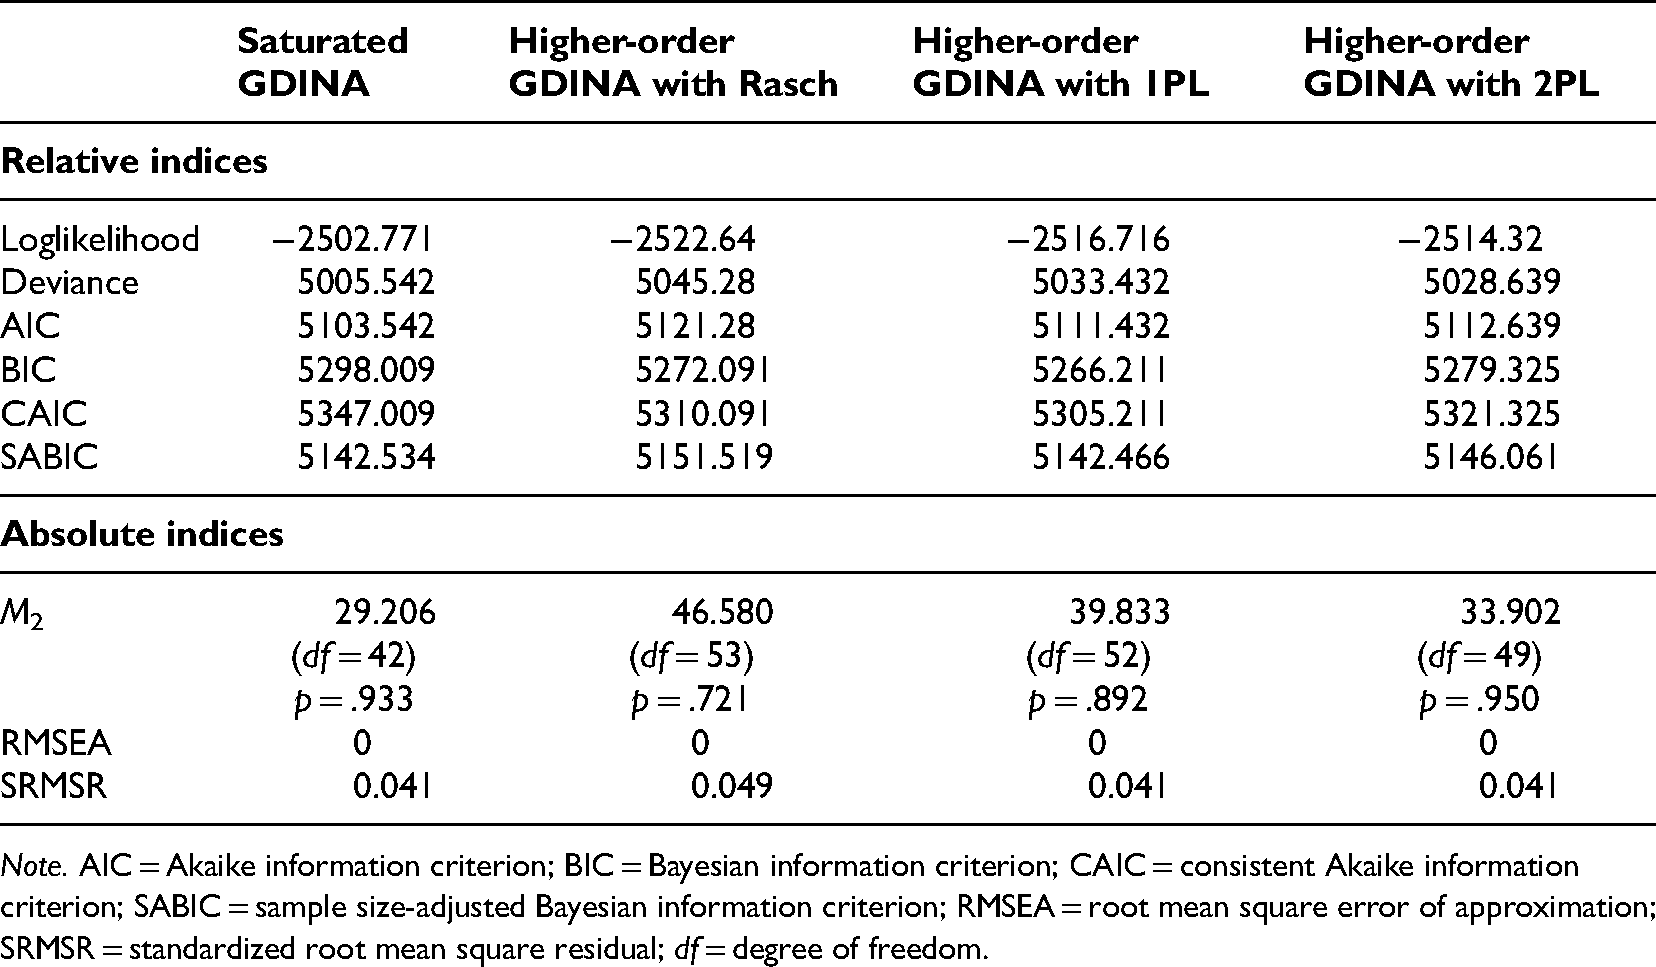
Relative and absolute fit indices for the four models.
Note. AIC = Akaike information criterion; BIC = Bayesian information criterion; CAIC = consistent Akaike information criterion; SABIC = sample size-adjusted Bayesian information criterion; RMSEA = root mean square error of approximation; SRMSR = standardized root mean square residual; df = degree of freedom.
The saturated GDINA model had the smallest loglikelihood (−2502.771), the lowest deviance (5005.542) and AIC (5103.542). However, Chen et al. (2017) found that BIC, CAIC, and SABIC were more suitable when the model was not specified. Information criteria have been found to be more useful than loglikelihood and deviance (Anderson et al., 1998; Dziak et al., 2020). We found that the higher-order GDINA model with 1PL had the smallest BIC (5266.211), CAIC (5305.211), and SABIC (5142.466) among the four models, indicating that it had the best model fit.
The absolute fit indices also showed that the higher-order GDINA model with 1PL had a good fit. The M2 statistic indicated that the higher-order GDINA model with 1PL was suitable in this setting (M2 = 39.833, df = 52, p = .892). The zero value of RMSEA for the higher-order GDINA model with 1PL indicated the excellent fit of this model. For SRMSR, the higher-order GDINA model with 1PL had a good fit (SRMSR = 0.041 < 0.05).
Together, the relative and absolute fit indices showed that the higher-order GDINA model with 1PL best fit the data.
The initial Q matrix was constructed according to the judgments of the domain experts and thus was subjective. Researchers have proposed multiple methods for partially reducing this subjectivity in Q matrix validation (de la Torre, 2008; de la Torre & Chiu, 2016; Ma & de la Torre, 2020a). Ma and de la Torre (2020a) suggested that a stepwise approach combining the proportion of variance accounted for (PVAF) and the Wald test is suitable when the fixed number of attributes is relatively small, as in this empirical study (n = 4). We used the higher-order GDINA model with 1PL to validate the Q matrix and the results suggested that two elements in the initial Q matrix should be modified. Specifically, the results suggested that Items 1 and 3 might not examine B1.
A. −e B. e C. −1 D. 1
A.
These two suggestions about the modifications of two elements in the initial Q matrix were firstly carried out by stepwise statistical methods combing PVAF and the Wald test, and then whether to accept the adoptions was discussed by domain experts (Ma & de la Torre, 2020b). Following consultation, the domain experts accepted the two suggested modifications. That is, they agreed that attribute B1 was not examined in Items 1 and 3. These changes were made to the final Q matrix (See Table 5).
Final Q matrix (modified elements only).
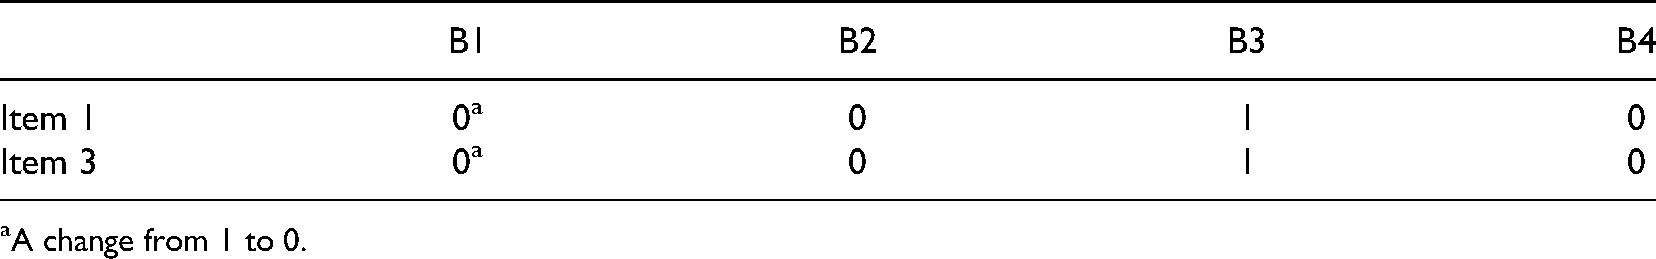
Final Q matrix (modified elements only).
A change from 1 to 0.
To answer RQ2, our analysis of the final Q matrix based on the higher-order GDINA model with 1PL reported four outputs of diagnostic information: (1) attribute prevalence; (2) latent class and posterior probability percentage; (3) item parameter estimates; and (4) individual skill profiles.
Figure 1 summarizes the prevalence of the four attributes. The prevalence of a specific attribute is the probability that students have mastered that attribute regardless of their performance on other attributes. Technically, it is the sum of the probabilities of the latent classes that have mastered that attribute. For example, the attribute prevalence of B1 is the sum of the posterior probabilities of latent classes 1111, 1110, 1100, 1010, 1011, 1101, 1000, and 1001. Overall, more than three-quarters of the students had mastered attributes B1 (77.3%, n = 302), B2 (77.0%, n = 301), and B3 (81.9%, n = 320). In contrast, less than half of the students succeeded in mastering attribute B4 (38.6%, n = 151).
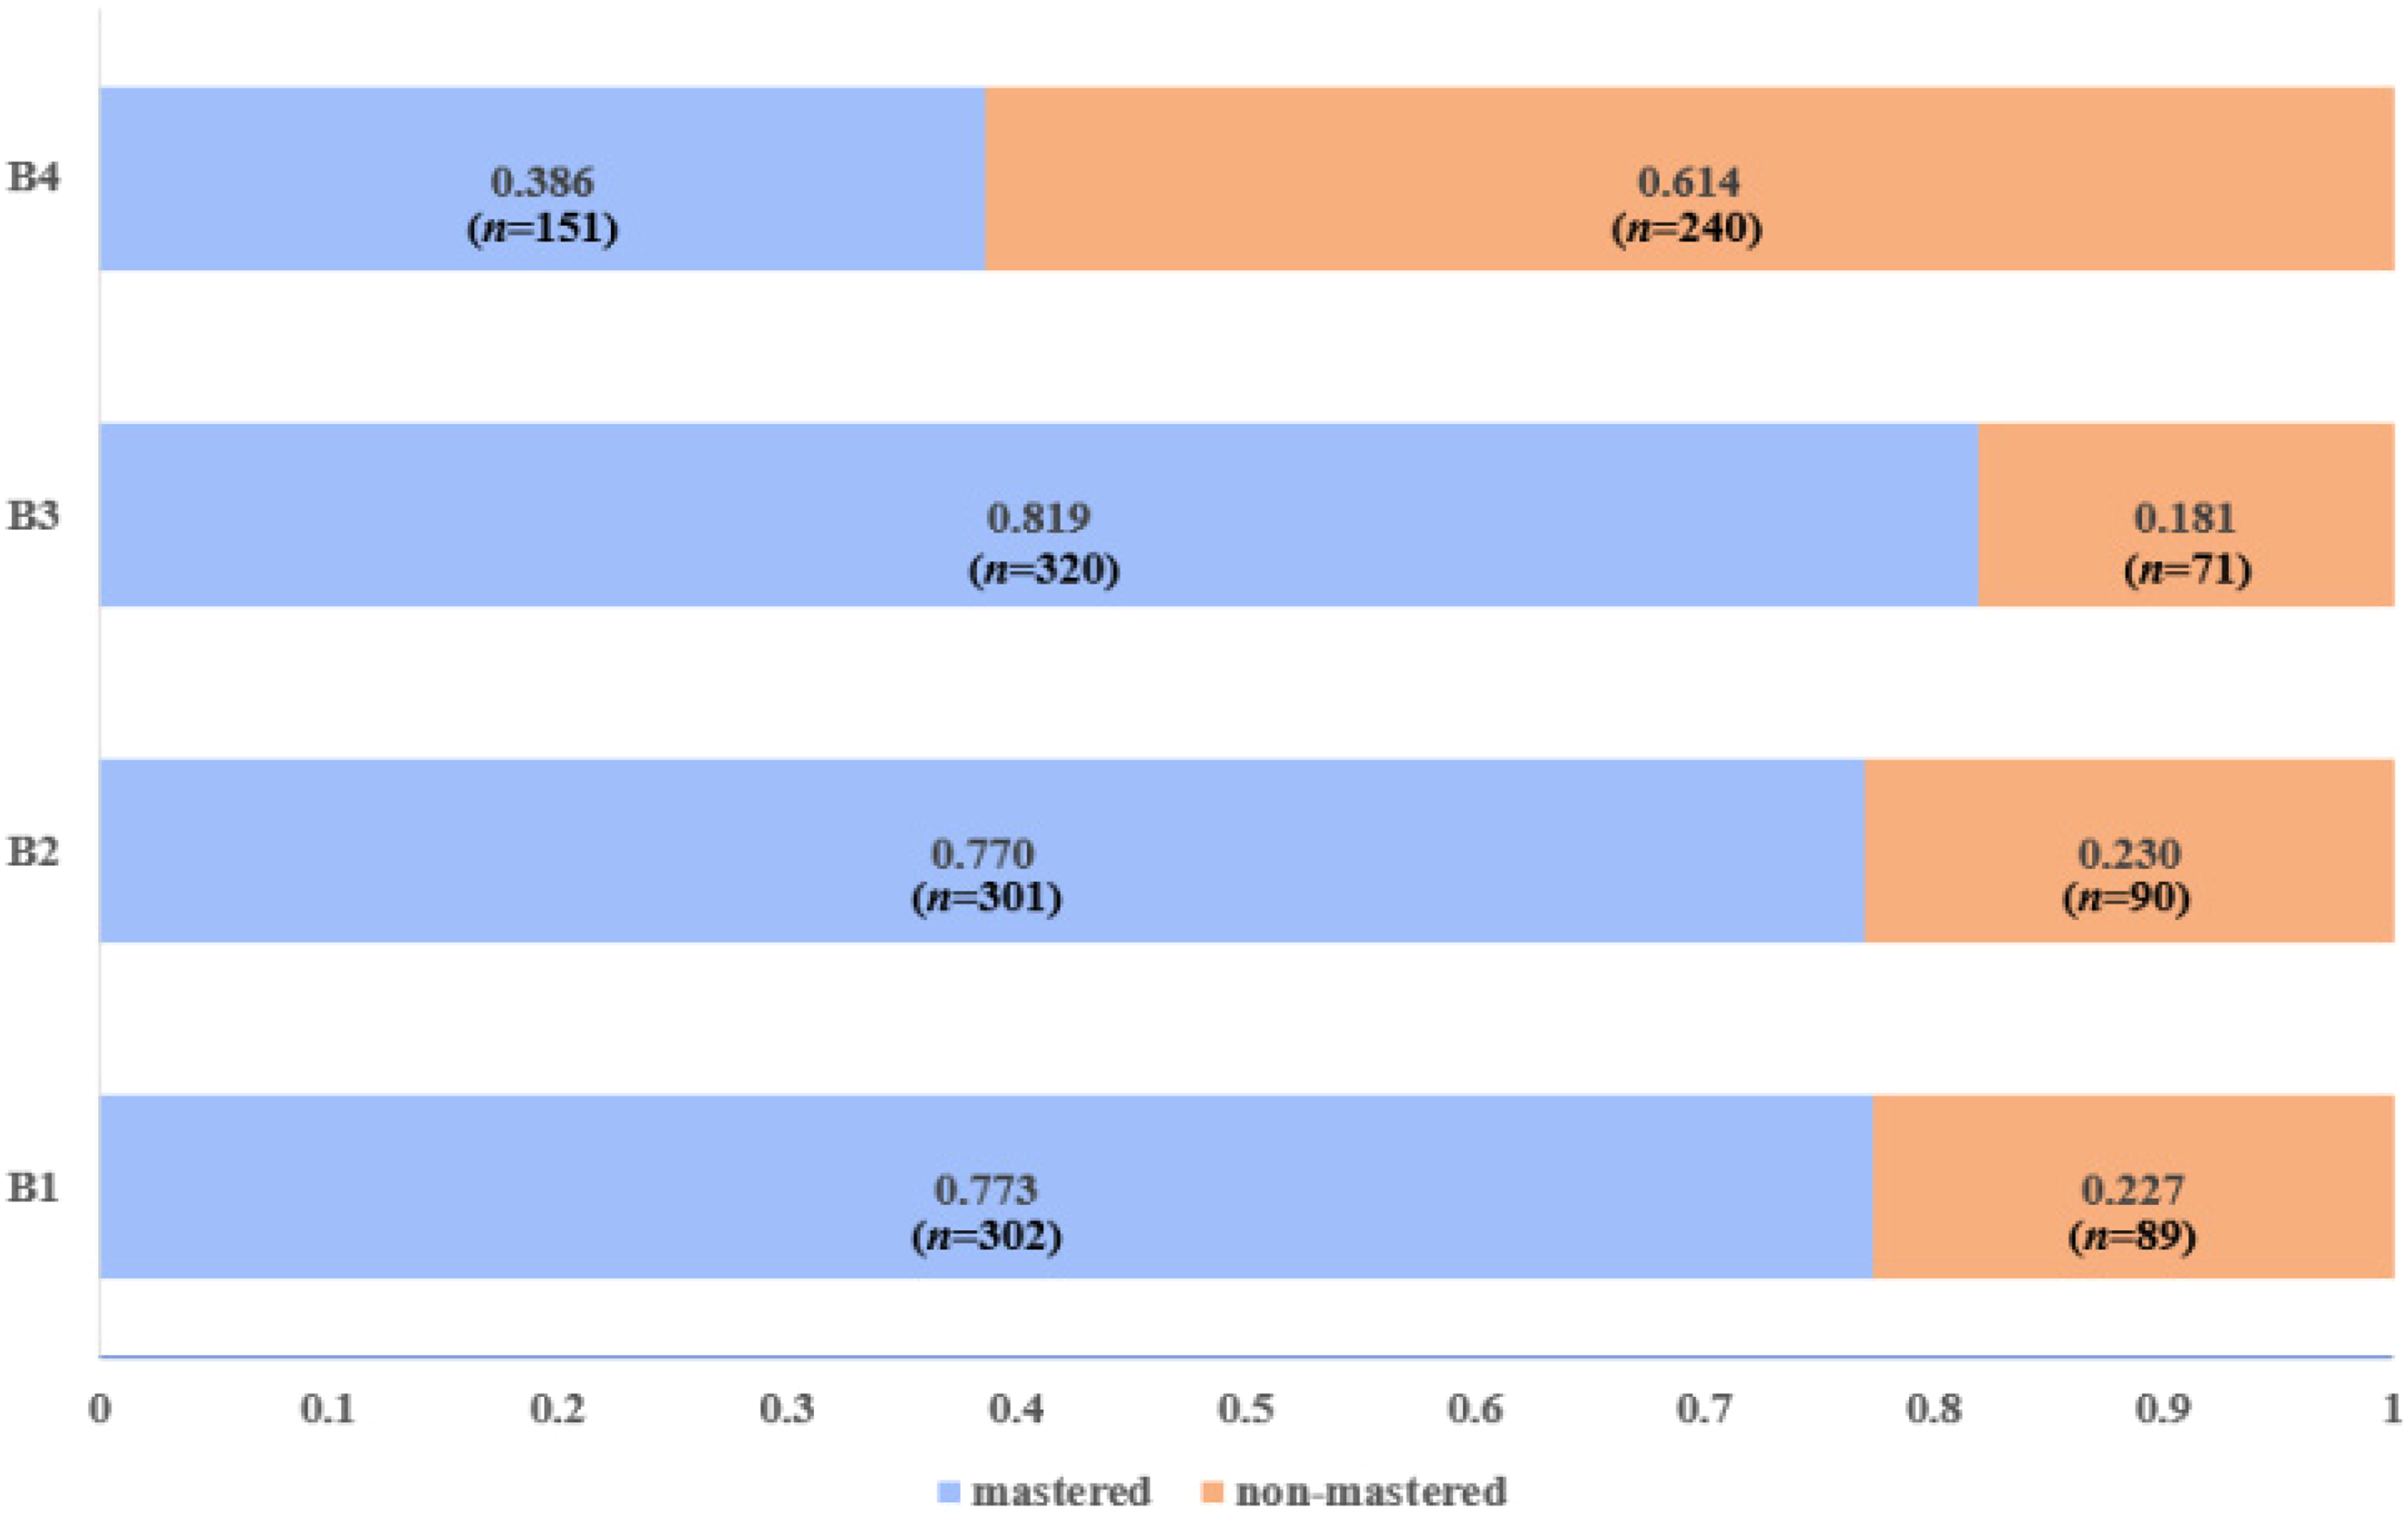
Prevalence of attributes B1 to B4.
To assess the latent class and posterior probabilities, the performance of each student in each of the four attributes was classified as either mastery or non-mastery, resulting in 16 latent classes. All the latent classes are depicted in descending order of posterior probability in Figure 2. More than half of the students (62.18%) were classified into the two dominant latent classes 1111 and 1110. More specifically, the 1111 latent class (mastered B1, B2, B3, B4) had the largest posterior probability percentage (34.50%), indicating that most participants had mastered all four attributes. The latent class 1110 (mastered B1, B2, B3) had the second largest proportion (27.68%).
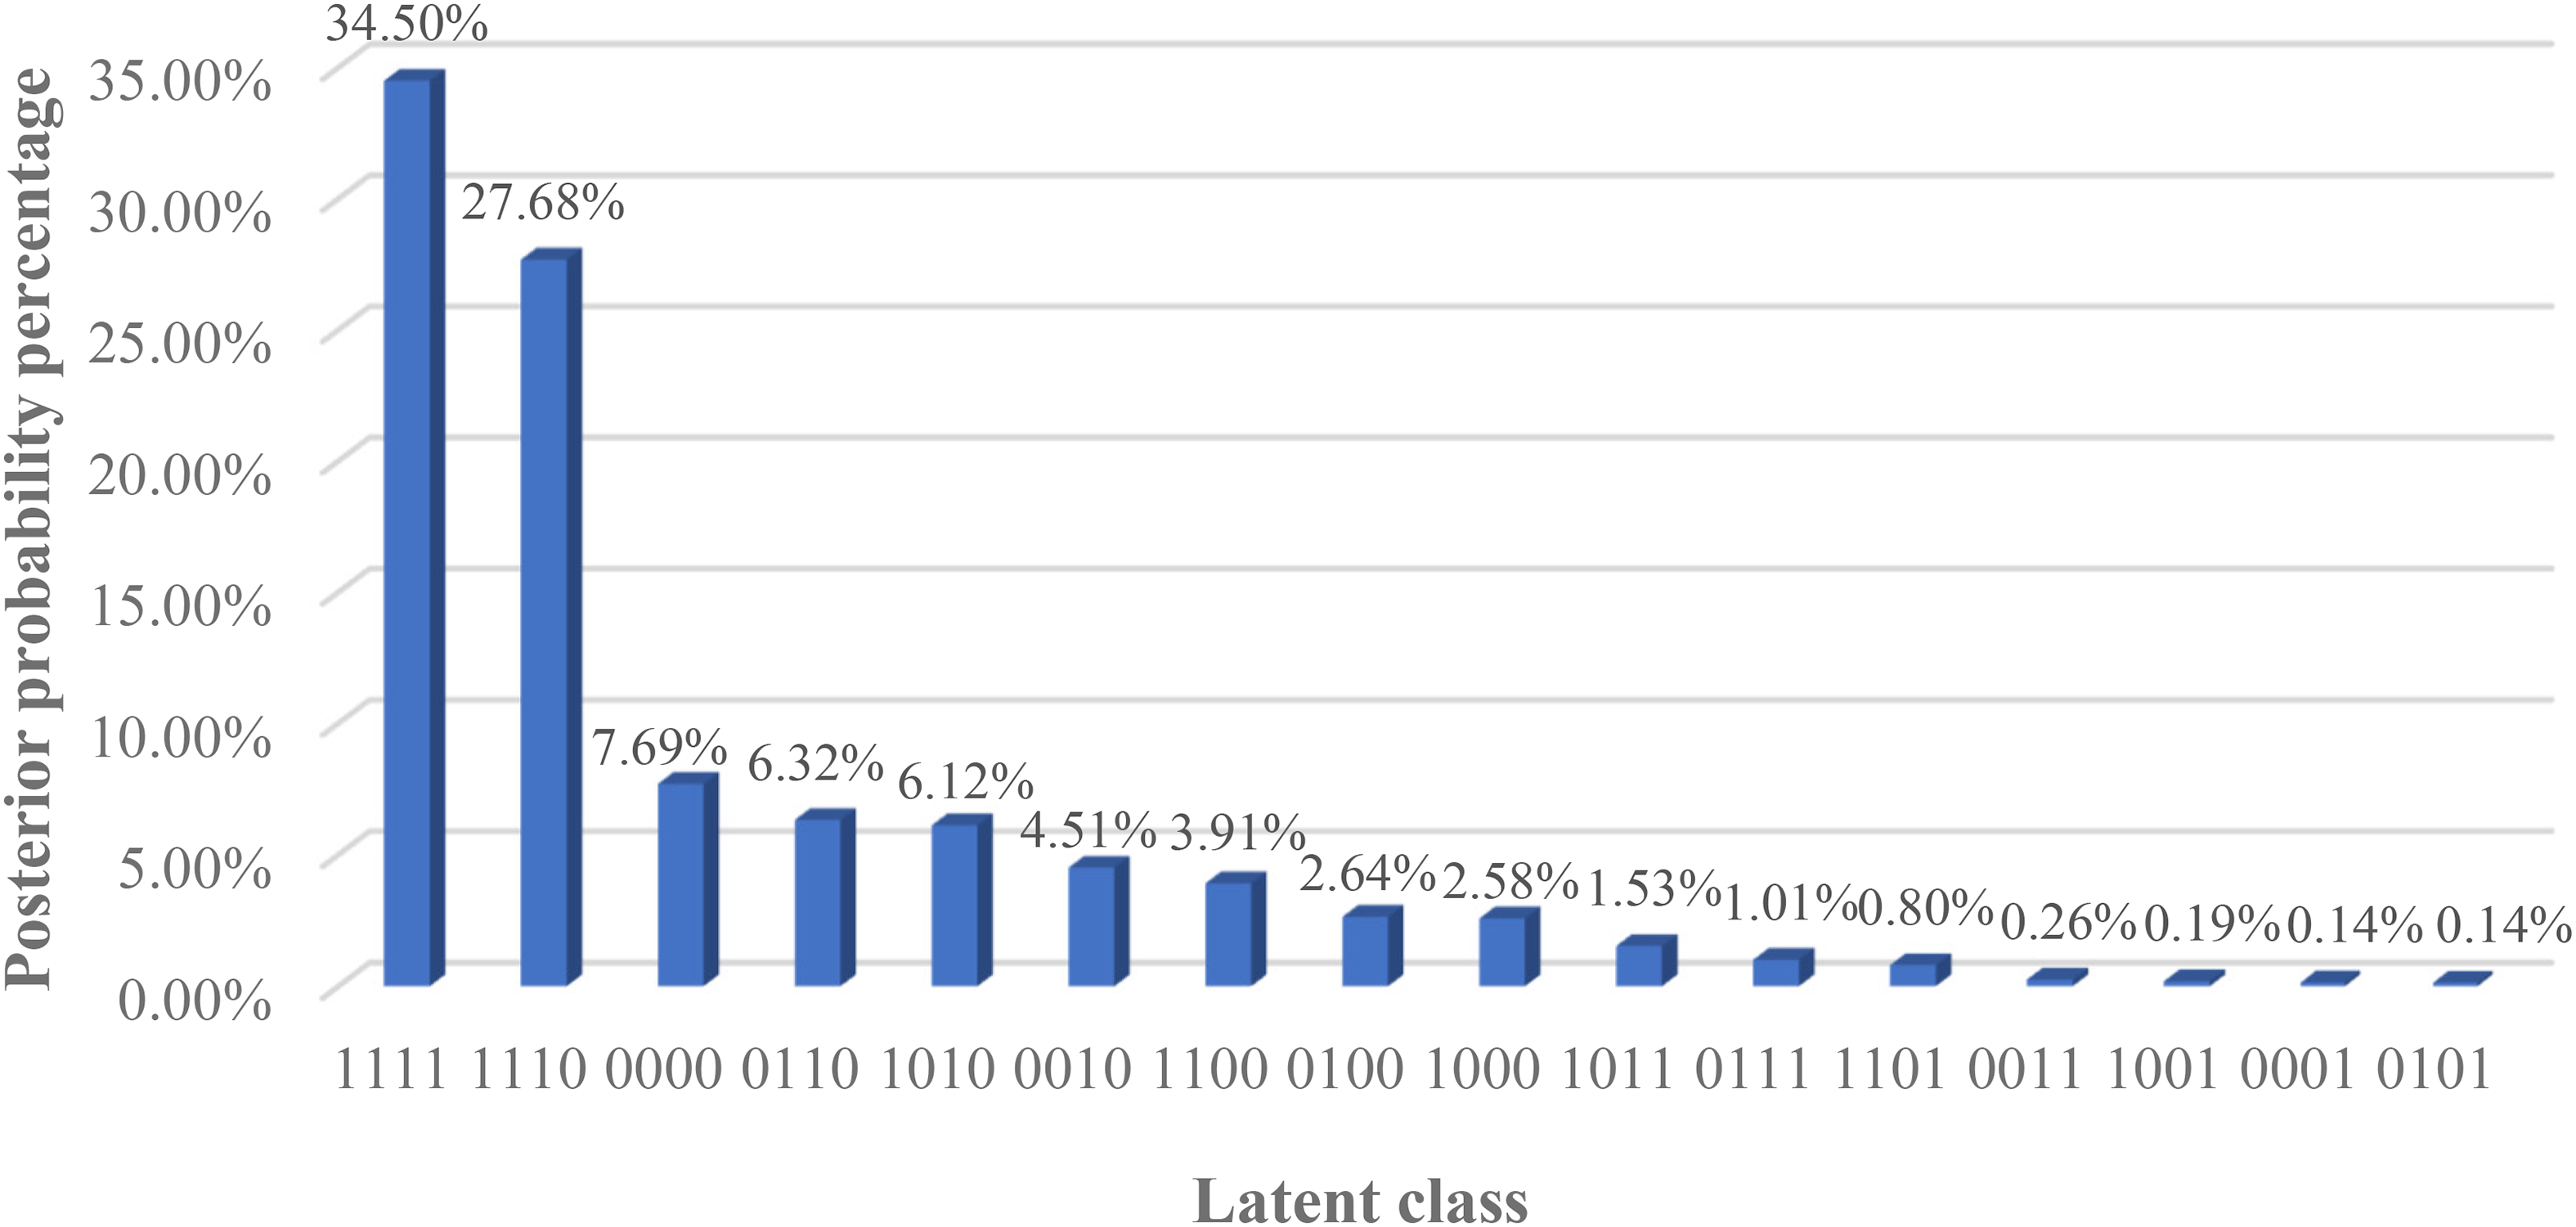
Latent class and posterior probability percentage.
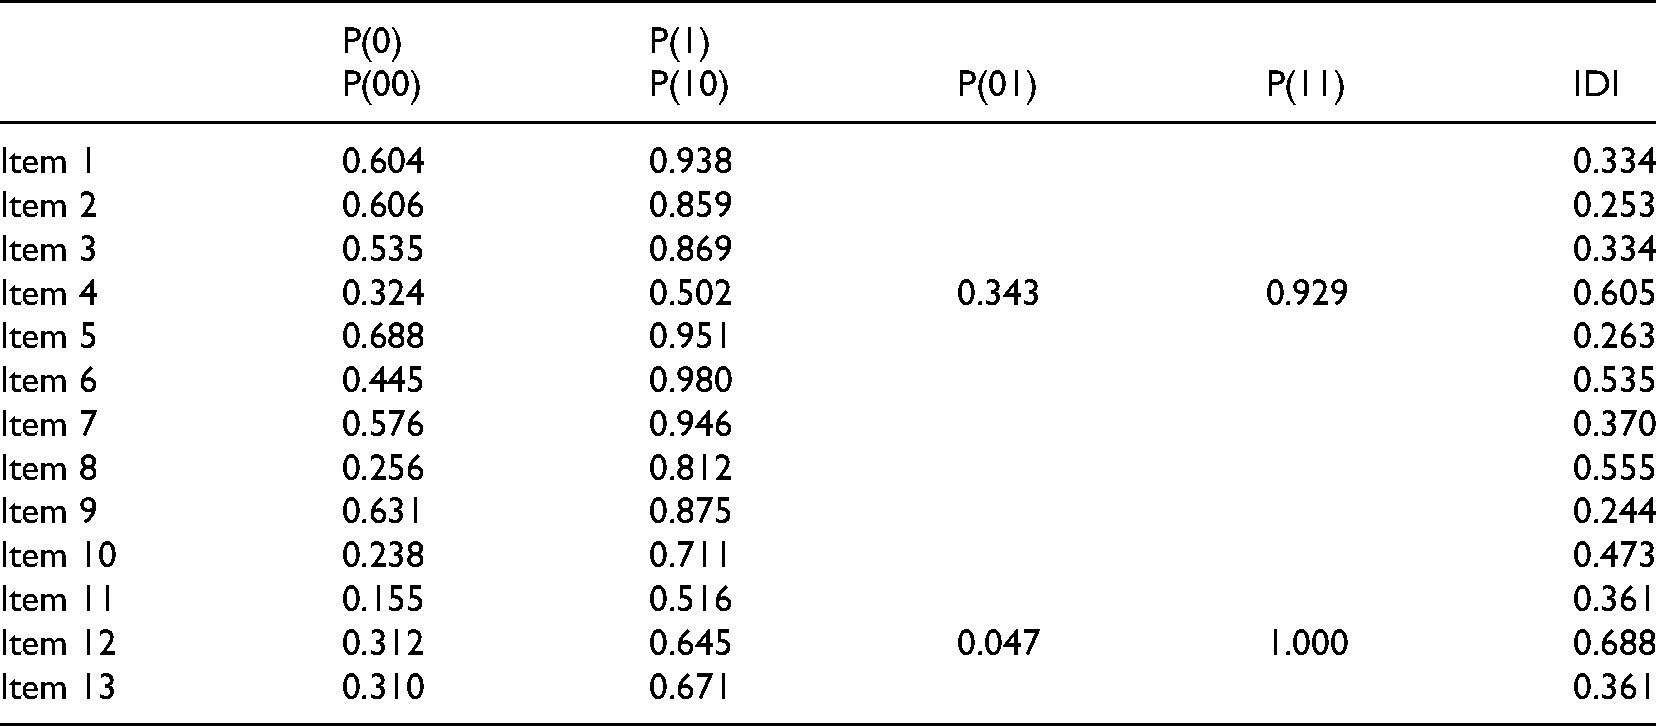
The item parameter estimates, which were used to measure the quality of the test, are shown in Table 6. Eleven of the items (1, 2, 3, 5, 6, 7, 8, 9, 10, 11, and 13) tested one attribute, and two items (4 and 12) tested two attributes. Moreover, item discrimination has been commonly used to measure the quality of the items and thus the test (Lee et al., 2012; Wang et al., 2018). For the single-attribute items, P(1) and P(0) represent the probabilities of correctly answering items that do or do not test the focal single attribute. For the double-attribute items, P(11) and P(00) represent the probabilities of correctly answering items that do or do not test both attributes, and P(10) and P(01) represent mastery of only the first or only the second attribute. In CDMs, referred to Wu et al.'s (2020) definition, the item discrimination index (IDI) for item j with a single attribute is defined as
Item parameter estimates.

Similarly, the IDI for double-attribute item j is denoted as

Doust et al. (2021) defined 0.2 as the cut-off index value to discriminate capabilities and 0.4 as the ideal value. The IDIs of all 13 items were larger than 0.2, indicating that they could discriminate students’ abilities; five items (4, 6, 8, 10, 12) had ideal IDI values of more than 0.4.
Table 7 and Figure 3 show the individual skill profiles of four representative students, S1 to S4. The four selected students represented three different levels of achievement: high (S1), medium (S2 and S3), and low (S4). Studies have used three measures to estimate individual skill profiles: maximum likelihood estimation (MLE), maximum a posteriori (MAP), and expected a posteriori (EAP) (George et al., 2016; Huebner & Wang, 2011; Ma & de la Torre, 2020b). Huebner and Wang (2011) asserted that EAP is preferred for practical and empirical studies, and George et al. (2016) demonstrated that 0.5 is a suitable EAP cut-off value to distinguish mastery from non-mastery.
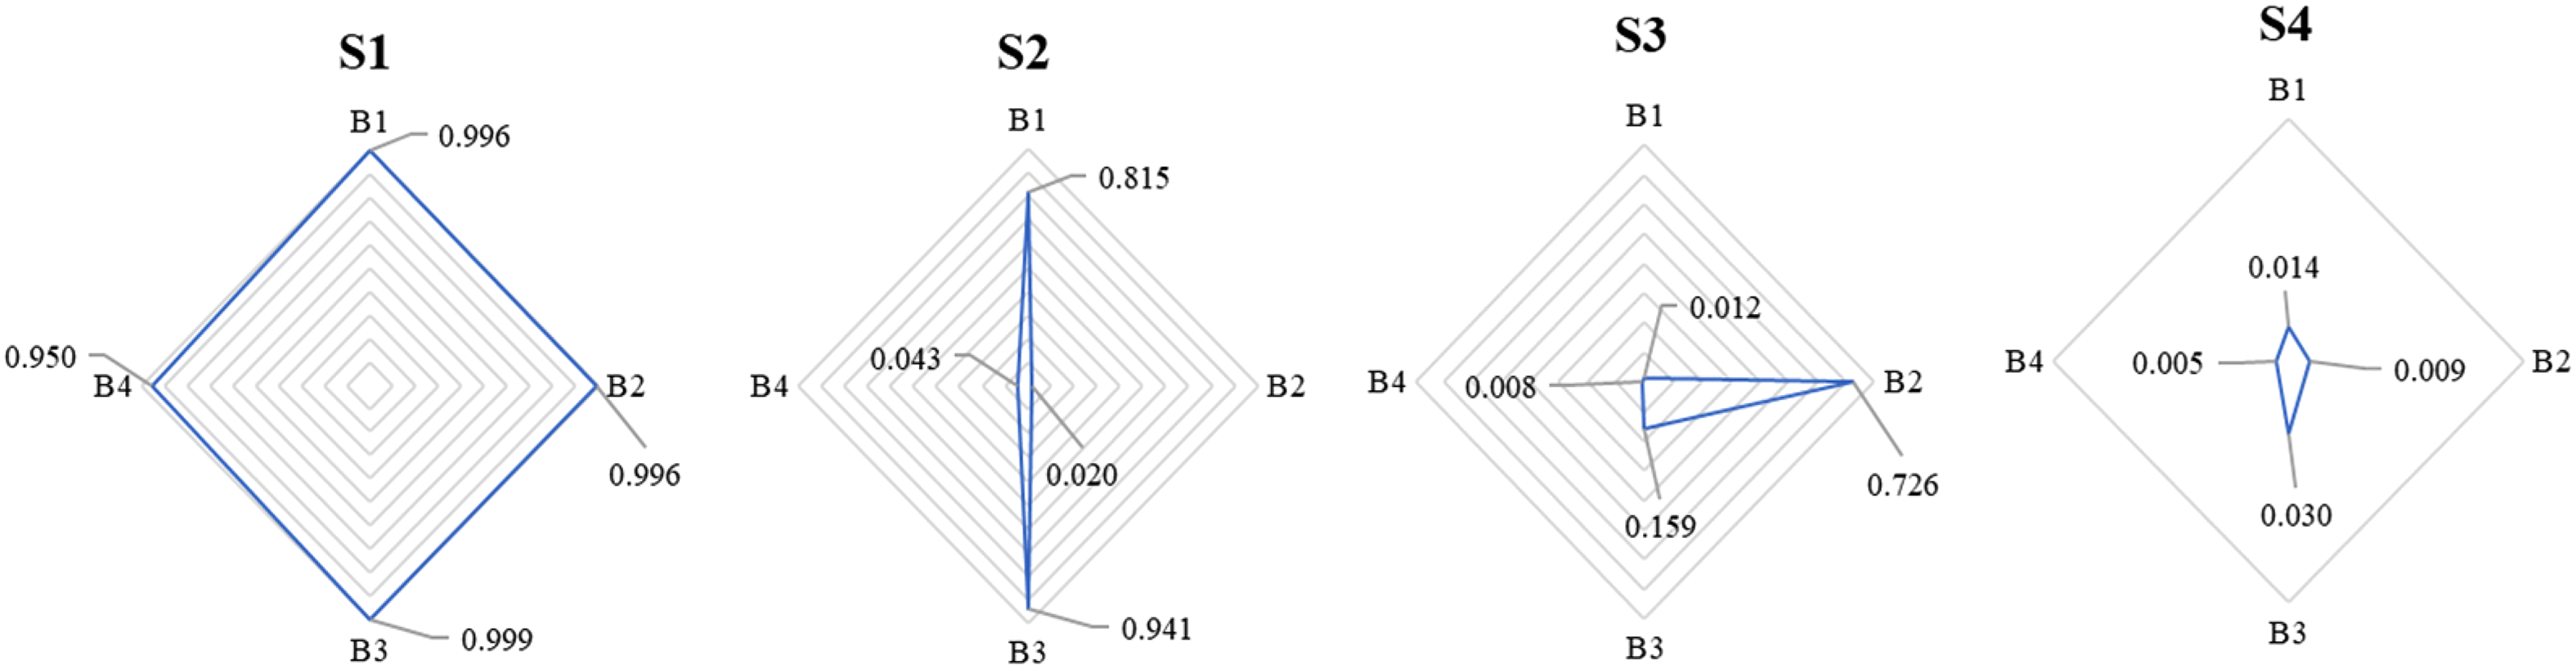
Individual skill profiles of four representative examinees.
Individual skill profiles of four representative examinees.
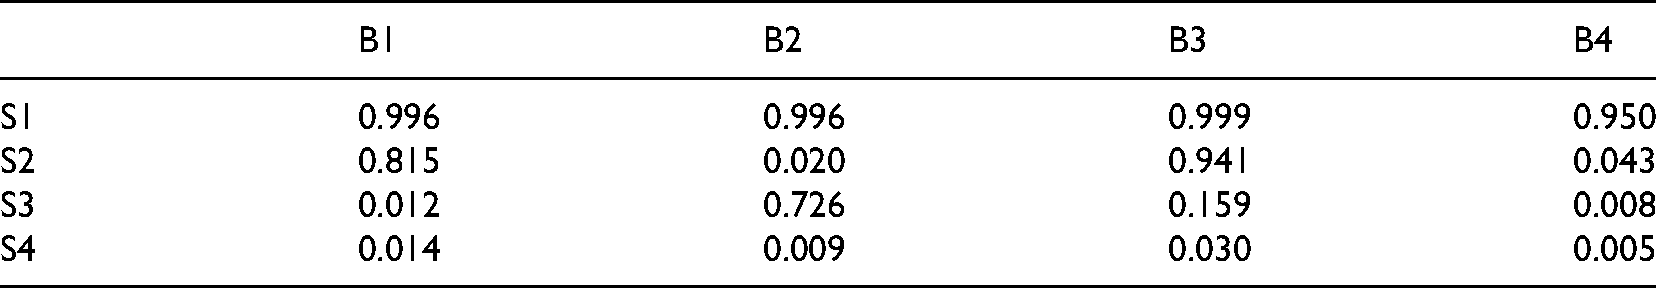
Thus, this study adopted the EAP method to estimate mastery probability. Of the four selected students, S1 mastered all four attributes, with mastery probability values all greater than or equal to 0.950. In B1 and B3, S2 had mastery probabilities of 0.815 and 0.941, but in B2 and B4 they were only 0.020 and 0.043. S3 did well only in B2 with a probability of 0.726 (B1: 0.012; B3: 0.159; B4: 0.008). S4 did not master any of the four attributes and had mastery probabilities less than or equal to 0.030.
This empirical study used a sample of 391 Grade 11 students from a secondary school in China. The study examined the use of higher-order CDMs in the Q matrix validation process when there are intricate interrelationships among attributes. Then, this study analyzed students’ diagnostic information at both the grade and individual levels.
The results show that the mathematical literacy frameworks used in Chinese secondary mathematics (Chinese Standards 2017) align with the international PISA 2003 and 2012 frameworks for teaching and assessing the “univariate function and its derivative” module. The content in this module is of significance for secondary students, marking the starting point for acquisition of higher mathematical thinking skills in calculus (Zulnaidi & Zamri, 2017). As the study relies on the judgments of domain experts, these results need to be interpreted with caution and carefully applied to other modules. However, the results suggest that our approach is a promising alternative to CDMs based on international large-scale assessments. This finding is consistent with the literature (Chen & Chen, 2016; Evran, 2019; Wu et al., 2020). The study also sheds light on mathematical teaching contexts in Chinese secondary settings. It extends the research on mathematical literacy for kindergarteners and primary school students (Li et al., 2020; Yamaguchi & Okada, 2018).
All 13 items in the assessment implemented in this study test students’ mastery of four attributes, which are related to each other in complex ways. Our analysis suggests that the higher-order GDINA model with joint attribute distribution of 1PL is more suitable when there are uncertain relationships among attributes (de la Torre & Douglas, 2004; Ma & de la Torre, 2020b). We also find that the stepwise PVAF modification process developed by Ma and de la Torre (2020b) increases the objectivity of the final Q matrix. The finding that higher-order CDMs are suitable for the Q matrix validation process broadly supports other studies in this area such as Ma and de la Torre (2020a) and de la Torre and Chiu (2016).
The study also shows that the higher-order GDINA model with joint attribute distribution of 1PL provides diagnostic information about the strengths and weaknesses of the students at both the grade and individual levels (Leighton & Gierl, 2007; Maghsudi et al., 2021; Waldeck, 2006). It has four major outputs: attribute prevalence, latent class and posterior probability percentage, individual skill profiles, and item parameter estimates.
Two of the four main outputs, attribute prevalence and latent class and posterior probability percentage, provide diagnostic information at the grade level. In this study, the participants at the grade level had mastery of attributes B1, B2, and B3, as shown by the attribute prevalence values (B1: 77.3%, B2: 77.0%, B3: 81.9%). In contrast, the attribute prevalence of B4 was unsatisfactory (B4: 38.6%), with the majority of the participants failing to understand and internalize the complex transformation of derivatives. The latent class and posterior probability percentages provided more in-depth information. Two latent classes 1111 (mastered B1, B2, B3, B4) and 1110 (mastered B1, B2, B3) dominate the whole proportion and these results are partially consistent with grade-level analysis, suggesting that most participants did not have mastery of B4. And it is likely that mastery of the first three attributes may contribute to the mastery of the fourth attribute B4. Clearly, the diagnostic information provides detailed remedial teaching and guidance for teachers and students (Leighton & Gierl, 2007; Templin & Henson, 2010), allowing instructors to quickly recognize the target population's knowledge status and to make appropriate instructional adjustments, i.e., teachers of this study's participants could enhance students’ comprehension of B4-related learning materials.
The individual skill profiles provide information on individuals’ cognitive structures. This study examined the cognitive structures of four students with different levels of mastery. S1 had mastered all four attributes, so the instructor could provide more advanced learning materials to encourage self-improvement. For S2 (strengths in B1 and B3 but weaknesses in B2 and B4) and S3 (strengths in B2 but weaknesses in B1, B3, and B4), who had a mixture of strengths and weaknesses, and S4 (weaknesses in all attributes), who had unsatisfactory performance, the instructor might have considered implementing collaborative learning strategies focused on remedial work on the attribute B4, which all three students had failed to master. The instructor could also provide personalized instructions that address specific gaps, such as B2-related instruction for S2, and B1-related instruction for S3. In sum, instructors could devise strategies based on the students’ skill profiles and diagnostic information. Together with information about the grade level, these CDMs contribute to the development of personalized assessments, which are crucial to personalized education (Sadovaya et al., 2016; Tetzlaff et al., 2021; Waldeck, 2006; West, 2011).
In general, assessing the mathematical skills of secondary school students is complicated, and this study offers the novel approach of the higher-order GDINA model. Of course, this study has certain limitations.
Test quality is an important condition. Items that have a high guessing rate, namely P(0) for single-attribute items and P(00) for double-attribute items (See Table 6), may impact the cognitive diagnosis even if the item discrimination index value is high (de la Torre et al., 2010). Test quality could be tested and verified using item parameter estimates. In this study, there are six items with relatively high guessing rates i.e., P(0) and P(00) are larger than 0.5 (See Table 6). de la Torre et al. (2010) asserted that this may occur when there is great dependence on the attributes. Thus, future studies should create more items and only use the low guessing rate items in the CDMs. Another issue is the integration of Q matrix validation. The method adopted in this study is consistent with current research (de la Torre & Chiu, 2016; Ma & de la Torre, 2020a) and is based on the assumption that there is a fixed number of attributes, four in this case. Future studies could examine the validation of the number of attributes. Finally, this study examined only one test, which was administered after the derivative module was completed. The effects of personalized assessment for remedy or promotion are unclear and should be considered in future studies. In addition, the students were recruited only from one city in China. The generality can be promoted in future studies by collecting more data from a variety of schools in other cities.
In summary, despite the limitations, this study has several noteworthy theoretical and practical implications. Theoretically, this study contributes to the growing body of literature suggesting that higher-order GDINA models are applicable when confronting the complex structures of attributes, particularly in secondary mathematics. Our study also underpins the consistency of international large-scale assessments like PISA and the national Chinese mathematical curriculum standards in Q matrix construction process. This adds values to a more comprehensive understanding of curriculum schemes from both local and global perspectives. Meanwhile, the issue of subjectivity may exist when domain content experts construct the Q matrix. Our study provides a feasible approach to address this issue by implementing the Q matrix validation process. Practically, the diagnostic information in the findings of our study is valuable for personalized assessment. For one thing, teachers can evaluate test quality by checking item parameter estimates, and design targeted instructional strategies at grade level referring to attribute prevalence and latent class percentages. For another, remedial programs and instructions can also be carried out in accordance with the feedback on individual skill profiles.
Footnotes
Acknowledgements
We are sincerely grateful to reviewers and editorial team for comments that substantially improved the article. We appreciate Dr. Lei Wang (National Engineering Research Center for E-Learning, NERCEL, Central China Normal University) and Ms. Yan Chen (Luoyang No. 2 Middle School, China) for provision of original test paper and students’ response data in this study. And we also appreciate the suggestions provided by Dr. Yuyao Tong, Mr. Yang Tao, Mr. Pengjin Wang, Mr. Chao Yang, and Mr. Wei Jia (Faculty of Education, The University of Hong Kong).
Data availability statement
The data that support the findings of this study are available from the corresponding author upon reasonable request.
Contributorship
Ying Zhang initiated the project, conducted the research, and drafted the manuscript. Yi Jin wrote the statistical analysis plan, analyzed the data, and conducted the Q Matrix Validation part. Zhenrong Xiong collected the data and completed the theoretical framework of CDMs. Bo Li, Gaowei Chen, Shing On Leung, and Na Li supervised the study, provided important ideas for the research, and revised the draft. All authors read and approved the final manuscript.
Declaration of Conflicting Interests
The author(s) declared no potential conflicts of interest with respect to the research, authorship, and/or publication of this article.
Funding
The author(s) disclosed receipt of the following financial support for the research, authorship, and/or publication of this article: This work was supported by the Hong Kong Research Grants Council, University Grants Committee, self-determined research funds of CCNU from the colleges’ basic research and operation from the Ministry of Education, China, National Natural Science Foundation of China (grant number 17605221, CCNU19TD006, 61877023).