
Abstract
US health systems are required to conduct community health needs assessments (CHNAs). These assessments often rely solely on publicly reported disease prevalence data. The objective of this study was to identify a feasible qualitative method that can be implemented into CHNAs to confirm existing information and enhance them with new data and community narrative. Freelisting interviews were conducted in 2017 throughout a county in Pennsylvania. Individuals listed (1) things that improve health, (2) health problems, and (3) health barriers. Responses were grouped into like terms, Smith’s salience index was calculated for each, subgroup variation was assessed. Community-reported health priorities were identified by salient terms juxtaposed with publicly reported disease prevalence data. 98 respondents throughout the county participated in freelisting interviews. Demographics resembled the population: median age 55, 46% female, 88% Caucasian, 9% uninsured. Salient terms that improve health included: “physical activity”, “healthy eating”, and “health services”. Salient terms describing health problems included: “cardiovascular disease” and “spine and joint disease”. Centers for Disease Control and Prevention (CDC)-reported chronic disease prevalence in the county included heart disease mortality (22% of deaths) and arthritis (26% of adults). Salient barriers to health included: “weight, physical activity, and dietary concerns”, as well as “occupational concerns”. This is in line with 2017 County Health Rankings related to obesity (reported 29%), however, while 10% were uninsured in the community, this was not a salient term. Freelisting can augment and inform CHNAs. In this single-county study, freelisting responses supported publicly available disease/mortality prevalence data and provided insight into community perceptions of health issues.
Keywords
Background
Community health needs assessments (CHNA) are required and necessary to inform strategic planning of health services at non-profit hospitals and community health centers. 1 Since the Affordable Care Act mandated CHNAs in 2010, these systems have produced reports that vary in their ability to inform community health practice. 2 According to the Centers for Disease Control and Prevention (CDC) (2016) many CHNAs rely on primary and secondary data and may include data from surveys, focus groups, and interviews which shed light on the community’s perceptions of what impacts health and disease. However, these approaches have some limitations and can be very time consuming. Our study was conducted to help address this challenge by utilizing freelisting, an accessible and efficient data collection approach that allows researchers to quickly assess community perceptions and priorities.
Freelisting is an anthropological technique in which participants list items in response to questions.3–8 Previous studies have utilized this method to prioritize service quality dimensions, 9 identify barriers to self-efficacy, 10 and allocate for mental health services, 11 in resource-limited settings. Community health centers with limited research capacity can feasibly obtain valuable qualitative data using freelisting, which can complement publicly-reported disease prevalence or mortality data and inform planning and the approach, unlike traditional interviews or surveys, allows researchers to appreciate salient issues for subgroups of people in a sample. Freelisting interviews also involve a lower response burden than most surveys because they can be conducted verbally, without requiring reading or writing, and they allow respondents to list things that come to mind without restriction. In communities with low literacy and low levels of education, this interview technique can be particularly valuable.12,13
Like many community health centers in the United States, the investigators of this study faced challenges when assessing the needs of the community. Publicly-reported disease prevalence and mortality data were available. However, the health priorities of community residents were not well represented prior to this study. In order to be effective, plans for disease prevention and control need to be tailored to the priorities of individuals in a community.14,15
Purpose
Therefore, the objective of this study was to examine whether freelisting can augment existing CHNA practices by more fully describing community needs, investigating community health beliefs, informing follow-up surveys or qualitative studies, and supporting local health planning.
Methods
Study Population & Settings
Adults were recruited to participate in freelisting interviews in rural and urban areas across a single county in Pennsylvania. Community residents were eligible for participation if they were at least 18 years of age or older and resided within the county. An intercept interview approach, 7 was employed in which participants were approached and recruited on the spot from public places including shopping centers, town squares, public housing units, and health centers. Participants provided informed consent to be interviewed in accordance with a research protocol that was approved by the xxxx Institutional Review Board.
Study Design
A group of seven interviewers were trained by the research team to conduct freelisting interviews. The interviewers included local county residents, community volunteers, academic faculty and research staff who responded to an email call for volunteers or heard about the opportunity from a research team member. Structured interviews were conducted using the freelisting method.3–8,16,17 Interviewers instructed participants to list all the words that came to mind in response to the prompt, stating as many words or phrases that they could offer in response, with no limit on the number or type of words. The interview prompt involved asking participants to do the following: • List the things that improve your health. • List the health problems that affect you. • List the things that make it hard for you to stay healthy.
Following the freelisting prompts, respondents were asked to answer a set of demographic questions regarding zip code, year of birth, health insurance status, race, and gender (Supplement 1). Interviews lasted 5–10 minutes. The interviewer documented participant responses in the order in which they were stated, and research staff subsequently entered the responses into a database.
Analysis
Descriptive statistics were calculated to for the age, gender, race, insurance status, and geographic region of participants. These descriptive statistics were then compared to relevant publicly reported data (US Census Bureau Quick Facts; US Census Bureau SAHIE Program). Freelisting responses were analyzed through a process of grouping synonymous terms. The final set of grouped terms were mutually exclusive.
The identification of synonyms and grouping of terms was conducted by a single investigator, and, subsequently, at least two co-investigators adjudicated the grouping assignments. Disagreements were resolved by team discussion and consensus decisions.
After terms were finalized and groupings completed, the most salient terms were identified using Smith’s salience index.
17
The salience index, or score, is a function of the frequency with which respondents list a term and the order in which it is listed, such that the salience index can be calculated as follows:
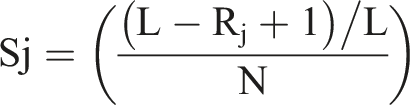
After a salience index was calculated for each term, the terms in each of the three lists were sorted from highest to lowest salience index then plotted on a graph with salience on the y-axis and terms on the x-axis (each represented by a point). Terms were determined to be salient if their scores fell above the “elbow” on the curve on, that is the point where data leveled off and the curve began to flatten, as previously described.7,16,18,19 The number of salient terms varied for each list due to differences in the distribution of salience scores. Stratified analyses were then completed, using the same methods, for men versus women, and adults ages 18 to 64 versus adults ages 65 and older. These analyses were completed using Anthropac 1.0 Freelists and R version 3.4.2. Salient community-reported health information was then compared to publicly reported vital statistics on disease prevalence, mortality and health behaviors.20–23
Results
Demographics.
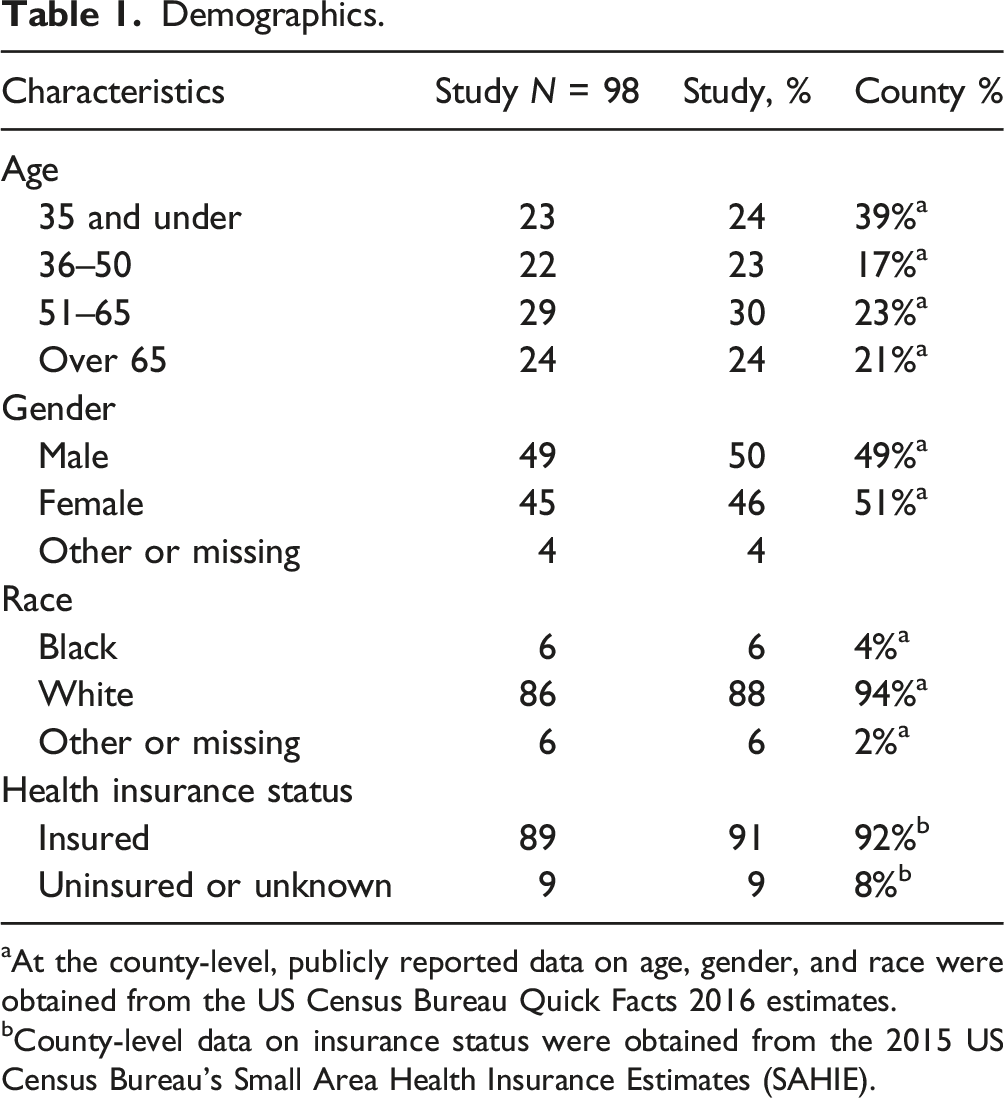
aAt the county-level, publicly reported data on age, gender, and race were obtained from the US Census Bureau Quick Facts 2016 estimates.
bCounty-level data on insurance status were obtained from the 2015 US Census Bureau’s Small Area Health Insurance Estimates (SAHIE).
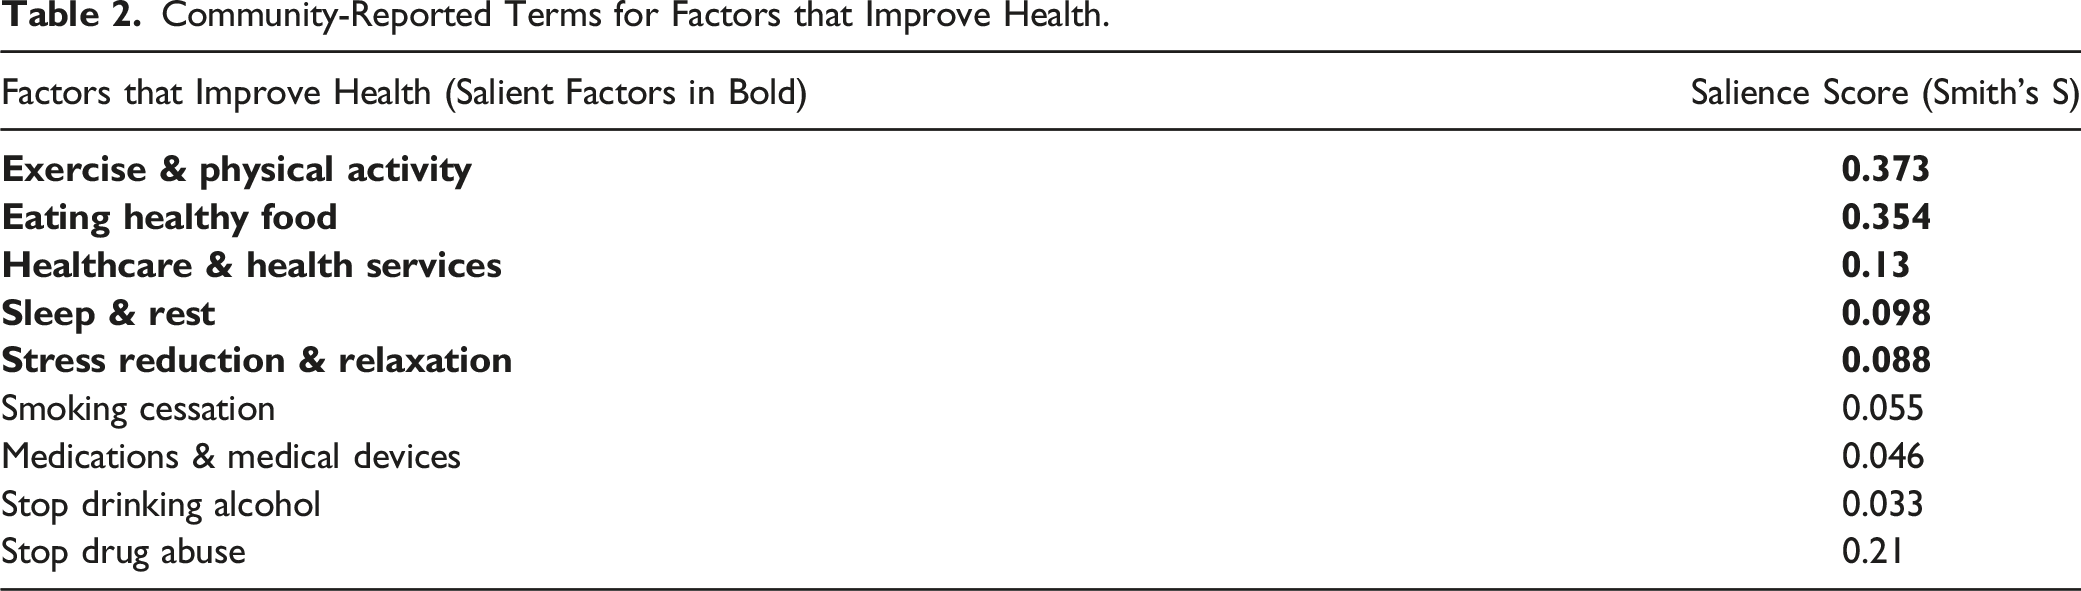
Responses to the prompt “List the things that improve your health” included 127 unique terms, which investigators grouped into 11 terms. In response to interviewers’ request to “List the health problems that affect you”, participants shared 78 unique terms that were grouped into 13 terms. Finally, responses to the request to “List the things that make it hard for you to stay healthy” included 149 unique terms, which were grouped into 11 terms. Supplement 2: Grouped Terms illustrates the identification of synonymous terms.
Community-Reported Terms for Factors that Improve Health.
Community-Reported Health Problems.
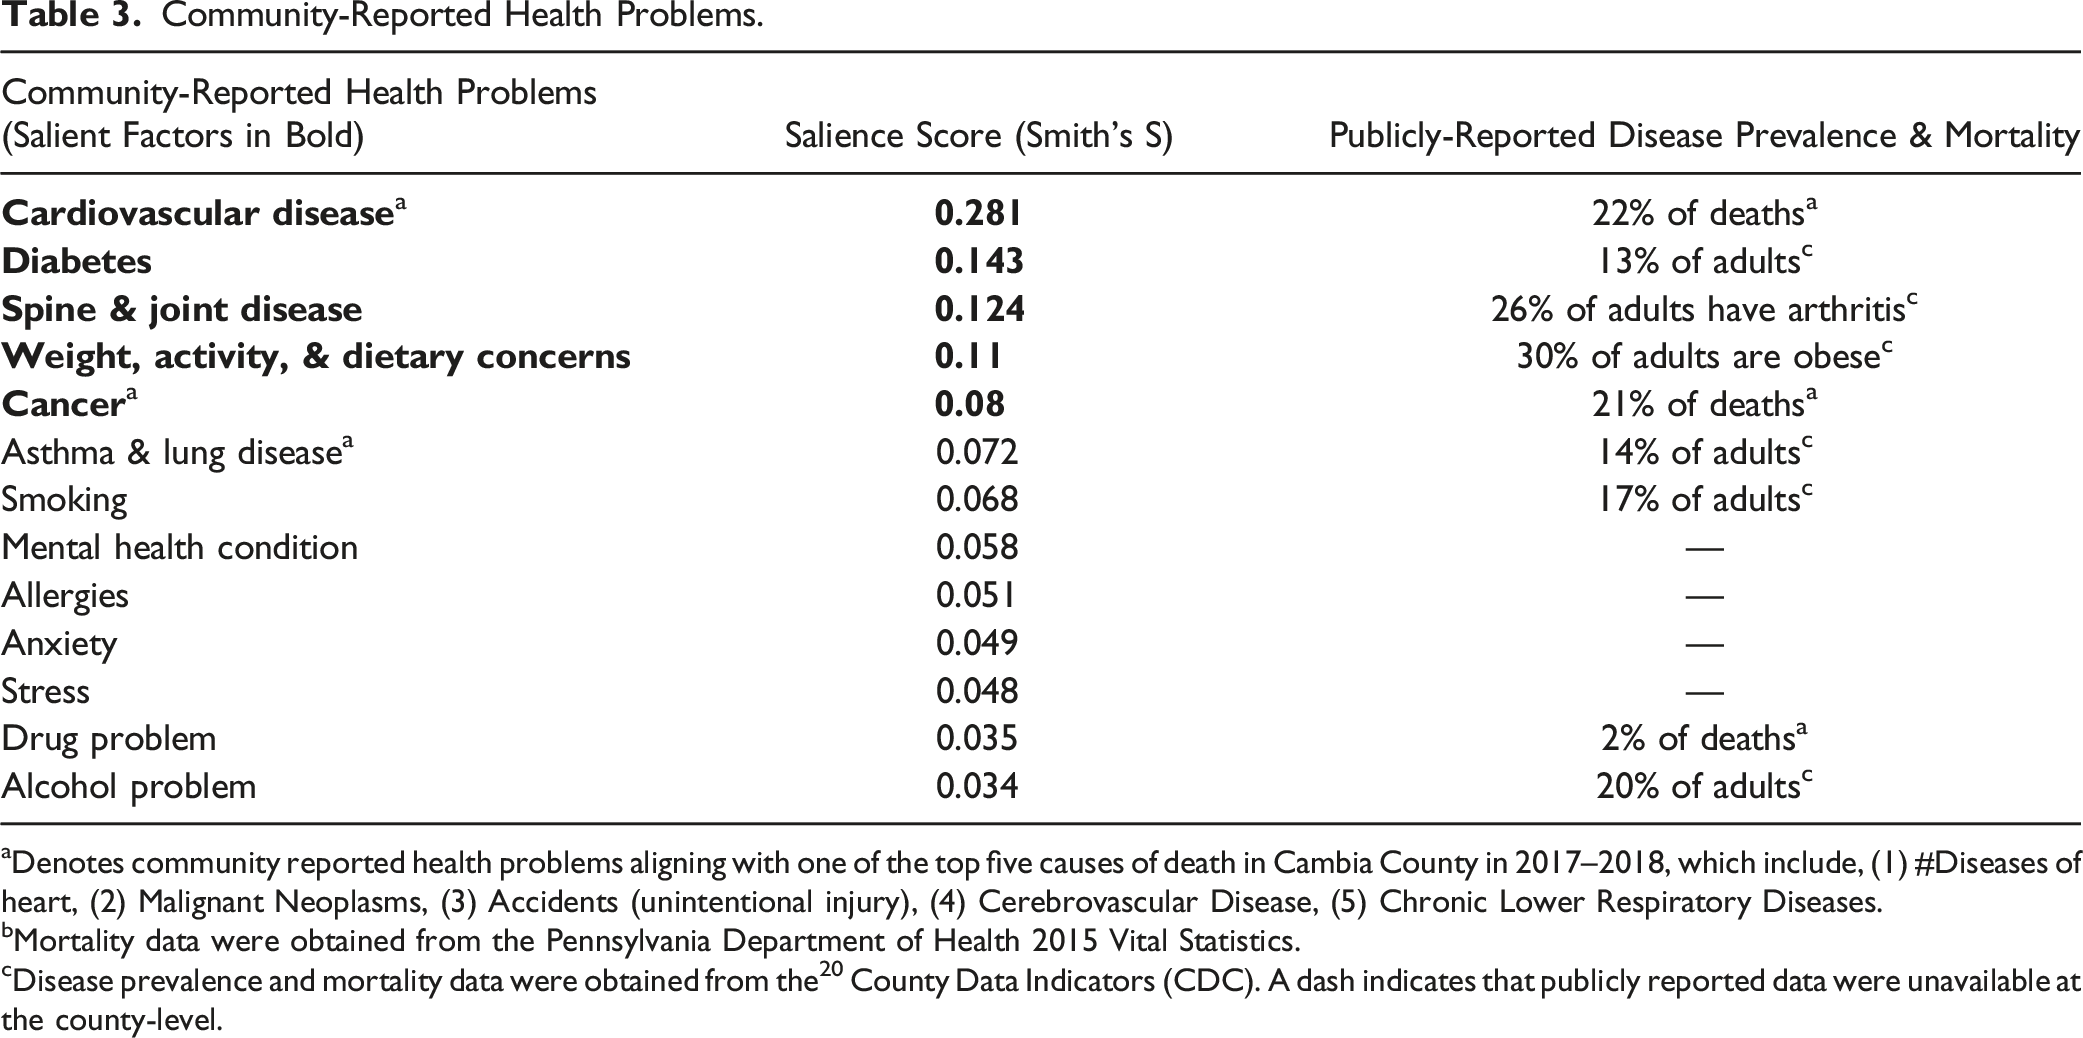
aDenotes community reported health problems aligning with one of the top five causes of death in Cambia County in 2017–2018, which include, (1) #Diseases of heart, (2) Malignant Neoplasms, (3) Accidents (unintentional injury), (4) Cerebrovascular Disease, (5) Chronic Lower Respiratory Diseases.
bMortality data were obtained from the Pennsylvania Department of Health 2015 Vital Statistics.
cDisease prevalence and mortality data were obtained from the 20 County Data Indicators (CDC). A dash indicates that publicly reported data were unavailable at the county-level.
Community-Reported Terms for Barriers to Health.
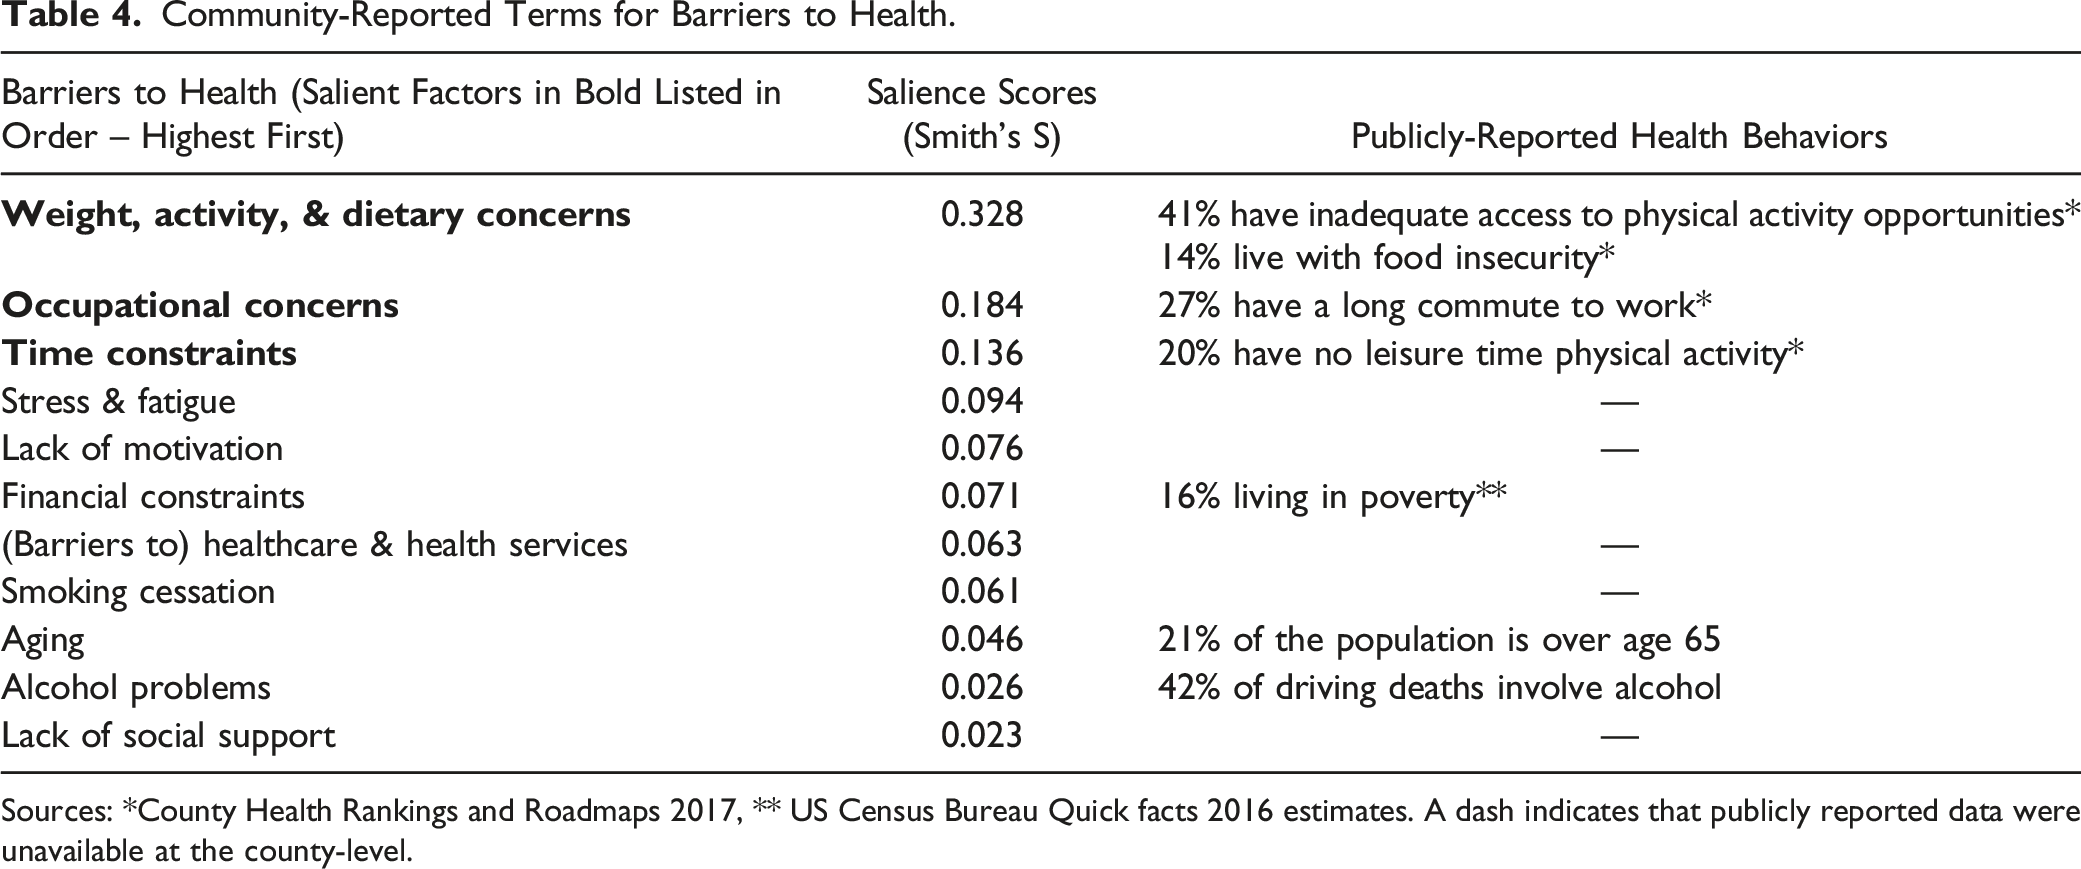
Sources: *County Health Rankings and Roadmaps 2017, ** US Census Bureau Quick facts 2016 estimates. A dash indicates that publicly reported data were unavailable at the county-level.
Stratified analyses comparing responses of women versus men revealed key differences (Figure 1). While both women and men considered “physical activity” and “healthy eating” to be important for improving health, “healthcare and health services” were salient for women while “sleep and rest” were salient for men. Salient health problems among women and men included “cardiovascular disease”, “diabetes”, and “spine and joint disease”. “Weight, activity, and dietary concerns” also comprised a salient group of terms among both genders. “Cancer” was a salient health problem reported among women, whereas “asthma and lung disease” was a salient health problem among men. Among both women and men, salient barriers to health included “weight, activity, and dietary concerns”, as well as “occupational concerns”, and “stress and fatigue”. For women, salient barriers to health also included “financial constraints” and “time constraints”, whereas additional barriers to health that were salient among men involved limited “access to health services” and “lack of motivation”. Salient health priorities among women compared to men. Legend: Venn diagrams constructed using Smith’s salience indexes to determine similarities and differences regarding health priorities for men and women.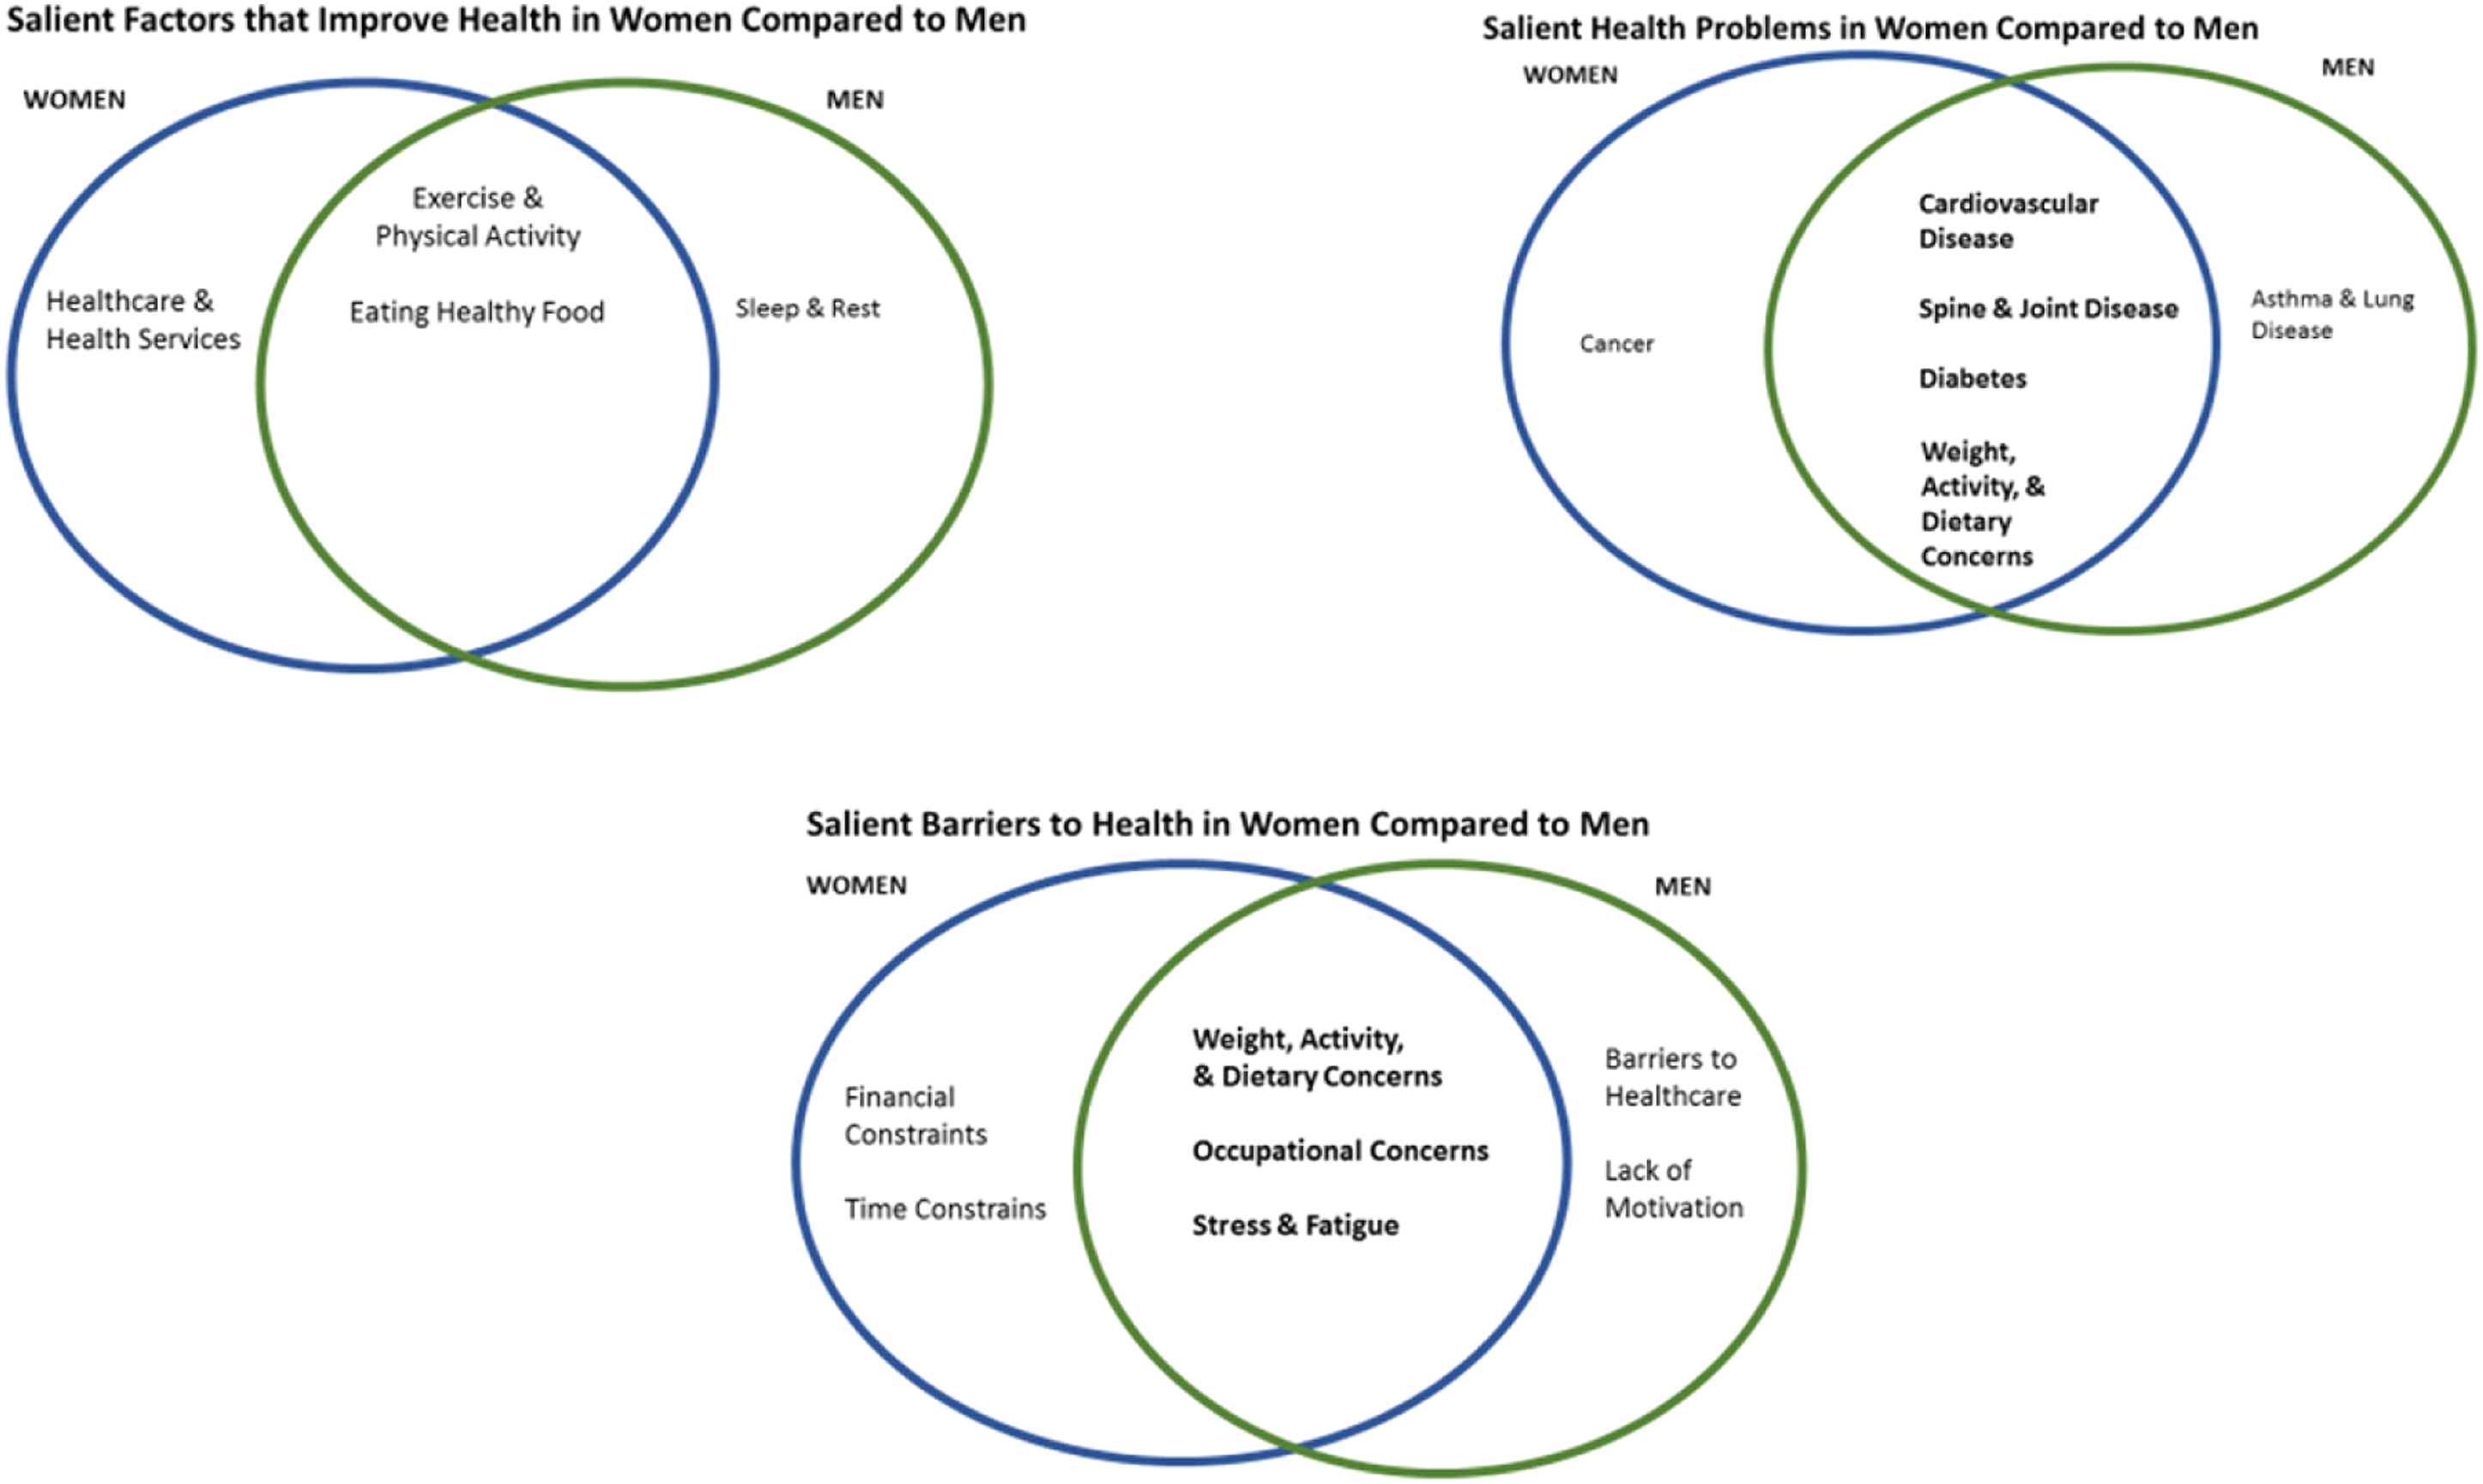
Analyses comparing responses of adults age 18 to 64 next to those of adults age 65 and older revealed similarities and differences (Figure 2). For all adults, “physical activity”, “eating healthy food”, and “healthcare and health services” were salient factors thought to improve health. But, for adults under 65, “sleep and rest” were also found to be salient for improving health, while “medications and medical devices” were salient for adults over 65. Salient health problems reported among all adults included “cardiovascular disease”, “diabetes”, as well as “spine and joint disease”. For adults under age 65, “smoking”, “cancer”, as well as “weight, activity, and dietary concerns” were also salient. Among adults ages 65 and older, additional salient health problems included “stress and fatigue” as well as “asthma and lung disease”. Salient barriers to health for all adults included “weight, activity, and dietary concerns”, as well as “stress and fatigue”. Among adults under age 65, additional salient barriers to health included “occupational concerns” and “time constraints”. For adults over age 65, “aging” was perceived as an additional salient barrier to health. Salient health priorities among adults ages 18 to 64 compared to adults age 65 and older. Legend: Venn diagrams constructed using Smith’s salience indexes to determine similarities and differences regarding health priorities for younger and older adults.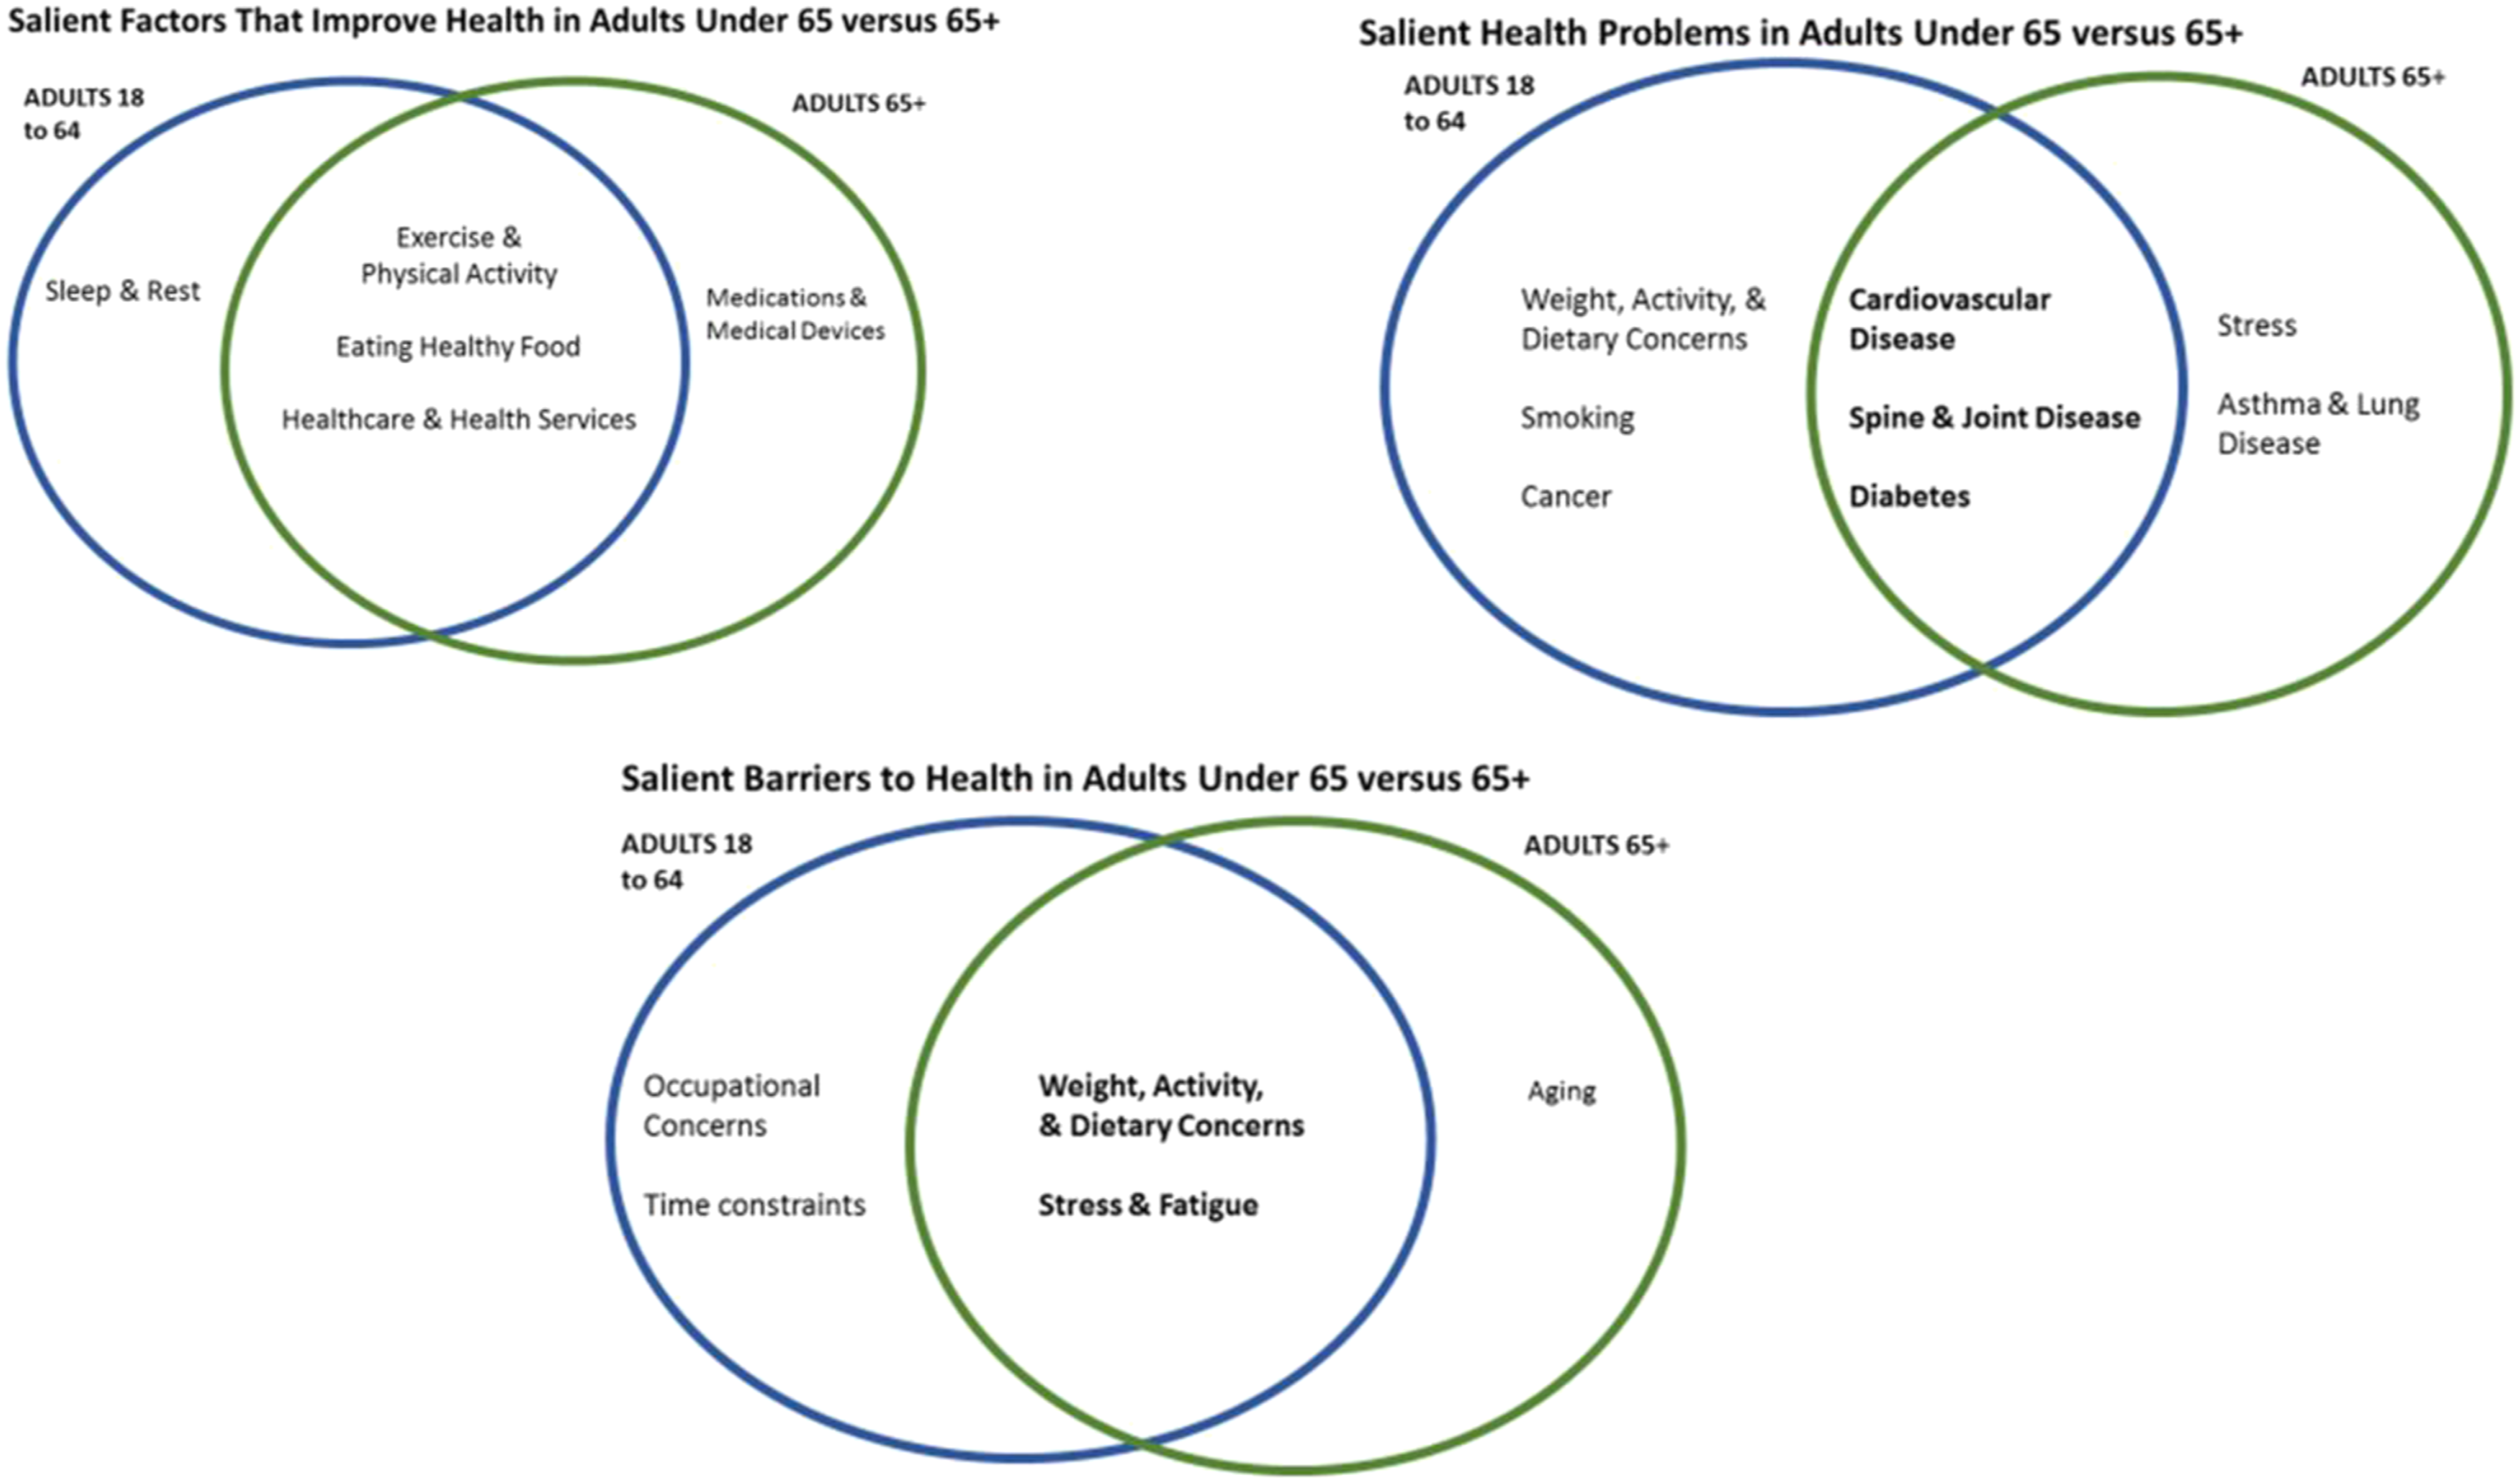
Discussion
This study demonstrated that the freelisting method can effectively contribute information to CHNAs that is not readily available in current public prevalence data, such as community perceptions of things that improve health. The study population also reported health concerns and perceptions that were congruent with publicly reported disease prevalence and mortality data with no notable differences. This demonstrates that inclusion of both methods in a CHNA verifies the health needs of the community while contributing unique information and narrative.
Recent attention to diseases of despair, including suicide, drug overdoses, and alcoholic liver disease,25,26 did not appear to distort individual health perceptions and priorities in this study. Although the rates of such diseases are growing in the study population, they are not among the top 10 causes of death in the county. 22 Respondents mentioned health concerns including “alcohol problem” and “drug problem”, but these were not among the salient terms describing community health priorities. Cardiovascular disease was among the salient health problems reported in this study and it is the leading cause of death in the county. 22 The congruence between publicly reported disease prevalence and mortality and community-reported health priorities supported the validity of our study results.
Qualitative data from freelisting responses also complemented disease prevalence and mortality data by providing descriptions of community perceptions of disease, including what individuals feel they can do about disease, and what factors make it difficult for them to address their health concerns. For example, respondents who reported having a “bad back” or “bad knees” provided more detail to describe publicly reported rates of arthritis in adults, 20 and could inform future approaches to physical activity interventions.
Use of the freelisting method also offered several advantages over other methods of collecting qualitative data. Whereas surveys, qualitative interviews, and focus groups often require highly skilled interviewers or facilitators,7,27 our freelisting interviewers required a very brief training and only needed the capacity to effectively communicate a simple prompt and record responses. Data collection and analysis were efficient in this study. Listing of responses is less labor intensive than transcribing complex interviews or focus group discussions. Analysis involved grouping and scoring of terms that were pertinent to the research question, 7 limiting extraneous data, without requiring exploration of transcripts from interviews or focus groups. 28 Lastly, because the freelisting methods we used in this study involved a low response burden for interviewees, non-response bias that is often seen with other qualitative methods,29,30 was largely avoided.
Limitations
Despite the advantages of the freelisting method, this study had some limitations. Given the small sample size of 98, we cannot claim that interview results are completely representative of all 140,000 residents in the county. Additionally, while the vast majority of people approached to be interviewed agreed to participate (approximately 78%), we do not know how many people saw the interviewers, and perhaps unsure of what they were doing, avoided the encounter by crossing the street or changing directions. Thus both, response bias and social acceptability bias could have played a role in results. However, the congruence between community-reported health priorities and publicly reported disease prevalence and mortality data make a case that results could be a fair representation of the county. Also, we were unable to make comparisons between all subgroups as we did not reach saturation in every group (generally you need at least 20 respondents per subgroup), for example while 89 respondents identified as White only six identified as Black. Additionally, qualitative methods such as freelisting require interpretation of responses, which can lead to bias. In this case, the investigators’ interpretation was influenced by the community health planning perspective, which involved grouping terms into disease areas that can be prevented or controlled through health interventions. Interpretation of responses could have resulted in different groupings if the study were completed by investigators in a different discipline. Nonetheless, the investigators described the methods of this study so as to make the analysis as transparent and replicable as possible. Other community health centers seeking to complement a needs assessment with qualitative data could benefit from using the freelisting method described in this study.
Implications for Research
Further work must include cost-benefit analysis to make sure that any CHNA additions are truly benefiting the community. Other directions may include modeling the steps necessary to include new methods into an existing CHNA structure. Freelisting and other approaches, like Group Concept Mapping 31 or Intercept Interviews 8 are efficient modes of data collection and should be consider as they may have utility in the context of CHNA.
This must include cost, expansion or addition of public health practitioner roles, and time considerations. Findings from this study may be used to inform future surveys or qualitative studies in this community. Lastly, if implemented, retrospective analyses should confirm the utility of any new methods and if they should be maintained.
Conclusions
This study demonstrated a reasonable means of obtaining useful qualitative data to inform community planning and population health practice. Freelisting methods were used to give community residents a voice in the assessment of health needs to allow them to participate in the prioritization process. Additionally, the freelisting method informed the development of an infographic (Supplement 3), which has been disseminated to the community. We hope this will inspire health priority conversations among community members and between community members and their providers.
Supplemental Material
Supplemental Material - Freelisting: A Technique for Enhancing the Community Health Needs Assessment
Supplemental Material for Freelisting: A Technique for Enhancing the Community Health Needs Assessment by Marquita Decker-Palmer, David Klodowski, Trina Thompson, Marianna Lanoue, Allison Messina, Diana Schroeder, Shiryl Barto, Billy Oglesby, and Rosemary Frasso in American Community Health Equity Research & Policy
Footnotes
Declaration of Conflicting Interests
The author(s) declared no potential conflicts of interest with respect to the research, authorship, and/or publication of this article.
Funding
The author(s) disclosed receipt of the following financial support for the research, authorship, and/or publication of this article: This work was supported by the 1889 Foundation, Inc. (No associated grant number).
Informed Consent
Participants provided informed consent to be interviewed in accordance with a research protocol that was approved by the Jefferson Institutional Review Board.
Supplemental Material
Supplemental material for this article is available online
Author Biographies
References
Supplementary Material
Please find the following supplemental material available below.
For Open Access articles published under a Creative Commons License, all supplemental material carries the same license as the article it is associated with.
For non-Open Access articles published, all supplemental material carries a non-exclusive license, and permission requests for re-use of supplemental material or any part of supplemental material shall be sent directly to the copyright owner as specified in the copyright notice associated with the article.