
Abstract
Background:
Given the relatively resource-intensive burden of treating orofacial clefting and its functional and aesthetic sequelae, it is perhaps unsurprising that lower socioeconomic status is known to have adverse effects on outcomes in patients with cleft lip and/or palate (CL/P). Although outcomes in patients with CL/P are known to be influenced by socioeconomic status, the relationship between socioeconomic status and age-related weight gain has not been described. This study aimed to determine time-specific socioeconomic disparities in weight-for-age Z-scores and failure to thrive in patients with CL/P.
Methods:
This retrospective study evaluated patients presenting with CL/P from 2009 to 2019 at a tertiary children’s hospital. Failure to thrive status was determined by weight-for-age Z-scores less than −2.00 (second percentile) or from the EHR. Median income by block group was determined from US 2019 census data.
Results:
Multivariate linear regression models controlled for syndromic status, sex, and race revealed significant associations between median block group income and weight-for-age Z-scores at 4 weeks (β = .14, P = .009), 6 weeks (β = .15, P = .003), and 8 weeks (β = .14, P = .002). Mann Whitney U tests revealed significantly different weight-for-age Z-scores between low-income and high-income groups at 4 weeks (P = .002), 6 weeks (P < .001), 8 weeks (P < .001), 10 weeks (P = .005), and 12 weeks (P = .004).
Conclusions:
Patients with CL/P and lower socioeconomic status may be most susceptible to disparities in weight gain between 4 and 8 weeks of age. Lower socioeconomic status was an independent predictor of failure to thrive for patients with CL/P in this cohort. This study highlights a welcome opportunity for timed intervention in patients with CL/P and lower socioeconomic status.
Introduction
The most common congenital craniofacial anomality worldwide is cleft lip and/or palate (CL/P) with an estimated incidence of 7.9 in 10 000 internationally and 7.8 in 10 000 in the United States (US). 1 Untreated orofacial clefting leads to a diverse set of sequelae including aesthetic 2 and functional deficits such as hindered feeding, 3 delayed speech and language development, 4 hearing dysfunction, 5 and psychosocial distress. 6 Optimal treatment of CL/P begins early with prenatal evaluation 7 and continues longitudinally throughout childhood and adolescence, often necessitating high levels of patient engagement and follow-up with multidisciplinary services to optimize outcomes.8,9
While treatment of CL/P has economic benefits to societies and aversion of disability-adjusted life years, 10 comprehensive cleft care often necessitates a high degree of financial resources and planning by patients and families, 11 although total costs and value-based care have been challenging to quantify. 12 Given the relatively resource-intensive burden of treating orofacial clefting and its functional and aesthetic sequelae, it is perhaps unsurprising that lower socioeconomic status is known to have adverse effects on outcomes. 13 Indeed, previous studies have revealed associations between socioeconomic status and risk of CL/P. 14 “Other studies have described higher rates of failure to thrive 15 and hindered weight gain in patients with CL/P. 16 Other factors have been associated with poorer weight gain in patients with CL/P but it is not clear to what degree, at what time points in their growth, and if and how this effects any clinical outcomes.” 17 Previous research elucidates the deleterious sequelae of decreased weight gain and failure to thrive, including inferior developmental indices and lower IQ scores years later. 18
Previous work has demonstrated age-related weight changes in patients with CL/P. A previous study on patients with cleft palate revealed an average birth weight at the 30th percentile, with decrease in patient weight to the 20th percentile at month 2 and subsequent recovery to birth weight at 6 months. 19 Although outcomes in patients with CL/P are known to be influenced by socioeconomic status, and patients with CL/P experience age-related weight changes, the relationship between the socioeconomic status and age-related weight gain has not been described. This study aimed to determine time-specific socioeconomic disparities in weight-for-age Z-scores and failure to thrive in patients with CL/P at a large, urban, tertiary care center in the United States. Specifically, we used US Census block group household income data as a proxy for family socioeconomic status. Based on previous studies, we hypothesized that disparities in weight gain may be exacerbated at certain ages (eg, 2 months), when patients in CL/P are known to experience decreases in weight.
Methods
Patients
This retrospective study evaluated patients presenting with CL/P from May 2009 to November 2019 (pre COVID-19 pandemic) through the Division of Plastic and Reconstructive Surgery at a tertiary children’s hospital. Patients were excluded if they presented with submucosal cleft palates, atypical orofacial clefts, presented after 250 days of age, or were adopted internationally. This study was approved by the Institutional Review Board at the Children’s Hospital of Philadelphia under IRB number 12-009276.
Clinical Data
Demographic and clinical variables detailed in Table 1 were extracted from the electronic health record (EHR). Weight gain data extracted from the EHR included weight-for-age Z-scores biweekly for the first 3 months of life as well as at 1 year of age. Weight measurements were included for patients if they fell within 1 week of the intended time point during the first 12 weeks and between 10 and 14 months for the first year of life.
Demographic and Clinical Information.
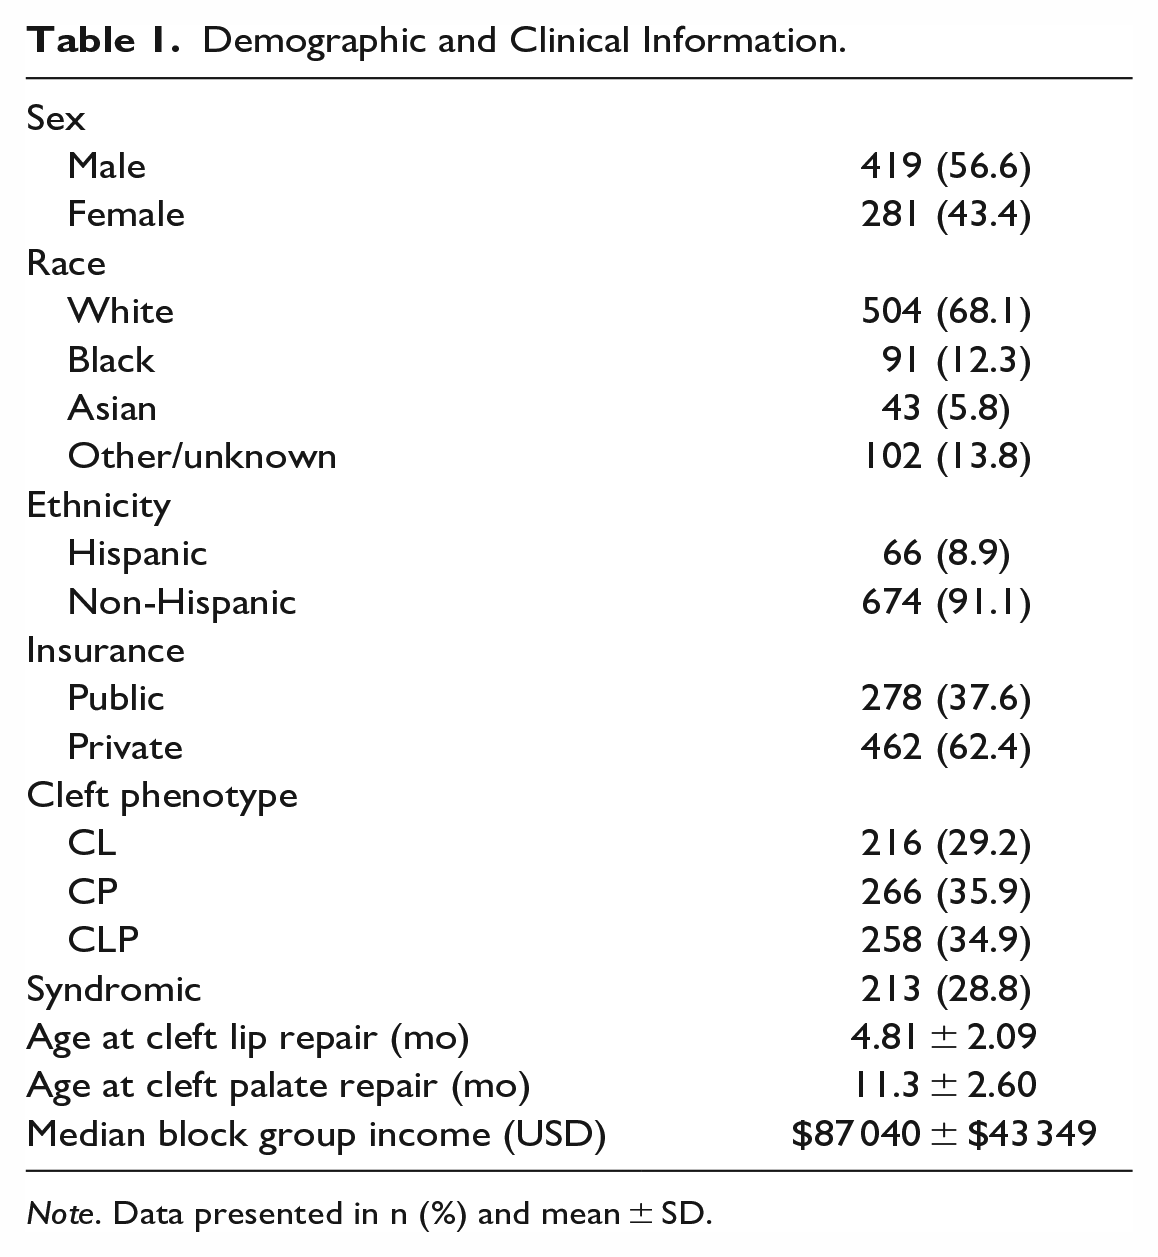
Note. Data presented in n (%) and mean ± SD.
Failure to thrive status was determined by weight-for-age Z-scores less than −2.00 (second percentile) or from clinician reporting in the EHR. Defining failure to thrive status has extensive acknowledged limitations due to inconsistencies in the literature.20,21
Median income by block group was determined from US 2019 census data based on patient family address. Census block groups are a subdivision of census tracts used by the US Census Bureau that usually have between 600 and 3000 people. 22
Statistical Analysis
Demographic and clinical data were evaluated with descriptive statistics. Spearman’s correlations were used to assess independent associations between weight-for-age Z-scores and median block group income. Multivariate linear regression models controlled for syndromic status, sex, and race were used to assess relationships between weight for age Z-scores and median income by census block group. Mann Whitney U tests were used to compare weight-for-age Z-scores between high- and low-income groups. Multivariate logistic regression models controlled for syndromic status, sex, and race were used predict high- or low-income status based on weight-for-age Z-scores. Statistical analysis was performed in JASP 0.15 for Windows (https://jasp-stats.org). 23
Results
Patient Demographic Information
This study included 740 (418 male, 56.6%) patients presenting for primary CL/P surgical repair (Table 1). A majority of patients were white (504, 68.1%) and non-Hispanic (674, 91.1%). Cleft phenotype representation in this cohort included isolated cleft palate (266, 35.9%), isolated cleft lip (216, 29.2%), and cleft lip and palate (258, 28.8%). Patients with associated syndromes constituted over one-quarter of this cohort (213, 28.8%).
The average median income by US Census block group was $87 040 ± $43 349 USD. Over one-third of families held public insurance (278, 37.6%) and about two-thirds of patients had private insurance (462, 62.4%).
Clinical Results
Approximately one-fifth (160, 21.4%) of patients received prenatal plastic surgery evaluation at our institution (Table 2). The average age at first appointment was 44.9 ± 55.1 days (median 17 days). Patients underwent cleft lip repair at average age of 4.81 ± 2.10 months and cleft palate repair at average age 11.32 ± 2.61 months. One hundred and eighteen (16.0%) patients underwent nasoalveolar molding and 37 (5.0%) patients underwent cleft lip adhesion surgery.
Patient Clinical and Feeding Data.
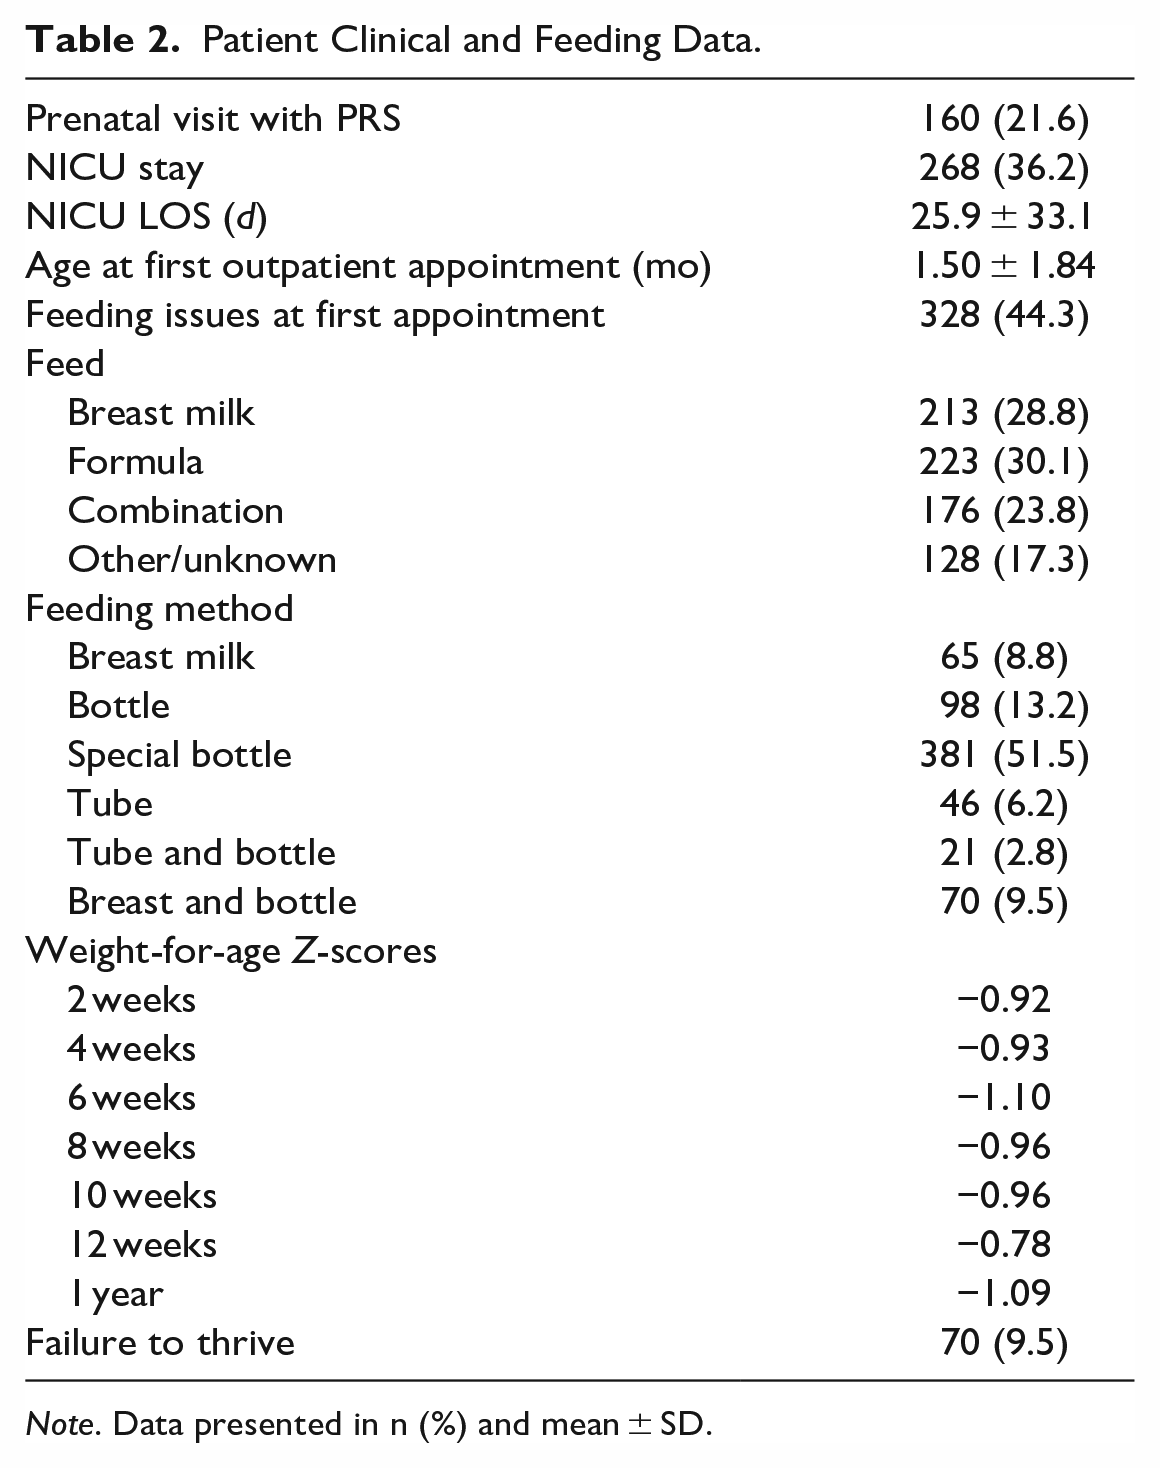
Note. Data presented in n (%) and mean ± SD.
Seventy (9.5%) patients met criteria for failure to thrive. Weight-for-age Z-score averages ranged from a low of −1.10 at 6 weeks to a high of −0.78 at 12 weeks. Families reported feeding with formula only (30.1%), breast milk only (28.8%), a combination of breast feeding and formula (23.8%), or other/unknown (17.3%).
Weight-for-Age Z-Scores and Block Group Income
Spearman’s correlations tested independent associations between weight-for-age Z-scores and median block group income. Significant associations between income and weight-for-age Z-scores emerged at 4 weeks (ρ = .161, P = .005), 6 weeks (ρ = .215, P < .001), 8 weeks (ρ = 0.193, P < .001), 10 weeks (ρ = .136, P = .039), and 12 weeks (ρ = .107, P = .027) (Table 3). There were no significant associations at 2 weeks (P = .109) or 1 year (P = .531).
Median Block Group Income and Weight-For-Age Z-Scores.
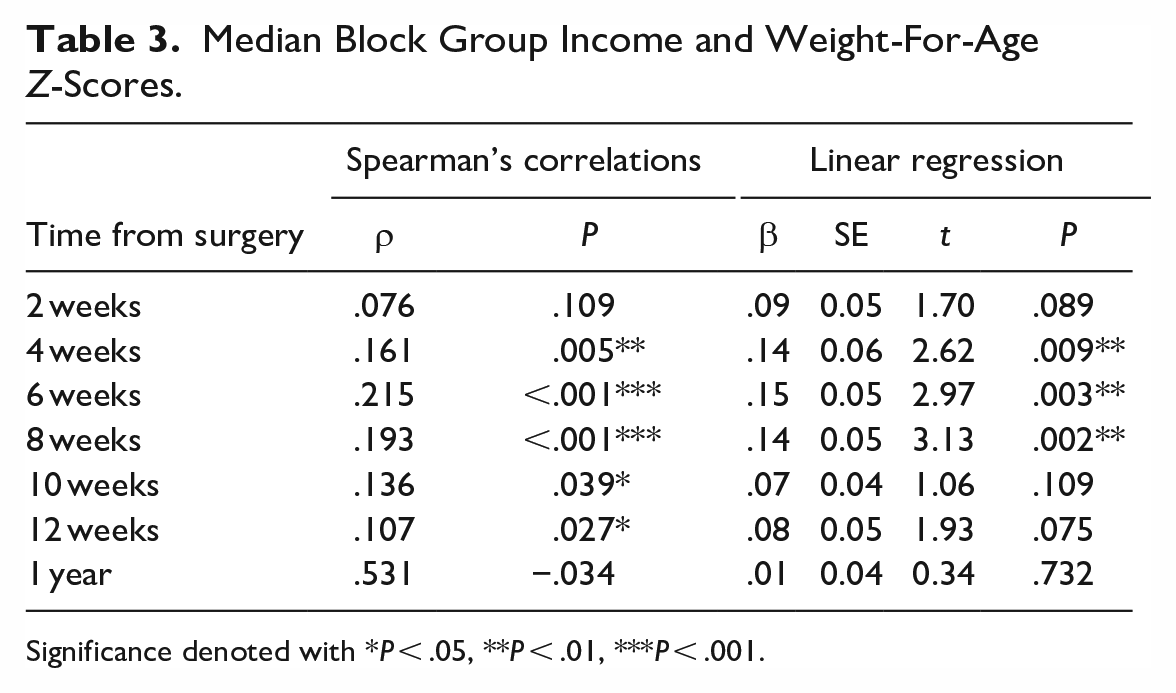
Significance denoted with *P < .05, **P < .01, ***P < .001.
Multivariate linear regression models controlled for syndromic status, sex, and race tested associations between median block group income and weight-for-age Z-scores. Syndromic status, sex, and race were controlled for in these models based on statistically significant differences in failure to thrive and weight gain. A similar pattern emerged where associations between income and weight-for-age Z-scores emerged at 4 weeks (β = .14, SE = 0.06, P = .009), 6 weeks (β = .15, SE = 0.05, P = .003), and 8 weeks (β = .14, SE = 0.05, P = .002) (Table 3). There were no significant associations at 2 weeks (P = .089), 10 weeks (P = .109), 12 weeks (P = .075), or 1 year (P = .732).
Weight-for-Age Z-Scores and Income Tier
Patients were stratified into 2 groups based on those in the bottom 50% of block group income “low income” and those in the top 50% of block group income “high income.” Mann Whitney U tests evaluated differences in weight-for-age Z-scores between the low income and high income tiers (Figure 1). Significant differences emerged between income tiers at 4 weeks (−1.12 vs −0.71, P = .002), 6 weeks (−1.36 vs −0.83, P < .001), 8 weeks (−1.25 vs −0.68, P < .001), 10 weeks (−1.27 vs −0.74, P = .005), and 12 weeks (−0.95 vs −0.61, P = .004) (Table 4). There were no significant differences in weight-for-age Z-scores by income tier at 2 weeks (P = .051) or 1 year (P = .950).
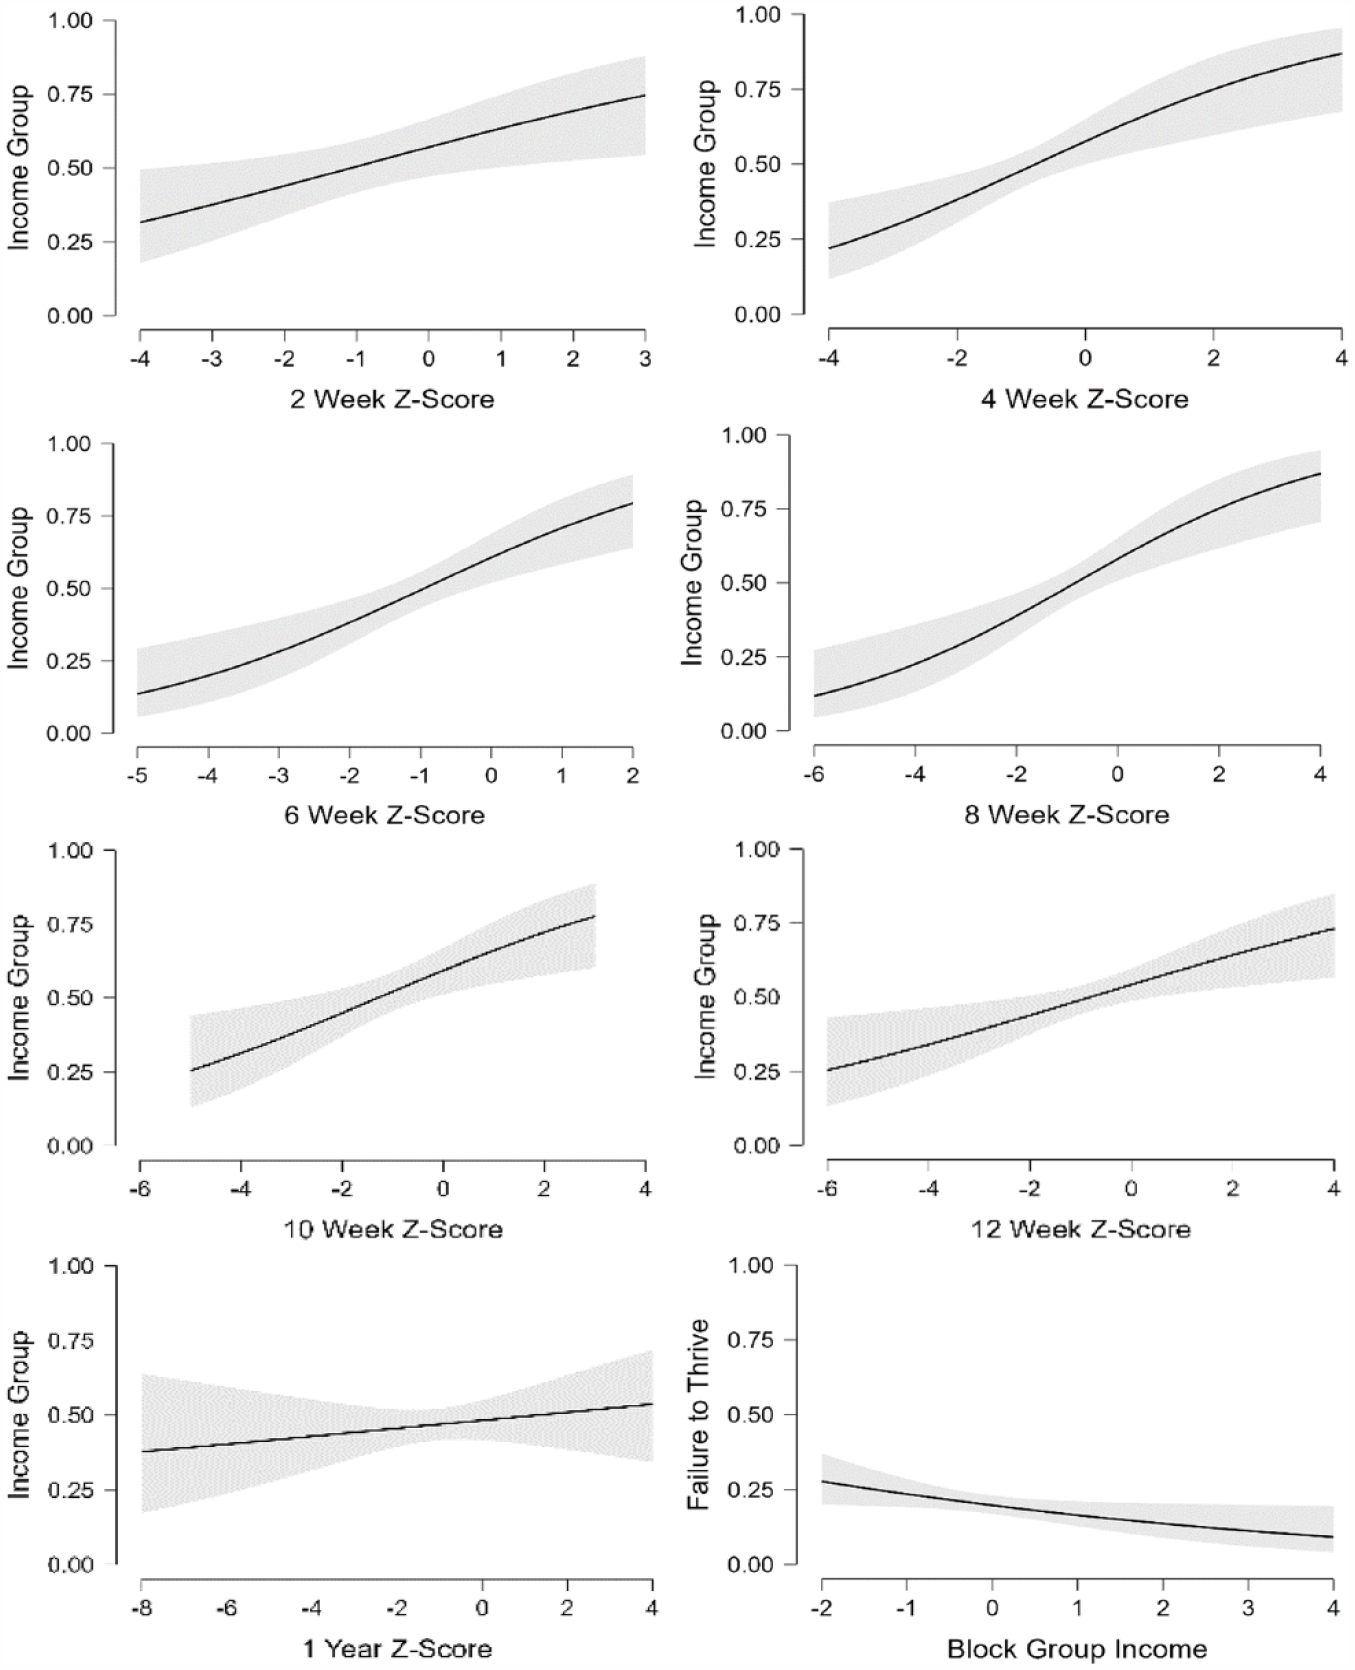
Multivariate logistic regression conditional estimate plots predicting high or low income controlled for syndromic status and sex at (A) 2 weeks, (B) 4 weeks, (C) 6 weeks, (D) 8 weeks, (E) 10 weeks, (F) 12 weeks, and (G) 1 year. (H) Multivariate logistic regression conditional estimate plot predicting failure to thrive status by patient median block group income. Statistical significance denoted with *P < .05, **P < .01, ***P < .001.
Income Group and Weight-For-Age Z-Scores.
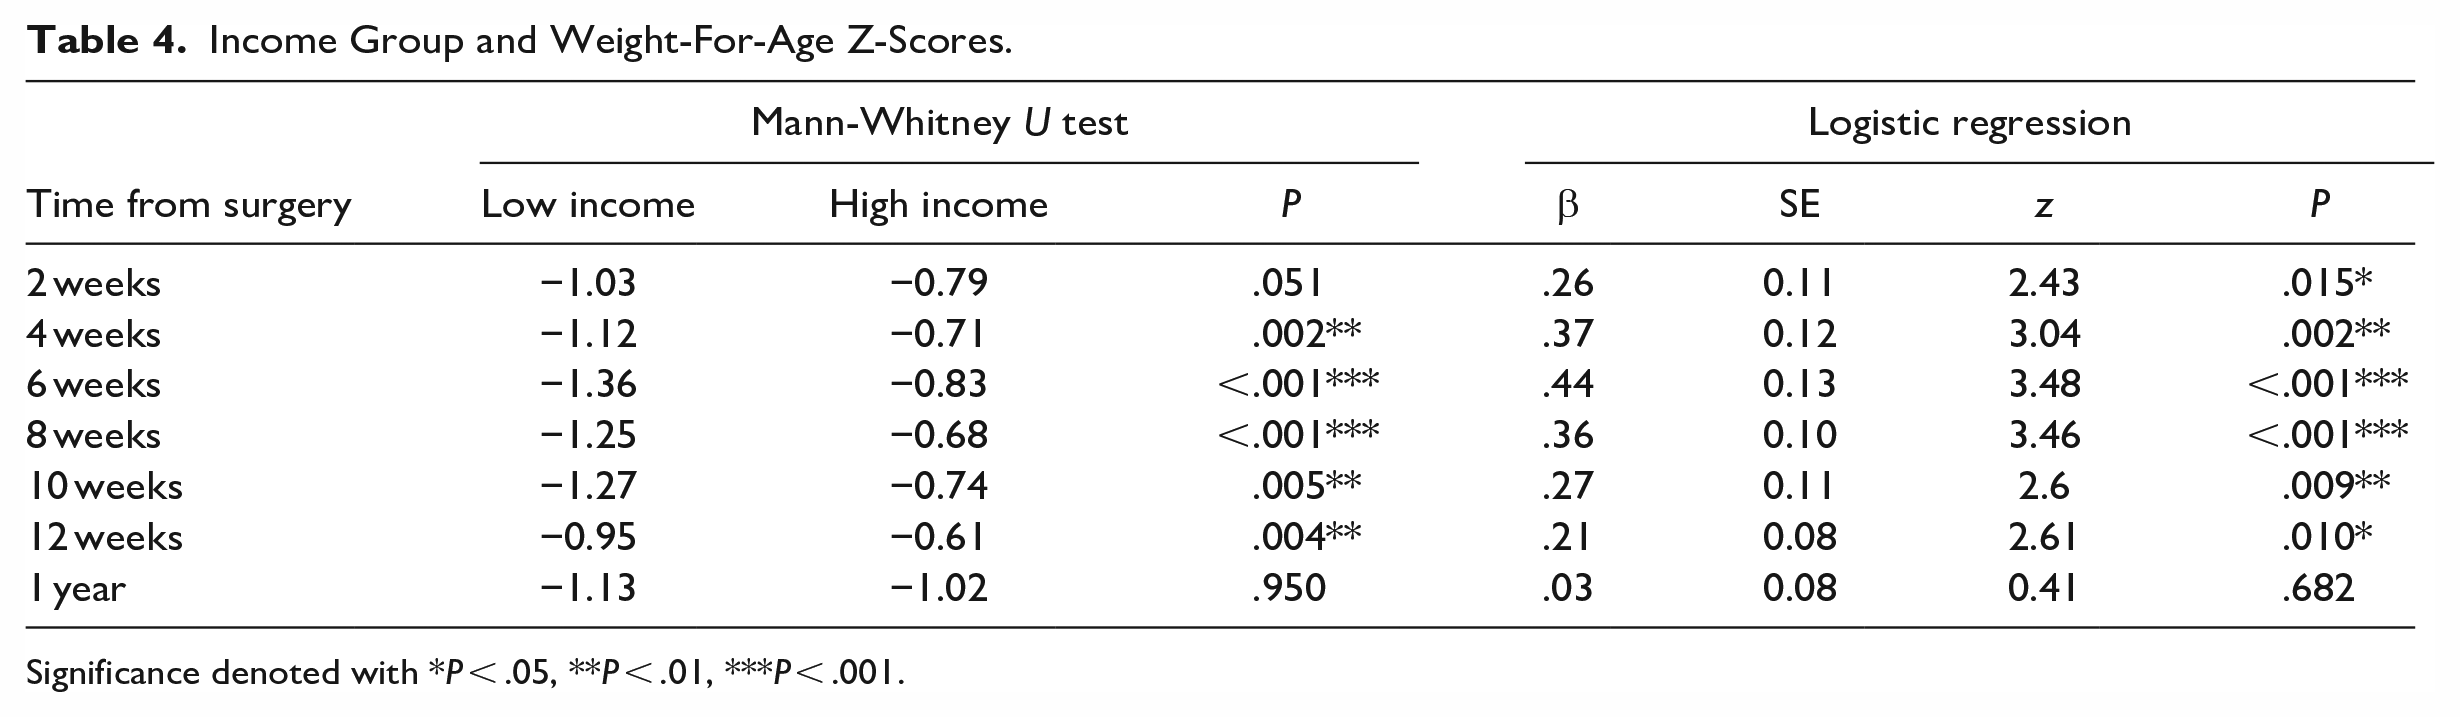
Significance denoted with *P < .05, **P < .01, ***P < .001.
Multivariate logistic regression models controlled for syndromic status, sex, and race tested associations between income tier and weight-for-age Z-scores (Figure 2). Significant associations emerged at 2 weeks (β = .26, SE = 0.11, P = .015), 4 weeks (β = .37, SE = 0.12, P = .002), 6 weeks (β = .44, SE = 0.13, P < .001), 8 weeks (β = .36, SE = 0.10, P < .001), 10 weeks (β = .27, SE = 0.11, P = .009), and 12 weeks (β = .21, SE = 0.08, P = .10) (Table 4). There were no significant associations between weight-for-age Z-score and income tier at 1 year (P = .682).
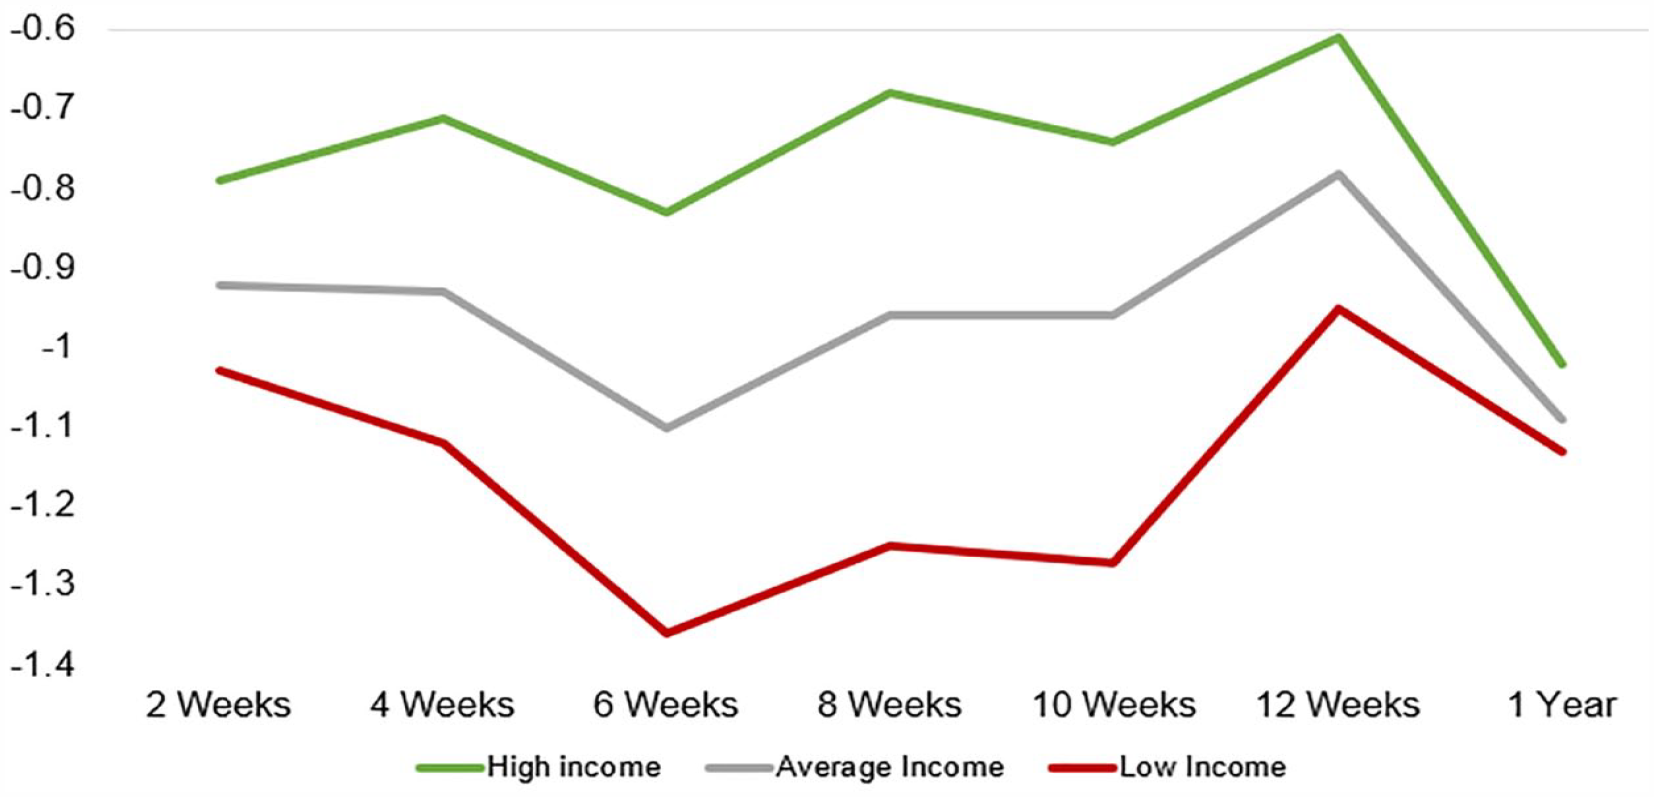
Average weight-for-age Z-scores for high-income, low-income, and total cohort at 2, 4, 6, 8, 10, 12 weeks and 1 year.
Failure to Thrive
Mann Whitney U tests revealed patients with failure to thrive had significantly lower median block group income ($79 877.98 vs $88 778.03, P = .028). Multivariate logistic regression models controlled for syndromic status, sex, and race revealed lower median block group income predicted failure to thrive status (β = −.22, SE = 0.11, P = .034) (Figure 2).
For patients undergoing cleft lip repair, patients without FTT underwent surgery at 139.9 ± 63.4 days and patients with FTT underwent surgery at 170.6 ± 52.4 days (P < .001). For patients undergoing cleft palate repair, patients without FTT underwent surgery at 331.3 ± 76.8 days and patients with FTT underwent surgery at 362.3 ± 78.1 days (P < .001).
Discussion
This retrospective study assessed relationships between socioeconomic status and weight gain over time in patients with CL/P. While it is well established that lower income is associated with inferior outcomes following CL/P repair, significantly less is known about the temporality of these disparities. Furthermore, to our knowledge, impact of socioeconomic status on weight gain over time in patients with clefts has yet to be described. In this study, median block group income was a significant predictor of weight-for-age Z-scores most significantly at 4 to 8 weeks of age in patients with CL/P. Patients in the lowest income group also had significantly lower weight-for-age Z-scores between 4 and 12 weeks of age. Median block group income was a significant predictor of failure to thrive status.
Perhaps one of the most important findings of this study is that socioeconomic disparities in patients with CL/P may have a temporal component where disparities are most exacerbated at certain ages or time points. This study revealed the largest disparities emerged in age-for-weight Z-scores between 4 and 8 weeks of age, with some data suggesting disparities also exist until 12 weeks of age. Importantly, it appears the strongest relationships with largest coefficients persist at 4 to 10 weeks and peak at 6 to 8 weeks. These associations persisted in multiple analyses where socioeconomic status and median block group income were considered both as a continuous variable and binary variable (lower income and higher income groups). While patients with CL/P are known to be smaller than their non-cleft counterparts, less is known about the weight gain over time in patients with CL/P. 16 Previous studies have demonstrated patients with CL/P decline in weight from birth until about 2 months of age, at which point weight generally begins to increase. 19 Thus, lower socioeconomic status may exacerbate these already observed age-related weight decreases, and patients of families with lower socioeconomic status may be exceptionally susceptible. Thus, these patients may benefit from additional resources and support from a multidisciplinary team. A previous study found increased household income was significantly associated with increased knowledge about cleft feeding, 24 which may provide insights to mechanisms driving disparities described here. Data from this study may suggest a welcome opportunity for targeted intervention by cleft teams for patients with CL/P between 1 and 3 months. Findings by Wiekoon et al may suggest education regarding feeding in patients with CL/P may be an evidence-based, worthwhile effort.
Failure to thrive was significantly associated with lower socioeconomic status and median block group income in this study. Patients with failure to thrive status had significantly lower median block group income compared to their non failure to thrive counterparts. When controlling for syndromic status, sex, and race, lower median block group income was a significant predictor of failure to thrive status. These findings substantiate previous studies describing socioeconomic disparities in failure to thrive status in cleft 17 and non-cleft 25 cohorts. A previous study evaluating failure to thrive in patients with CL/P found implementation of a feeding-support nurse led to a nearly 50% reduction in failure to thrive rates in patients with CL/P. 15 This feeding-support nurse established contact with the family at time of diagnosis or birth, supervised breast feeding, and provided advice on feeding mechanisms. 15
This nurse also monitored weight loss and gain in children over time and evaluated the need to involve general pediatrics and/or the cleft surgeon for further management. 15 While this intervention is certainly time and effort intensive, it may be one such approach with proven efficacy for reducing rates of failure to thrive in patients with CL/P. 15 Taken in the context of this study, these efforts may be most valuable for patients with lower socioeconomic status between 4 and 8 weeks of life. These results also raise questions regarding possible long-term sequelae of temporary lags in weight gain and failure to thrive. Previous studies suggest deleterious effects of decreased weight gain and failure to thrive, including lower developmental indices and IQ scores, may persist years after. 18
Results from this study may highlight the importance of offering robust social services to mitigate disparities in weight-gain and clinical outcomes. One such strategy has been the implementation of a nurse navigator to act as a primary point of contact between families and the institutional cleft team, who plays a similar but broader role than the feeding-support described by Pandya et al.15,17 The nurse navigator also provides support in addressing financial concerns, navigating counseling, and obtaining a prenatal evaluation.17,26 Importantly, this study demonstrates socioeconomic and temporal factors together may most significantly impact weight gain in patients with CL/P, suggesting a window of opportunity for intervention by multidisciplinary teams. Perhaps future investigations may include prospective studies aimed to address the critical 4- to 8-week window described here. Future interventions in prospective studies may include increased or targeted communications from our nurse navigator team during this time. Additional interventions may include education regarding feeding based on findings from the previously discussed study by Wiekoon et al. Yet other possible interventions may include more WIC involvement, educating primary care providers for earlier referral, and flagging this patient population for more intensive feeding support. Results from this study may further underscore the importance of cultivating a diverse team and surgical workforce to optimally treat patients from a variety of socioeconomic backgrounds. 27
This study has several limitations. The retrospective approach precludes establishment of causal relationships. This study was carried out at a single urban tertiary care center in the northeastern United States in the Division of Plastic and Reconstructive Surgery with a multidisciplinary team, which may limit generalizability to different care centers in other geographies. Additionally, block group income data were extracted from a single year (2019) of US Census data for the entire cohort over a ten-year period. Although this may be a limitation, relative rather than absolute income may be more important for establishing the relationships in the present study. Weight-for-age Z-scores were collected at 2-week intervals if they fell within 1 week of the desired timepoint and at the 1-year period if they fell within 2 months of the desired timepoint, which may result in variability of the actual reported weight-for-age Z-score data. Failure to thrive status was defined as less than weight-for-age Z-scores below −2.00 (second percentile) or as noted by clinicians (attending plastic and reconstructive surgeons) in the EHR, yet inconsistencies in failure to thrive definition in the literature limit generalizability of these results. 20 Syndromic patients constituted a large proportion of the patients in this study, which may not be generalizable to other centers or cohorts. However, multivariate analyses accounted for syndromic status in this study based on significant differences between syndromic and non-syndromic weight gain patterns. Finally, while several factors may influence CL/P outcomes including distance from the care center, household size, and parent level of education, these variables were unaccounted for in the present study.
Despite these limitations, our cohort size of 740 patients included in a ten-year period represents one of the largest single center studies on weight gain and socioeconomic status in patients with CL/P. This study identified relationships between median block group income and weight-for-age Z-scores over time in patients with clefts. Future studies will aim to further elucidate mechanisms perpetuating these barriers to care and develop interventions to target these most vulnerable patients.
Conclusions
This study augments current literature on socioeconomic disparities in patients with CL/P by describing relationships between age, socioeconomic status, weight gain, and failure to thrive. Lower socioeconomic status may most significantly exacerbate disparities in weight gain at 4 to 8 weeks of age for patients with CL/P. Future work will aim to determine appropriate interventions to mitigate these disparities.
Footnotes
Acknowledgements
This research was funded by the National Medical Fellowships United Health Foundation Grant to DFV and the Division of Plastic, Reconstructive and Oral Surgery at the Children’s Hospital of Philadelphia to JAT.
Presentation
Data from this manuscript have not been submitted for presentation.
Declaration of Conflicting Interests
The author(s) declared no potential conflicts of interest with respect to the research, authorship, and/or publication of this article.
Funding
The author(s) disclosed receipt of the following financial support for the research, authorship, and/or publication of this article: This article was funded by the Division of Plastic, Reconstructive, and Oral Surgery at the Children’s Hospital of Philadelphia.
Financial Disclosure Statement
DFV is a consultant and fellow to Artis Ventures, LP. JAT is a co-founder of Ostiio, LLC. JWS is a consultant to KLS Martin and Synthes.
Ethical Approval
Institutional Review Board approval was not required.