
Abstract
Background:
The differentiation of unilateral lambdoid synostosis (ULS) and deformational plagiocephaly (DP) is vital to provide appropriate treatment intervention. Three-dimensional (3D) photo grammetry provides rapid, reproducible image capture without radiation exposure. Advanced analytical methods can help identify distinctive features to differentiate the two craniofacial conditions. This study uses 3D photogrammetry of ULS and DP patients to analyze the global cranial morphology for diagnostic differentiation.
Methods:
A retrospective review of 3D photogrammetry of 19 ULS and 25 DP patients were analyzed. Cranial vault asymmetry index, oblique cranial length ratio, and diagonal difference were measured. 3D photogrammetry-based composites were created and overlaid on age and gender-matched controls to generate heat maps representing morphologic differences in contour.
Results:
Cranial vault asymmetry index and oblique cranial length ratio were significantly different between ULS and DP (0.019; 0.022). 3D photogrammetry ULS composite showed retrusion in the ipsilateral occipitoparietal area, contralateral posterior parietal projection, contralateral frontal projection, relative ipsilateral mastoid bulge, and facial projection. DP composite showed unilateral occipital projection and contralateral anterior projection. The contralateral occipital regions in the occipital and anterior areas remained equivocal to control patients.
Conclusions:
Diagnostic differentiation of ULS and DP has previously relied on observation and linear measurements of cranial asymmetry in a single plane. 3D photogrammetry composites provide a global contour evaluation for diagnosis and longitudinal outcome analysis.
Keywords
Introduction
Differentiation of posterior plagiocephaly between unilateral lambdoid synostosis (ULS) and deformational plagiocephaly (DP) is essential for proper clinical decision-making. ULS commonly requires surgical intervention, while DP is treated conservatively with positioning and helmet-based therapy.1-3 The classic morphologic description of head shape is trapezoidal in ULS and parallelogram in DP.4-6 ULS has ipsilateral occipital flattening and mastoid bulging, contralateral posterior parietal bossing, and inferior canting of the occipital skull base.6-10 DP has similar features, including unilateral occipital flattening, contralateral occipital bossing, and variable ipsilateral frontal bossing.6,9-11
The similarity in features can lead to clinical misdiagnosis and patients undergoing unnecessary surgical interventions.5,6,12 Clinical evaluation has previously been shown to have only moderate inter-rater reliability and repeatability and to be influenced by bias.13,14 This has led to the development of various objective linear measurements to differentiate ULS and DP. Different modalities have previously evaluated these linear measurements, including calipers, flexicurve, thermoplastic molds, 2-dimensional and 3-dimensional images, and computed tomography (CT) scans.11,14-20
Three-dimensional (3D) photogrammetry allows for rapid, reproducible image capture with a high degree of soft tissue detail while avoiding parallax effect and radiation exposure in the pediatric population.21,22 Previously, multiple studies have utilized 3D photogrammetry to analyze asymmetry in ULS and DP with linear measurements.15-20 However, linear-based measurements only allow for evaluation within a single plane and do not provide a global assessment of cranial deformity. Therefore, performing a 3D total surface analysis is worthwhile to evaluate differentiating features for use in patient diagnosis. This study aims to compare the 3-dimensional surface morphometric features between ULS and DP to provide improved diagnostic and outcome measures.
Methods
3D photogrammetry craniofacial images of ULS and DP patients were retrospectively analyzed after institutional review board approval by the University of Texas Southwestern Medical Center. Exclusion criteria included syndromic craniosynostosis and other craniofacial malformations. All images were collected pre-operative using 3dMD imaging systems (3dMD, Atlanta, GA). Craniometric measurements and landmarking for surface composite images were performed using 3dMD Vultus (3dMD, Atlanta, GA).
The 2 diagonal transcranial distances were measured at 40° from the midsagittal plane. The cranial vault asymmetry index (CVAI) was calculated as the greater distance-lesser distance/greater distance × 100. The oblique cranial length ratio (OCLR) was calculated as greater distance/lesser distance × 100. The diagonal difference was calculated as the greater distance − lesser distance. The average and standard deviation were calculated for CVAI, OCLR, and DD. Statistical analysis between ULS and DP was performed using 2-sample unpaired student t-tests with statistical significance considered a value of P < .05.
3D morphological differences were calculated using previously described mathematical models. 23 A perfectly symmetric model with available left and right point correspondences generated from a 3D scan was used as a reference template to morph each subject’s 3D data. This step creates an index for all points of each 3D patients scan. 3dMD Vultus was used to place 25 landmarks on the template and each patient’s photorealistic texture image at recognizable anatomical locations. For each patient image, registration was performed through rigid translation and rotation to match the template. Then, the template was scaled in length, width, and height to best match each patient’s 3-dimensional image.
An additional 40 landmarks were constructed digitally and automatically placed on the head surface using radial reference lines emanating from the image center of the scan. 2 steps were used to deform the template to each subject’s 3-dimensional surface scan, allowing point correspondence between all 3D scans. The template was deformed using thin-plate-splines with the landmarks described earlier. The closest-point deformation was then performed for detailed pointwise deformation. These methods have been validated and described in detail in our previously published work. 23
The ULS and DP groups were compared to respective age and gender-matched control groups. Patients with left-sided pathology were mirrored to make all patients right-sided. After all patient and control scans were created using the template deformation method, we calculated the magnitude of 3D vectors from the center point of the head (midway between the tragi) to each point on the 3-dimensional surface. The differences in the magnitudes of 3D vectors between patients and age-matched controls were calculated. This process was repeated for each point on the 3D surface. The difference in value was color-coded and plotted on the 3D scan to generate a heatmap. Two heat maps were generated to represent the morphological difference between the ULS and DP groups and their respective controls. The areas of greatest difference are identified with color coding, with warmer colors demonstrating areas where ULS and DP patients show more projection and cooler colors demonstrating areas where they show more retrusion.
Results
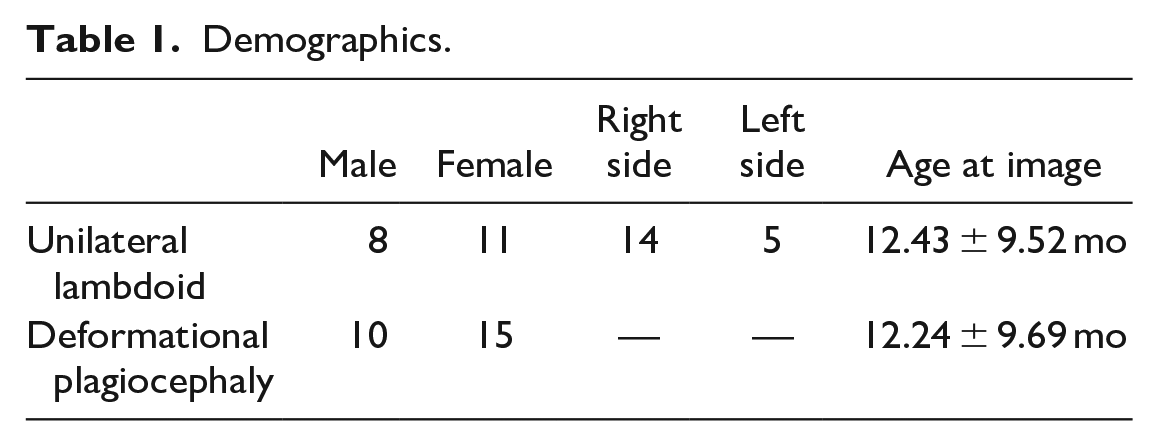
A total of 19 patients with ULS were available for analysis, with 14 right-sided and 5 left-sided lambdoid suture closures (Table 1). Twenty-five patients with DP were analyzed for comparison. CVAI was 6.35% ± 3.02% in the DP group, which was significantly greater than the CVAI in the ULS group; 4.28% ± 2.59% (Table 2). OCLR in the DP group was 106.89% ± 3.50%, exhibiting significantly greater asymmetry than the ULS group; 104.83% ± 2.19% (P < .05). The DD was not significantly different between DP (8.91 ± 4.37 mm) and ULS (7.40 ± 3.18 mm).
Demographics.
Cranial Vault Linear Measurements.
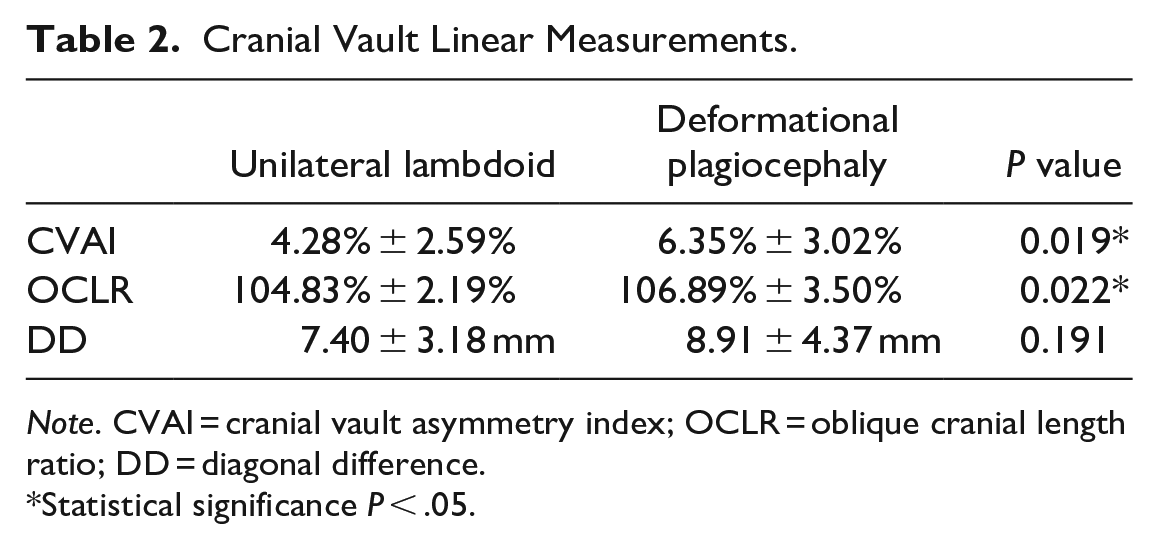
Note. CVAI = cranial vault asymmetry index; OCLR = oblique cranial length ratio; DD = diagonal difference.
Statistical significance P < .05.
Posterior Heat Map Assessment
Heat maps composites of the ULS and DP patients showed global assessment of the craniofacial form. The ULS heat map (Figure 1) showed retrusion in the ipsilateral occipital and posterior parietal areas. The respective location in the DP heat map (Figure 2) showed a similar form as controls. On the contralateral side in ULS, the maximal projection is more laterally focused on the posterior parietal area. The increased posterior projection extends medially into the occipital area in the DP composite.
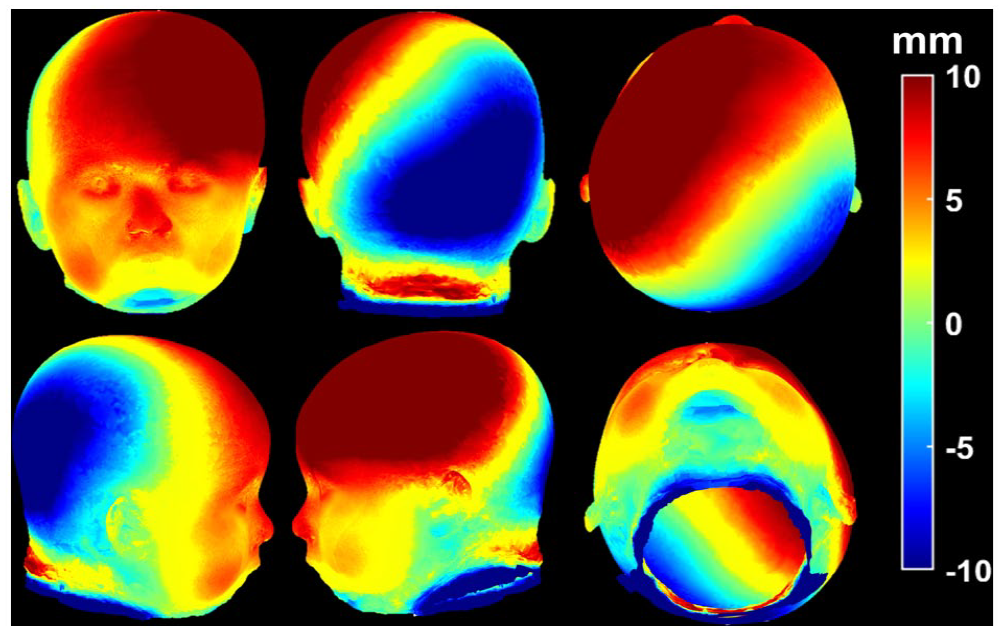
Unilateral lambdoid synostosis composite: Heat map showing the differences in craniofacial form between ULS and age-matched controls. Warmer colors indicate areas of projection in patients with ULS when compared to controls; cooler colors show areas of retrusion.
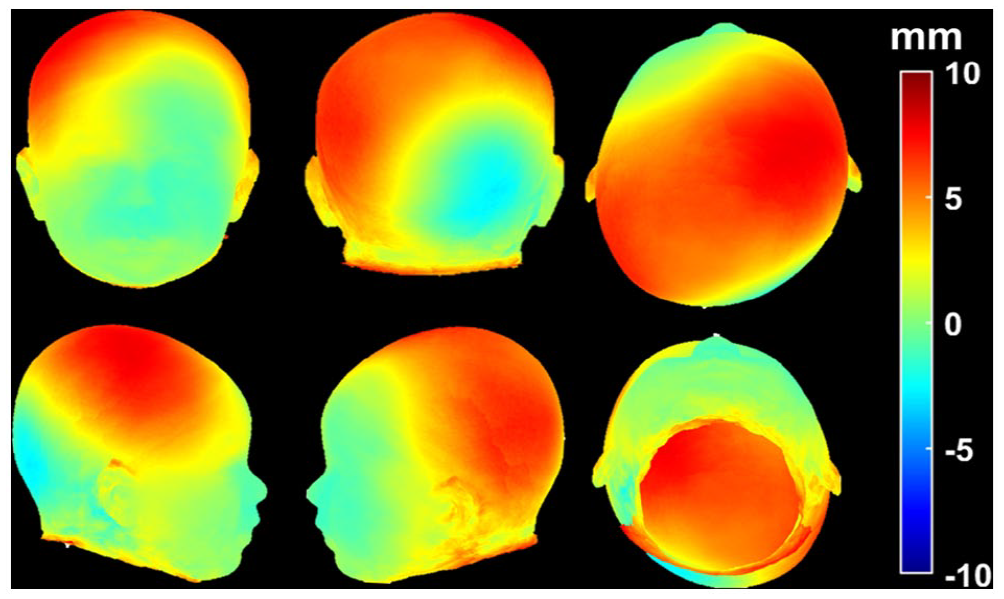
Deformational plagiocephaly composites: Heat map showing the differences in craniofacial form between DP and age-matched controls. Warmer colors indicate areas of projection in patients with DP when compared to controls; cooler colors show areas of retrusion.
Anterior Heat Map Assessment
The contralateral frontal area in the ULS patients (Figure 1) shows the greatest anterior projection, with the ipsilateral side showing moderate projection. In contrast, the DP heat map (Figure 2) shows the greatest anterior projection in the ipsilateral frontal area. The contralateral frontal area has similar form to controls. The ipsilateral mastoid in the ULS composite showed retrusion compared to controls but projection compared to the surrounding occipital region. These changes are not present in the DP composite. Most interestingly, facial projection and asymmetry are seen in the ULS patients while the DP facial area is spared.
Discussion
3D photogrammetry composite heat maps provide a reliable method for demonstrating the global features of ULS and DP. The posterior plagiocephalic appearance in both diagnoses is commonly caused by extrinsic forces and rarely due to fusion of the lambdoid suture. Since the introduction of the back-to-sleep campaign by the American Academy of Pediatrics to prevent sudden infant death syndrome, the rate of DP has increased.24-29 Reported rates have ranged between 19.7% and 46.6% depending on various demographic cofactors.25-29
Traditionally differentiation has been made with clinical diagnosis. However, similarity in features can lead to physicians missing underlying suture synostosis.5,6,12 Proper diagnosis is vital as ULS commonly requires surgical correction while DP improves with conservative management.1-3 The Argenta classification was designed to standardize clinical assessment but has been shown to not be a reliable system due to only moderate inter-rate reliability and repeatability.13-14
The deficiency in the clinical exam has led to the development of various measures to quantify craniofacial asymmetry. The variables included in the current study include CVAI, OCLR, and DD. These have been investigated previously and are used in clinical practice. 16 Various modalities have been utilized to collect these measures, including calipers, flexicurve, thermoplastic molds, 2-dimensional and 3-dimensional images, and CT scans.11,14-20 In our study, CVAI and OCLR had significantly more asymmetry in DP compared to the ULS. Aarnivala et al 16 determined that OCLR consistently provided the best measure of cranial asymmetry with a suggested cut-off value of >104%, which occurred in both groups. However, these measurements have limited descriptive potential since the quantification of asymmetry only occurs within a single plane and do not provide a global assessment of the cranial deformity. 16
Three-dimensional images capture surface data allowing for global assessment of the craniofacial form that linear measurements cannot provide.30,31 The image collection is also rapid, reproducible, and can be performed repeatedly over time to track patient outcomes without the concern for radiation exposure. 3D photogrammetry has previously been utilized to collect linear asymmetry measurements.15-20 Direct caliper cranial measures strongly correlate with these 3D photogrammetry-based measures. 17 Atmosukarto et al 20 evaluated 90 infants with diagnosed DP through 2-dimensional histograms extracted from 3D photogrammetry. They calculated posterior flatness score and asymmetry, which provided better sensitivity and specificity in discriminating DP from control patients than OCLR. 20
This study presents a novel method that provides a global view of the craniofacial morphology in ULS and DP using 3D photogrammetry composite heat maps. Future use of this technology could give diagnostic differentiation and long-term tracking of interventional outcomes. This study is the first step in developing automated machine learning 3D photogrammetry differentiation of ULS and DP. This would have the potential to advance clinical care by providing diagnostic accessibility in the general pediatric setting and improved accuracy in diagnosis by craniofacial specialists. However, future studies should assess the accuracy of disease detection.
Our findings are consistent with previously observed and measured values in ULS and DP patients.6-11 The ULS group showed retrusion in the ipsilateral occipitoparietal area, contralateral posterior parietal projection, contralateral frontal projection, and a relative ipsilateral mastoid bulge. There also appears to be facial protrusion and asymmetry in the ULS group. Facial asymmetry has previously been theorized by Smartt et al, 9 who believed that anterior displacement of the mandible on the ipsilateral side might lead to anterior displacement of the midface. The DP group had unilateral occipital projection and contralateral anterior projection. The contralateral occipital regions in the occipital and anterior areas remained equivocal to control patients. These findings contrast with the ULS group, where retrusion was seen contralateral to the occipital projection. Also, the projection was seen in both anterior regions in ULS, with the area of greatest projection being ipsilateral to the posterior projection. The DP patients did not see mastoid differentiation from the surrounding occipital-parietal region and no facial changes.
Conclusions
The demonstration of ULS and DP features is essential to provide accurate diagnosis and treatment interventions. Evaluating global craniofacial contours using 3D photogrammetry composite heat maps provides a rapid, reproducible, and reliable descriptive analysis. Features previously described by observation, linear measurements, and CT scans can be evaluated through 3D photogrammetry composite images.
Footnotes
Authors’ Note
Presented at (if applicable): None.
Declaration of Conflicting Interests
The author(s) declared no potential conflicts of interest with respect to the research, authorship, and/or publication of this article.
Funding
The author(s) received no financial support for the research, authorship, and/or publication of this article.
Ethical Approval
This study was approved and followed the guidelines set by University of Texas Southwestern Institutional Review Board (STU 032018-067).