
Abstract
For over 30 years, detailed personality-phenotype association profiles based on the NEO Personality Inventory (NEO PI) have been published, yet the phenotype profiles have been rarely linked across studies as has been done in brain imaging and genetics. Here, we apply a similar method to explore the similarities, differences, and healthfulness of various phenotypes regarding their NEO PI correlates. We systematically searched for profiles of NEO PI-phenotype correlations across various phenotype domains. Our initial dataset comprised 311 profiles from 90 papers. After standardising the metrics and meta-analysing similar profiles, the data was consolidated into 162 distinct phenotypes. Cluster analysis resulted in five broad cross-domain clusters, characterised by mental health strains, psychopathology dimensions, educational attainment, and health-related behaviours. Most clusters showed moderate deviation from an expert-rated ‘healthy’ personality profile. Furthermore, we replicated ‘personality correlations’, exploring the similarities between uncontrolled eating and addictive phenotypes, accounting for sample sizes of the profiles as well as the correlations among facets. Our findings demonstrate that comparing personality-phenotype profiles across studies offers novel insights and possibilities for theory-testing and exploratory comparisons.
Introduction
Personality psychologists have long published personality trait correlation profiles for various phenotypes. For example, many phenotypes have replicable associations with the Big Five personality traits (Soto, 2019) that sometimes predict outcomes decades into the future (Beck & Johnson, 2022). Often, these associations tend to be rather similar, with many health and success indicators having negative associations with Neuroticism and positive correlations with Conscientiousness. However, the profiles become much more detailed and varied when the Big Five are broken into narrower traits. For instance, the NEO Personality Inventory-Revised (NEO-PI-R) that assesses the 30 facets of the Big Five allows characterising phenotype personality trait correlates in greater detail (Mõttus et al., 2017a). As a result, nuanced differences between seemingly similar profiles can arise, enabling a better understanding of behavioural differences and similarities among different phenotypes. That is, distinct facet combinations can correspond to diverse outcomes, even when corresponding to the same combination of Big Five domains. These nuanced differences might exhibit important practical implications, such as for matching people to occupations that suit their personality profile (Anni et al., 2025) or for uncovering mechanisms underlying specific pathologies through detailed trait patterns (e.g., Krueger & Markon, 2006; Soodla et al., 2025).
Although hundreds of NEO PI facet personality profiles are publicly available, few have attempted to systematically compare them. There have been studies comparing personality-phenotype correlation profiles when studying spousal similarity, development, psychopathology, person-environment fit (Furr, 2010), or for cross-cultural comparisons (Allik et al., 2017; Vainik, Kööts-Ausmees & Mõttus, 2019). However, broader personality profile comparisons offer great value in translating theory-driven constructs into empirically testable frameworks. Methods such as California Adult Q-set (CAQ) prototype-matching - used to assess how closely an individual’s personality matches theoretically derived prototype profiles (Letzring et al., 2005) - and profile agreement indices (McCrae et al., 2001) have demonstrated the power of matching personality patterns to theoretically or clinically derived prototypes. McCrae and colleagues (2001) demonstrated that profile agreement indices correlate with both self- and clinical-rated personality disorder symptoms, highlighting personality profiles’ utility in generating hypotheses and informing interventions.
Two recent studies have directly compared personality-phenotype profiles. Vainik and colleagues (2020) used profile correlations to investigate the long-held theoretical suggestion that obesity has a similar behavioural basis to addiction and psychiatric disorders, which was, up until then, mainly proposed based on a handful of selected observations (Michaud et al., 2017). They correlated NEO Personality Inventory Revised/3 (NEO PI-R/3) (McCrae et al., 2005) profiles previously assessed in different samples to investigate the behavioural overlap between addiction phenotypes (alcohol, gambling, opiate use, smoking), psychiatric phenotypes and obesity phenotype, providing a framework for quantifying the behavioural similarities across many phenotypes. They found that obesity was behaviourally related to addiction phenotypes, but to a lesser extent than uncontrolled eating or addictions themselves. This work demonstrated that addictive features explain only part of the behavioural repertoire leading to obesity, which in turn gives practical information for targeting interventions aimed at reducing obesity or overeating. Another example is Revelle and colleagues (2021), who compared empirical and personality profile correlations within a single large-scale dataset. Applying techniques analogous to genome-wide association studies (GWAS) identifying single-nucleotide polymorphisms (SNPs) related to specific outcomes of interest, they demonstrated how large-scale investigation of personality items can independently enhance predicting of real-world behavioural outcomes beyond aggregated scales. However, both Revelle and Vainik addressed limited sets of phenotypes. To date, there have been no attempts to atheoretically link a wider range of published personality profiles.
Conversely, other research fields have hugely benefitted from cross-study comparisons of phenotypes mapped to common reference panels. For instance, genetic correlations have become a standard method used to identify genetic overlaps between various complex traits and diseases mapped with genome-wide association studies in very different datasets (Bulik-Sullivan et al., 2015; epigraphdb.org; Liu et al., 2021). This has provided etiological insights that have helped to prioritise likely causal relationships between phenotypes (e.g., genetic correlation between anorexia nervosa and schizophrenia, autism and education) (Bulik-Sullivan et al., 2015). Similarly, in brain imaging, brain profiles of numerous psychiatric disorders and normal development have been compared to investigate the possible development and psychopathology (Markello et al., 2022; Cao et al., 2022; neurorynth.org; Yarkoni et al., 2011). This has revealed new disorder-specific and transdiagnostic patterns of neurodevelopmental disorders. These insights in genetics and brain imaging depended on systematically comparing data from multiple datasets through a standardised framework. There may be similar value in comparing personality profiles across a standardised reference panel – a shared questionnaire.
Here, we expand this approach to a broad range of personality trait correlation profiles of phenotypes measured in different datasets over decades of personality research. Based on a systematic literature search for published NEO PI personality profiles using atheoretical hierarchical cluster analysis, we mapped whether and how different phenotypes tend to cluster based on shared trait profiles. To understand how these personality profile clusters associate with a desirable (‘healthy’) personality, we further mapped the clusters to an expert-consensus healthy personality profile (Bleidorn et al., 2020).
In this process, we also advanced the statistical methodology for applying personality profile comparisons. Various metrics have been used to report personality profiles, which we aimed to standardise to a single and easily interpretable metric. Furr (2010) has emphasised that profile similarity comprises distinct components (elevation, scatter, shape) that should be considered for distinguished comparisons, yet concluding that Pearson correlation proves the best when primary interest lies in comparing shape or pattern of traits across profiles. Since we aimed to give a broad overview of the similarities in personality profile patterns, we followed this approach by standardising all the profiles to a correlation coefficient, as has been done in previous attempts at profile comparisons as well (Revelle et al., 2021; Vainik et al., 2020). However, the standard errors/p-values of the correlations need to consider the varying sample sizes of the datasets from which different profiles have been obtained. This has not been previously done in attempts at personality correlations. Moreover, the intercorrelations between NEO PI-R facets (Costa & McCrae, 1992) have not been accounted for either. Here, we sought to overcome these limitations and reanalyse data from Vainik et al. (2020) to compare the obesity and addictive phenotype profiles, adjusting for these statistical considerations.
In summary, we present a systematic scan of the most prominent phenotypes in the personality psychology literature across decades, exploratively clustering these profiles and comparing them to an expert-rated ‘healthy’ personality profile and replicate the profile comparisons of Vainik and colleagues (2020) using more robust statistical approaches.
Methods
Personality profiles of phenotypes
NEO Personality Inventory Revised (NEO PI-R) and its updated version, NEO PI-R 3 (Costa & McCrae, 1992; McCrae et al., 2005), are among the most widely used personality instruments that comprehensively measure the Five Factor Model of personality. It consists of 30 eight-item facet scales for each of the five personality factors (Xie & Cobb, 2020): Neuroticism (N) describes the general tendency to experience negative affect, Extraversion (E) describes the general tendency to stimulation and excitement, Openness (O) describes the tendency to explore novel ideas and intellectual curiosity, Agreeableness (A) is primarily a dimension of interpersonal tendencies, and Conscientiousness (C) describes the level of self-control and goal-directed behaviour. The NEO-PI personality profile of a phenotype presents the pattern of associations this phenotype (e.g., smoking status) has with these 30 facets. Personality has been reliably associated with many life outcomes (e.g., subjective well-being, religious beliefs, risky behaviour etc.) (Roberts et al., 2007; Soto, 2019), and detailed personality-phenotype association profiles using NEO PI profiles have been published for over 30 years, describing the way different phenotypes relate to the Big Five traits or more specialised facets of personality.
Search for personality profiles, inclusion and exclusion criteria
To create a dataset of phenotypes including facet-based information, we systematically collected NEO PI personality profiles from different papers across research domains using two databases (Google Scholar and Web of Knowledge in June 2018). From Web of Knowledge, we searched for papers citing the original manuals of NEO PI-R and NEO PI-3 and filtered based on the word “facet*” in topic. Similar approach could not be used in Google Scholar, as it led to too many results. Instead, we used a specific facet name from each of the five domains. Facet choice was based on the least amount of hits, which should lead to the most specific NEO PI-related results. For instance, “Anxiety” would have been a very unspecific search term. The narrower keywords for each facet that we ended up with were: “Angry hostility” (N2), “Gregariousness” (E2), “Aesthetics” (O2), “Tender-mindedness” (A6), and “Dutifulness” (C3). The personality profiles were then extracted to a pre-prepared sheet (available in OSF page). Both YW and UV coded the first 10 profiles, and any differences in coding were discussed between the authors. After that, YW coded the rest of the papers. As a result, our initial dataset included 311 profiles from 90 papers.
Personality profiles initial dataset characteristics

Conversion of the statistics
Conversion methods of the statistics

aFunction tsum.test from R package BSDA was used.
bFunctions tes and des from R package compute.es was used. This package uses recommended formulas as described in The Handbook of Research Synthesis and Meta-Analysis (Cooper et al., 2019).
cFunction oddsratio_tor from R package effectsize was used. This package implements formulas based on Borenstein et al. (2021). Converting among effect sizes. Introduction to meta-analysis, 45-49.
Nineteen papers had reported personality measures in M and SD/SE statistic, based on which we calculated r-statistics in one of the three ways. If the paper already included a control group (n = 10 papers) for the phenotype of interest, we calculated the r-statistic based on a t-test between the two profiles. This means that some profiles from the initial dataset were collapsed into one profile based on their comparison (e.g., initially two profiles of CEOs and CEOs working abroad were transformed into one profile ‘CEOs working abroad’ since the crucial aspect of this personality profile is to compare the personality differences in terms of working abroad or not). In other cases, the t-tests were run between the different phenotypes of interest presented in the original paper (e.g., former, current and never smokers all against each other) (n = 4 papers). In case the paper included only one phenotype information (n = 5), we calculated the t-statistic comparing the personality data to the standard norms or raw norm scores of NEO PI-R (Barto et al., 2011; Costa & McCrae, 1992). The effective sample size for all t-test-based studies was estimated according to the formula 2 x (N1 x N2)/(N1 + N2). We derived this formula from the property of additivity of variances of independent variables, and the fact that sample variance is inversely related to its sample size N. This approach avoids inflation of sample sizes, especially in the case where we contrasted phenotypes with NEO PI-R norms, where often a small case N1 was contrasted against the standard norm of N2 = 1000 control group.
Meta-analysis of similar profiles
As some profiles are more represented in the personality literature, our literature-wide search resulted in several profiles of the same phenotype from multiple papers: Alzheimer’s disease, obsessive-compulsive disorder, major depressive disorder, smokers (former, current, never), post-traumatic stress disorder, eating disorder (anorectic and non-anorectic), social phobia, (pathological and non-pathological) gamblers and personality disorder. In all cases, we meta-analytically merged them into one meta-profile, using the same methods as describe previously in Vainik et al. (2020).
Cluster analysis and cluster comparisons
After preprocessing the profiles’ dataset (see Figure 1), we were left with 162 unique phenotype profiles from 64 papers (which can be found in Supplemental Materials on OSF page). To explore potential underlying similarities of the most-represented phenotypes in the personality literature, we ran a hierarchical cluster analysis as an alternative to factor analysis, which requires the number of observations (in our case, the personality facets) to exceed the number of items (in our case, the phenotypes). For example, hierarchical cluster analysis has proven to be an effective method for grouping items (Revelle, 1979). It achieves this by iteratively reassessing the reliability of each cluster using alpha (the mean split-half correlation) and beta (the worst split-half correlation) coefficients as estimates of internal consistency and general factor saturation of the test. We ran the cluster analysis using the ‘iclust’ function from the “psych” R package (Revelle, 2023), implementing default alpha and beta values (3 and 1, respectively). Flowchart of the preprocessing of personality profiles dataset. Abbreviations: ALZ = Alzheimer’s disease; OCD = obsessive-compulsive disorder; GMB = gamblers; MDD = major depressive disorder; SMK = smokers; PTSD = post-traumatic stress disorder; PD = panic disorder; Ed = eating disorder; SP = social phobia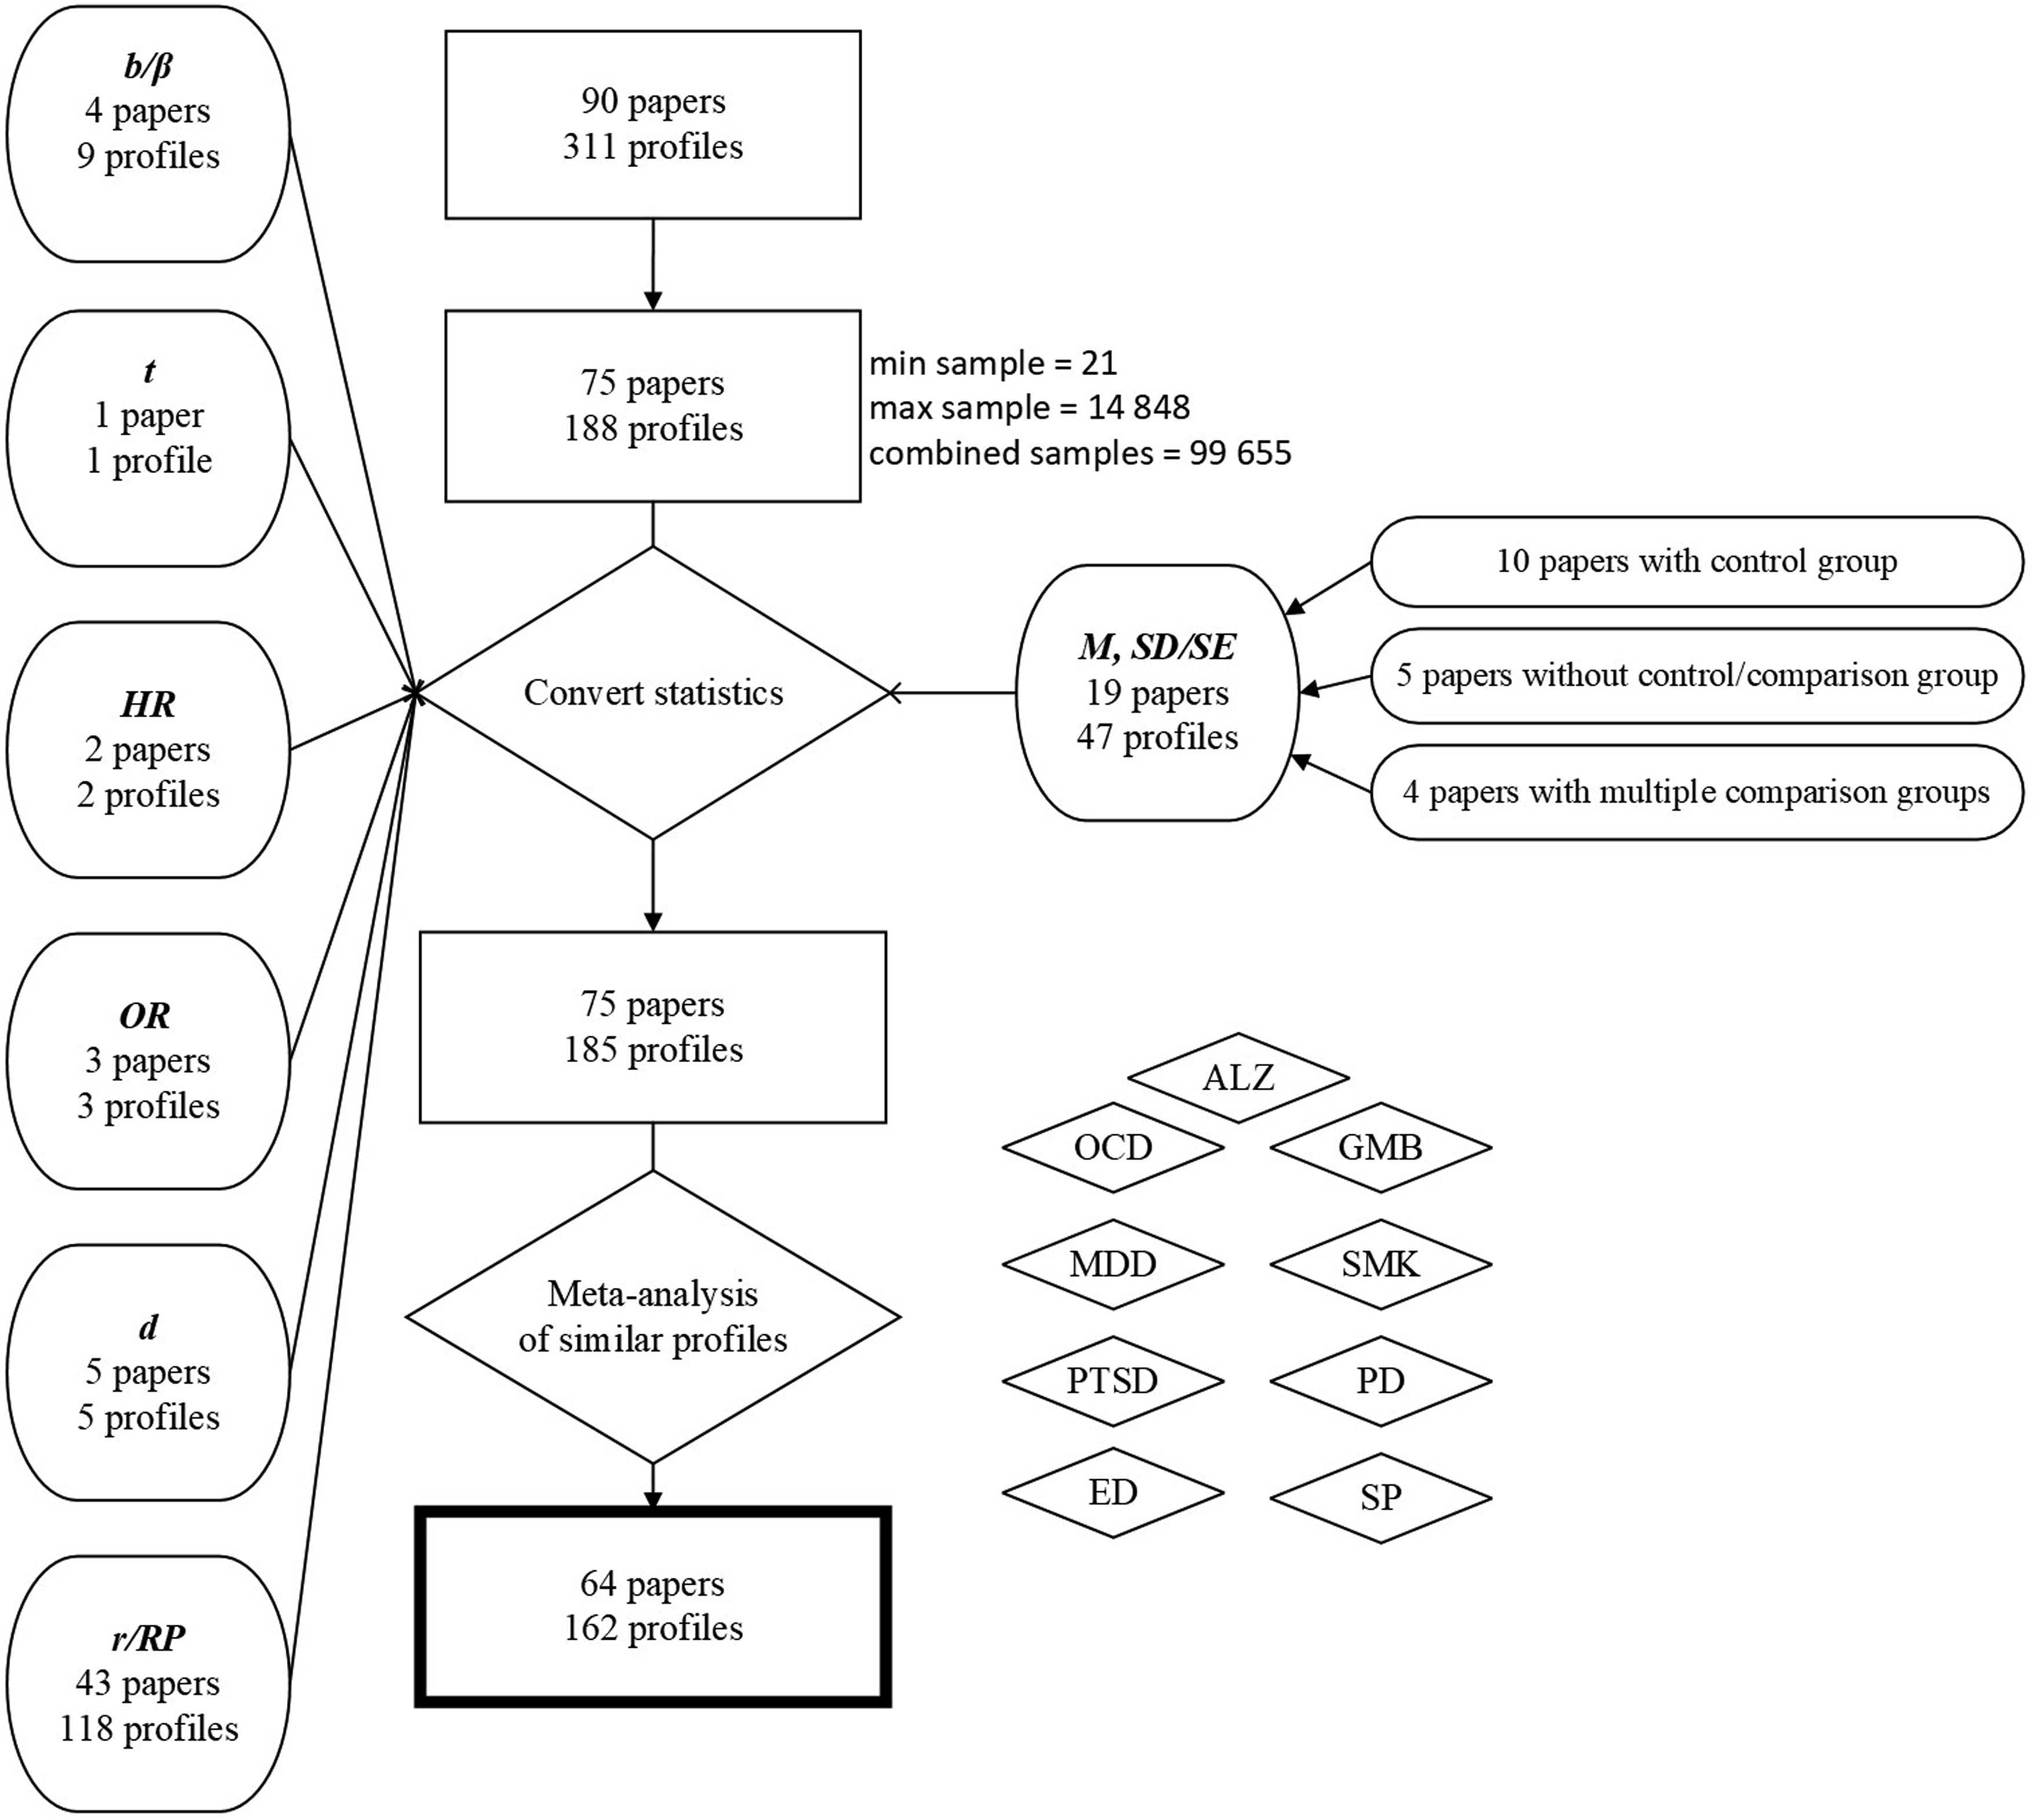
To better describe each cluster, we computed an average NEO PI personality profile of each cluster by calculating average values for each facet within the cluster (see Supplemental Table 3). Before averaging, we scaled each profile to have a mean of 0 and an SD of 1, to avoid profiles with a larger average effect size (e.g., personality-depressive r = 0.23) dominating other profiles with a smaller average effect size (e.g., personality-underweight r = 0.02). Since clusters also included profiles with negative loadings, we reversed these profiles before the averaging.
To compare the most-represented personality profile clusters to an expert-rated ‘healthy’ personality profile (Bleidorn et al., 2020), we used the facet-based personality data from their paper, calculated Cohen’s d effect size for each facet by comparing the data from the paper on normative vs expert-rated ‘healthy’ profile, and then correlated those with cluster averages in each of the personality facets.
Statistics of profile comparison
A further challenge is accurately calculating appropriate standard errors and p-values while also considering the NEO PI intercorrelations. The first issue is that correlations across 30 facets implies that sample size n = 30, whereas the original personality profile may be based on either a few dozen or thousands of participants. Analyses comparing profiles from different datasets have ignored this source of variance in accuracy. The second issue is that personality facets are not independent of one another, whereas a key assumption in estimating the uncertainty in correlations is independence of observations. For instance, facets of Neuroticism are often intercorrelated, as are facets within other Big Five domains. Neuroscience have countered that by developing the ‘spin test’: when comparing brain profiles that are spatially correlated, they are bootstrapped on a sphere that approximates the anatomical realities of the brain (Alexander-Bloch et al., 2018).
To overcome these problems, we compared the empirical correlations between profiles with those emerging from random datasets mimicking the correlational structure of NEO PI-R facets (we simulated 5000 of these datasets). At the first step, 30 random normally distributed variables (using the R base function ‘rnorm’) were created with a given sample size (corresponding to the sample size in the original study from which the profile was obtained) to represent the personality facets. At the second step, the transposed data matrix was pre-multiplied by the transpose of the upper triangulation factor of the Cholesky decomposition (obtained with the R base function ‘chol’) of the correlation matrix of the NEO PI-R facets (Costa & McCrae, 1992), and transposed the result. This results in a data matrix with a correlation structure approaching a given structure. The above-described method based on Cholesky decomposition was first described by Scheuer and Stoller (1962) and is nowadays routinely used for generating random data with a given correlation structure (e.g., in the R package rmvtnorm, Genz & Bretz, 2009). In a third step, correlations between each pair of profiles were compared against the distribution of correlations of 5000 randomly generated profiles, and a p-value was obtained as the proportion of times the simulated value (taken to represent the null distribution) was larger or equal to the empirical correlation.
We ran profile comparisons using these statistically more robust approached to replicate Vainik and Colleagues’ (2020) profile comparisons on the same exact data on obesity, uncontrolled eating, and addictive phenotypes, with education and gender as control phenotypes.
Data availability statement
The datasets generated during the current study, and the code for running all the analyses described here are publicly available on the project’s OSF page.
Results
Cluster analysis and cluster comparisons
After pre-processing and filtering the data, we were left with 162 distinct phenotypes which showed a high degree of clustering (Figure 2). The cluster analysis grouped them into 8 distinct clusters. Since hierarchical item-cluster analysis assigns each item to a single cluster, some output clusters were relatively small, containing only 4 to 7 phenotypes, while largest cluster encompassed 56 phenotypes. Personality profiles correlation matrix of all the standardised phenotypes (n = 162). Note: The phenotypes here are ordered according to their cluster loadings as in the Supplemental Table 1. A PDF version of this figure, optimised for readability, is available in the Supplemental Materials
The five largest clusters comprised 144 profiles, capturing the majority of the NEO PI personality profiles literature – 89% of our dataset. Interestingly, these biggest clusters can all be described by very high variation in Neuroticism levels (both within the domain and between the clusters), while having low variation in Agreeableness levels (see Figure 3). We hereby provide some examples of phenotypes included in each cluster, but a comprehensive list of all the phenotypes and their cluster loadings can be found in the supplements (see Supplemental Table 1 and Supplemental Table 2). Average facet-based personality profiles of the larger clusters. Note: Y-axis represents correlations that are standardised within each cluster to have a mean of 0 and an SD of 1 and then averaged across phenotypes in this cluster. See section Cluster analysis and cluster comparisons for more details. Number of phenotypes in each cluster: Cluster 1 = 56; Cluster 2 = 31; Cluster 3 = 22; Cluster 4 = 19; Cluster 5 = 16
The largest cluster (n = 56 profiles) included most of the psychopathological phenotypes (such as depression, OCD, panic disorder, PTSD, anxiety disorder, social phobia, agoraphobia, eating disorders, alcohol and substance abuse, self-injury and suicidal ideation) as well as other phenotypes related to negative affect, detachment, distrust, and passive-aggressiveness (e.g., chronic illness burden, child molesters etc.). We summarised these phenotypes as a ‘burdensome and distressed’ cluster as it also exhibits the highest values for Neuroticism, especially Anxiety, Depression and Vulnerability facets. The second-largest cluster (n = 31 profiles) included phenotypes such as egocentric and antagonistic factors of personality disorders, narcissism, grandiose, fearless dominance, manipulative and mischievous psychopathic factors, sexually transmitted disease history, argumentativeness and verbal aggressiveness, but also creativity and autonomy of personal wellbeing scale. Religious phenotypes, sexual disgust and forgiveness phenotypes were among the ones with negative loadings to this cluster. This cluster of mainly ‘egocentric impulsivity’ was characterised by high scores in Angry hostility, Impulsiveness, Assertiveness and Excitement seeking, but also in most of the Openness facets, while having the lowest Agreeableness levels. The third cluster (n = 22) represents Machiavellianism-like phenotypes as well as impulsive and callous and antisocial features of personality disorder, drug abusers, heavy drinkers, smokers, gamblers, metabolic syndrome patients, solitude depression and procrastination. It differs from the previous clusters mainly in terms of its antisociality and includes most of the addictive phenotypes. This ‘antisocial and addictive’ cluster scores highest in Excitement seeking and Impulsivity facets and has the lowest Conscientiousness scores. These three clusters comprised 67% of the phenotypes in our dataset.
Cluster 4 (n = 19 profiles) comprised phenotypes of compulsive and paranoid factors of personality disorder, medical school persisters’ GPA, pathogen disgust, multiple perfectionism scales, avoidance and anxiety behaviours in friendship, prejudice. This cluster of ‘distressed perfectionists’ was described by low levels of Warmth, Positive emotions, and high levels of Anxiety, Vulnerability, Dutifulness, and Deliberation. Cluster 5 (n = 16 profiles) differs most from other larger clusters as it can be described by very low levels of Neuroticism, but high levels on Extraversion and Conscientiousness. This cluster includes profiles of CEOs, education, high GPA, commitment-making identity dimensions, and purpose in life. Interestingly, it also includes argumentativeness phenotype. We summarised this as a cluster of ‘purposeful achievement-strivers’ with especially high average values of Assertiveness, Ideas, Competence, Achievement striving, and Self-discipline facets.
Small clusters comprised only four to seven phenotypes and are hence harder to generalise. Cluster 6 (n = 7 profiles) included a phenotype of high hypnotic susceptibility, but also health habits and health behaviour aspects of hypochondria, political studies students’ higher GPA, exploration in depth identity dimension, and gender differences. The average profile of this cluster was characterised by lower levels of Neuroticism, especially Angry hostility, and higher levels of Conscientiousness, especially Order and Self-discipline. This cluster had an extremely low Excitement seeking score and could be labelled ‘self-disciplined and health-aware’. Cluster 7 (n = 7 profiles) encompasses leisure-time activity categories of challenge skills, intrinsic rewards, social interactions, feel good and active engagement from one paper (Barnett, 2013), and interestingly, a BMI phenotype. So, these leisure-time phenotype measures differ enough from other phenotypes in the literature and comprise their own ‘leisure time activities’ cluster that is especially high in Positive emotions, Altruism, Impulsiveness, and Achievement striving, but rather low in Values facet. Cluster 8 (n = 4 profiles) includes positive loadings of odour identification scales, and negative loadings of cold pressor pain intensity and former smokers’ phenotype (Figure 4). Average facet-based personality profiles of the smaller clusters. Note: Y-axis represents correlations that are standardised within each cluster to have a mean of 0 and an SD of 1 and then averaged across phenotypes in this cluster. See section Cluster analysis and cluster comparisons for more details. Number of phenotypes in each cluster: Cluster 6 = 7; Cluster 7 = 5; Cluster 8 = 4
Correlations between clusters and a healthy personality profile
These clusters also correlated, with clusters 1 and 6 being the most intercorrelated. This further suggests that many phenomena that NEO PI has been used to characterise are rather similar at the personality profile level. The strongest was the negative correlation between the biggest cluster of ‘burdensome and distressed’ phenotypes to the cluster of ‘purposeful achievement-strivers’. This implies the opposing tendencies of the phenotypes included in those clusters that could be explained by their general desirability in society: while cluster 1 included most of the pathological phenotypes, cluster 5 included mainly educational attainment-related as well as purpose in life phenotypes. Conversely, three of the biggest clusters had moderate correlations with each other, indicating a common tendency for the representation of undesired personality patterns of the phenotypes involved.
Half of the clusters showed negative correlations with the expert-rated ‘healthy’ personality profile – three of these were moderately negative, while the others showed only a weak or negligible correlation (see Figure 5). Two clusters showed moderate positive correlations with the ‘healthy’ profile (clusters 5 and 6), with the ‘health-aware’ cluster having the highest correlation (r = 0.54). NEO PI personality literature cluster correlations with expert-rated ‘healthy’ personality profile. Note: No p-value is estimated here. Cluster names: Cluster 1 – Burdensome & distressed; Cluster 2 – Egocentric & impulsive; Cluster 3 – Antisocial & addictive; Cluster 4 – Distressed perfectionists; Cluster 5 – Purposeful & achievement-striving; Cluster 6 – Health-aware; Cluster 7 – Leisure; Cluster 8 – Misc
Re-analysis of Vainik 2020 facet matrix
We then reanalysed the facet profile correlation matrix of Vainik et al. (2020) on obesity and uncontrolled eating behavioural similarity to addictive phenotypes, using more robust statistical methods to take different sample sizes and personality facet intercorrelations into account. The main results replicated, so that obesity shows moderate and significant correlations with addictive phenotypes, but is not related to the profiles of phenotypes intended as controls (see Figure 6). Obesity and Uncontrolled Eating phenotype comparisons to addictive phenotypes. Note: Crosses stand for non-significant p-values obtained using the simulation method. Horizontal lines highlight the addictive phenotypes. Abbreviations: OB = obesity; UE = uncontrolled eating; ALC = alcohol; SMK = smoking; GMB = gambling; GMB. A = gambling with attention deficit hyperactivity disorder; OPI = opioid abuse; THC = cannabis; EDU = education; GEN = gender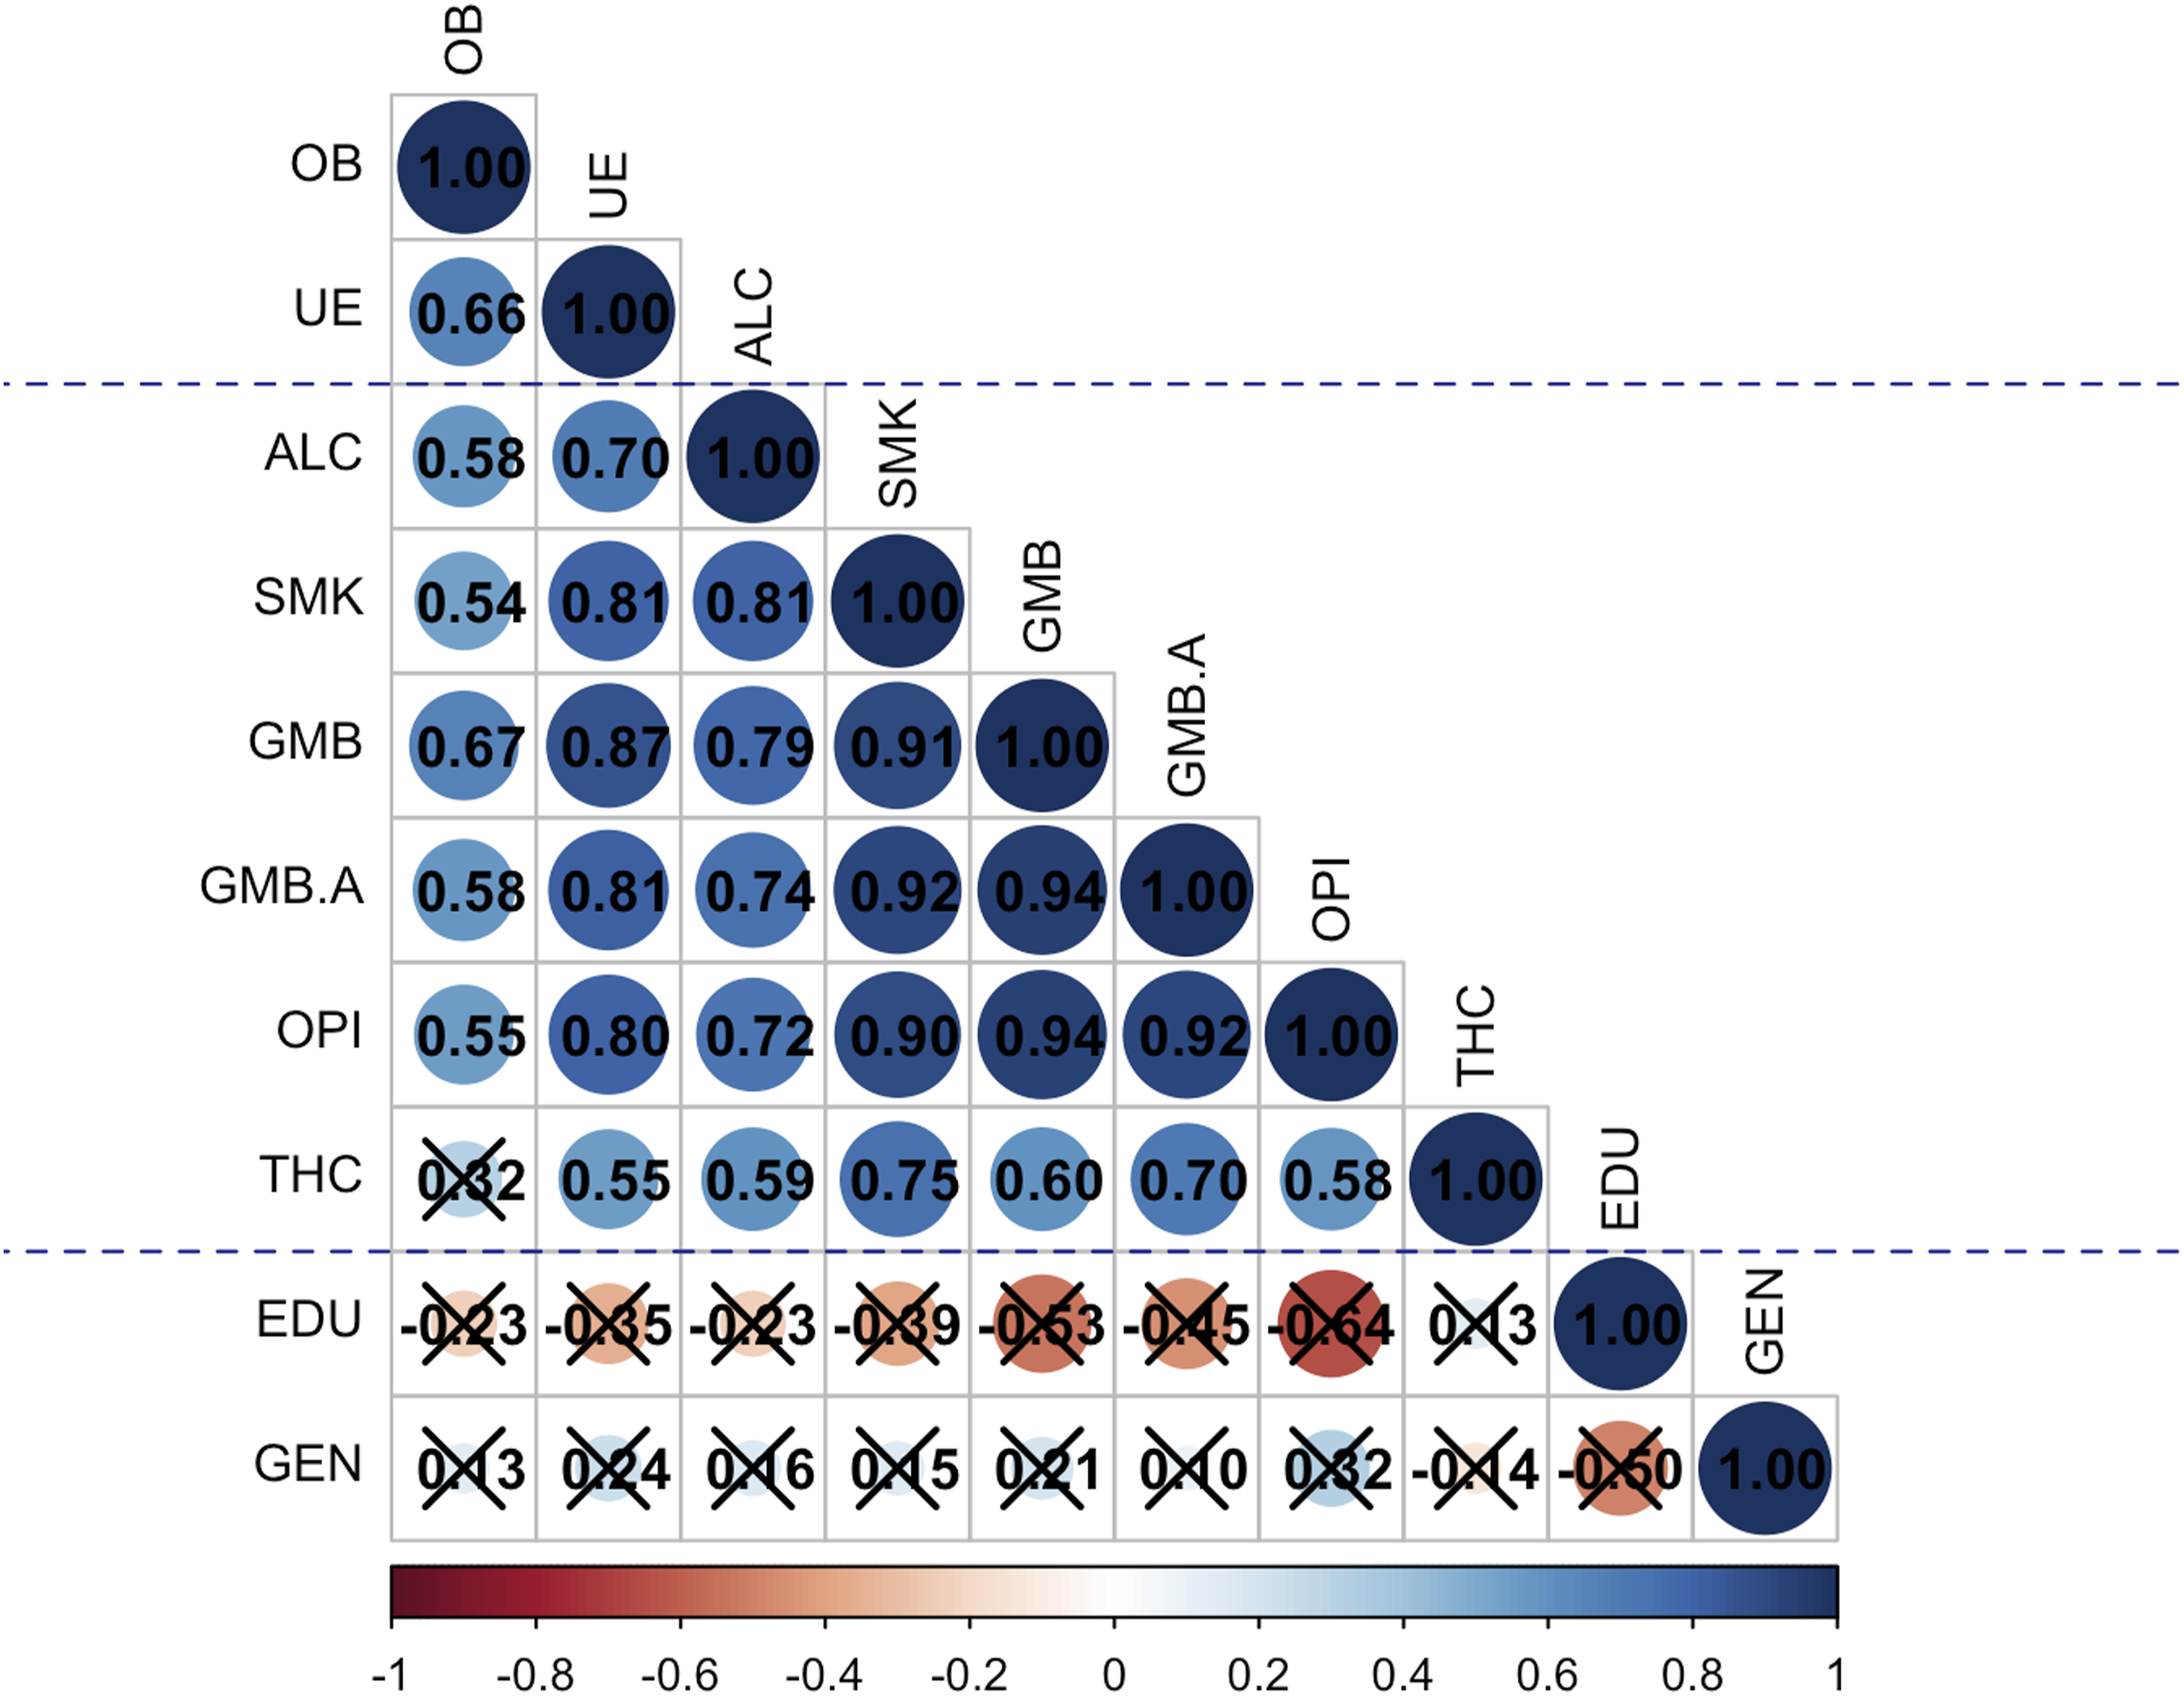
Discussion
Here, we provided a literature-wide characterisation of NEO PI personality profiles. 89% of 162 distinct phenotypes clustered into five major groups, indicating notable consistency in how different phenotypes align with NEO PI personality patterns. The remaining 11% of the phenotypes formed three smaller clusters, highlighting meaningful variation that may reflect underrepresented or unique phenotypes in the literature. The clusters’ uniqueness was outlined by their differing associations with an expert-defined ‘healthy’ personality profile (Bleidorn et al., 2020), illustrating how certain traits systematically diverge from or align with socially and psychologically adaptive patterns. In addition, we introduced and tested a robust statistical method for comparing phenotypic personality profiles, successfully replicating earlier findings. This empirical mapping of the landscape of personality-phenotype associations, combined with our methodological framework, allows for new possibilities of both theory-driven hypothesis testing (e.g., as a given example of obesity and addictions) and exploratory insights (e.g., personality profiles as latent factors explaining a cluster of phenotypes).
Clusters of the most represented profiles in the literature
Almost 70% of the phenotypes in our dataset clustered into three large groups that diverged most from a desired ‘healthy’ personality profile (Bleidorn et al., 2020). The largest cluster includes a range of burdensome phenotypes described by detached, passive-aggressive tendencies – suggesting negative affectivity and vulnerability as core dimensions across many maladaptive behaviours. The second-largest cluster is characterised mainly by egocentric and impulsive excitement-seeking tendencies, while the third-largest cluster captured mainly addictive phenotypes with antisocial features. Therefore, most of the published phenotypes in the personality literature over the decades have mainly focused on either internalising or externalising problems, confirming the work by Krueger and Markon (2006). In contrast, a range of healthy or more normative phenotypes have been less represented in the literature. A more nuanced representation and understanding of health-related personality profiles could aid in developing and targeting personalised interventions for behaviour change, particularly in health or occupational settings (O’Connor, 2020; Wright & Jackson, 2023; Takahashi et al., 2013; Anni et al., 2024). A similar suggestion was made by Ahola et al. (2024), who identified five distinct personality profiles related to different patterns of physical activity and sedentary behaviour, highlighting the potential of tailoring health interventions – such as selecting appropriate behaviour change strategies – based on underlying personality patterns. Since facet- and item-level profiles allow for more nuanced differentiation between phenotypes (Mõttus et al., 2017b), future research should focus more on measuring and investigating a broader range of facet- and item-based healthier phenotypes as well (e.g., clustering of health behaviour or habit-based profiles, occupations, political views, values, volunteer- and leisure time tendencies, etc.).
Cluster relations to a healthy ‘desired’ personality profile
Only two clusters showed moderate positive correlations to the expert-defined healthy personality profile. Among the largest clusters, the only one similar to the ‘healthy’ profile was that of ‘purposeful and assertive achievement-strivers’ (cluster 5), which included phenotypes of educational attainment and CEOs. However, the cluster most strongly aligned with the healthy profile overall, was that of ‘self-disciplined and health-aware’ phenotypes (cluster 6) who excel in self-management while avoiding risky behaviour. This cluster included gender differences phenotype, obtained from a paper (de Bolle et al., 2015) representing the differences in personality scales based on males subtracted from females, so a female-positive profile. Based on this, females generally seem to display a healthier personality profile than male. Notably, this cluster also included the only health behaviour-related phenotypes in our dataset: health habits and health behaviours subscales of hypochondria assessed by the Illness Attitudes Scale (Cox et al., 2000). This may explain this clusters’ higher correlations with the ‘healthy’ personality, and highlights a need for more versatile health behaviour-related profiles. The strong negative correlation between clusters 1 and 5 points to an underlying axis of social functioning, underscoring how personality profiles may reflect broader dimensions of adaptation and desirability.
Profile comparisons with robust statistical framework
Applying Cholesky decomposition, we overcame the problems of varying sample sizes and intercorrelations of facets when comparing phenotypes from different samples. This more robust statistical method successfully replicated the core findings from Vainik et al. (2020), showing moderate but significant correlations between obesity and addictive phenotypes, but nonsignificant findings between obesity and control phenotypes. In the future, similar robust profile comparisons can be done to compare any of the phenotypes of interest from our profiles dataset to any other publicly available personality profiles from the literature, to validate or test an observational or theoretical idea. Further, the approach should also be applicable to item-level profiles, e.g. Revelle et al. (2021).
Limitations
Our dataset was constructed based on a systematic search for personality profiles in 2018, thus excluding more recent prominent profiles in the literature. However, since we aimed to give a broad overview of the most represented phenotypes studied in the field over many decades, this limitation is unlikely to significantly affect the main conclusions. Still, we encourage updating the dataset by renewed search for phenotype profiles, which is made possible by our open-access data, publicly available on the OSF platform, which allows anyone to rerun the analysis with an updated dataset.
Additionally, this work includes only personality profiles based on the NEO inventory, providing a somewhat skewed estimate of the broader landscape of personality profiles. We are further limited to profiles that previous researchers have chosen to study. However, as this work represents the first attempt in systematically mapping and comparing pre-published profiles, the proposed framework can be readily extended to other personality measures in future research.
We also acknowledge that the smaller clusters identified in our analysis are highly specific and hence not too generalisable to the literature. Since item-cluster analysis forces each phenotype to exactly one cluster, these phenotypes in small clusters could be interpreted as dataset outliers. On the other hand, this can give some suggestions on the more distinguishable profiles represented in the field and what type of phenotypes are underrepresented, and aid future research ideas.
Finally, our profile analysis focused on facets. While offering greater specificity than domains, facets are less detailed than nuances (Stewart et al., 2022). As nuance-based profiles become more widely available, our framework can be used to compare them as well, likely providing even more detailed insights.
Summary
We hereby expanded the efforts to compare personality profiles by compiling the most prominent publicly available NEO PI-based profiles into one dataset and converting them to the same metric. This framework provides a new tool for personality psychology research, allowing for theory-driven hypothesis testing (e.g., confirming shared underpinnings of vulnerable phenotypes) as well as explorative analyses of common latent pathways, as has been done in genetics and brain imaging research. By doing this, we also gave an overview of the most represented phenotypes in the last decades of personality psychology research, concluding that a high majority of the profiles are strongly opposite to the expert-rated ‘healthy’ profile. This highlights the personality literature’s focus on pathological and problematic phenotypes and the lack of more nuanced and versatile representations of healthier or normative phenotypes. We also introduced and tested a robust statistical approach for accurate profile comparisons that can be used in future research comparing phenotypes from any datasets. The methods and steps we outlined and tested here constitute a novel approach for applying large-scale personality correlations to any phenotypes of interest that have publicly available facet-based personality profiles.
Supplemental Material
Supplemental Material - Unity and Diversity of NEO-PI Personality Profiles of 162 Phenotypes
Supplemental Material for Unity and Diversity of NEO-PI Personality Profiles of 162 Phenotypes by Kerli Ilves, Yueh en Wang, Kenn Konstabel, Ants Adamson, Kersten Kõrge, Aire Raidvee, Alain Dagher, René Mõttus, Uku Vainik in Personality Science.
Footnotes
Author Note
Cristian Zanon was the handling editor.
Acknowledgements
Parts of this work were written at writing retreats organized by The University of Tartu Institute of Genomics and The Estonian Doctoral School for Natural and Agricultural Sciences (2021-2027.4.04.24-0003), co-funded by the European Union as well as at writing retreat by Estonian Centre of Excellence for Well-Being Sciences, funded by grant TK218 from the Estonian Ministry of Education and Research.
Author Contributions
Not applicable.
Funding
The authors disclosed receipt of the following financial support for the research, authorship, and/or publication of this article: This work has been funded by Estonian Research Council’s personal research funding return grants MOBTP94, start-up grants PSG656 and PSG759, and Estonian Research Council’s team grant PRG2190.
Declaration of Conflicting Interests
Not applicable.
Data Availability Statement
Supplemental Material
Supplemental material for this article is available online. Depending on the article type, these usually include a Transparency Checklist, a Transparent Peer Review File, and optional materials from the authors.
Notes
References
Supplementary Material
Please find the following supplemental material available below.
For Open Access articles published under a Creative Commons License, all supplemental material carries the same license as the article it is associated with.
For non-Open Access articles published, all supplemental material carries a non-exclusive license, and permission requests for re-use of supplemental material or any part of supplemental material shall be sent directly to the copyright owner as specified in the copyright notice associated with the article.