
Abstract
Purpose:
The purpose of this study was to determine the impact of a pharmacist-managed transitions of care (TOC) clinic on outcomes in a posthospitalization population with diabetes.
Methods:
A retrospective single center cohort study utilized electronic health records to identify discharged patients followed by the inpatient endocrinology team. The primary outcome was 30-day readmission rates in the target population. Secondary outcomes include 90-day readmission rates, time to first follow-up, emergency department/urgent care encounters, change in A1C, retention with endocrinology, referrals for diabetes education, and types of interventions. The control group included patients prior to the initiation of the TOC clinic compared to patients seen in the TOC clinic, evenly matched by A1C. Readmission rates and other clinical data were queried up to 4 months after discharge.
Results:
Patients in the TOC cohort had similar 30-day readmission rates compared to the non-TOC cohort and were found to have lower A1C values within 120 days of discharge. Overall, patients in the TOC cohort were more likely to have a follow-up appointment and had closer follow-up after discharge.
Conclusion:
This study highlights that although there was no difference in readmission rates, a pharmacist-managed diabetes TOC clinic may decrease time to follow-up and improve long-term diabetes outcomes.
The prevalence of diabetes mellitus in the United States continues to trend upward, reaching over 11% of the total population in 2019. 1 Patients with diabetes admitted to the hospital for an acute illness are often at high risk for poor glycemic control. 2 Several factors, including stress, illness, nutrition, activity, and schedule, can cause fluctuations in blood glucose during an acute illness or hospitalization, leading to discrepancies in diabetes therapy needs between a hospital admission and after discharge. The complexity of diabetes care regimens, involving multiple medications, dosage forms, dosage frequency, and additional instructions, can complicate inpatient diabetes management and subsequent transitions of care.3,4 It is estimated that patients with diabetes demonstrate a 20.3% 30-day readmission rate leading to a total cost of $251 million throughout the United States.5,6 Patients with higher blood glucose and blood glucose variability throughout admission have demonstrated higher readmission rates. 6 Male sex, longer duration of prior hospitalization, number of previous hospitalizations, number and severity of comorbidities, and lower socioeconomic and/or educational status are also factors contributing to readmission rates in patients with diabetes. 7 Both acute and ambulatory care facilities have an invested interest in preventing poor glycemic outcomes and potential readmissions to the hospital. This creates an opportunity for transitions of care (TOC) programs to help mitigate poor diabetes-related outcomes and burdensome health care costs.
The 2023 American Diabetes Association Standards of Care in Diabetes advises that an outpatient follow-up visit should be scheduled with the primary care clinician, endocrinologist, or diabetes care and education specialist within 1 month of discharge for all patients experiencing hyperglycemia in the hospital. They also recommend that if diabetes medications are changed or glucose management is not optimal at discharge, closer follow-up within 2 weeks is preferred. 7 However, there is limited guidance on how diabetes TOC clinics can prevent readmission rates, recommendations on implementing this into workflow, and how to optimize the diabetes care team to meet this recommendation and support patients during this time.
Rinaldi et al 8 demonstrated the effectiveness of a diabetes TOC clinic service on hospital utilization. They evaluated a model in which patients with a diagnosis of diabetes discharged were eligible for referral to the diabetes TOC clinic, regardless of their reason for admission. Using this model, factors that may have prompted referral included suspected medication nonadherence, need for close follow-up after discharge, or need for further diabetes education. The diabetes TOC clinic utilized an interdisciplinary model that was staffed by both an ambulatory care pharmacist and endocrinologist or endocrinology nurse practitioner. They found a significant difference in 30-day readmission rates and highlighted the benefit of incorporating a pharmacist within TOC services, including filling gaps in preventive health services.
In multiple studies, pharmacists have been identified as a key part of the diabetes care team through improving A1C and contributing to cost savings. 9 Most of these studies have been done in primary care settings; however, more recently, studies have evaluated outcomes for pharmacist diabetes services in endocrinology specialty practice settings.10,11 Pharmacists’ expertise in medication therapy and skills in providing disease and medication education, monitoring efficacy of therapy, identifying medication safety concerns, and supporting adherence for self-care behaviors support pharmacists’ role in caring for people with diabetes. As of 2023, approximately 9% of all certified diabetes care and education specialists are pharmacists. 12
Additionally, pharmacists are well equipped to work with patients in the TOC setting. They can assist with and/or perform thorough medication reconciliation after discharge, provide medication counseling, support efforts to strengthen care coordination between primary care and specialty settings, and assist with medication access and adherence. Numerous studies have evaluated the impact of pharmacist-managed TOC services for various disease states, such as heart failure, post-acute coronary syndrome, and antimicrobial stewardship.13-18 Cost savings also continues to be an opportunity for TOC clinics and has been demonstrated as a significant benefit in numerous studies.19,20
The benefits of specialized inpatient endocrinology management teams have shown mixed results. Mandel and colleagues 21 demonstrated improvement in readmission rates in patients with diabetes admitted to the hospital and seen by inpatient diabetes teams but did not address TOC interventions. Similarly, Bansal et al 22 found readmission prevention benefits with inpatient endocrinology teams who did perform TOC coordination. Neither study specifically included a pharmacist as part of their care team.21,22
To address gaps in diabetes care and provide better support for people with diabetes between hospital discharge and being seen by a usual diabetes care provider, a pharmacist-managed diabetes-focused TOC clinic was established. The purpose of this study was to determine the impact of a pharmacist-managed TOC clinic on outcomes in a posthospitalization population with diabetes.
Methods
Research Design
This study is a retrospective single center cohort study, approved by the university’s Institutional Review Board under expedited review. The study period encompasses a 12-month period: the time prior to implementation (July 1, 2021 to December 31, 2021) and the time following implementation (from January 1, 2022, to June 30, 2022) of the pharmacist-managed diabetes TOC clinic.
The primary objective was to determine the impact of a pharmacist-managed diabetes TOC clinic on 30-day readmission rates in patients with diabetes after hospital discharge. Secondary objectives assessed 90-day readmission rates, time to first follow-up appointment, urgent care/emergency department encounters, A1C improvement, retention with outpatient endocrinology, referrals for diabetes education, and interventions made for patients seen in the pharmacist-managed diabetes TOC clinic.
Setting
The study took place at an academic medical center and clinical care network that operates 2 hospital units in addition to ambulatory care services. The system has a combined total of 1040 licensed beds, 38 400 discharges, and 1.3 million outpatient encounters annually. 23 The institution’s diabetes center was established in 2008 for diabetes treatment, prevention, education, and research. They provide outpatient endocrinology management and support an inpatient diabetes consult team including attending physicians, advanced practice providers, endocrinology fellows, and a diabetes stewardship pharmacist. The diabetes center has an ambulatory care pharmacist integrated within the clinic who conducts pharmacist-led medication management clinic visits for patients in the outpatient setting via face-to-face or telehealth appointments. 11
Intervention
Historically, there has not been a dedicated diabetes-focused TOC service at this institution. Usual care consisted of patients with diabetes being discharged from the hospital having follow-up visits that were subsequently scheduled with their endocrinology and/or primary care provider. Due to limited availability of appointments, there was often a considerable time between discharge and follow-up appointment. Many patients seen by the inpatient diabetes team leave the hospital with a fluid clinical status that, ideally, would benefit from close follow-up after discharge. This need was often unmet with the previous usual care model.
The diabetes center established a pharmacist-managed diabetes TOC service that went live on January 1, 2022. The aim of this service was to offer a bridge between discharge and endocrinology provider follow-up for both new and established patients. To accomplish this, an ambulatory care pharmacist conducts visits with patients in the interim to help optimize diabetes outcomes after discharge. Target patients for referral to the diabetes TOC clinic include the following: taking specific glucose-affecting or high-risk medications (eg, high-dose steroids and/or taper therapy, u-500 insulin), neurosurgery with dexamethasone tapers, newly initiated on diabetes medications (eg, insulin, sodium/glucose cotransporter-2 inhibitors, glucagon-like peptide-1 agonists, requiring follow-up laboratory measurements), oncology head and neck patients, history of and/or new transplant, requiring enteral nutrition, admission for diabetic ketoacidosis, fluid clinical status, or having had 1 or more admission in the past 30 days.
Patients are referred electronically to the diabetes TOC service by providers staffing the inpatient diabetes consult service. A patient handout describing the clinic with patient instructions was created and given to patients prior to discharge by the inpatient diabetes team. The pharmacist contacts patients via telephone within 5 business days of discharge or prior to their scheduled diabetes TOC appointment. During this call, the pharmacist ensures all necessary diabetes medications and testing supplies were acquired by the patient. The appointment time and date are also confirmed at this time to ensure the patient is aware of the schedule. Clinical intervention (ie, medication dose changes) may take place at this time if the patient endorses a significant diabetes-related issue. If the patient is successfully contacted, a telephone encounter is documented in Epic electronic health record (EHR).
Next, a face-to-face or telehealth visit is conducted with the patient, ideally within 10 business days of discharge, scheduled for 30-minute appointment time slots. Clinical management and interdisciplinary communication take place via the EHR Epic, which includes initial electronic referral, telehealth communications, clinical monitoring, laboratory requests, and documentation. This pharmacist service operates under the organization’s credentialed and privileged operations protocol, which defines the scope of practice for pharmacists within the organization. Under this protocol, pharmacists must be board certified under the purview of the Board of Pharmacy Specialties.
During each TOC appointment, activities completed by the pharmacist include medication reconciliation, monitoring diabetes clinical status, collecting pertinent vitals, reviewing past medical history, evaluating self-monitored blood glucose or continuous glucose monitoring (CGM) data, providing necessary medication dose adjustments or counseling, initiating and/or discontinuing medications, coordinating appropriate diabetes supplies, obtaining appropriate laboratory measurements, collaborating with other health care professionals, placing appropriate referrals, and helping with medication access if needed. Education regarding self-monitoring of blood glucose, CGM, and lifestyle modifications is also provided to the patient if clinically appropriate. If the pharmacist identifies that a patient may benefit from additional education and the patient is interested and/or agreeable, a referral to diabetes self-management education is placed. Additionally, gaps in immunizations and prevention and treatment of diabetes complications, including nephropathy, atherosclerotic cardiovascular disease prevention, and neuropathy, are also addressed if indicated. Medications, laboratory measurements, and appropriate referral orders (ie, ophthalmology) are ordered in Epic by the pharmacist under the referring provider’s authority. If the patient’s clinical status requires further intervention prior to the next scheduled provider visit, additional TOC clinic visits may be scheduled. Figure 1 compares the workflows between the 2 study groups.
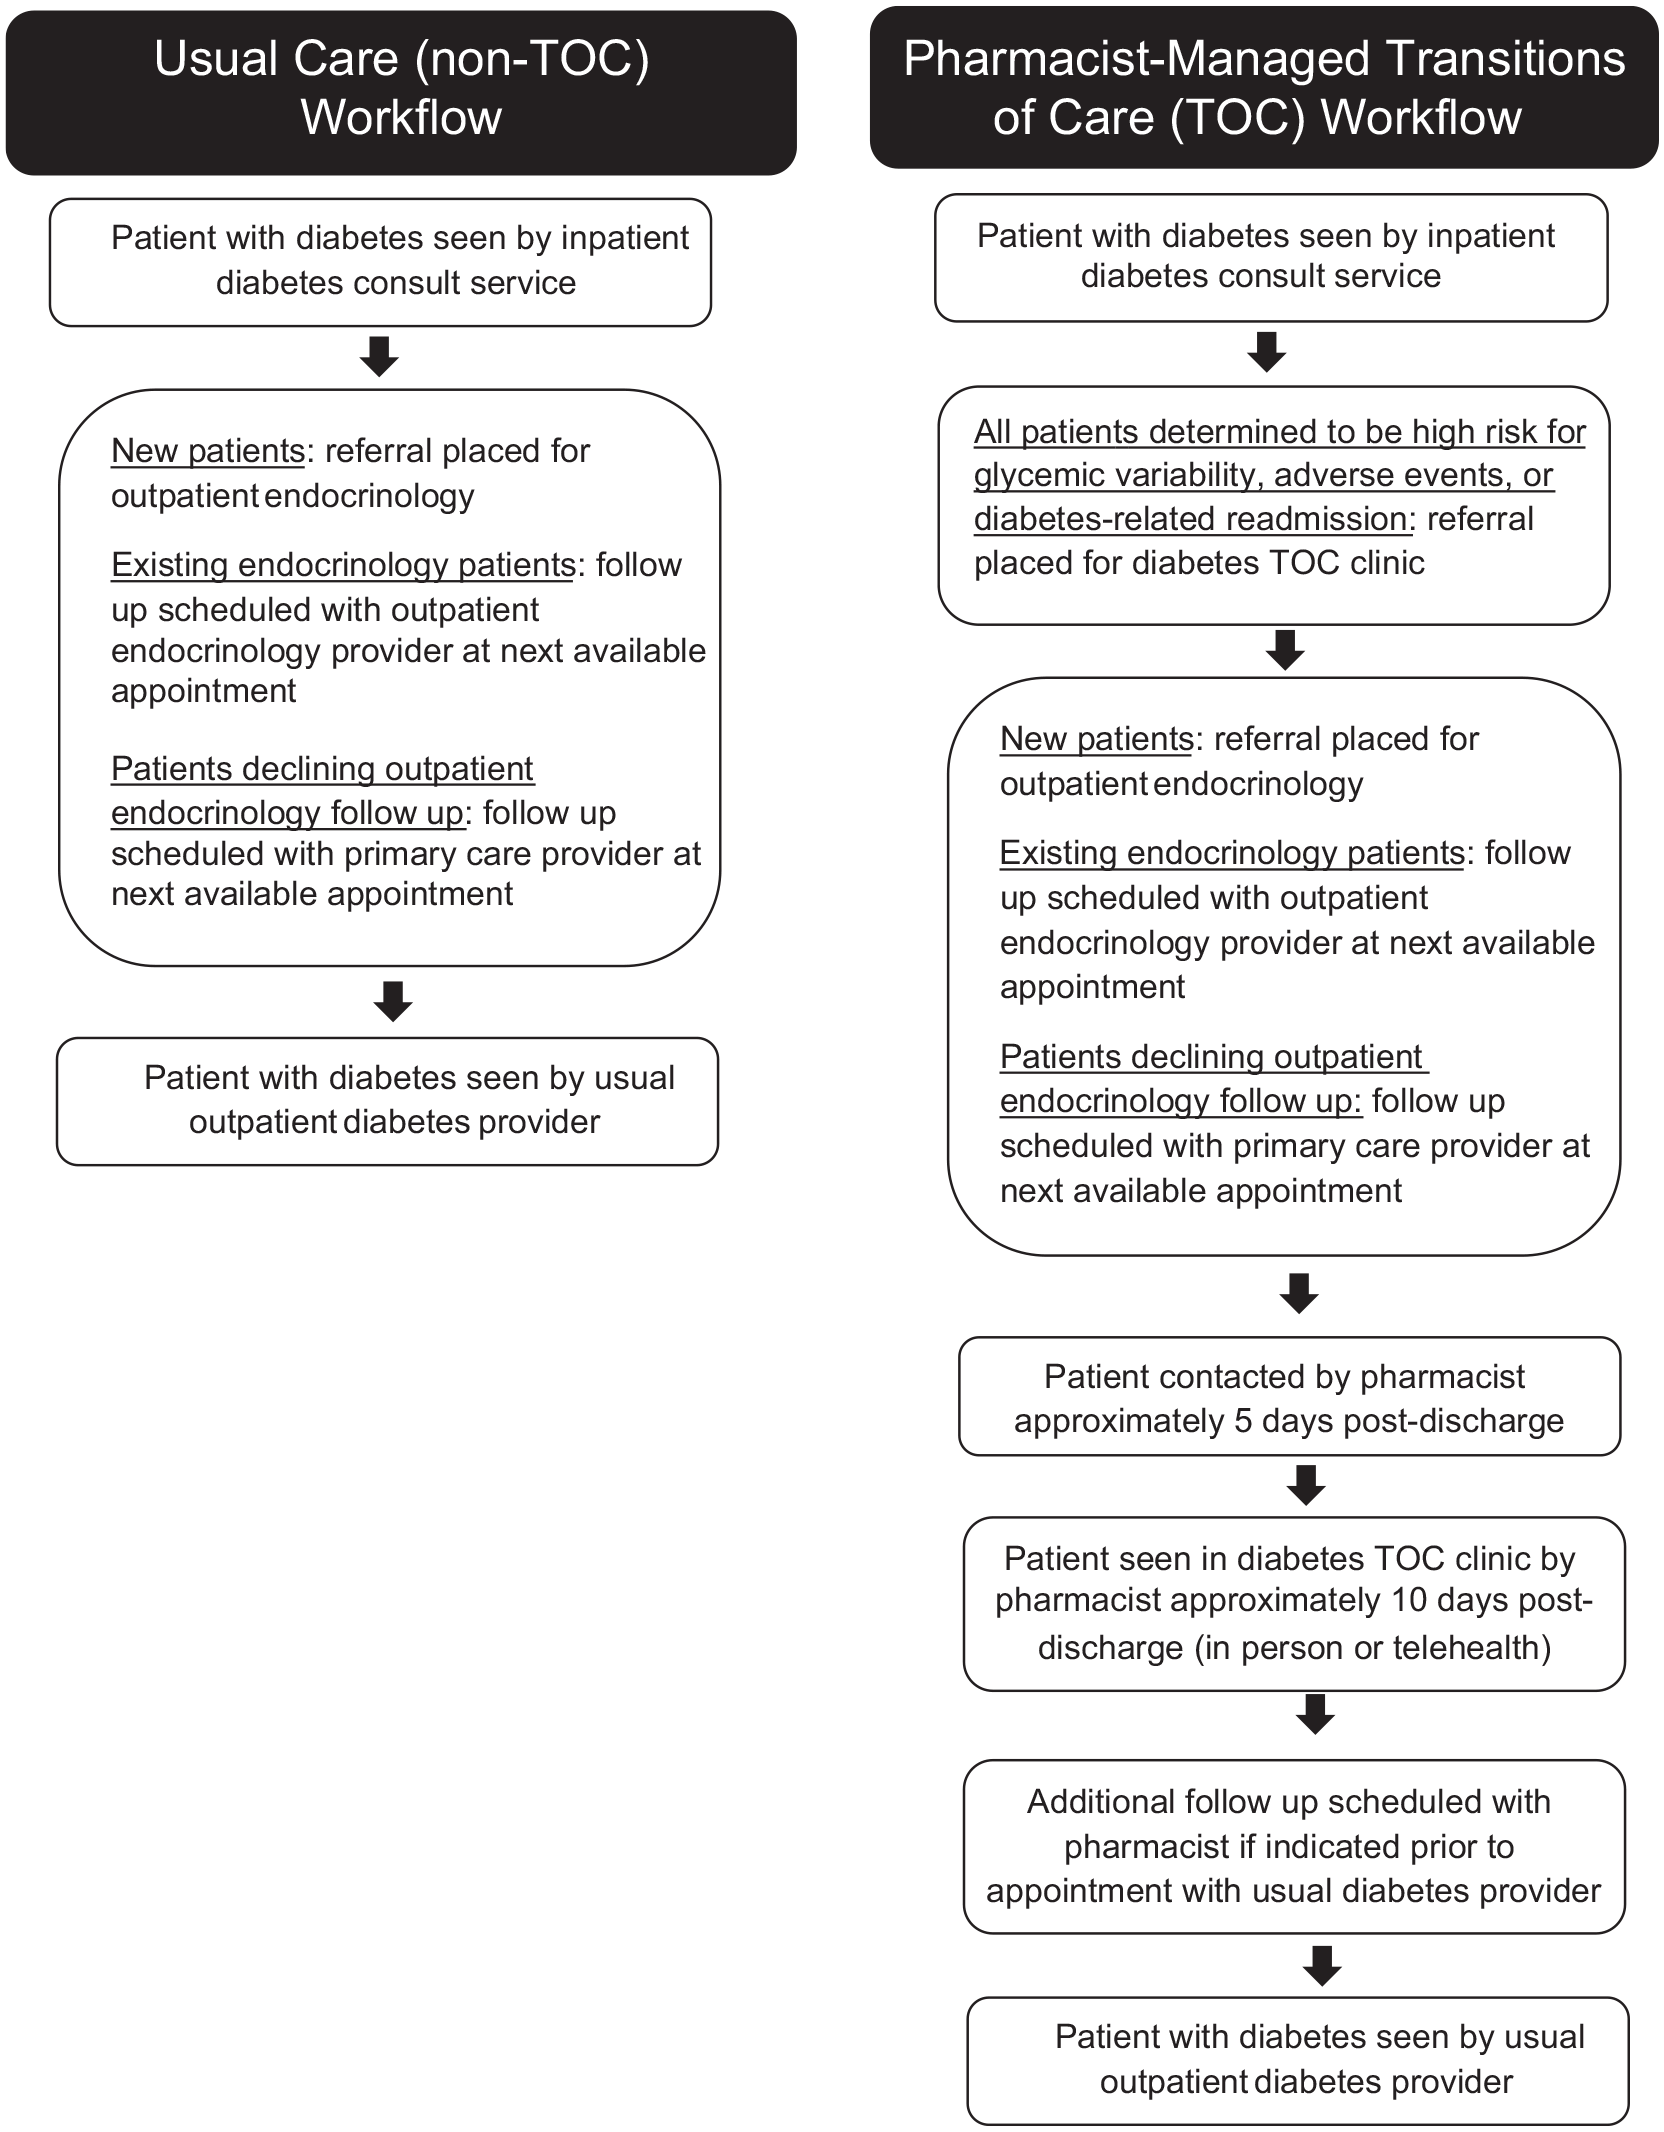
Comparison of usual care (non-TOC) and pharmacist-managed transitions of care (TOC) workflows.
Study Population
EHRs were utilized to identify patients who were followed by the inpatient endocrinology team during their admission and discharged from the 2 hospitals in the organization during the 6 months prior to implementation of the pharmacist-managed diabetes TOC clinic and compared to patients referred to and seen in the pharmacist-managed diabetes TOC clinic during the 6 months following its initiation. Patients in the usual care (non-TOC) cohort were identified based on discharge dates from July 1, 2021, to December 31, 2021, and compared to patients in the TOC cohort based on discharge dates from January 1, 2022, to June 30, 2022. Cohorts were evenly matched by A1C to ensure an equal representation of both groups. Readmission rates and other clinical data were queried up to 4 months after discharge.
Data Collection
The university’s Center for Clinical and Translational Sciences obtained patient information from the EHR. This information included patient demographics, insurance, distance of primary address from clinic location, admission and discharge dates, hospital length of stay, intensive care unit management during admission, diagnosis of diabetic ketoacidosis/hyperosmolar hyperglycemic state during admission, diabetes diagnoses, comorbidities, baseline laboratory values (values closest to inpatient admission date either collected during admission or within 6 months prior to admission), and use of various medications during admission. Specific diagnoses were found utilizing International Classification of Diseases codes listed in the Supplemental Appendix. These data were validated by a manual cross-check of 10 patients from each cohort in the EHR for quality assurance prior to chart review.
The initial hospital admission primary diagnosis, inpatient and/or outpatient diabetes education orders, prior to admission and discharge medications, laboratory values after discharge, readmission dates, emergency department and/or urgent care visits, readmission diagnoses, follow-up visits, and TOC visit interventions/recommendations were collected via manual chart review by an ambulatory care pharmacy resident and 2 student pharmacists. Follow-up visits with a primary care provider or endocrinologist were counted as the patient being seen in clinic. Therefore, if the patient was scheduled for follow-up but not seen, this did not count as a follow-up visit. The data collection form was tested on 5 patients from each cohort to assess for adjustments prior to chart review. After chart review was completed, a manual cross-check of 10 patients from each cohort was conducted by the pharmacy resident for quality assurance.
Statistical Analysis
Descriptive statistics were used for statistical analysis of demographic and clinical data. Categorical variables are presented as calculated proportion (%) and were compared using Pearson’s chi-squared tests or Fisher’s exact tests, as appropriate. Continuous variables are presented as median with interquartile range (IQR; 25%-75%) and were compared using the Mann-Whitney U tests or independent sample t tests, as appropriate. All tests were performed using an alpha level of ≤0.05 as statistically significant.
Results
The initial data extraction identified 188 patients who met the inclusion criteria. Of those, after review, 1 patient in the non-TOC cohort and 10 patients in the TOC cohort were excluded. After excluding those patients, 177 patients total were included in the study, 84 in the TOC cohort and 93 in the non-TOC cohort (Figure 2).
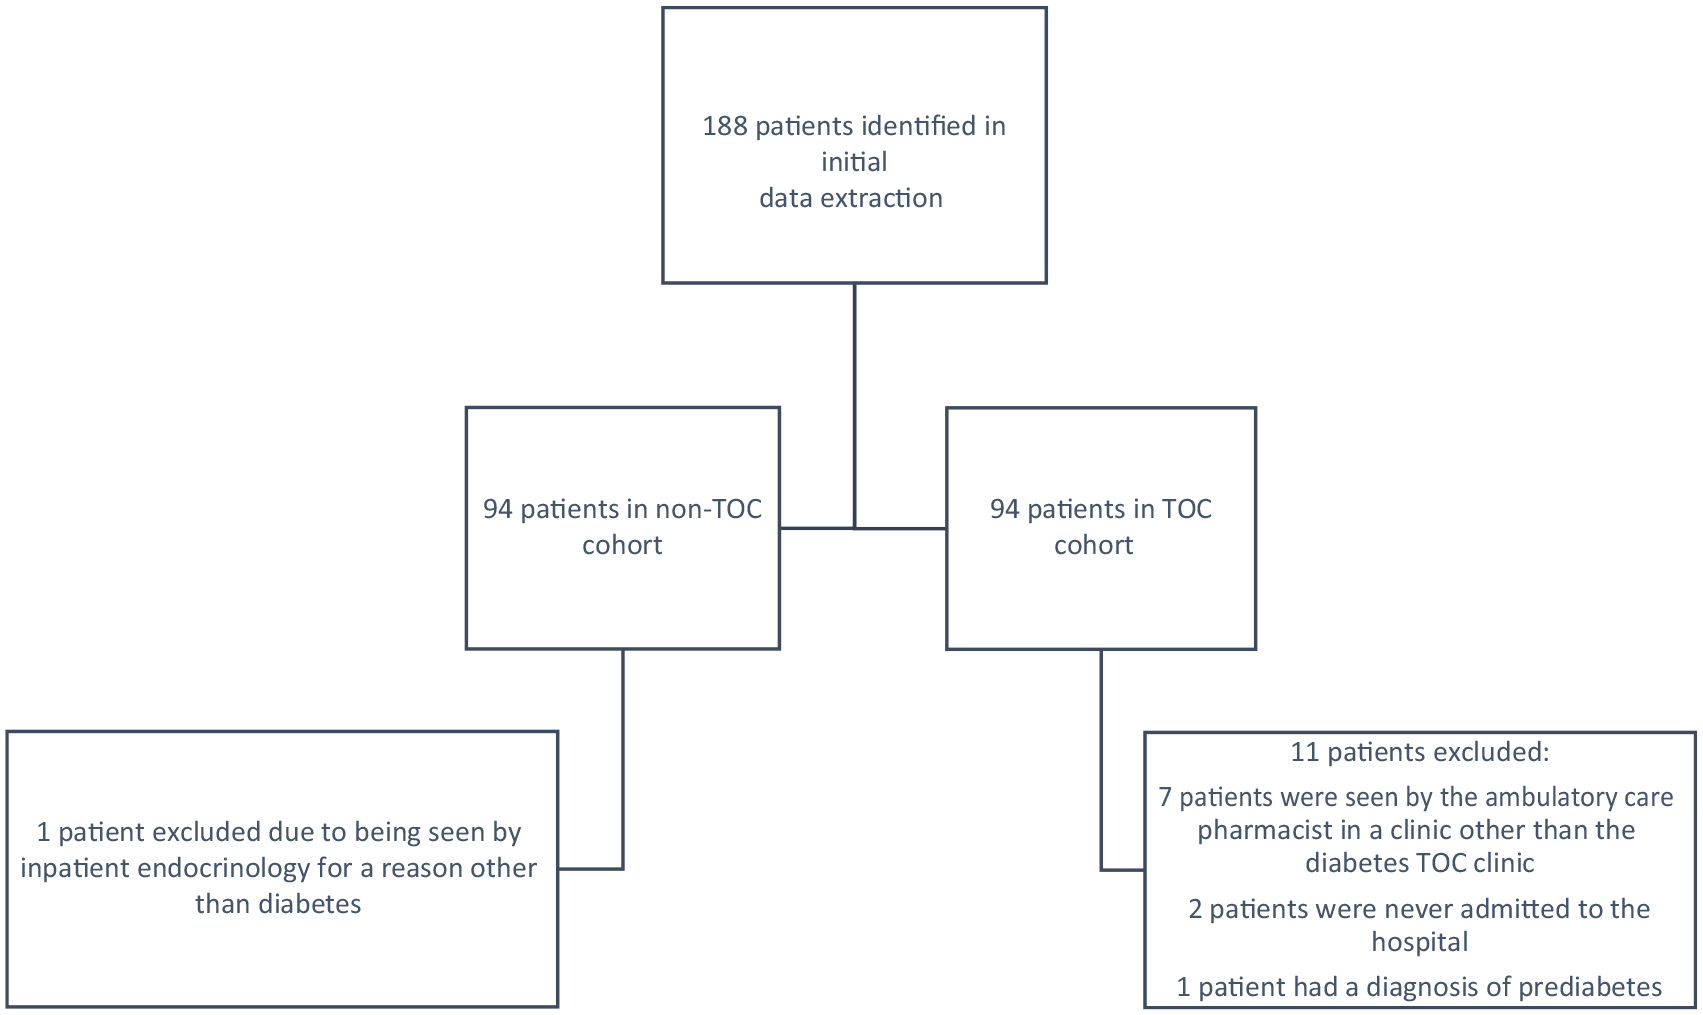
Patient selection.
Of the patients included in the final analysis, statistically significant differences were found in median age between the TOC cohort and non-TOC cohort (56 years [IQR 45.3-62.8] vs 49 years [IQR 23.5-59], P = .002) and body mass index (29.6 kg/m2 [IQR 26.6-36.9] vs 27.1 kg/m2 [IQR 22.7-33.7], P = .005). There were no differences between the 2 cohorts in having a diagnosis of diabetes due to an underlying condition, drug or chemical-induced diabetes, type 2 diabetes, or other specified diabetes. However, there were less patients in the TOC cohort that had a diagnosis of type 1 diabetes (21.4% vs 35.5%, P = .039). There were no differences between the 2 cohorts in gender, insurance status, and distance from Lexington, Kentucky. At the time of the initial inpatient admission, significantly more patients in the TOC cohort had a diagnosis of chronic kidney disease (41.7% vs 22.6%, P = .006), dialysis (22.6% vs 8.6%, P = .010), hyperlipidemia (52.4% vs 36.6%, P = .034), and transplant (38.1% vs 16.1%, P < .001). Additional baseline demographics for the study population are presented in Table 1.
Baseline Characteristics
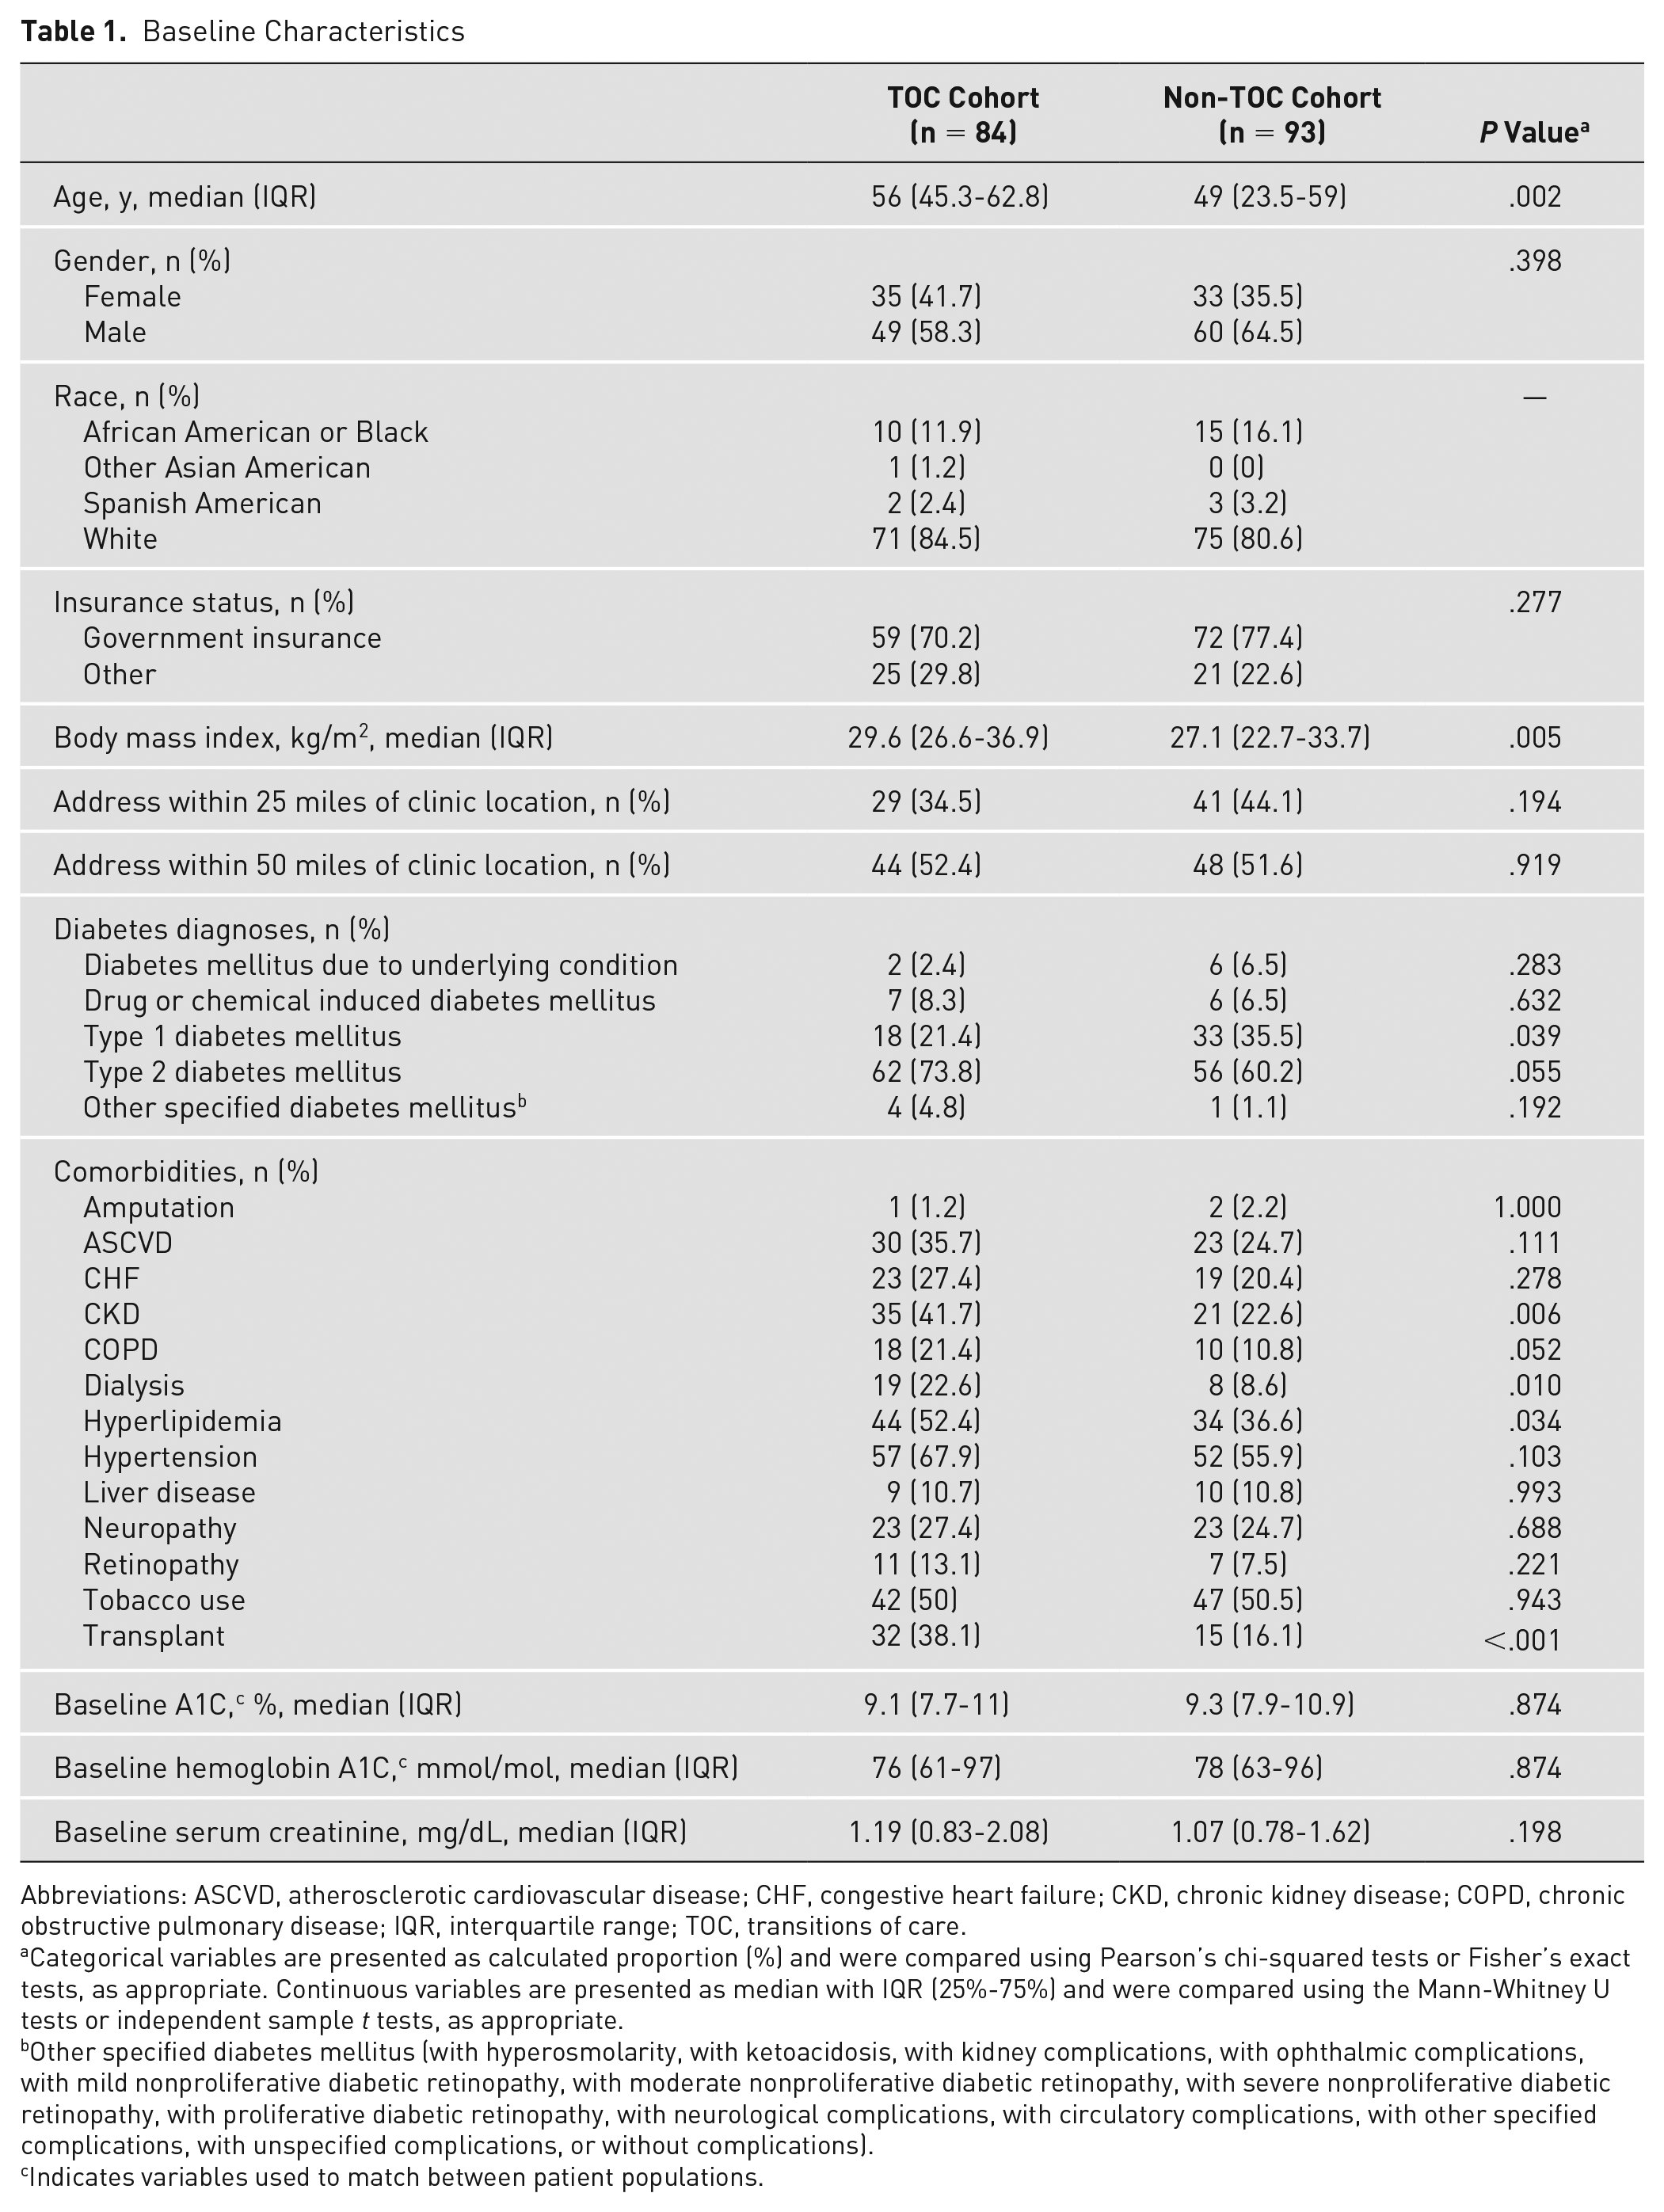
Abbreviations: ASCVD, atherosclerotic cardiovascular disease; CHF, congestive heart failure; CKD, chronic kidney disease; COPD, chronic obstructive pulmonary disease; IQR, interquartile range; TOC, transitions of care.
Categorical variables are presented as calculated proportion (%) and were compared using Pearson’s chi-squared tests or Fisher’s exact tests, as appropriate. Continuous variables are presented as median with IQR (25%-75%) and were compared using the Mann-Whitney U tests or independent sample t tests, as appropriate.
Other specified diabetes mellitus (with hyperosmolarity, with ketoacidosis, with kidney complications, with ophthalmic complications, with mild nonproliferative diabetic retinopathy, with moderate nonproliferative diabetic retinopathy, with severe nonproliferative diabetic retinopathy, with proliferative diabetic retinopathy, with neurological complications, with circulatory complications, with other specified complications, with unspecified complications, or without complications).
Indicates variables used to match between patient populations.
At the time of initial inpatient admission, more patients in the TOC cohort had insulin (Table 2; 75% vs 59.1%, P = .025) and steroids (19% vs 8.6%, P = .043) on their medication list. The same was true for patients at the time of discharge. More patients in the TOC cohort were discharged on insulin (91.7% vs 80.6%) and steroids (36.9% vs 19.4%, P = .009) than the non-TOC cohort.
Medication Utilization by Drug Class
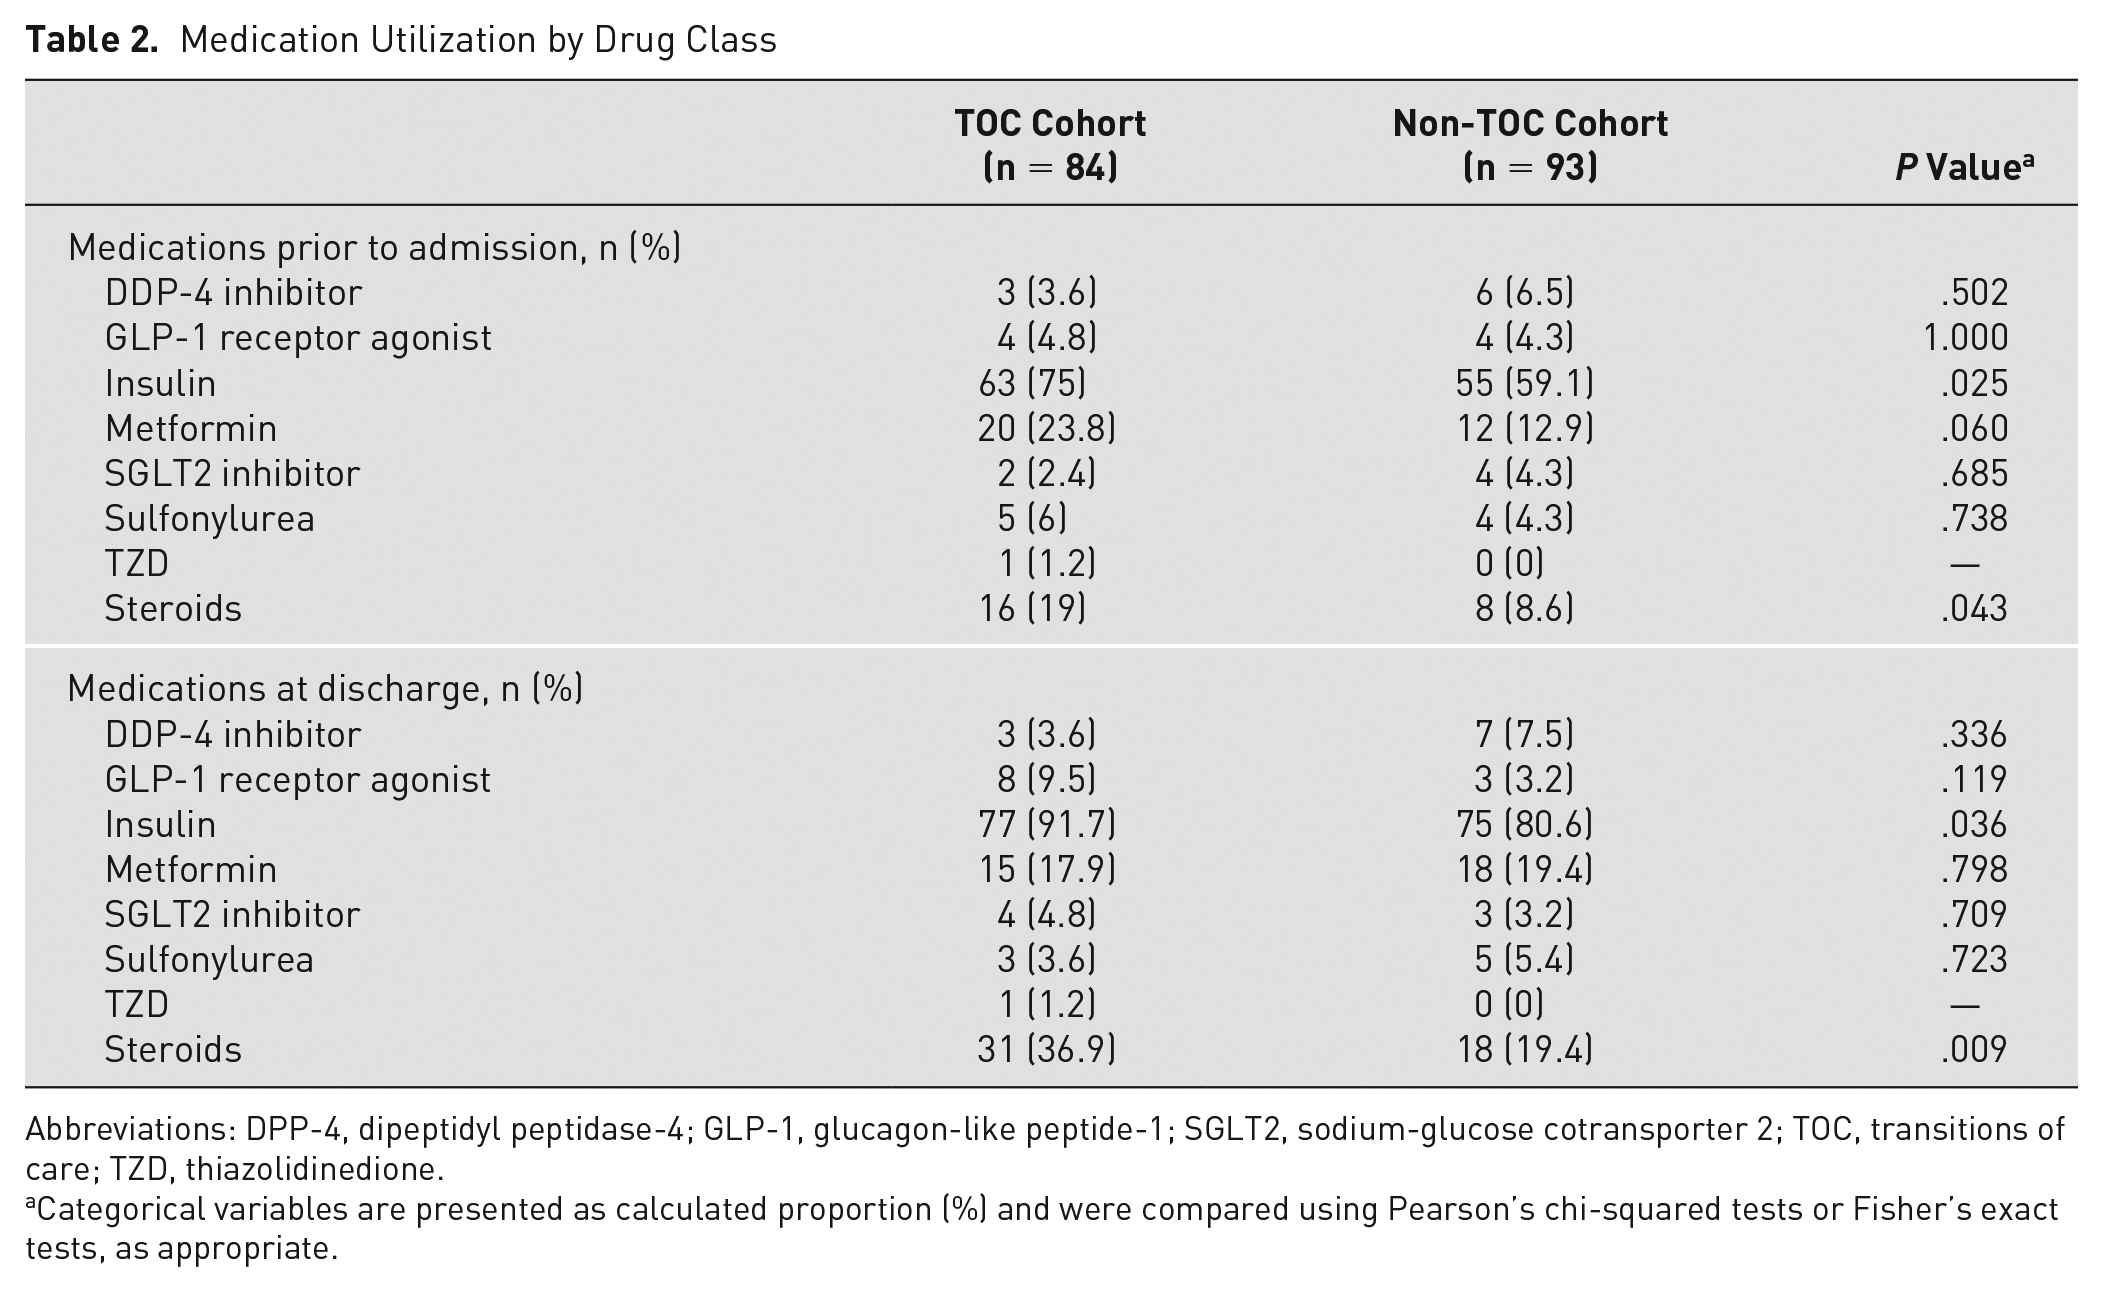
Abbreviations: DPP-4, dipeptidyl peptidase-4; GLP-1, glucagon-like peptide-1; SGLT2, sodium-glucose cotransporter 2; TOC, transitions of care; TZD, thiazolidinedione.
Categorical variables are presented as calculated proportion (%) and were compared using Pearson’s chi-squared tests or Fisher’s exact tests, as appropriate.
For the primary outcome, there was no statistically significant difference in 30-day readmission rates between the TOC cohort and non-TOC cohort, although the TOC cohort was numerically higher (Table 3; 24% vs 18%, P = .150). There were no differences between the 2 cohorts in 90-day readmission rates, rates of 30-day or 90-day emergency department (ED)/urgent care visits, or the number of times patients were readmitted and/or visited the ED/urgent care. Of patients readmitted to the hospital, there was no statistically significant difference in readmissions attributable to diabetes, although numerically, there were less in the TOC cohort versus the non-TOC cohort (30-day: 8.3% vs 22.2%, P = .375; 90-day: 13.3% vs 24.2%, P = .344).
Clinical Outcomes
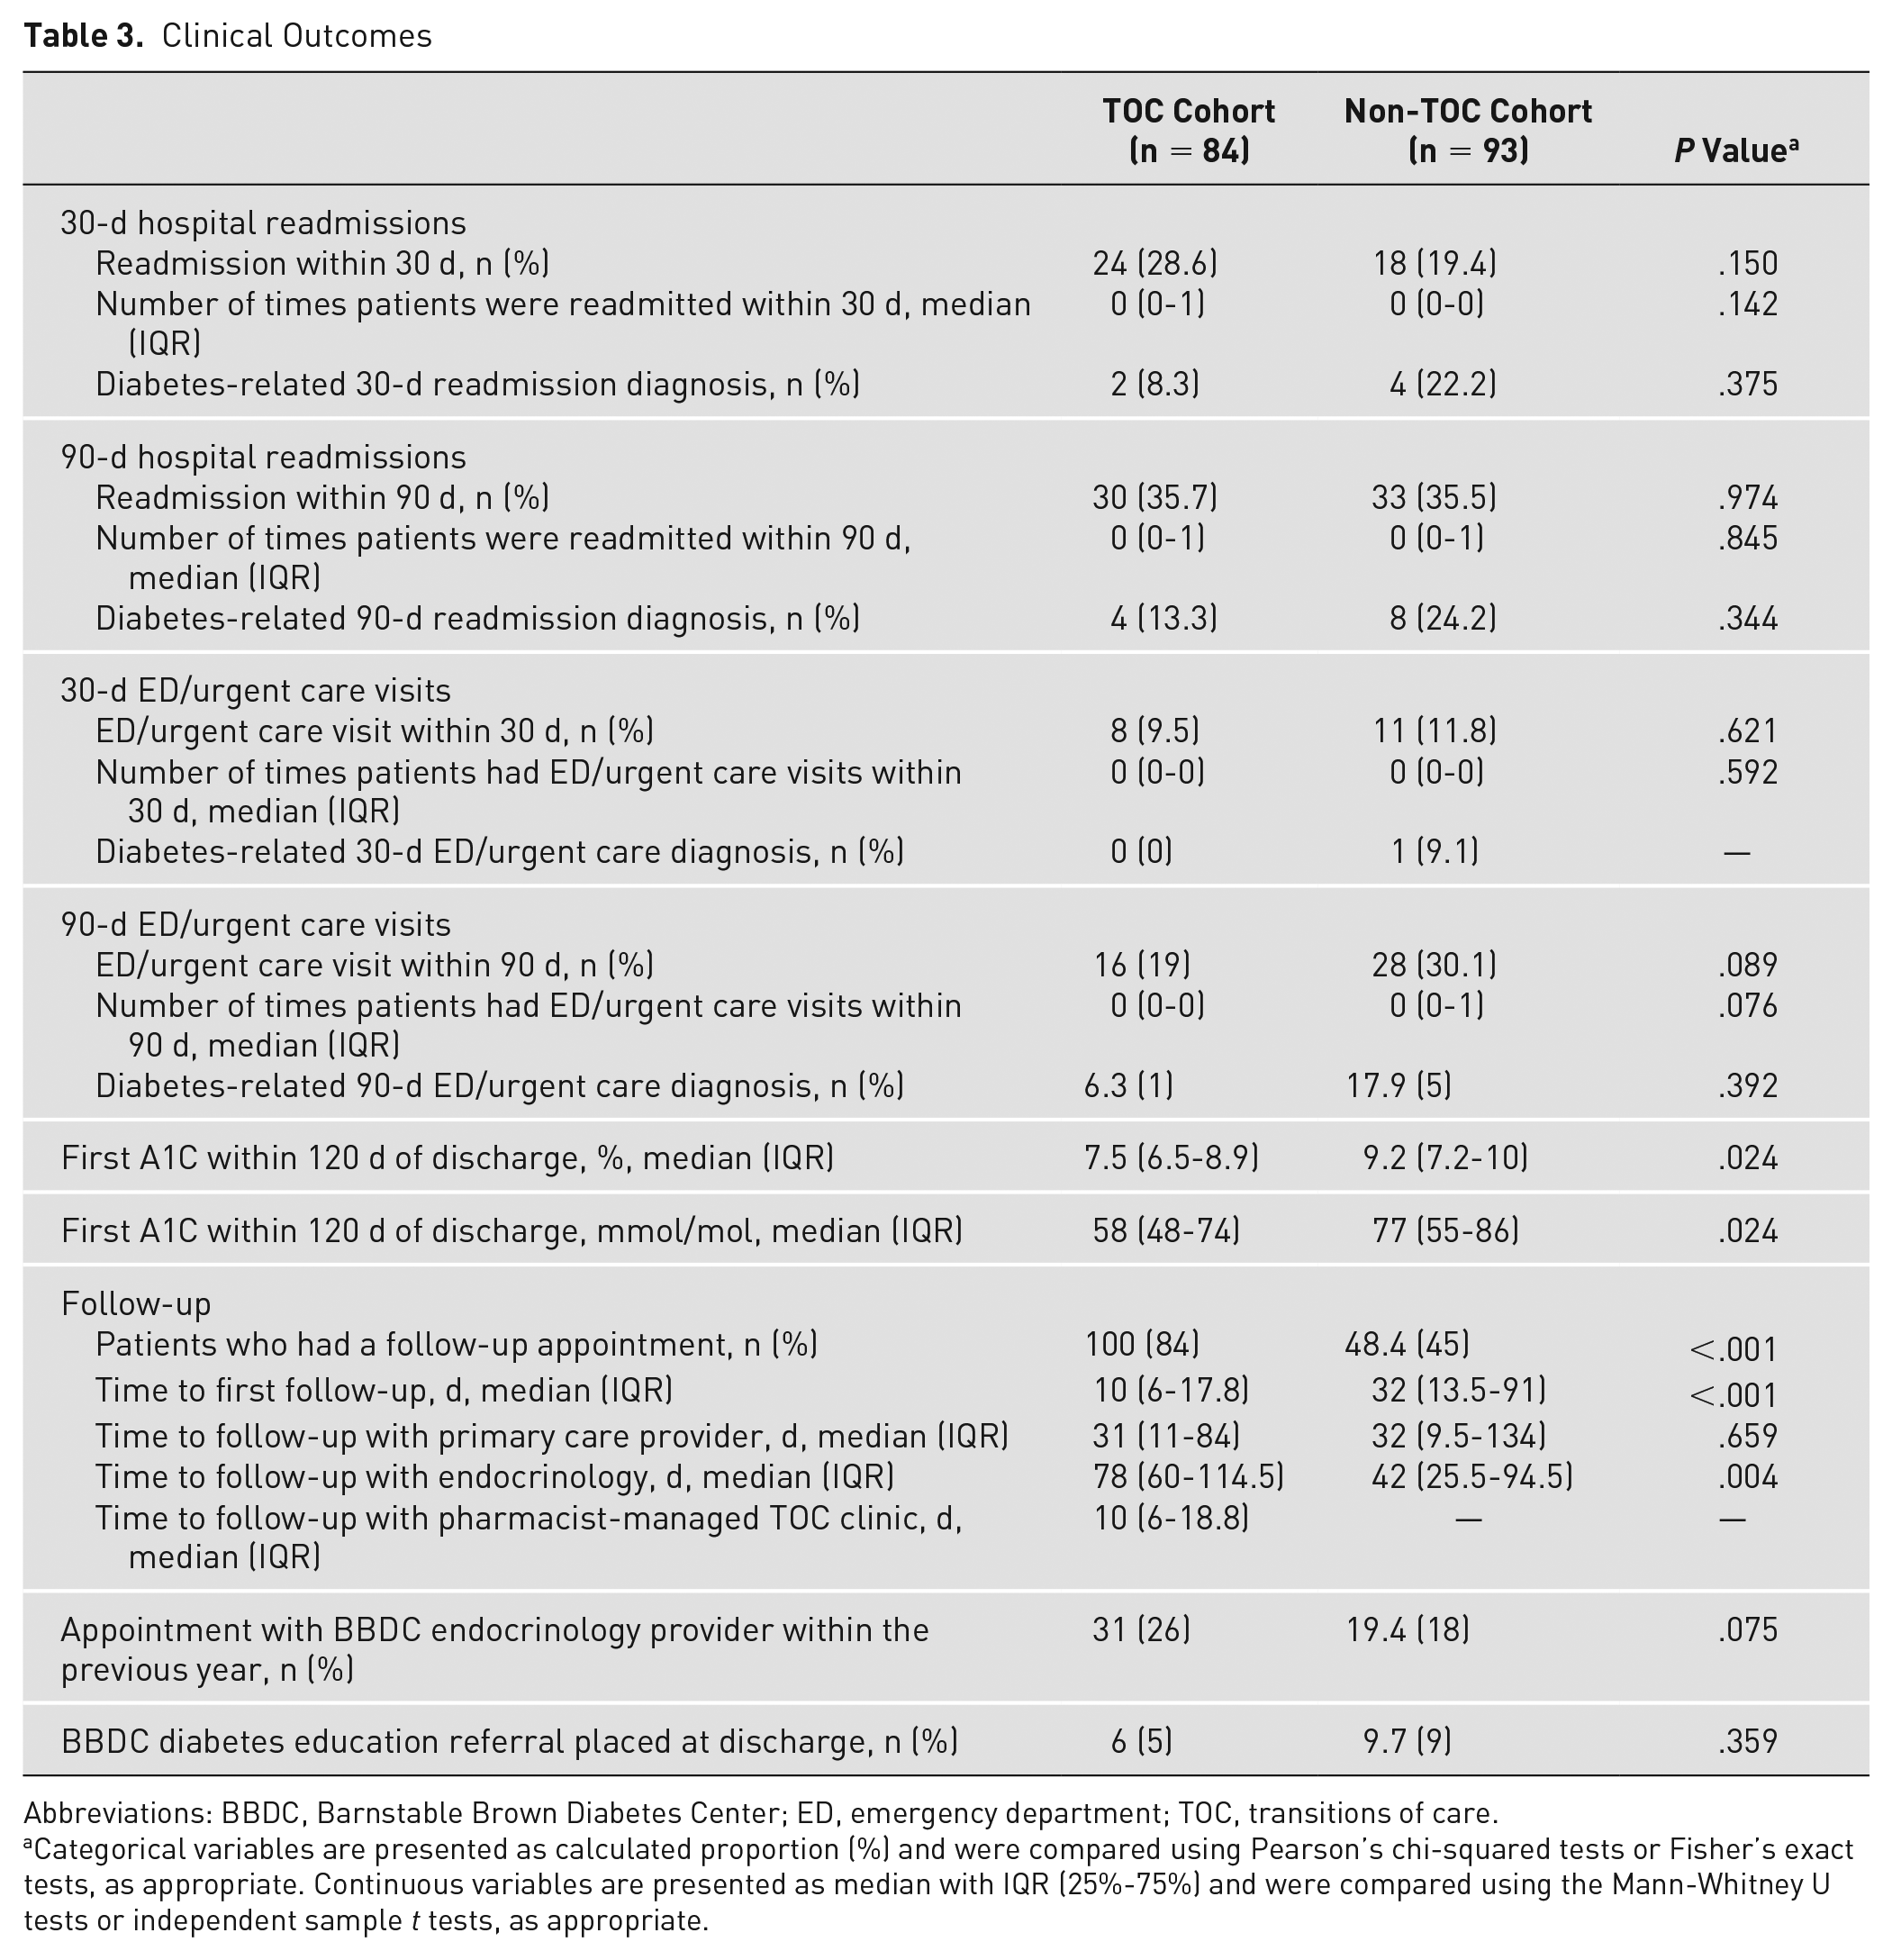
Abbreviations: BBDC, Barnstable Brown Diabetes Center; ED, emergency department; TOC, transitions of care.
Categorical variables are presented as calculated proportion (%) and were compared using Pearson’s chi-squared tests or Fisher’s exact tests, as appropriate. Continuous variables are presented as median with IQR (25%-75%) and were compared using the Mann-Whitney U tests or independent sample t tests, as appropriate.
When assessing repeat A1C within 120 days of discharge, 51 of 84 patients (60.7%) in the TOC cohort and 36 of 93 patients (38.7%) in the non-TOC cohort had A1C values that were collected and analyzed within 120 days of discharge. Patients in the TOC cohort were found to have statistically significant lower A1C values than patients in the non-TOC cohort (Table 3; 7.5% [IQR 6.5%-8.9%] vs 9.2% [IQR 7.2%-10%], 58 mmol/mol [IQR 48-74 mmol/mol] vs 77 mmol/mol [IQR 55-86 mmol/mol], P = .024). Time to follow-up with the pharmacist, endocrinology provider, and primary care provider was also analyzed between the 2 cohorts. Overall, patients in the TOC cohort were more likely to have a follow-up appointment (84% vs 45%, P < .001) and had closer follow-up after discharge (10 days [IQR 6-17.8] vs 32 days [IQR 13.5-91], P < .001). There was no difference in time to follow-up with a primary care provider (31 days [IQR 11-84] vs 32 days [IQR 9.5-134], P = .659), but patients in the TOC cohort had longer time to follow-up with their endocrinology provider (78 days [IQR 60-114.5] vs 42 days [IQR 25.5-94.5], P = .004). There was no difference in patients who had an appointment with an endocrinology provider at the diabetes center within the year prior to inpatient admission (31% in the TOC cohort vs 19.4% in the non-TOC cohort, P = .075) or patients who had a referral placed for outpatient diabetes education with a certified diabetes care and education specialist within the institution (6% in the TOC cohort vs 9.7% in the non-TOC cohort, P = .359).
Interventions made by the pharmacist during the TOC visit were also assessed. Through the credentialed and privileged protocol, the pharmacist was able to make dose adjustments to a current diabetes medication for 56 (66.7%) patients, initiate a new diabetes medication for 6 (7.1%) patients, and discontinue a diabetes medication for 2 (2.4%) patients. Medications to treat hypoglycemia, such as glucagon, glucose tablets, or glucose gel, were prescribed and/or refilled for 3 (3.6%) patients. Diabetes technology, including CGM and/or insulin pumps, was evaluated for 38 (45.2%) patients, and continuous glucose monitors were prescribed for 12 (14.3%) patients. The pharmacist also helped to address gaps in preventive care by prescribing and/or adjusting the dose of an angiotensin-converting enzyme inhibitors or angiotensin receptor blockers for 2 (2.4%) patients, prescribing and/or adjusting the dose of a statin for 1 (1.2%) patient, discussing vaccine recommendations with 61 (72.6%) patients, and placing referrals for ophthalmology for 2 (2.4%) patients. Five (6%) patients were identified as benefiting from additional diabetes education, and a referral was placed for an appointment with a certified diabetes care and education specialist within the diabetes center. Laboratory measurements, such as A1C, lipid panel, comprehensive metabolic panel, urine microalbumin, and/or urinary albumin to creatinine ratio, were ordered for 3 (3.6%) patients. Given follow-up in the pharmacist-managed diabetes TOC clinic was close to the time of discharge, the pharmacist also had the opportunity to discuss disease states other than diabetes with 25 (29.8%) patients and collaborated with providers outside of endocrinology for 9 (10.7%) patients. Lastly, the pharmacist addressed medication access concerns for 6 (7.1%) patients during their TOC visit. Overall, 79 (94%) patients in the TOC cohort had more than 1 of the aforementioned interventions addressed during their diabetes TOC appointment with the pharmacist. These interventions are presented in Table 4.
Pharmacist Interventions for Patients in the TOC Cohort
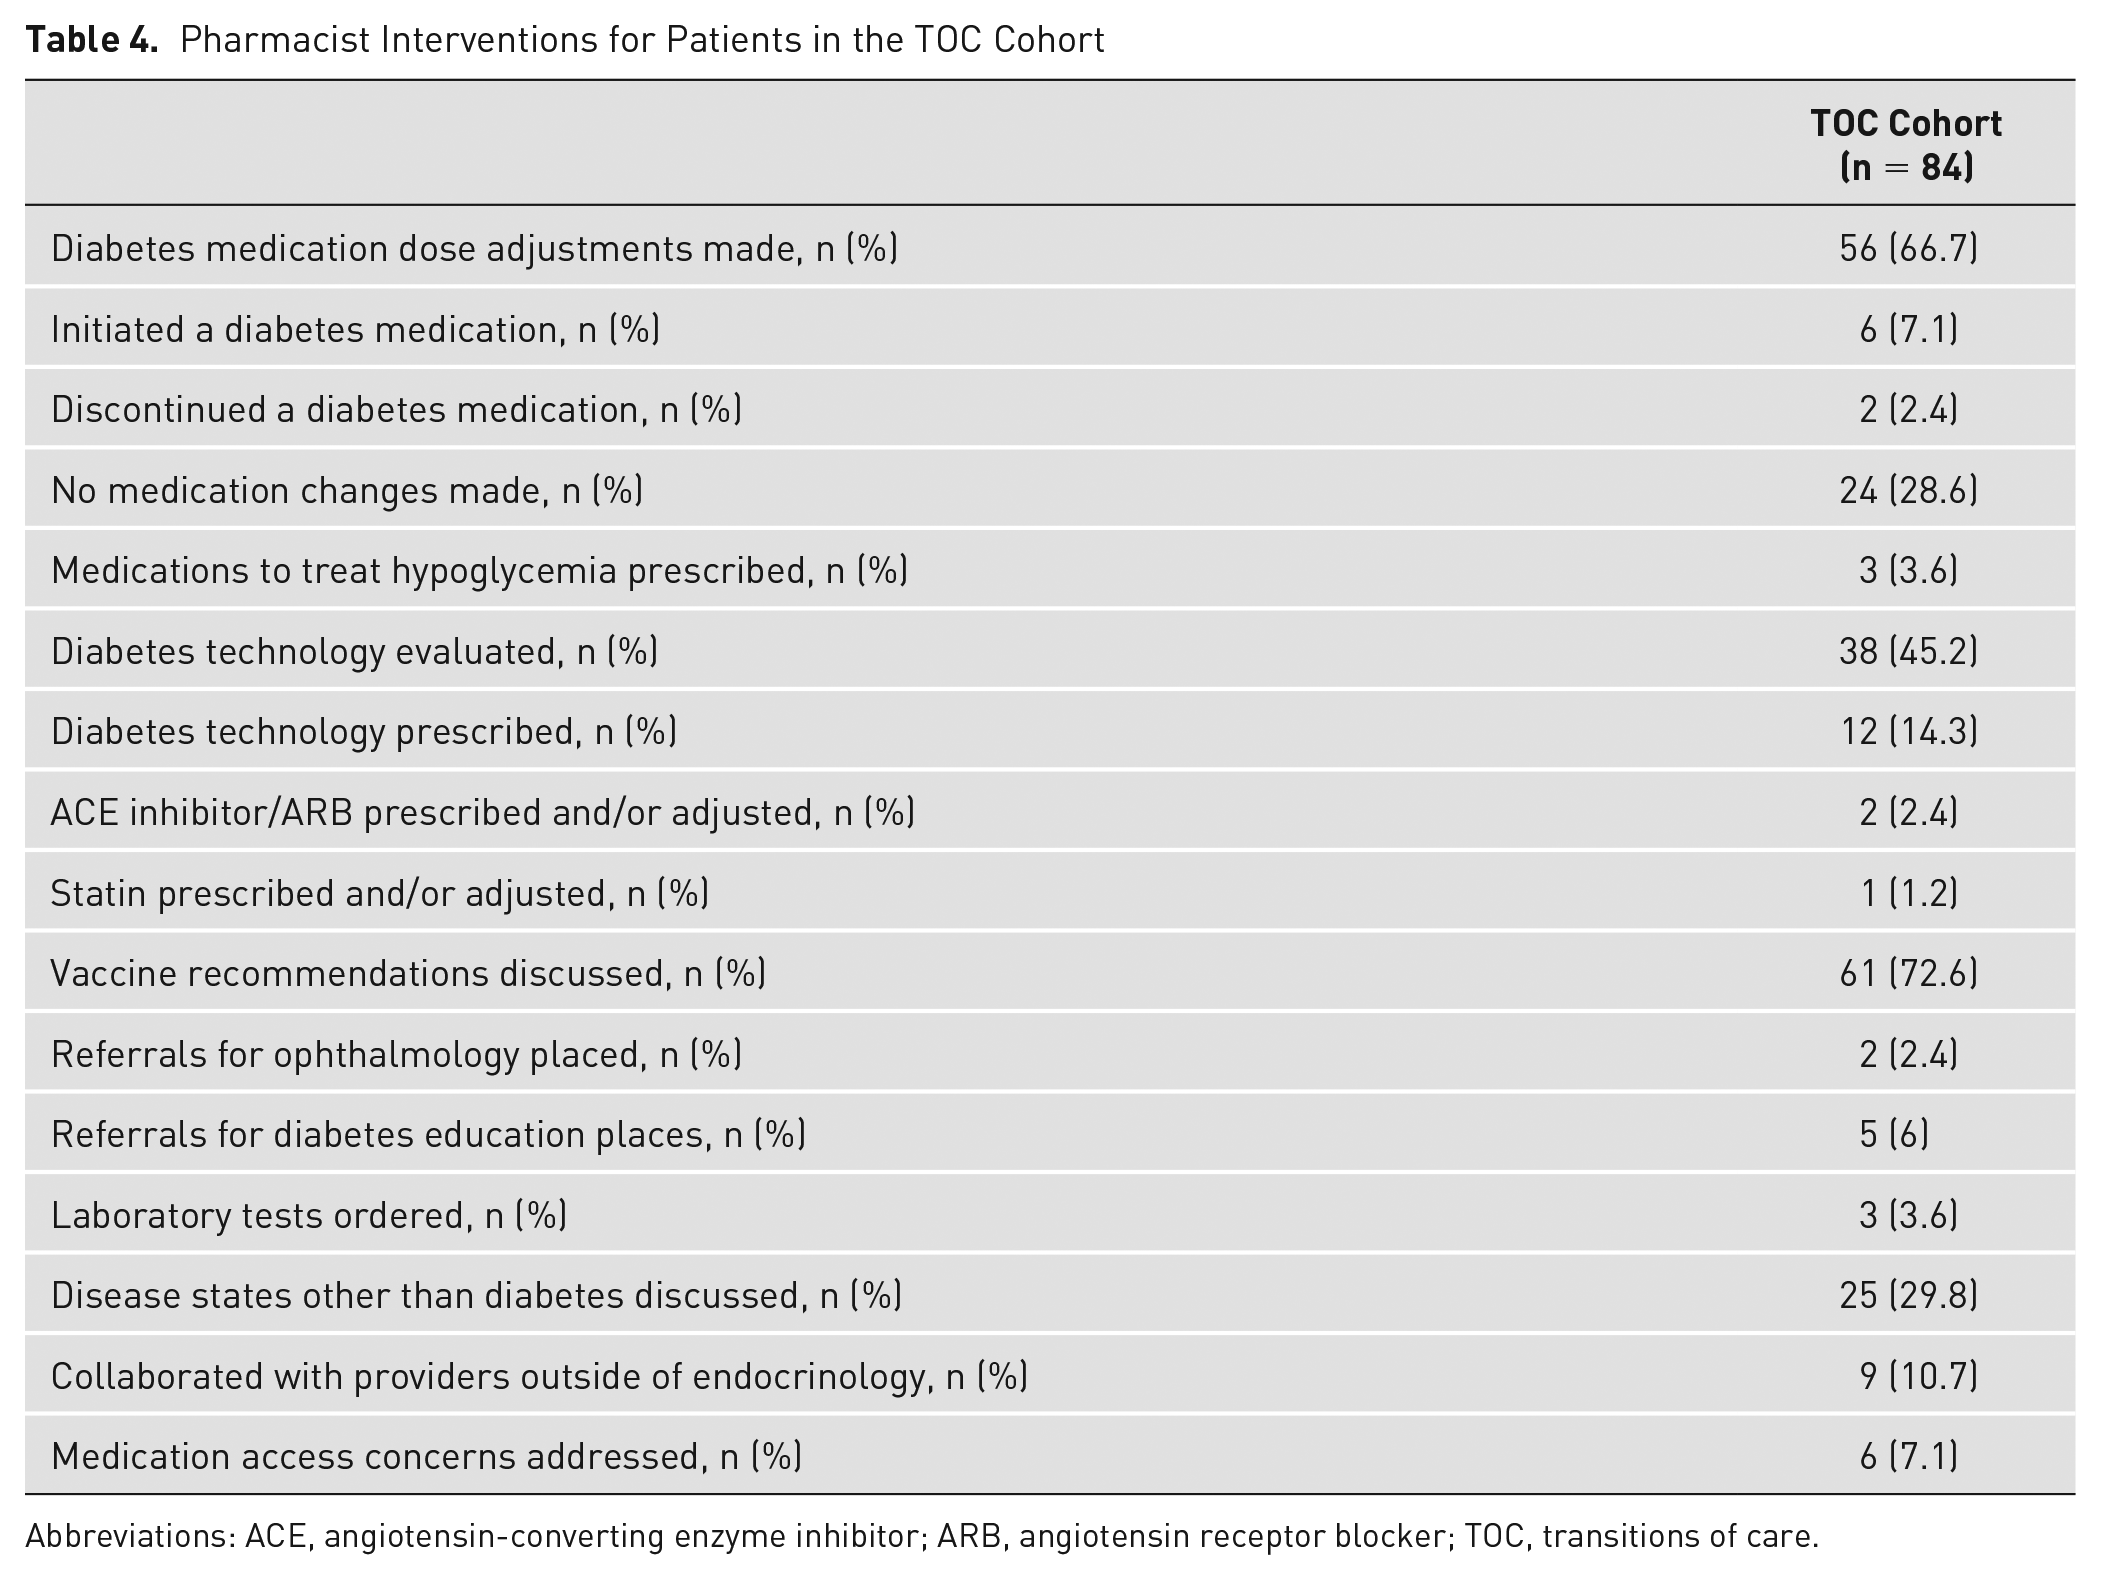
Abbreviations: ACE, angiotensin-converting enzyme inhibitor; ARB, angiotensin receptor blocker; TOC, transitions of care.
Discussion
A pharmacist-driven diabetes-focused TOC clinic has not been previously described. Given the increasing prevalence of diabetes in the United States, pharmacist-managed TOC programs may help mitigate poor diabetes-related outcomes and burdensome health care costs. This study evaluated the impact of a pharmacist-managed diabetes TOC clinic on 30-day readmission rates in patients with diabetes after hospital discharge. There was no statistically significant difference in the 30-day readmission rates between the 2 groups; although patients in the TOC cohort had numerically higher 30-day readmission rates, none were diabetes-related. This difference may be attributable to the small sample size and patients in the TOC cohort being of older age; being on more complex medications, such as insulin and steroids; or having more concomitant comorbidities, such as chronic kidney disease (CKD), dialysis, chronic obstructive pulmonary disease (COPD), and transplant.
This study supports that pharmacists can serve as an integral part of the health care team to improve diabetes outcomes during the transitional period. This pharmacist-managed TOC clinic showed a reduction of baseline A1C of approximately 2 percentage points within 120 days of discharge, which may help prevent long-term diabetes-related outcomes, such as nephropathy, retinopathy, or neuropathy. The longer time to follow-up with an endocrinology provider in the TOC cohort may additionally support the pharmacist as an integral health care team member in delivering transitional care services. Overall, the pharmacist-managed TOC clinic improved more timely access to a health care provider to help address questions or concerns, with patients in the TOC cohort receiving closer follow-up after hospital discharge. The need for this close follow-up after discharge is supported by the pharmacist making diabetes medication dose adjustments for 66.7% of patients, initiating new medications for 7.1% of patients, and discontinuing medications in 2.4% of patients. As previously discussed, although this study did not show a change in readmission rates, current literature supports the use of a pharmacist integrated within a TOC service in reducing readmission to the hospital. Rinaldi et al 8 found that an interprofessional diabetes-focused TOC clinic, including an ambulatory care pharmacist, was effective in decreasing hospital utilization within 30 days of discharge.
Interprofessional transitional care clinics have demonstrated benefit, but access to health care providers in both primary care and specialty settings continues to be a barrier to care for many across the country, and alternative members of the health care team, such as pharmacists, may play an important role in bridging patients after discharge from acute care to chronic care management. 24 Miller et al 14 demonstrated statistically significant outcomes in terms of 30-day readmission rates across hospitals of varying sizes and populations utilizing a pharmacist TOC model.
A limitation of the study was the small sample size due to collecting data close to the time point that the TOC service was initiated and only evaluating patients seen in a 6-month window. Another factor affecting referrals and, thus, patient inclusion may have been the target criteria of factors at highest risk for readmission and hyperglycemia that were set for referral. This potentially caused selection bias toward patients who would benefit most from TOC services and may have been inherently higher risk for readmission, which is supported by the significantly higher rates of comorbidities seen in the TOC group, including CKD, COPD, dialysis, hyperlipidemia, and transplant. An additional source of selection bias may have been that several different providers were identifying patients for referral instead of a computer-generated report or automated referral. Thus, it is possible that not all patients eligible for referral were identified. There was also limited access to records for patients that did not follow up at an institution in which records were accessible within the study institution’s EHR. Therefore, ED/urgent care encounters, interventions, laboratory values, or follow-up visits for patients at these institutions may not be represented. Pharmacist interventions within the TOC clinic were collected through retrospective chart review, which relied largely on consistent documentation; therefore, additional interventions could have been made during TOC appointments that were not accounted for. Although financial implications were not addressed in this study, cost savings continues to be an opportunity for TOC clinics and has been demonstrated as a significant benefit in numerous studies.19,20 Naylor et al 20 examined the effectiveness of a TOC intervention delivered by advanced practice nurses and found that intervention group patients had statistically significant fewer readmissions and lower mean total costs. The net result was a 37.6% reduction in total costs over the 12-month study period. 15 These studies support the use of TOC programs in reducing burdensome health care costs.
This pharmacist-managed TOC clinic model is translatable both internally and externally to other institutions to create new TOC services aimed at improving outcomes for patients with diabetes. This model can even be modified to support the implementation of new pharmacist-managed TOC services that target other chronic diseases states with increased hospitalization risk, such as heart failure, COPD, and so on. Institutions can also use these data to modify or support the ambulatory care pharmacist’s scope of practice, given that the pharmacist in this study showed opportunities for independent medication management, diabetes technology evaluation and education, secondary diabetes risk factor prevention, immunization screening, addressing medication access, and collaborating with other health care professionals. This service was successful in supporting patients through the postdischarge transition into the ambulatory environment when looking at a clinical indicator like A1C and patient retention, both of which are key metrics for health care institutions.
Conclusion
This study identified that patients in the TOC cohort had similar 30-day and 90-day readmission rates compared to the non-TOC cohort. However, there was a significant difference in the first A1C after discharge and time to follow-up between the TOC and non-TOC cohorts. This study highlights that a pharmacist-managed diabetes TOC clinic may be an accessible and effective method for patients to improve long-term diabetes outcomes following a hospitalization.
Supplemental Material
sj-docx-1-tde-10.1177_26350106231221463 – Supplemental material for Evaluation of a Pharmacist-Managed Diabetes Transitions of Care Medication Management Clinic
Supplemental material, sj-docx-1-tde-10.1177_26350106231221463 for Evaluation of a Pharmacist-Managed Diabetes Transitions of Care Medication Management Clinic by Hayley M. Hall, Kadin C. Ashley, Aric D. Schadler and Kristina W. Naseman in The Science of Diabetes Self-Management and Care
Footnotes
Acknowledgements
The authors acknowledge the University of Kentucky Center for Clinical and Translational Science (CCTS) and the support received by CCTS from the National Institutes of Health through Grant UL1TR001998. The authors also acknowledge Emma F. Hughes, PharmD Candidate, and Connor M. Risner, PharmD Candidate, for their contributions with data collection.
Authors’ Note
This study was presented at the Vizient Pharmacy Network Meeting Resident Poster Session on December 3, 2022, and the Kentucky Society of Health-Systems Pharmacists on March 10, 2023.
Author Contributions
Disclosure
The authors declare no relevant conflicts of interest or financial relationships.
Funding Support
The UK Center for Clinical and Translational Sciences received funding support from the National Institutes of Health through Grant UL1TR001998.
Supplemental Material
Supplemental material for this article is available online.
References
Supplementary Material
Please find the following supplemental material available below.
For Open Access articles published under a Creative Commons License, all supplemental material carries the same license as the article it is associated with.
For non-Open Access articles published, all supplemental material carries a non-exclusive license, and permission requests for re-use of supplemental material or any part of supplemental material shall be sent directly to the copyright owner as specified in the copyright notice associated with the article.