
Abstract
With the continuous advancement of numerical simulation technologies, computational modeling has become an effective approach for analyzing the laser sintering process, enabling a deeper understanding of the sintering mechanism and prediction of forming results. However, existing LS numerical simulation models still have certain limitations. The representation and implementation of heat source models are often oversimplified, and the correspondence between actual equipment conditions—particularly the response time characteristics of control components—and simulation settings is frequently neglected. Such simplifications can lead to significant discrepancies between simulation and experimental results, thereby affecting process optimization and mechanism studies based on numerical modeling. To address these issues, this study systematically investigates the heat source loading characteristics in the LS numerical simulation process. Four commonly used heat source models, Gaussian surface, Gaussian volumetric, Goldak’s, and semi-ellipsoidal, were analyzed in combination with single-layer laser sintering experiments. Meanwhile, the influences of laser response time, galvanometer response time, and scanning interpolation delay on the temperature field distribution were considered. The results indicate that simulations using the Goldak’s heat source model yield temperature fields that more closely match the actual sintering process. Furthermore, the three parameters, laser and galvanometer response times, together with interpolation delay, have a significant impact on the simulation accuracy and temperature field distribution. These parameters should therefore be regarded as essential input factors in LS numerical simulations to achieve higher prediction accuracy and better physical fidelity.
Introduction
Laser sintering (LS), as an important branch of additive manufacturing (AM) technology,1,2 has long been a major focus of research in the field of materials processing.3–5 The LS process involves phase transformations that occur at micro-scale dimensions and within short time periods, where the dynamic evolution of the laser melt pool plays a crucial role. Due to the transient and localized nature of this process, direct experimental observation and analysis remain challenging. With the rapid advancement of computational technologies, numerical simulation has become an essential tool for studying the forming mechanisms6,7 and thermo-physical behaviors8–10 of LS processes, offering an efficient and low-cost alternative to experimental investigation.
At present, extensive numerical studies have been conducted on LS processes, covering a wide range of aspects such as heat source modeling, boundary conditions, phase transformation, and melt pool evolution. Yueqiang et al.11–13 numerically investigated the dynamic evolution of the melt pool during LS; Osmanlic et al. 14 developed an energy absorption model describing the laser–material interaction; and Lorin et al. 15 proposed a laser heat source model suitable for keyhole-mode welding. However, most of these studies idealized the laser motion and energy input, without adequately accounting for the temporal response characteristics of the laser and scanning systems. This simplification may limit the accuracy of numerical predictions.
In studies on laser powder bed fusion (LPBF) of metals, previous work has demonstrated that the selection of heat source models and their corresponding energy distribution forms can significantly influence melt pool morphology, thermal gradients, and overall simulation accuracy. For example, Ebrahimi et al.16,17 and Kim et al. 18 reported that the formulation of the heat source and the associated loading strategy are critical factors governing the fidelity of thermal field predictions. However, these investigations were primarily conducted on metallic systems, whose thermal and optical properties differ substantially from those of polymers or composite powders. Therefore, it is necessary to further examine the applicability of various heat source models within the context of laser sintering, particularly for predicting the thermal behavior of polymer-based or composite powder beds.
For composite powder systems such as the walnut shell/Co-PES material used in this study, the internal structure typically exhibits compositional heterogeneity, diverse heat conduction pathways, potential interfacial thermal resistance between constituents, and thermal degradation of the biomass component under laser irradiation. These characteristics imply that the thermal response of composite powders during laser sintering may differ from that of single-component polymer powders. However, most existing numerical studies on laser sintering still rely on the assumption of a homogeneous powder bed, with limited discussion of how the distinct thermal properties of composite powders influence the evolution of the temperature field. Therefore, a brief overview of the thermal characteristics of composite powders helps clarify the limitations associated with the homogenized modeling approach adopted in this work and provides a basis for future developments toward more detailed composite material modeling.
In practical LS processes, the energy input of the laser is jointly influenced by several optical components, including the laser source, scanning galvanometer, and dynamic focusing system, each of which has an inherent response time 19 Prashant K et al. 20 investigated the effect of exposure delay between adjacent scan lines and points on the mechanical strength of sintered parts, demonstrating that the response time of system components can significantly influence the part quality. Hence, the response characteristics of optical and control components should be considered in numerical modeling. Nevertheless, most existing simulations assume instantaneous system response, ignoring the effects of laser on/off delay and galvanometer motion lag. Such neglect can lead to significant deviations in the predicted temperature field, thereby reducing the reliability of melt pool analysis and the overall simulation accuracy.
In addition, a walnut shell/Co-PES composite powder was selected as the sintering material. This bio-based thermoplastic composite combines the renewability, low density, and processability of natural fillers with the structural stability of engineering polymers. Its low thermal conductivity and complex thermal decomposition behavior make it an ideal material for studying the heat transfer characteristics and validating the accuracy of various heat source models in laser sintering. Therefore, this material serves as a representative system for examining the applicability of different heat source models in multi-phase composite sintering and provides a basis for future research on bio-based composite powders for additive manufacturing.
In summary, the response time of the laser control system may significantly affect the accuracy of numerical simulations in the laser sintering process, while the degree to which this factor can be neglected remains unclear. Based on this motivation, this study incorporates the actual response characteristics of the laser system to analyze four representative heat source models from the perspective of laser energy input. The effects of neglecting laser on/off delay and scanning-path lag on the temperature field distribution and thermal behavior are systematically investigated, providing valuable insight for improving the predictive accuracy of laser sintering simulations.
Basic theoretical equation
Mathematical description of heat source model
Mathematical equations of four commonly used heat source models.


Energy distribution diagram of heat source: (a) Gauss surface heat source, (b) Gauss volumetric heat source, (c) semi-ellipsoid volumetric heat source, and (d) Goldak’s volumetric heat source.
In these models, Q (x, y, z) represents the spatial power density distribution of the input energy. The main parameters are defined as follows: Q: laser input power, W; η: laser absorption efficiency, dimensionless; R0: laser spot radius on the powder bed surface, mm; ,,: characteristic dimensions of the heat source model, mm.
These parameters determine the energy distribution profile of each heat source model, thereby influencing the calculated temperature field, melt pool geometry, and overall accuracy of the thermal simulation.
Heat source analysis time description
In the numerical simulation of LS, accurately describing the temporal relationship between laser energy input and the positional evolution of the heat source is essential for ensuring the validity of the model. For a moving heat source, the load distribution can be expressed by introducing the temporal dependence of its spatial offset, as given in equation (1)
9
:
In equation (1), Vx and Vy represent the moving velocities of the heat source along the x- and y-directions, respectively. By introducing the time variable t, a time-dependent moving heat source model can be established. However, in practical LS processes, both the laser emission and galvanometer scanning exhibit inherent response delays. Specifically, a laser response time
The laser response time
In addition, the numerical control (NC) system introduces an interpolation delay
Under high scanning speeds, where the laser spot size is small and the local sintering duration is on the microsecond scale, neglecting these response and interpolation delays can significantly reduce the temporal accuracy of the simulated energy input. This in turn leads to deviations in peak temperature prediction and amplification of local thermal gradients, thereby compromising the agreement between simulation and experimental results.
To account for these effects, the present model incorporates three time-dependent parameters, Parameter relationship of actual LS printing process: (a) Relationship between galvanometer speed and laser response time and (b) corresponding to Vx = 2 m/s displacement.
In the simulation process, the energy input, represented by the laser power source term (Q), is treated as a time-dependent function (Q (t)). When considering the temporal response of the laser, the transition from laser activation to stable output within the interval (0∼
Similarly, the scanning velocity is also not constant but expressed as a time-dependent function (Vx (t)). To account for the galvanometer response, the initial acceleration of the laser spot up to its steady scanning velocity within (0∼
To make the influence of (
Experimental and assumptions
This study employed the heat transfer in Solids module of COMSOL Multiphysics to perform finite element transient thermal analysis of the LS process. To balance computational accuracy and efficiency, the following assumptions were made in the modeling process: 1. The non-uniform energy distribution and geometric irregularity of the laser spot were neglected. 2. The temperature-dependent relationships of density and thermal conductivity were approximated using a quadratic polynomial based on five measurement points, and the fitting errors introduced by this method were ignored. 3. The experimental measurement errors of latent heat during phase transition were neglected. 4. In this study, walnut shell/Co-PES composite powder was employed as the experimental material. The proposed modeling approach for the laser scanning system response time is theoretically generalizable; however, the material-specific physical parameters in the model, such as the absorptivity (η), are material-dependent. Consequently, the absolute temperature values predicted by the simulation are contingent on the material system used. Considering the strong absorption of CO2 laser radiation (10.6 μm) in polymeric materials,
24
the objective of this work is to elucidate the influence of the laser scanning system response time on energy input and the transient evolution of the temperature field, rather than to construct a comprehensive material database. Accordingly, the walnut shell/Co-PES composite powder employed here can reasonably be regarded as a highly absorptive system, and an absorptivity of η = 0.9 was adopted.
Basic parameters of walnut shell/Co-PES composite powder in numerical simulation.

All numerical simulations were carried out using COMSOL’s transient solver. The model dimensions were 10 × 1 × 0.5 mm, and the simulated time range was 0–4500 μs. To ensure computational precision, the mesh element size was set to 0.04 mm, and both the time step and the time-step tolerance were set to 0.01 μs. The laser heat source was applied according to the power density distribution equations of the four heat source models described previously. Convective heat transfer to air was applied to the top surface, while all other boundaries were assumed to be adiabatic to enhance numerical stability and solver convergence.
The above simulation settings are established within the framework of the single-track analysis conducted in this study. In our model, the simulation domain dimensions 1 mm in depth and 0.5 mm in height exceed 2.5 times the effective melt pool size. Therefore, these boundary and loading assumptions are considered appropriate and valid for the present simulation scope.
The sintering experiments were conducted on a CX_B200 laser sintering system (Harbin Free Manufacturing Technology Development Co., Ltd). Temperature data were collected using a Fluke infrared thermal imager, and the configuration of the experimental setup and temperature measurement devices is illustrated in Figure 3. Schematic diagram of experimental equipment and materials.
Since the emissivity of the material significantly affects the accuracy of infrared thermography, a K-type thermocouple was used to calibrate the temperature measurements on the powder bed surface. The calibration results indicated that at a detection distance of 0.6 m, the material emissivity was 0.94. The calibration procedure was based on the coordinate system of the forming chamber, which has dimensions of 220 × 220 mm. The chamber center was defined as the coordinate origin, with the powder-spreading direction as the positive Y-axis and the laser scanning direction as the positive X-axis. Thermocouples used for temperature calibration were positioned at (x1 = 100 mm, y1 = −100 mm) and (x2 = 100 mm, y2 = 100 mm).
Because the numerical model in this study accounts for the timing relationship between laser activation/deactivation and laser spot motion, Figure 4 illustrates the correspondence between the laser response timing and the scanning path for clarity. Correspondence diagram between the response processes of laser and galvanometer and the sintering process.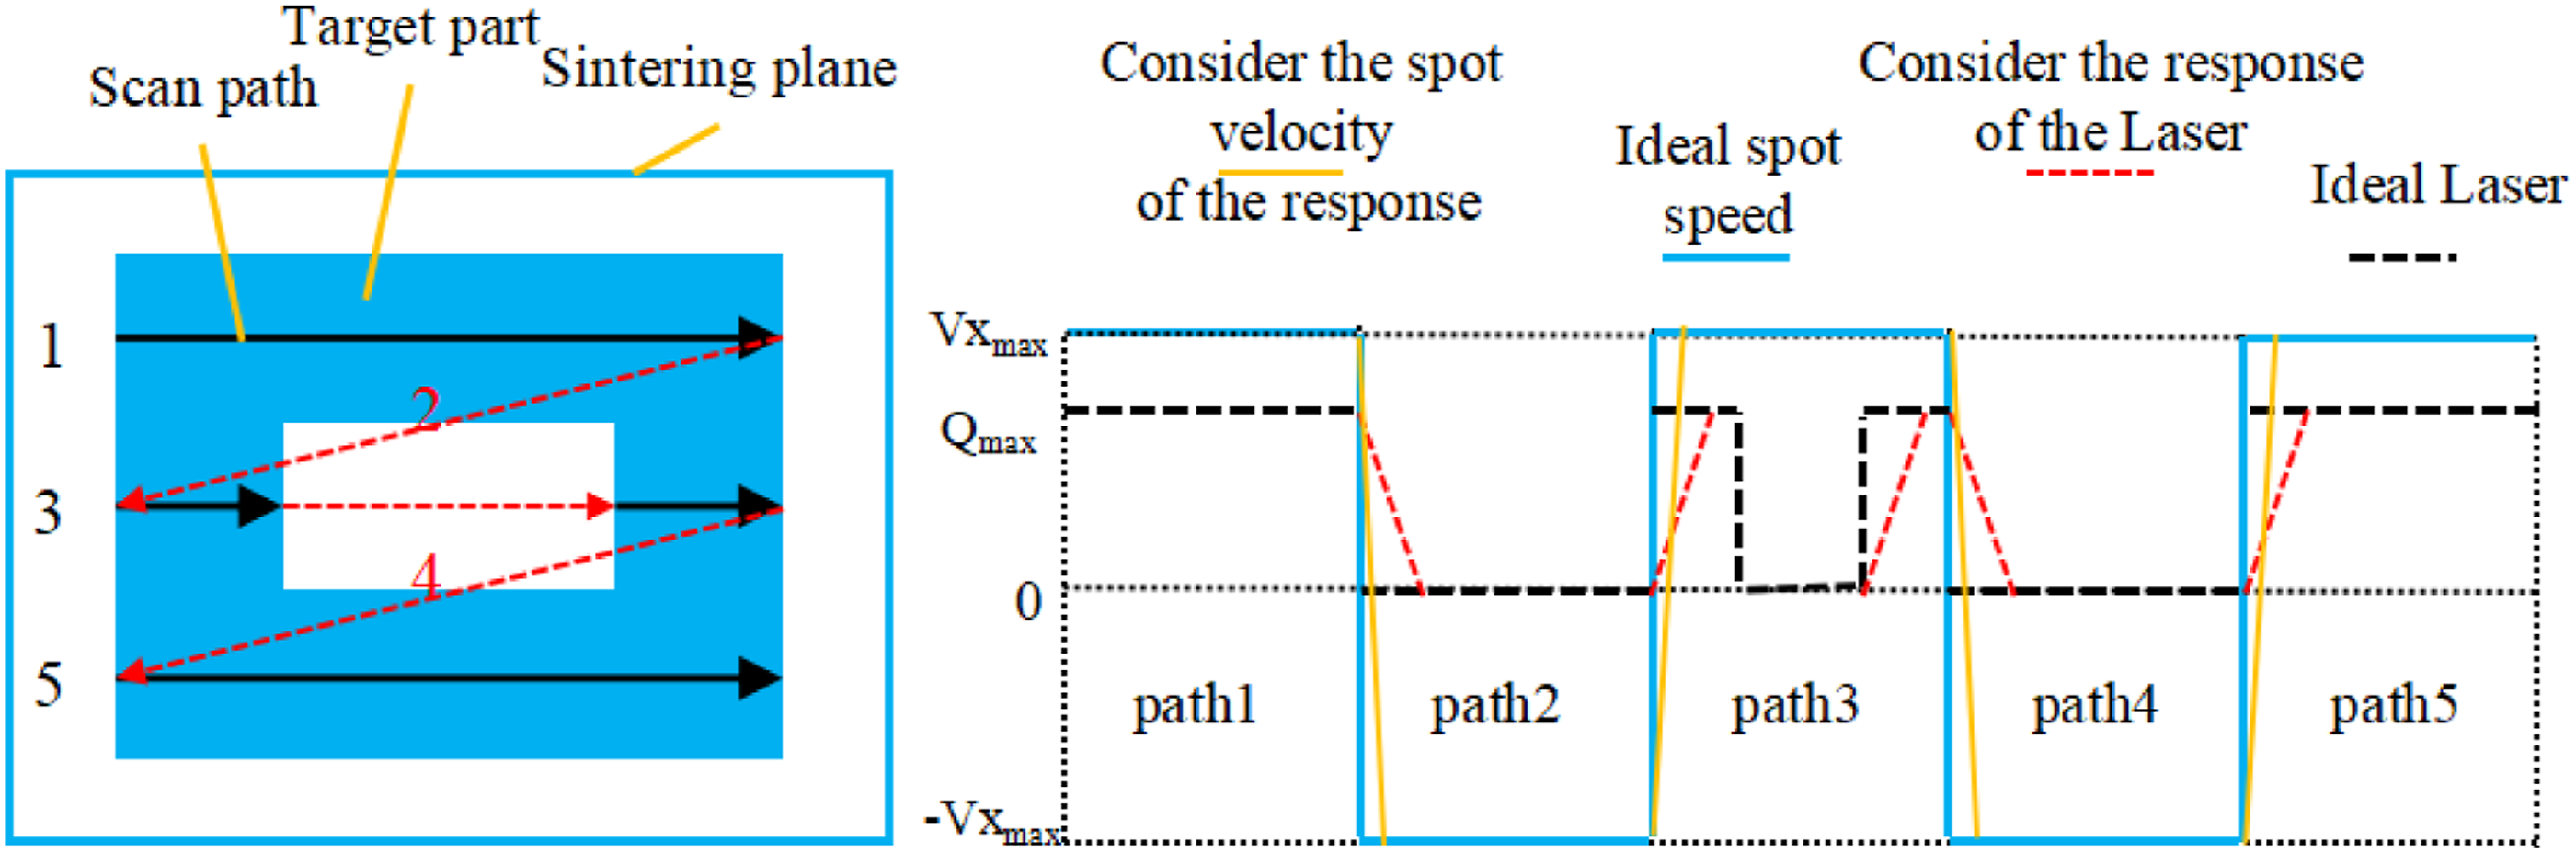
Results and discussion
Numerical simulation analysis of the effect of heat source in LS
The numerical simulation results obtained under the four heat source models and their corresponding combinations are shown in Figure 5, while the experimental results of single-layer laser sintering are presented in Figure 6. All simulations were conducted under identical solver settings, time steps, and mesh configurations to ensure comparability among different models. Surface results of geometric model for numerical simulation analysis with constant laser response and velocity: (a) Analysis results of Ellipsoid volumetric heat source, (b) analysis results of Goldak’s volumetric heat source, (c) analysis results of Gauss volumetric heat source, (d) analysis results of Gauss surface heat source, (e) temperature comparison curves of four laser heat source paths, and (f) temperature comparison curves of three laser volume heat source paths. Experimental results of single-layer sintering experiment. (a) Measurement results of infrared thermal imager. (b) Temperature Curve of the central path on the surface of a part. (c) Relationship between the laser scanning path and the inspection path.

As shown in Figure 5, the surface temperature predicted by the Gaussian surface heat source model is significantly higher than those obtained from the three volumetric heat source models. This occurs because the Gaussian surface heat source defines energy input as a surface heat flux distribution. Given the low thermal conductivity of polymer powders, most of the absorbed energy remains near the surface with limited penetration into the interior. In contrast, during the actual laser sintering process, the laser beam exhibits a finite penetration depth and focal range, meaning that such excessively high surface temperature peaks do not occur in practice.
As shown in Figure 6, the maximum temperature of the laser spot during the sintering process is approximately 198.1°C. The temperature fluctuations observed in Figure 6(b) mainly result from a slight misalignment between the measurement path and the actual laser scanning trajectory. The laser spot scans alternately on both sides of the detection path (see Figure 6(c)), leading to a locally non-smooth temperature curve. It is worth noting that the peak temperature predicted by the Goldak’s model (201°C) differs from the infrared measurement (198.1°C) by 2.9°C, corresponding to a relative error of about 1.5%. This minor deviation can be attributed to the difference between the assumed natural convection coefficient and the actual boundary conditions, as well as to inherent fluctuations in the laser power output during the experiment.
Further examination of Figure 5 reveals that the semi-ellipsoidal and Goldak’s heat sources exhibit similar temperature variation trends, whereas the Gaussian volumetric heat source produces much larger temperature fluctuations. This difference arises because the first two models have a relatively uniform energy distribution, while the Gaussian volumetric heat source concentrates energy at the beam center. When temporal response effects or scanning delays are present, the concentrated energy leads to higher instantaneous heat accumulation and a sharper temperature rise.
To further verify these differences, the energy distributions along the central cross-section of the Gaussian and semi-ellipsoidal heat sources were analyzed, as shown in Figure 7. The Gaussian model shows a strong energy concentration near the center and a weak energy gradient along the Z-direction. Considering that the polymer powder used in laser sintering has limited optical penetration, the actual energy should attenuate progressively from top to bottom. Therefore, the Gaussian volumetric heat source does not accurately represent the real energy deposition characteristics of the LS process. Comparison of energy distributions in the central cross-section between Gaussian volumetric heat source and double-ellipsoidal heat source. (a) Goldak’s volumetric heat source and (b) Gauss volumetric heat source.
In summary, the Gaussian surface heat source model is unsuitable for high-fidelity simulation of laser sintering. Volumetric heat source models better reflect the actual energy transfer characteristics of the process, among which Goldak’s volumetric heat source provides the best agreement with experimental observations. From a macroscopic perspective, under temporal response effects, the Gaussian volumetric heat source exhibits the highest sensitivity to delay variations, while the Goldak’s and semi-ellipsoidal heat sources show lower and nearly identical sensitivity.
It is worth noting that the strong sensitivity of the Gaussian volumetric model to temporal response delays is a physically predictable outcome. Owing to its highly concentrated energy distribution, this model produces steep local thermal gradients; consequently, any transient perturbation in the energy input (such as a delay in laser or scanner response) is significantly amplified, resulting in larger temperature fluctuations compared with the other volumetric heat source models.
However, this high sensitivity does not imply that the Gaussian volumetric model should be excluded from transient simulations. Instead, it indicates that this model is more suitable for studying the amplification behavior of transient energy disturbances. For reproducing the realistic attenuation of laser energy in polymer powder beds and achieving accurate temperature field predictions, the Goldak’s volumetric heat source provides a better physical match. Therefore, the selection of an appropriate heat source model should not rely solely on its sensitivity to temporal delays, but rather on whether its spatial energy distribution reflects the actual physical process.
Analysis of the impact characteristics of response time
In practical laser sintering processes, the response time of the laser control system exerts a significant influence on the evolution of the temperature field. The motion response time of the scanning galvanometer determines the acceleration behavior of the laser spot from rest to high-speed motion, thereby directly affecting the spatial temperature distribution along the scan path. Meanwhile, the laser excitation response time governs the rise and decay rate of the laser power, influencing the temporal pattern of energy input. The combined effects of these two response delays substantially alter the transient temperature variation along the laser scanning trajectory.
To investigate the influence of response time on the temperature field, simulations were conducted under identical baseline parameters while incorporating both the laser response and the scanning velocity response through the coupling parameter Temperature results at different times under constant speed: (a1) Analysis results of Ellipsoid volumetric heat source. (b1) Analysis results of Goldak’s volumetric heat source. (c1) Analysis results of Gauss volumetric heat source. (d1) Simulation results of laser scanning paths for three types of heat source models. Temperature results considering the laser response time at a constant speed: (a1) Analysis results of Ellipsoid volumetric heat source. (b1) Analysis results of Goldak’s volumetric heat source. (c1) Analysis results of Gauss volumetric heat source. (d1) Simulation results of laser scanning paths for three types of heat source models. The temperature results considering the speed response time and the laser response time: (a1) Analysis results of Ellipsoid volumetric heat source. (b1) Analysis results of Goldak’s volumetric heat source. (c1) Analysis results of Gauss volumetric heat source. (d1) Simulation results of laser scanning paths for three types of heat source models.

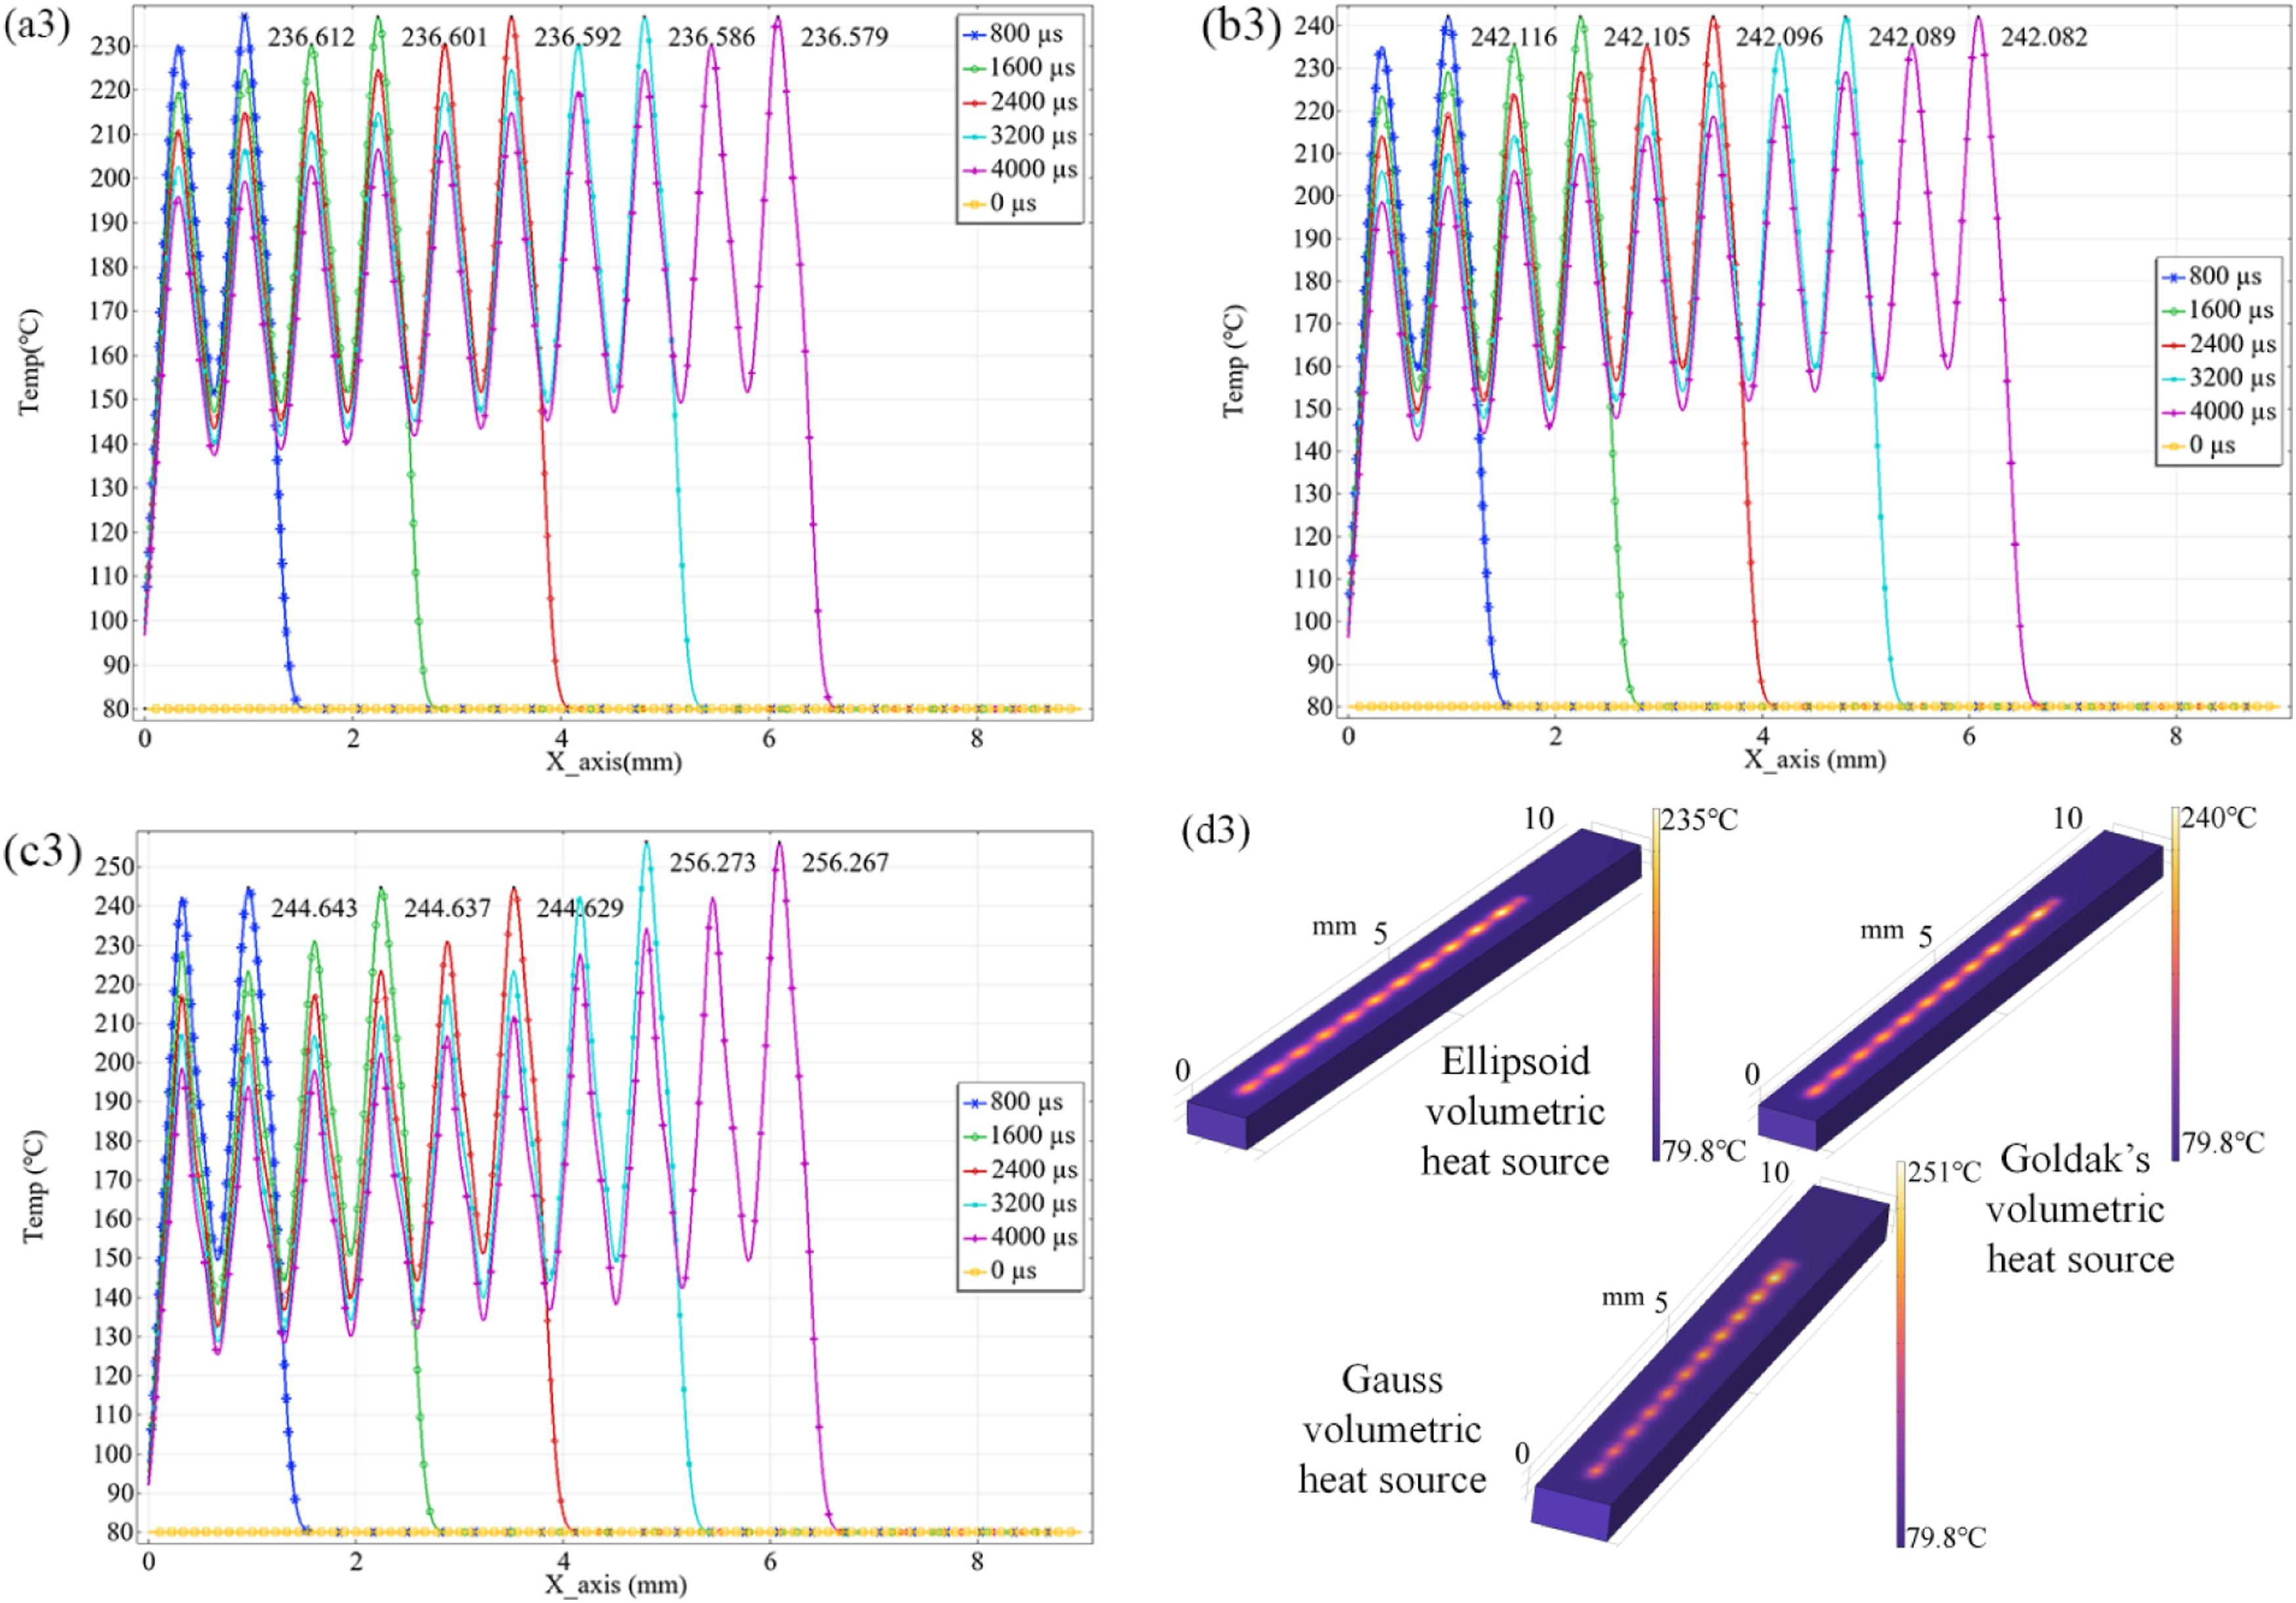
As illustrated in Figure 8, under constant scanning velocity and continuous laser emission, the surface temperature of the powder bed remains relatively uniform and stable. For all three volumetric heat source models, the previously sintered regions exhibit slightly lower temperatures due to convective heat dissipation, and the overall temperature variation is continuous. Because the Gaussian volumetric heat source features a more concentrated energy distribution, the temperature rise near the laser spot occurs more rapidly and reaches higher peak values than those predicted by the semi-ellipsoidal and Goldak’s volumetric heat source models.
In Figure 9, where the laser excitation response is included, the temperature curve exhibits pronounced periodic attenuation. During the laser-off phase, a rapid temperature drop occurs—primarily caused by the latent heat of phase change and the thermal gradient between the sintered and surrounding regions. When the laser is switched on, the temperature rises sharply; however, the delayed laser activation results in reduced cumulative energy input, leading to a lower peak temperature than that observed in Figure 8.
A comparison of Figures 8 and 9 shows that incorporating the laser response time does not change the overall trend of temperature evolution but intensifies the thermal fluctuations. This behavior aligns well with the experimental temperature variations captured by the infrared thermography in Figure 6(b). In real LS processes, frequent switching between sintered and unsintered regions requires repeated laser on/off transitions. Neglecting the activation and deactivation delays can lead to temperature non-uniformity within the sintered region, thereby compromising part stability and densification.
Further comparison between Figures 8 and 10 reveals that when both the laser response time and the galvanometer motion response are considered simultaneously, temperature fluctuations become more pronounced. The superposition of these two delay effects introduces nonlinear transient behavior: when the laser is turned off but the beam continues to move, energy input and heat conduction become asynchronous, resulting in localized cooling; conversely, when the laser remains on while the beam slows down or pauses, localized energy accumulation occurs, producing transient temperature peaks. These interactions cause nonlinear oscillations in transient energy input, representing thermal coupling in the time domain, rather than interference phenomena in the wave sense.
In practical process control, the Simulation results of delay parameters on the scan path: (a) Increase 
As observed in Figure 11(a), different combinations of response times produce distinct temperature fluctuation behaviors. Increasing the activation delay
In summary, for numerical simulations that aim to accurately represent real LS conditions, it is essential to consider both the laser excitation response and the scanning motion response. While their combined effects introduce significant temperature fluctuations, appropriate adjustment of the activation delay and its cycle can effectively smooth temperature variations, resulting in simulation outcomes that more closely reflect actual laser control behavior.
Conclusion
This study systematically investigated the effects of different heat source models and system response times on the temperature field prediction accuracy during the LS process through combined numerical simulations and experimental validation. The main conclusions are as follows: 1. The Gaussian surface heat source model is not suitable for numerical simulations of the LS process. Its surface-based energy distribution causes excessive heat concentration at the powder bed surface, resulting in simulated temperatures significantly higher than experimental values and failing to capture realistic heat transfer behavior. 2. Volumetric heat source models better represent the actual energy input characteristics of the LS process. Among them, the Goldak’s heat source model exhibits the highest consistency with experimental results, with a maximum temperature deviation of only 2.9°C (approximately 1.5%) from the infrared thermography measurements, demonstrating its suitability for modeling multi-phase composite powder sintering. 3. Under identical laser power and scanning parameters, the predicted surface temperatures follow a consistent trend among volumetric models: Gaussian volumetric > Goldak’s > semi-ellipsoidal. This hierarchy reflects the degree of energy concentration within the modeled volume. 4. Response time effects play a critical role in transient thermal behavior during laser sintering. Incorporating the laser response time (
Proper tuning of the laser activation delay (
Challenges and perspectives
In this study, a single-track laser sintering numerical model was developed under the continuum assumption, with a particular focus on elucidating the influence of laser response time on energy input and temperature field distribution. Future work will extend the analysis to multi-track, multi-layer, and multi-cycle conditions, while also incorporating the thermal interaction between the fabricated part and the surrounding environment. These efforts aim to evaluate the cumulative effects of response-time-induced thermal fluctuations during practical manufacturing and to assess their applicability under more complex scanning strategies.
In addition, the thermal fluctuations identified in this work may influence solidification rates, microstructure distribution, and residual stress evolution. Although these effects were not directly modeled, the perturbed thermal history provides a physical pathway for microstructure and stress development. Future studies may couple the present thermal predictions with microstructure or thermo-mechanical models to explore the potential links among response time, thermal fluctuation, microstructure evolution, residual stress, and final part performance.
Footnotes
Funding
The authors disclosed receipt of the following financial support for the research, authorship, and/or publication of this article: Supported by the Fundamental Research Funds for the Central Universities (2572022AW50), National Natural Science Foundation of China (52375314), and Key Research and Development Program of Heilongjiang (GA21A403).
Declaration of conflicting interests
The authors declare the following financial interests/personal relationships which may be considered as potential competing interests: Jiaming Dai reports financial support was provided by Fundamental Research Funds for the Central Universities. Yanling Guo reports financial support was provided by National Natural Science Foundation of China. Yanling Guo reports financial support was provided by Key Research and Development Program of Heilongjiang.